

Introduction
Knowledge of population sizes and trends are central to the effective conservation and management of threatened species (Bennun Reference Bennun2000, Mace et al. Reference Mace, Collar, Gaston, Hilton-Taylor, Akçakaya, Leader-Williams, Milner-Gulland and Stuart2008, Bonebrake et al. Reference Bonebrake, Christensen, Boggs and Ehrlich2010). However, these basic parameters are often difficult to obtain, particularly for low-density and wide-ranging species. Birds are among the most mobile of organisms, and their dispersal ability and often structured populations add to the difficulty of accurate population size estimation (Bildstein Reference Bildstein2011).
Ludwig’s Bustard Neotis ludwigii is a large (2.2–6.0 kg) and wide-ranging bird endemic to the arid south-western region of Africa, where it is thought to be both partially migrant and nomadic in response to rainfall (Allan Reference Allan, R Hockey, Dean and Ryan2005). Unfortunately, this bird is extremely susceptible to collisions with overhead power lines, and the very high observed mortality rates are of great concern (Jenkins et al. Reference Jenkins, Shaw, Smallie, Gibbons, Visagie and Ryan2011, Shaw Reference Shaw2013). Monitoring in the eastern Nama Karoo in the late 1990s and extrapolation of power line collision rates with best-guess demographic parameters suggested that the Ludwig’s Bustard population could be decreasing (Anderson Reference Anderson and Barnes2000, Jenkins et al. Reference Jenkins, Shaw, Smallie, Gibbons, Visagie and Ryan2011). The species was therefore listed as globally ‘Endangered’ in 2010 on the basis of potentially unsustainable collision mortality, exacerbated by the lack of effective mitigation and the rapidly expanding power grid (BirdLife International 2012). The IUCN Red List is precautionary, with the uplisting of Ludwig’s Bustard recognising the potentially serious but uncertain effects of this unnatural mortality, and highlighting the urgent need for further research (Mace et al. Reference Mace, Collar, Gaston, Hilton-Taylor, Akçakaya, Leader-Williams, Milner-Gulland and Stuart2008).
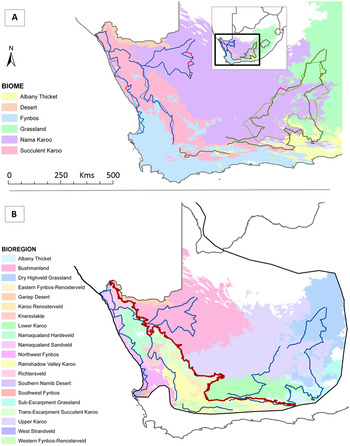
Clearly, a priority for Ludwig’s Bustard is to gain a better understanding of actual population trends. However, it is a difficult bird to study as it is mobile, cryptic, susceptible to disturbance when breeding, and inhabits vast and remote areas, so little is known of life history parameters such as breeding success and longevity (Allan Reference Allan, R Hockey, Dean and Ryan2005). In South Africa, Ludwig’s Bustard is found in the Karoo, an extensive region which covers approximately the western-central third of the country (some 359,000 km2). The Karoo landscape is semi-arid, relatively flat and treeless, characterised by short, shrubby vegetation. There is little surface water, and the main land use is extensive sheep farming. The Karoo comprises two biomes, with the winter-rainfall Succulent Karoo to the west and the increasingly grassy regions of the summer-rainfall Nama Karoo further east (Dean and Milton Reference Dean and Milton1999, Esler et al. Reference Esler, Milton and Dean2006; Figure 1A). In addition to significant expansion of the power grid, Ludwig’s Bustard and other Karoo birds are also threatened by the establishment of wind farms, the possibility of fracking and the effects of climate change (Shaw Reference Shaw2013). Current bird monitoring systems in South Africa (e.g. the Southern African Bird Atlas Projects SABAP 1 and 2) and the Coordinated Avifaunal Roadcount [CAR] project) are of limited use in understanding Ludwig’s Bustard population trends because few data are collected in this sparsely populated region (Hofmeyr Reference Hofmeyr2012). Dedicated census counts thus provide the best way to generate the necessary population data. Fortunately, there are historical count data available from 1988–1989 (Allan Reference Allan1994), when extensive road censuses and an aerial survey were conducted throughout the Karoo, and analysed together with SABAP 1 data and landowner observations to estimate the population sizes of Ludwig’s Bustard and other large Karoo birds. Allan (Reference Allan1994) estimated the entire population at 56,000–81,000 individuals, of which 50–75% were thought to occur in South Africa (Anderson Reference Anderson and Barnes2000). Allan (Reference Allan1994) also inferred a seasonal migration of Ludwig’s Bustards to the Succulent Karoo in winter (which has subsequently been supported by satellite tracking data; Shaw Reference Shaw2013), but failed to detect a corresponding decline in the Nama Karoo. He suggested that possible reasons for this included that the bird is a partial migrant, the proportion moving is relatively small, above average rainfall in the Nama Karoo at the time of the counts meant fewer birds moved, and bustards are generally harder to see in the summer (especially in the Nama Karoo, where summer grass growth might mask a winter decrease in bustard density).
Maps of bird census routes. A. South African biomes (Mucina and Rutherford Reference Mucina and Rutherford2006), with the western road count route (solid dark blue line) and eastern road count route (solid dark green line) followed on census counts in 2010/2011, and corresponding aerial survey routes shown with dashed lines. The original 1980s road route (Allan Reference Allan1994) is shown in red where it differed from the current road routes. B. Bioregions used in the analysis of Ludwig’s Bustard population estimates, shown within the bustard’s approximate range in South Africa. Blue lines are routes covered on the 2010–2012 road counts; the red line separates the Succulent and Nama Karoo. Road counts passed through all the bioregions presented (= surveyed area for Distance analysis), and black lines indicate the approximate total range of Ludwig’s Bustard in South Africa (Harrison et al. Reference Harrison, Allan, Underhill, Herremans, Tree, Parker and Brown1997, SABAP 2 2012).
In this paper we repeat Allan’s (Reference Allan1994) road and aerial counts to assess population trends for Ludwig’s Bustard and other large terrestrial birds of the Karoo over the past two decades, and to seek evidence to support any of his theories regarding the apparently constant Nama Karoo population. As the census counts cover much of the range of Ludwig’s Bustard, we use distance sampling methods (Buckland et al. Reference Buckland, Anderson, Burnham, Laake, Borchers and Thomas2001) to estimate the South African population sizes in both time periods. We also assess the abundance of Ludwig’s Bustard across the Karoo in relation to season, rainfall and habitat.
Methods
We conducted an extensive census of large terrestrial birds in the Karoo, following as closely as possible the routes and methodology used for the original road and aerial counts in the late 1980s (described in detail in Allan Reference Allan1994) to ensure comparability of surveys. This methodology had been developed specifically for counting large birds in the Karoo environment. Our road counts followed two transects in the western and eastern Karoo four times over one year (2010/2011), with two aerial counts (Figure 1A). We refer to Allan’s (Reference Allan1994) original counts as the 1980s counts, and ours as the 2010s counts.
Road counts
As far as possible, we followed the original routes (western route of 2,404 km, eastern route of 2,452 km; Figure 1A), which were largely on minor (district) gravel roads. Where these were no longer accessible, we took the next closest road (most similar direction, distance and road type). As in the 1980s, the roads were driven at a constant speed of 50 km h-1 with the driver and one passenger searching throughout the day for large terrestrial birds (including all bustards, cranes, storks, and Secretarybirds Sagittarius serpentarius) on both sides of the vehicle. In the open Karoo environment, this speed is considered appropriate to maintain a very good sighting efficiency whilst allowing coverage of a wide geographical area. We did not count when passing through built-up areas, when visibility was poor in rain or fog, or in the first or last hour of daylight as birds flying to or from roosts may have been more visible and could have biased results. One observer was involved in all counts in the 1980s (DGA) and 2010s (JMS), ensuring consistency in methodology within count periods.
Consistent with the original methodology, the vehicle was stopped and the area scanned with binoculars when a bird was spotted. As far as possible the species, age and sex of the bird (and any others seen) were noted. Sexing of Ludwig’s Bustards was based largely on size (males are up to twice the size of females), proportions and plumage (males have broader and darker necks; Allan Reference Allan, R Hockey, Dean and Ryan2005). Details of activity, habitat the birds were in, habitat generally, and whether the road surface was tar or gravel (as a proxy for traffic volume) were also recorded. The position was logged with a Garmin 60 GPS, and a Bushnell Pinseeker 1500 laser rangefinder and compass were used to measure distance and sighting angle to the location of the bird from where it was first seen from the road. Where the road was not straight, the perpendicular distance was measured instead. On the 1980s counts, distance was estimated with an optical rangefinder or else paced out (D. Allan unpubl. data). Additionally, side of the road was noted for birds during the 2010s counts.
Four road counts were conducted in the 1980s; two in winter (July–August 1988, June–July 1989) and two in summer (November–December 1988, March 1989). We also did four main counts, with two in winter (May–July 2010, August–September 2010) and two in summer (November–December 2010, March–April 2011). For logistical reasons we were unable to replicate the count timing exactly, but our surveys fell into broadly the same seasons as in the original study; seasonality is not marked in the Karoo, so we considered these dates to be comparable. It was not possible to do the western aerial survey at the same time as the full winter road counts, so we also conducted an additional shorter road count (1,164 km) from 18 to 21 September 2012 which followed the western route from Velddrif to Kleinsee, Springbok and back to Karoopoort, sampling the same region surveyed from the air. General habitat types were recorded on the July–August 1988 survey (D. Allan unpubl. data), so we also collected habitat data (on the November–December 2010 survey), recording the predominant land use on each side of the road every 1 km.
Aerial counts
One aerial survey was conducted in the 1980s through the Succulent Karoo on 13 September 1989 (winter; Allan Reference Allan1994). We repeated this count on 13 October 2012, following the same route from the Berg River west of Piketberg to Vredendal, Kleinsee and Springbok, then back via Vanrhynsdorp, Nieuwoudtville and Karoopoort (Figure 1A). The 2012 survey covered 819 km, excluding a 50 km section of the planned route in the vicinity of Kotzesrus (30°57’S, 17°50’E), when counting had to be suspended because of low cloud. We also conducted a summer aerial count on 2–3 April 2011 covering 1,397 km through the Nama Karoo from Beaufort West to Willowmore, Somerset East, Graaff Reinet, Cradock, Burgersdorp, Bethulie and Edenburg, and back via Philippolis, Hanover and Richmond (Figure 1A).
Unlike the 1980s count, only low-winged aircraft were available for the 2011/2012 aerial surveys (a Mooney 201 on the western count, and a Piper Dakota on the eastern count). Counts were conducted with an observer in the front passenger seat counting on the right and an observer behind the pilot counting on the left. On the eastern count an additional passenger took notes, and on both counts the pilot helped to spot birds because the view of the left-side observer was partly obscured by the wing. Following the original methodology, the surveys were conducted at 100–120 knots at approximately 150 m above ground. Markers were placed on the wings to mark a 500 m strip on each side of the plane, and all birds within this strip were counted. While some individuals of other large birds were seen on the ground, Ludwig’s Bustards were usually only spotted as they flushed from the aircraft, when their white wing panels made them conspicuous. Circling over areas where groups of bustards congregated in winter suggests that most if not all Ludwig’s Bustards in the count area are flushed by the plane’s passage (i.e. no birds were flushed when passing over the same area for a second time).
Statistical analyses
All raw data from the 1980s census were available from DGA. Route and count data from the 1980s and 2010s were standardised using ArcGIS 10 (ESRI 2010). The 1980s count data were digitised on the basis of the 1:50,000 grid reference, odometer reading and farm name (from the cadastral boundaries layer of the South African Environmental Potential Atlas (ENPAT); DEAT 2001) recorded with each observation. As the exact boundaries of the biogeographical regions used in the analysis of the 1980s data (Allan Reference Allan1994) were no longer available, all data were recategorised using Mucina and Rutherford’s (Reference Mucina and Rutherford2006) bioregion classification.
Statistical analyses were generally performed using R (R Core Team 2012). We assumed that the driver and passenger were equally likely to see birds, and tested whether this was justified by comparing the number of sightings by species made on each side of the vehicle with χ2 goodness-of-fit tests. To compare observer efficiency in the 1980s and 2010s, we compared the number of birds counted (excluding flying birds) in 50–100 m-wide perpendicular distance bands from the road (number of bands depending on species), also with χ2 tests. During the 1980s surveys, sighting distances were only recorded on the last winter survey (June/July 1989), and the number of sightings was only great enough to compare three species (121 Ludwig’s Bustard sightings, 91 Karoo Korhaan Eupodotis vigorsii and 18 Blue Crane Anthropoides paradiseusi). These data were compared with our three winter counts (213 Ludwig’s Bustard sightings, 69 Karoo Korhaan and 43 Blue Crane). We also investigated group size and behaviour when first seen: flying, flushing, active on the ground (e.g. walking, foraging) or inactive on the ground (e.g. standing still, roosting) with χ2 tests and contingency table classifications.
Rainfall data from April 2010 to April 2011 and July–September 2012 were obtained from the South African Weather Service for each bioregion (SAWS unpubl. data). We assessed the effect of rainfall in the preceding months on the numbers of Ludwig’s Bustards per 100 km seen on road counts with Pearson’s product-moment correlation coefficients, Generalised Linear Models (GLMs) and Generalised Additive Models (GAMs; gam in library mgcv v1.7-18; Wood Reference Wood2006). We compared the total rainfall (averaged over the number of weather stations in each bioregion; range 1–8, mean = 3.4) preceding each count by one, two and three months to the count data overall, and for the Nama and Succulent Karoo separately. We also examined the patterns after log transforming both rainfall and the number of Ludwig’s Bustards seen.
We compared land use in the two time periods with χ2 tests after categorising the habitat data from both surveys in 1 km sections as either transformed land (mainly ploughed areas with seasonal crops, pasture or lying fallow) or natural vegetation (low-intensity rangelands known locally as natural veld). We compared habitat use of Ludwig’s Bustards between counts, and for bustards seen on the 2010s surveys when both transformed and natural habitats were available. To investigate the effect of road surface on the numbers of Ludwig’s Bustards seen we compared the average number of Ludwig’s Bustards seen per 100 km on tar and gravel by bioregion (where the survey included at least 10 km of each surface type) on the two main winter counts for the 1980s and 2010s. We used Wilcoxon signed-rank tests for this (test statistic W), and Mann-Whitney U-tests to test the effect of season on average group sizes, as the assumptions for t-tests were not met in either case (Zar Reference Zar2010).
Distance
We used the Conventional Distance Sampling engine in Distance 6.0 release 2 (Thomas et al. Reference Thomas, Laake, Rexstad, Strindberg, Marques, Buckland, Borchers, Anderson, Burnham, Burt, Hedley, Pollard, Bishop and Marques2009) to generate population estimates for Ludwig’s Bustard, and to assess the trend between the 1980s and 2010s censuses. We did not use this analysis for other species as detectability was probably not high enough for smaller species and our dataset did not meet the minimum of 60–80 detections (Buckland et al. Reference Buckland, Anderson, Burnham, Laake, Borchers and Thomas2001) or our surveys did not cover enough of the range to make population estimation meaningful for other large birds. We only used winter count data (1980s; one survey in June–July 1989, 2010s; three surveys in May–July 2010, August–September 2010, September 2012), because distances were only measured on one 1980s count. Also, winter was more representative of the Ludwig’s Bustard population because counts were higher when the birds were spread across their range at this time of year. There were too few data to use this method to estimate summer densities of Ludwig’s Bustards on the 2010s surveys (n = 10 detections in the Succulent Karoo, n = 37 in the Nama Karoo).
The main assumptions of Distance sampling are: objects on the transect line are detected with certainty, objects are detected at their initial location, measurements are exact, and detections are independent (Buckland et al. Reference Buckland, Anderson, Burnham, Laake, Borchers and Thomas2001). Ludwig’s Bustards on the line were indeed detected with certainty as these large birds are clear to see close to the road in such an open environment. The speed of the vehicle meant animals did not have time to move before detection, and distance measurements to the initial location of birds were reasonably accurate. As birds in a group are not independent observations, we defined each group of birds as an object, and then applied mean group sizes to the group density estimate. There were insufficient data to generate densities by bioregion, so for Ludwig’s Bustards we stratified density estimations by Nama and Succulent Karoo. This increased the precision and allowed comparison of densities and group sizes for each area (Thomas et al. Reference Thomas, Buckland, Rexstad, Laake, Strindberg, Hedley, Bishop, Marques and Burnham2010). We estimated population numbers for the bioregions within the range that were sampled on the road counts, and then for the whole South African range (Harrison et al. Reference Harrison, Allan, Underhill, Herremans, Tree, Parker and Brown1997, SABAP 2 2012; Figure 1B).
We converted all sighting distance estimates to perpendicular distances, and examined histograms of the count data separately for the 1980s and 2010s. We looked for evidence of assumption failures, and determined appropriate truncation points; 5–10% right truncation is recommended to remove outliers and to facilitate modelling (Buckland et al. Reference Buckland, Anderson, Burnham, Laake, Borchers and Thomas2001). There was some evidence of evasive movement from the road, so the data were grouped accordingly. We then fitted models using all combinations of suggested key functions and adjustment terms (uniform with cosine or simple polynomial, half-normal with cosine or Hermite polynomial and hazard-rate with cosine or simple polynomial), and assessed fit using χ2 goodness-of-fit, AIC values and by inspecting histograms, particularly near zero distance (Buckland et al. Reference Buckland, Anderson, Burnham, Laake, Borchers and Thomas2001, Burnham and Anderson Reference Burnham and Anderson2002). The best fitting detection functions used in density estimation are presented in Figure S1 in the online supplementary materials. Size bias was investigated (i.e. group size was not independent of distance, so may be underestimated at further distances, and/or proportionally fewer small groups were seen at further distances). There was little evidence for this, so we set the models to use the regression of log observed group size on detection probability to account for this where there was a relationship (P < 0.15), but otherwise to use the mean group size (Buckland et al. Reference Buckland, Anderson, Burnham, Laake, Borchers and Thomas2001). Empirical variance estimation requires >20 transects, so density variance was estimated by assuming observations followed a Poisson distribution, and with bootstrapping (999 replicates; Buckland et al. Reference Buckland, Anderson, Burnham, Laake, Borchers and Thomas2001). Splitting one transect into smaller units would result in pseudoreplication, so observations within each transect were resampled as sample sizes were large enough (minimum of 47) for the 1980s count, and for observations within transects for the 2010 counts. Group size and encounter rate were estimated at stratum level (Nama and Succulent Karoo). We tested whether separate detection functions were necessary for each Karoo type by comparing models with detection functions estimated globally (for the whole area) and by stratum (Buckland et al. Reference Buckland, Anderson, Burnham, Laake, Borchers and Thomas2001).
Allan (Reference Allan1994) assumed that all Ludwig’s Bustards were seen on aerial surveys as they flushed away from the aircraft, and therefore used this as a correction factor to calculate the actual density of birds seen on road counts. As we used Distance to estimate population sizes, we did not rely on this assumption. Instead, we used aerial counts to assess the suitability of road counts for censusing Ludwig’s Bustards, by comparing the density of birds estimated per 100 km2 by bioregion for each method. The area searched on road counts was calculated from the transect length multiplied by the effective search width (ESW), as estimated by Distance. We used correlation tests to compare results generated from both methods. For comparison of the western aerial and road count results, the section of the road count corresponding to the missed 50 km section on the aerial count was excluded. As the aerial surveys in the 1980s and 2010s were used for different analyses, the slight methodological differences are not important.
Results
Comparison of surveys
Most (94%) of the original road transect routes were accessible, and the length of transects covered in both time periods was similar (average of 4,856 km in 1980s vs 4,749 km in 2010s). The proportion of tar roads surveyed increased slightly, from 14% in the 1980s to 19% in the 2010s. Increases in road traffic over the last few decades did not appear to have affected bird proximity to roads, because perpendicular sighting distances for Ludwig’s Bustards in the 1980s (mean ± SE: 200 ± 17 m) were greater than in the 2010s (91 ± 5 m), although comparisons were limited to only one 1980s survey. Sighting distance also decreased slightly for Karoo Korhaans (1980s: 69 ± 5 m, 2010s: 49 ± 8 m) and Blue Cranes (1980s: 294 ± 42 m, 2010s: 215 ± 26 m). For Ludwig’s Bustards there was no difference between behaviour (χ2 = 3.61, df = 2, P = 0.16) or group size (χ2 = 2.16, df = 2, P = 0.34) of birds seen between counts, but during the one winter 1980s count when distances were estimated, Ludwig’s Bustards were detected significantly further away from the road (χ2 = 54.66, df = 5, P <0.001). In the 1980s, significantly more Karoo Korhaans were seen while they were inactive (χ2 = 32.73, df = 2, P < 0.001) and in pairs or threes (χ2 = 7.64, df = 2, P = 0.02), and also at greater distances (χ2 = 10.64, df = 2, P = 0.001). Activity (χ2 = 1.55, df = 2, P = 0.21), group size (χ2 = 0.38, df = 2, P = 0.83) and distance from the road (χ2 = 2.49, df = 3, P = 0.48) were similar in the 1980s and 2010s for Blue Cranes. Therefore, it seems that detection was better for more cryptic species during the 1980s surveys, which complicates comparison of the results. However, this effect is not certain as the 1980s sample is from only one survey, and distance measurements were likely to be less accurate (although not necessarily more biased) than the 2010s distances estimated with a laser rangefinder. In addition, the current count totals of more cryptic species such as Karoo Korhaan were not consistently lower than the 1980s counts (Table 1). We have therefore not attempted to adjust our count data as Distance density estimates account for the different search widths identified for Ludwig’s Bustard between survey periods.
Mean (± SE) number of large terrestrial birds seen per 100 km of road counts by biome and season (raw data), for the 1980s and 2010s counts. Numbers in bold indicate significant differences between the two count periods.

There was no difference between the number of sightings made on each side of the vehicle on the 2010s counts (total n = 633 sightings of eight species where side of the road was recorded; χ2 = 3.64, df = 7, P = 0.82), so the driver and passenger were equally likely to see birds.
Overall road count trends
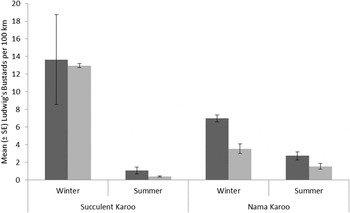
The overall numbers of Ludwig’s Bustards seen on the 1980s and 2010s road counts were similar (Fig. 2, Table 1), with a decline observed in the Nama Karoo between surveys. However, as highlighted previously, whether this relates to different observer efficiencies between surveys is unclear. In both time periods, Ludwig’s Bustards were abundant in the Succulent Karoo in winter and rarely seen in the summer (Fig. 2, Table 1). Despite the apparent movement out of the Succulent Karoo in summer, slightly more were seen in the Nama Karoo in winter than summer. As this pattern was also was detected for sedentary Karoo Korhaans in this biome (Table 1), this effect probably relates to reduced conspicuousness from higher and denser summer vegetation in this grassier biome, and/or more secretive behaviour while raising chicks (Allan Reference Allan1994).
Mean (± SE) number of Ludwig’s Bustards seen per 100 km of road counts by biome and season (raw data), with 1980s counts in dark grey and 2010s counts in light grey.
For other large terrestrial birds counted on road surveys (Table 1), the trends were variable. There was evidence of a decline in Karoo Korhaans in the Nama Karoo but not the Succulent Karoo. Numbers of Northern Black Korhaans Afrotis afraoides were comparable in the two time periods, but there has been a marked decrease in numbers of Southern Black Korhaans A. afra in the Succulent Karoo. Likewise, far fewer Blue Korhaans Eupodotis caerulescens were seen on the 2010s counts. Kori Bustards Ardeotis kori and Secretarybirds were relatively scarce overall, with no clear population trends between the counts. Considerably more Blue Cranes were seen on the current count in the Nama Karoo, compared with the 1980s (Table 1).
Ludwig’s Bustards
During the 2010/2011 survey year, winter rainfall was average in the Succulent Karoo and below average in the Nama Karoo. This was followed by a wet summer across the Karoo, so overall annual rainfall was slightly above average (SAWS 2012). The number of Ludwig’s Bustards seen in the main Karoo bioregions varied by season, particularly for the Succulent Karoo, but there was no apparent pattern with rainfall in the months before the four main road counts or the September 2012 western count (before which rainfall had been normal). There was no correlation, and all GLMs and GAMs failed to detect any relationship between the rainfall and counts for each bioregion, separately for the Nama and Succulent Karoo, and overall for each time lag examined. This contrasts with the positive relationship identified by Allan (Reference Allan1994) from the 1980s counts.
Ludwig’s Bustards were more likely to be seen in transformed habitats in the 2010s surveys than in the 1980s surveys (χ2 = 223.81, df = 1, P < 0.001), having switched from being under-represented there in the 1980s to favouring transformed lands in the 2010s (χ2 = 137.99, df = 1, P < 0.001) based on the proportion of birds relative to the proportion of transformed land on the survey routes (Table 2). Most Ludwig’s Bustards seen on transformed lands (n = 250) in 2010s were on pastures (70%), with fewer seen on crops (9%), stubbles (12%) or ploughed/fallow fields (8%). The percentage of transformed land decreased slightly on the western route between the two counts (χ2 = 4.64, df = 1, P = 0.031), but increased on the eastern route (χ2 = 91.97, df = 1, P < 0.001; Table 2). In areas on the 2010s surveys where both habitat types were present, Ludwig’s Bustards were more often seen in transformed habitats (n = 97 birds, compared to 25 in natural veld and 51 in both habitats (birds in groups were not classified individually); χ2 = 23.38, df = 2, P < 0.001).
Percentage of transformed and natural habitats on the eastern and western road count routes in the 1980s and 2010s, with the percentage of Ludwig’s Bustards seen in each habitat by route.

There was no significant effect of road surface on the average number of Ludwig’s Bustards seen in the winter in 12 bioregions in the 1980s (U = 44, P = 0.103) or 14 bioregions in the 2010s (U = 63, P = 0.065), although there was a tendency towards higher counts on gravel roads in both time periods. Such an effect was hard to detect as the proportion of tar roads was minimal, but it is also therefore unlikely to have unduly influenced population estimates.
As was the case in the 1980s (Allan Reference Allan1994), Ludwig’s Bustards were seen in larger groups in winter (mean 3.56 ± 3.24 SD, max = 19) than summer (2.13 ± 2.18 SD, max = 14; W = 7862, P < 0.001). In the 2010s data, there were no patterns of sex in relation to season or Karoo biome. Males were more often seen alone, and females were more often seen in groups of 2–4 birds and larger (χ2 = 6.38, df = 2, P = 0.041).
The first behaviour of Ludwig’s Bustards seen on 2010s road counts differed with distance from the road, with birds near the road (< 100 m) flushing more often (χ2 = 102.94, df = 3, P < 0.001, Figure 3). As expected, inactive birds were only rarely seen further from the road, as they are more difficult to detect. On the 2010s surveys there was no seasonal difference between activity behaviours overall (χ2 = 1.63, df = 3, P = 0.652) or on Nama Karoo surveys only (χ2 = 3.47, df = 3, P = 0.325), but on the 1980s counts birds were more likely to flush in winter overall (χ2 = 8.63, df = 3, P = 0.035), and on Nama Karoo surveys only (χ2 = 10.54, df = 3, P = 0.014). Therefore, there was evidence on the original counts for bustards being more difficult to see in summer, if they were more likely to crouch in the higher vegetation than flush. However, this was not the case for the current counts, and there was also no difference between sighting distances in the Nama Karoo in summer and winter (W = 1,061, P = 0.412).
First behaviour seen for each Ludwig’s Bustard sighting on the 2010s surveys by distance from road (with sample sizes).

Aerial vs road counts
As in the 1980s (Allan Reference Allan1994), the Succulent Karoo aerial survey gave broadly similar abundance patterns to the road count (Table 3). Local density estimates were significantly and positively correlated (Pearson product-moment correlation coefficient r = 0.84, t = 4.16, df = 7, P = 0.004), indicating that both methods provide an adequate index of abundance. The results from the Nama Karoo survey were inconclusive (Pearson product-moment correlation coefficient r = 0.36, t = 0.66, df = 3, P = 0.56; Table 3), but this could have been because few bustards were seen. The small numbers counted during the summer aerial census suggest that birds may be less likely to flush in summer.
Comparison of 2010s census methods, with the density of Ludwig’s Bustards (LB) seen by bioregion on aerial and corresponding road counts in summer (March–April) 2011 in the Nama Karoo, and winter (September–October) 2012 in the Succulent Karoo. Road count search area calculated from the ESW estimated by Distance analyses (151 m; Table 4).

Distance population estimates
The Distance analyses suggest that there has been no marked change in the Ludwig’s Bustard population in South Africa, with approximately 97,000 (95% CI 75,000–126,000) birds estimated from the 1980s count and 114,000 (95% CI 87,000–148,000) from the 2010s counts (Table 4). In both time periods, the winter densities of bustards were lower in the Nama Karoo than the Succulent Karoo, and the densities in the Nama Karoo were similar (Table 4). However, the density in the Succulent Karoo was higher in the 2010s counts than in the 1980s (0.43 vs 0.28 bustards km-2). This apparently resulted from an irruption of Ludwig’s Bustards (and other arid zone birds) in the southern part of this biome in winter 2010, following dry conditions in the Nama Karoo. Overall, 54% of the population in the winter 2010s counts were in the Succulent Karoo, compared to 42% in the 1980s. Average group sizes in both time periods were similar overall, but were larger in the Succulent Karoo compared with the Nama Karoo in the 1980s, and approximately equal in both biomes in the 2010s counts (Table 4).
Density estimates of Ludwig’s Bustards from 1980s (n = 1) and 2010s (n = 3) winter count data, with the best Distance models (< 2 AIC from lowest). Estimates for effective search width (ESW in m), group size, density (birds km-2) and overall population size (surveyed area and whole SA range) given by Karoo stratum and overall, with 95% confidence intervals (2.5% and 97.5% quantiles of bootstrap estimates). The 1980s data were truncated at 500 m (from n = 136 to n = 123) and grouped into 6 equal groups, and the 2010s data were truncated at 300 m (from n = 249 to n = 244) and grouped into five equal groups.

Discussion
Allan (Reference Allan1994) probably underestimated the population of Ludwig’s Bustards because of the unrealistic assumption of constant detectability on the 1980s road counts (Marques et al. Reference Marques, Thomas, Fancy and Buckland2007). Applying Distance sampling to the one 1980s survey where distance data were recorded increased the population estimate from 56,000–81,000 bustards across the whole range to 97,000 (95% CI 75,000–126,000) in South Africa alone. Two decades later, the South African population appears little changed, with a best estimate of 114,000 (95% CI 87,000–148,000) birds. Given the broad overlap in confidence intervals, and the fact that the 1980s estimate can only be considered approximate (it was based on only one survey and distance measurements were likely to be less accurate that those made in 2010s), we cannot conclude that there has been a change in population size over the last two decades.
The road count routes were comparable between the two censuses, with only a slight increase in tarred roads, but with sighting distances only taken on one 1980s survey it was difficult to compare observer efficiency with any confidence. There seems to be evidence for poorer detection of cryptic species in the 2010s counts, but this comparison is complicated by the different technology used to estimate distances in the two survey periods. Some of the differences in sighting distances between the two surveys might result from differences in the accuracy of the rangefinders used. Other factors could also influence detectability e.g. changes in habitat, although we would then have expected greater sighting distances in the later surveys (more sightings on open transformed lands with better visibility). Despite this issue, our findings generally support Hofmeyr’s (Reference Hofmeyr2012) assessment of large terrestrial bird population trends in South Africa made using long-term bird monitoring project data (CAR, SABAP 1 and 2). Like Hofmeyr (Reference Hofmeyr2012), we found a decline of Southern Black Korhaans in the Succulent Karoo, no change of the Northern Black Korhaan population and a decrease in Blue Korhaans in the eastern Karoo, although Hofmeyr (Reference Hofmeyr2012) found this species to be stable or slightly increasing elsewhere in its range. The SABAP data supported the increase we saw for Blue Cranes in the grassy Nama Karoo, but suggested the Karoo Korhaan population is stable (Hofmeyr Reference Hofmeyr2012). However, coverage of the Karoo Korhaan range in monitoring projects is poor, particularly in the Nama Karoo where we detected a decline. Detection issues may have enhanced such an effect, but the numbers of Karoo Korhaans seen on both counts in the Succulent Karoo were similar.
Seasonal patterns in the distribution of Ludwig’s Bustards were similar in both censuses, with large numbers seen in the Succulent Karoo in winter, and fairly small numbers in the Nama Karoo year-round. This supports Allan’s (Reference Allan1994) inference that Ludwig’s Bustard is a partial migrant. The Distance analyses suggested that approximately half of the South African population was in the Succulent Karoo during winter (1980s = 58%, 2010s = 46%). These proportions were similar, despite a difference in conditions; rainfall had been above average in the Nama Karoo in the winter counts of the 1980s, but the winter of 2010 was dry in this biome. It is difficult to explain the lack of discernible decrease in the Nama Karoo population in winter when such high proportions of the population migrate to the Succulent Karoo (there is no evidence that the migrants come from Namibia, and satellite tagged birds in South Africa generally travelled west in winter; Shaw Reference Shaw2013). It is likely that trends are hard to detect in the much larger Nama Karoo where the density of bustards is low, and summer conditions make detection more difficult (as evidenced by the lower summer counts of resident species like Karoo Korhaans). Most other patterns were similar on both censuses; males more often seen alone, females more often in groups and group sizes larger in winter. In the 1980s, groups were larger in the Succulent Karoo compared with the Nama Karoo, but such a difference was not detected in the 2010s. Perhaps fewer birds were breeding in the Succulent Karoo at the time of the drier 1980s counts; breeding birds are more often alone (Allan Reference Allan, R Hockey, Dean and Ryan2005). Seasonal patterns relating to detectability were found in the 1980s counts, but not the 2010s, which perhaps relates to the fact that substantially more of our sightings were in transformed, open habitats.
Unlike the 1980s counts, the 2010s survey results did not show a positive correlation between rainfall and Ludwig’s Bustard abundance. There were no instances of population increases following specific rain events as identified in Allan’s (Reference Allan1994) data. These increases were largely seen in the Succulent Karoo in June 1989 in response to high rainfall in April 1989, and Allan (Reference Allan1994) therefore concluded that these birds were nomadic in response to local rainfall events. Our results do not provide evidence for this behaviour, but perhaps responses are as much to do with rainfall in other regions as they are in the place the birds are seen e.g. the winter 2010 irruption into the southern Succulent Karoo followed dry conditions in the Nama Karoo. The relationship between nomadic birds and rainfall is not always straightforward, with other factors involved, and birds may use different movement strategies in different years (Dean Reference Dean1997, Dean and Milton Reference Dean and Milton2001). Indeed, Allan (Reference Allan1994) found that the rainfall/density correlation explained relatively little of the variation in bustard counts, and suggested that rainfall in more mesic parts of the Karoo would have less influence on bustard densities than in arid areas. It may be that the relatively wet summer of 2010/2011 resulted in abundant resources throughout the species’ South African range, so Ludwig’s Bustards did not need to track rainfall. Depending on environmental productivity, Karoo nomads can breed year round (Dean Reference Dean1997, Allan Reference Allan, R Hockey, Dean and Ryan2005), so perhaps the bustards either moved less in order to breed, or had a greater choice of productive areas to move to. In addition, the GPS-satellite tracking data indicate that Ludwig’s Bustards often return to the same sites each summer, so their movements may not be nomadic in the classic sense of random movement linked to patchy resources (Shaw Reference Shaw2013).
Comparison of the habitat data between surveys suggested a slight increase in transformed land in the Nama Karoo, but not in the Succulent Karoo. Remote sensing data shows that there have only been minor land use changes in the Karoo over the past few decades (Brink and Eva Reference Brink and Eva2009), with minimal amounts of agriculture in the Karoo (currently ranging between 0.7% in the Northern Cape and 29.5% in the Free State; Schoeman et al. Reference Schoeman, Newby, Thompson and van den Berg2010). It has been suggested that rangeland mismanagement negatively affects bustards (Dean et al. Reference Dean, Milton and du Plessis1995a, Reference Dean, Hoffman, Meadows and Milton1995b), but livestock stocking rates declined across the Karoo in the 20th century following historical overstocking. In Namaqualand, both cultivation and livestock farming have declined since the 1970s, with evidence that the veld is very slow to recover from the historical impacts of these land uses (Hoffman and Rohde Reference Hoffman and Rohde2007). Recent land use trends are for consolidation of economically non-viable farms into large game farms and conservancies, and for the subdivision of state-acquired land to give to previously disadvantaged small-scale farmers (Esler et al. Reference Esler, Milton and Dean2006). Despite minimal changes in the amount of transformed land, there was a marked increase in the proportion of Ludwig’s Bustard sightings in these habitats, particularly pastures. Although this could result from improved detection in such landscapes, the habitat use patterns of many satellite tagged bustards indicate an association with farmed areas (Shaw Reference Shaw2013). This apparent habitat switch between the censuses is not explained by the state of the veld, as degradation began long before the 1980s counts (Dean et al. Reference Dean, Milton and du Plessis1995a, Reference Dean, Hoffman, Meadows and Milton1995b, Esler et al. Reference Esler, Milton and Dean2006). The preference for transformed land during the 2010s surveys may result from a combination of factors, including good rains making marginal lands more productive, the timing of locust outbreaks (generally every 7–13 years), climatic variability and which crops are currently grown (Simmons et al. Reference Simmons, Barnard, Dean, Midgley, Thuiller and Hughes2004, Esler et al. Reference Esler, Milton and Dean2006).
While we believe our study has given useful insight into the status of large bird populations in the Karoo, some methodological limitations should be borne in mind. Firstly, our assessment of the Ludwig’s Bustard population trend is crude because it is based on just two population estimates. Further counts would be required to clarify this trend, and also to minimise the potential influence of any longer term climatic effects e.g. increased productivity resulting from several wet years. Secondly, our road count route covered relatively little of the total area of the Karoo. However, given the logistical challenges we believe there is no practical alternative for censusing these wide-ranging birds, and that our route along generally quiet gravel roads through all relevant bioregions covered a meaningful and geographically representative area. Thirdly, while we consider our study met the main assumptions of Distance sampling, the use of non-random road transects could have biased population estimates if the density of birds along these routes differed from the survey area as a whole because of, for example, increased disturbance (Erxleben et al. Reference Erxleben, Butler, Ballard, Wallace, Peterson, Silvy, Kuvlesky, Hewitt, DeMaso, Hardin and Dominguez-Brazil2011, Marques et al. Reference Marques, Buckland, Bispo and Howland2012). Ludwig’s Bustards are disturbed by road traffic; there was evidence of evasive movement and birds more often flushed close to the road on the 2010s counts, although there was no marked effect of road surface. However, the more randomly placed aerial counts broadly supported the road count data and grouping for analysis should have partly accounted for the evasive movement evident (i.e. fewer detections close to zero distance than expected). GPS-satellite tracking results (Shaw Reference Shaw2013) show that Ludwig’s Bustards do not avoid the general vicinity of roads (to 5 km) and behave similarly regardless of road type. Also, there was no evidence that birds were distributed farther from roads in the 2010s counts, despite increased road traffic over the last two decades. Thus, although our Distance analyses could have underestimated population sizes we believe that such biases are not excessive and the road count methodology was appropriate, as has been found in some other large bird studies (e.g. Butler et al. Reference Butler, Ballard, Wallace and Demaso2007, Venturato et al. Reference Venturato, Cavallini and Dessì-Fulgheri2010).
Our population estimates from the 1980s and 2010s were comparable, although with very wide confidence intervals. Therefore, power line collisions do not yet seem to have caused a decline, but projections using all but the most optimistic demographic parameters are still for this outcome in the face of an unmitigated and rapidly expanding power grid (Shaw Reference Shaw2013). It appears that the population is currently stable, but there will likely be a threshold length and density of power line above which negative impacts will become apparent (Bevanger Reference Bevanger1995). Given the lack of demographic data on this species it is difficult to estimate what this might be, and critically the wide confidence intervals in our population estimates could mask subtle population declines which we are unlikely to notice in time to mitigate. In light of the uncertainty of our population estimates and the increasing threat to Ludwig’s Bustard, we suggest that its regional and global Red List status remain set at ‘Endangered’ (Mace et al. Reference Mace, Collar, Gaston, Hilton-Taylor, Akçakaya, Leader-Williams, Milner-Gulland and Stuart2008). Of the other species considered, the decrease in numbers of Karoo, Southern Black and Blue Korhaans are of most concern, and we suggest that for all of these birds additional census counts would be helpful to further clarify our observations. Although such counts are extremely time and resource intensive, we also suggest it is important to repeat them every 5–10 years to monitor future population trends in this otherwise little surveyed region.
Supplementary Material
The supplementary materials for this article can be found at journals.cambridge.org/bci
Acknowledgements
We thank Lola Brookes, Ben Dilley, Rosa Gleave, Conette Koorts and Ross Wheeler for assistance in the field, Alison and Bill Brown, Judy and Zorb Caryer, Sue Milton & Richard Dean, Adrian Fortuin, Riëtte and Jan Griesel and Boetie Louw for accommodation in various parts of the Karoo; pilots Mark Rule and Harold Bloch for flying us on the aerial surveys; Donella Young for assisting with bird counting logistics; the South African Weather Service for providing the weather data used, and two anonymous reviewers for their helpful comments on our manuscript. We are grateful also for the advice we received from Tim Reid on statistics, Nick Lindenberg and Tom Slingsby on GIS and Tiago Marques on technical Distance issues. The project was supported financially and logistically by the Bateleurs, the Mazda Wildlife Fund, the Abax Foundation and the Mohammed bin Zayed Species Conservation Fund. JMS was awarded bursaries by the Percy FitzPatrick Institute DST/NRF Centre of Excellence and the University of Cape Town.


