


Introduction
Availability of reliable short-term (e.g., one to two weeks) and seasonal weather forecasts (e.g., four to five months covering the growing season) at regional and local scales is crucial for irrigation decision-making and predicting future crop production, especially in water-stressed regions with declining water resources (Singh and Su, Reference Singh, Su and Lee2022a, b). Accurate forecasts enable farmers and water managers to optimize irrigation schedules, reduce water use and enhance agricultural resilience to climate variability (Su and Singh, Reference Su and Singh2024). Short-term climate projections, e.g., the 16-day forecasts generated by the Global Forecast System (GFS) (NCEP, 2023a), provide valuable information for immediate agricultural decisions like irrigation scheduling. However, these forecasts are limited in their ability to capture longer-term weather patterns for planning throughout the growing season. On the other hand, long-term climate projections using global climate models (GCMs), which are designed to predict climate trends over decades or even centuries, are primarily used for evaluating climate change impacts and developing mitigation strategies. While valuable for these purposes, the use of GCMs to provide intra-seasonal and seasonal weather projections is still limited.
The North American Multi-Model Ensemble (NMME) is an experimental real-time seasonal forecast system (Kirtman et al., Reference Kirtman, Min, Infanti, Kinter, Paolino, Zhang, van den Dool, Saha, Mendez, Becker, Peng, Tripp, Huang, DeWitt, Tippett, Barnston, Li, Rosati, Schubert, Rienecker, Suarez, Li, Marshak, Lim, Tribbia, Pegion, Merryfield, Denis and Wood2014), which provides daily global weather forecasts with an 11-month lead time at 1º spatial resolution (approximately 110 km at the equator) based on ensemble simulations of several state-of-the-art GCMs, including the Community Climate System Model version 4 (CCSM4) (Danabasoglu et al., Reference Danabasoglu, Bates, Briegleb, Jayne, Jochum, Large, Peacock and Yeager2012), Canadian Coupled Global Climate Model version 3 (CanCM3) and version 4 (CanCM4) (Merryfield et al., Reference Merryfield, Lee, Boer, Kharin, Scinocca, Flato, Ajayamohan, Fyfe, Tang and Polavarapu2013), Goddard Earth Observing System (GEOS-5) (Vernieres et al., Reference Vernieres, Rienecker, Kovach and Keppenne2012), Climate Forecast System version 2 (CFSv2-2011) (Saha et al., Reference Saha, Nadiga, Thiaw, Wang, Wang, Zhang, Van den Dool, Pan, Moorthi, Behringer, Stokes, Pena, Lord, White, Ebisuzaki, Peng and Xie2006), Global Environmental Multiscale/Nucleus for European Modelling of the Ocean (GEM/NEMO) (Aumont et al., Reference Aumont, Ethe, Tagliabue, Bopp and Gehlen2015) and the Community Earth System Model (CESM1) (Hurrell et al., Reference Hurrell, Holland, Gent, Ghan, Kay, Kushner, Lamarque, Large, Lawrence, Lindsay, Lipscomb, Long, Mahowald, Marsh, Neale, Rasch, Vavrus, Vertenstein, Bader, Collins, Hack, Kiehl and Marshall2013). However, due to coarse resolution, the use of NMME datasets at regional and local scales is often constrained by increased bias and uncertainty, which limit its utility in driving crop models for real-time crop yield and irrigation predictions (Barbero et al., Reference Barbero, Abatzoglou and Hegewisch2017; Barnston and Tippett, Reference Barnston and Tippett2017; Narapusetty et al., Reference Narapusetty, Collins, Murtugudde, Gottschalck and Peters-Lidard2018; Yazdandoost et al., Reference Yazdandoost, Moradian, Zakipour, Izadi and Bavandpour2020). As a result, downscaling techniques are typically necessary to enable the application of forecasted data at regional and local scales.
Dynamic and statistical downscaling are two commonly used techniques to downscale GCM outputs to the regional scale for use in agricultural impact studies (Gebrechorkos et al., Reference Gebrechorkos, Hulsmann and Bernhofer2019; Gutmann et al., Reference Gutmann, Rasmussen, Liu, Ikeda, Gochis, Clark, Dudhia and Thompson2012). Dynamic downscaling requires inputs from GCMs to set up boundary and initial conditions, which can explicitly resolve the challenges associated with the convective rainfall process. However, dynamic downscaling is computationally expensive, and the downscaled data can still have biases and uncertainties from the systematic errors inherent to the use of boundary conditions from GCMs. These shortcomings limit the application of dynamic downscaling in local and regional impact assessment and climate change adaptation studies (Adachi and Tomita, Reference Adachi and Tomita2020). In contrast, statistical downscaling is a simple, fast and effective method that requires less computational time and expense. Statistical downscaling typically includes two steps: (1) developing a transformation function to represent the statistical relationship between large- and local-scale weather variables using historical data and (2) applying the transformation function to future large-scale outputs to derive future downscaled data. Commonly used statistical downscaling approaches include the delta method, e.g., delta addition and changing factor (Navarro-Racines et al., Reference Navarro-Racines, Tarapues, Thornton, Jarvis and Ramirez-Villegas2020), bias correction (or nudging), e.g., correction only for mean bias (Huntingford et al., Reference Huntingford, Lambert, Gash, Taylor and Challinor2005; Ines and Hansen, Reference Ines and Hansen2006) or corrections for both mean and variance (Hawkins et al., Reference Hawkins, Osborne, Ho and Challinor2013; Ho et al., Reference Ho, Stephenson, Collins, Ferro and Brown2012); quantile mapping (Kaini et al., Reference Kaini, Nepal, Pradhananga, Gardner and Sharma2020) and multiple linear regression (Gebrechorkos et al., Reference Gebrechorkos, Hulsmann and Bernhofer2019).
Statistical downscaling has been widely used in local and regional crop modelling (Hawkins et al., Reference Hawkins, Osborne, Ho and Challinor2013; Jones and Thornton, Reference Jones and Thornton2013) and water management studies (Madadgar et al., Reference Madadgar, AghaKouchak, Shukla, Wood, Cheng, Hsu and Svoboda2016; Yazdandoost et al., Reference Yazdandoost, Moradian, Zakipour, Izadi and Bavandpour2020). Application of statistical downscaling techniques improves the accuracy of seasonal weather forecasts and helps in developing efficient irrigation management strategies to sustain crop production in water-stressed regions. The Texas Rolling Plains (TRP), an important agricultural region in Texas that produced about 13 % of Texas cotton in 2020 (USDA-NASS, 2020), was chosen as the focus area for this study for testing the utility of weather forecasts in irrigation management. This semi-arid region receives a relatively low annual rainfall of about 460–710 mm (18–28 in) (Su et al., Reference Su, Singh and Karthikeyan2022), and crop production in this region is highly dependent on irrigation water from the underlying Seymour Aquifer. The region faces many challenges for irrigated agriculture, including a reduction in well capacities and increased irrigation water demand in the future due to the projected warmer and drier summers (Modala et al., Reference Modala, Ale, Goldberg, Olivares, Munster, Rajan and Feagin2017; Nielsen-Gammon et al., Reference Nielsen-Gammon, Banner, Cook, Tremaine, Wong, Mace, Gao, Yang, Gonzalez, Hoffpauir, Gooch and Kloesel2020), and hence it was selected as the study area.
The objectives of this study were to (1) improve the reliability of seasonal weather forecasts of the raw CanCM4 outputs by performing an improved bias-correction for both mean and variability and downscaling and (2) test the usefulness of the downscaled CanCM4 forecasts at different lead times of 0–5 months in real-time crop modelling.
Materials and methods
An improved bias-corrected downscaling method was used on the raw CanCM4 outputs, including maximum temperature (T max), minimum temperature (T min) and precipitation to achieve the study objectives. The downscaled CanCM4 forecasts were then compared with the daily surface weather and climatological summaries (DAYMET) observed data and ensemble means of multiple models, including CanCM4, CCSM4 and GEOS-5, and the reliability of downscaled CanCM4 forecasts at different lead times (0–5 month lead) was evaluated. The use of downscaled CanCM4 seasonal forecasts in real-time crop modelling was also tested using a calibrated CROPGRO-Cotton module (Adhikari et al., Reference Adhikari, Omani, Ale, DeLaune, Thorp, Barnes and Hoogenboom2017; Himanshu et al., Reference Himanshu, Ale, DeLaune, Singh, Mauget and Barnes2022) of the Decision Support System for Agrotechnology Transfer (DSSAT) cropping system model (CSM) (Hoogenboom et al., Reference Hoogenboom, Porter, Boote, Shelia, Wilkens, Singh, White, Asseng, Lizaso, Moreno, Pavan, Ogoshi, Hunt, Tsuji, Jones and Boote2019; Jones et al., Reference Jones, Hoogenboom, Porter, Boote, Batchelor, Hunt, Wilkens, Singh, Gijsman and Ritchie2003) at an experimental station in the semi-arid TRP region, Texas, United States, during the 2020 cotton growing season.
Forecasted weather data
The forecasted seasonal weather data were obtained from the NMME forecasting system. In the NMME dataset, CESM1, CanCM3 and CanCM4 GCMs provide all four weather variables required for crop modelling, i.e., T max, T min, precipitation and solar radiation. However, long-term coverage of the dataset, e.g., for 30 years, for a reliable calibration of the downscaling parameters is available only for CanCM4 GCM (NCEP, 2023b). Therefore, the hindcast predictions (1982–2010) of CanCM4 were used to calibrate the downscaling parameters. For real-time weather forecasts, the multi-model mean values of CCSM4, GEOS-5 and CanCM4 were calculated and compared with the downscaled CanCM4 data. The CCSM4 and GEOS-5 models were selected because they are updated monthly and have the same temporal and spatial resolution and ensemble size (10) as the CanCM4 model. Since solar radiation is not simulated by CCSM4 and GEOS-5 models, it was estimated based on T max, T min and extraterrestrial solar radiation (R a ) data to ensure data consistency (Su, Reference Su2021).
DAYMET version 4 data (1982–2019) was used as the reference database for calibration and validation (https://daymet.ornl.gov/), since it has been widely used in agricultural research (Dhakal et al., Reference Dhakal, Kakani and Linde2018; Partridge et al., Reference Partridge, Winter, Kendall and Hyndman2021). The DAYMET dataset is derived through statistical modelling techniques that interpolate and extrapolate ground-based observations, and it covers the contiguous United States (CONUS) at 1-km grid resolution and provides long-term, continuous daily weather variables (e.g., T max, T min, precipitation, solar radiation and vapor pressure).
Bias correction and downscaling method
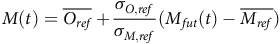
A bias correction and downscaling method with corrections for both mean and variability (Hawkins et al., Reference Hawkins, Osborne, Ho and Challinor2013; Ho et al., Reference Ho, Stephenson, Collins, Ferro and Brown2012) was used in this study to produce daily weather data at a 1-km resolution from CanCM4 seasonal forecasts (Figure A1, Supplementary Materials). A comparison of the improved method with delta addition (only mean is corrected), delta correction (corrected for variance) and quantile mapping methods is illustrated in Figure A1 in Supplementary Materials. Major assumptions of the improved method include (1) stationarity between small-scale and large-scale dynamics, which means that the same relationship (that of historical data) holds when relating future simulations to future observations and (2) present-day small-scale and large-scale weather data have the same shape of distributions, but different means and variances. As such, future small-scale weather data can be calculated as
 $$M\left(t\right)=\overline{{O}_{ref}}+{{{\sigma }_{O,ref}}\over{{\sigma }_{M,ref}}}({M}_{fut}\left(t\right)-\overline{{M}_{ref}})$$
where M(t) is the T
max (°C), T
min (°C) or precipitation (mm) at the field location (1-km resolution) at time t; $ {M}_{fut}\left(t\right)$
is the seasonal forecasts by CanCM4 at time t;
$ {M}_{fut}\left(t\right)$
is the seasonal forecasts by CanCM4 at time t; $ {\sigma }_{O,ref}$
and
$ {\sigma }_{O,ref}$
and $ {\sigma }_{M,ref}$
represent the standard deviations of monthly observations and the CanCM4 outputs in the reference period, respectively; and
$ {\sigma }_{M,ref}$
represent the standard deviations of monthly observations and the CanCM4 outputs in the reference period, respectively; and $ \overline{{O}_{ref}}$
and
$ \overline{{O}_{ref}}$
and $ \overline{{M}_{ref}}$
are the means of monthly observations and the CanCM4 outputs, respectively. Since weather variables have a strong seasonal cycle, the calibration was performed for each month individually. The downscaled CanCM4 outputs were finally converted to the target units, as shown in Supplementary Table A1.
$ \overline{{M}_{ref}}$
are the means of monthly observations and the CanCM4 outputs, respectively. Since weather variables have a strong seasonal cycle, the calibration was performed for each month individually. The downscaled CanCM4 outputs were finally converted to the target units, as shown in Supplementary Table A1.
Real-time weather forecasts
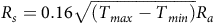
Figure 1 illustrates the workflow used for generating seasonal weather forecasts using the multi-model mean and downscaling methods. For the multi-model mean method, the arithmetic mean values of T max , T min and precipitation were calculated from the raw model outputs (30 ensembles, 10 each for CanCM4, CCSM4 and GEOS-5 GCMs) at every grid at 1º×1º spatial resolution with daily frequency. For the downscaled method, the 1º×1º data from CanCM4 GCM were first interpolated to 1 km×1 km using bilinear interpolation. The downscaled weather forecast data at 1 km resolution were then obtained by applying the bias-correction method using the downscaling parameters derived. In addition, real-time solar radiation was calculated as (Hargreaves and Samani, Reference Hargreaves and Samani1982):
 $${R}_{s}=0.16\sqrt{({T}_{\mathrm{m}\mathrm{a}\mathrm{x}}-{T}_{\mathrm{m}\mathrm{i}\mathrm{n}})}\mathrm{}{R}_{a}$$
where $ {R}_{a}$
is the extraterrestrial radiation, MJ/m2/day. Here, we used an adjustment coefficient of 0.16, which is recommended for interior regions. Details of the calculation of
$ {R}_{a}$
is the extraterrestrial radiation, MJ/m2/day. Here, we used an adjustment coefficient of 0.16, which is recommended for interior regions. Details of the calculation of $ {R}_{a}$
are given in Appendix B of Supplementary Materials.
$ {R}_{a}$
are given in Appendix B of Supplementary Materials.
Schematic showing the workflow used for processing weather data for regional crop modelling.
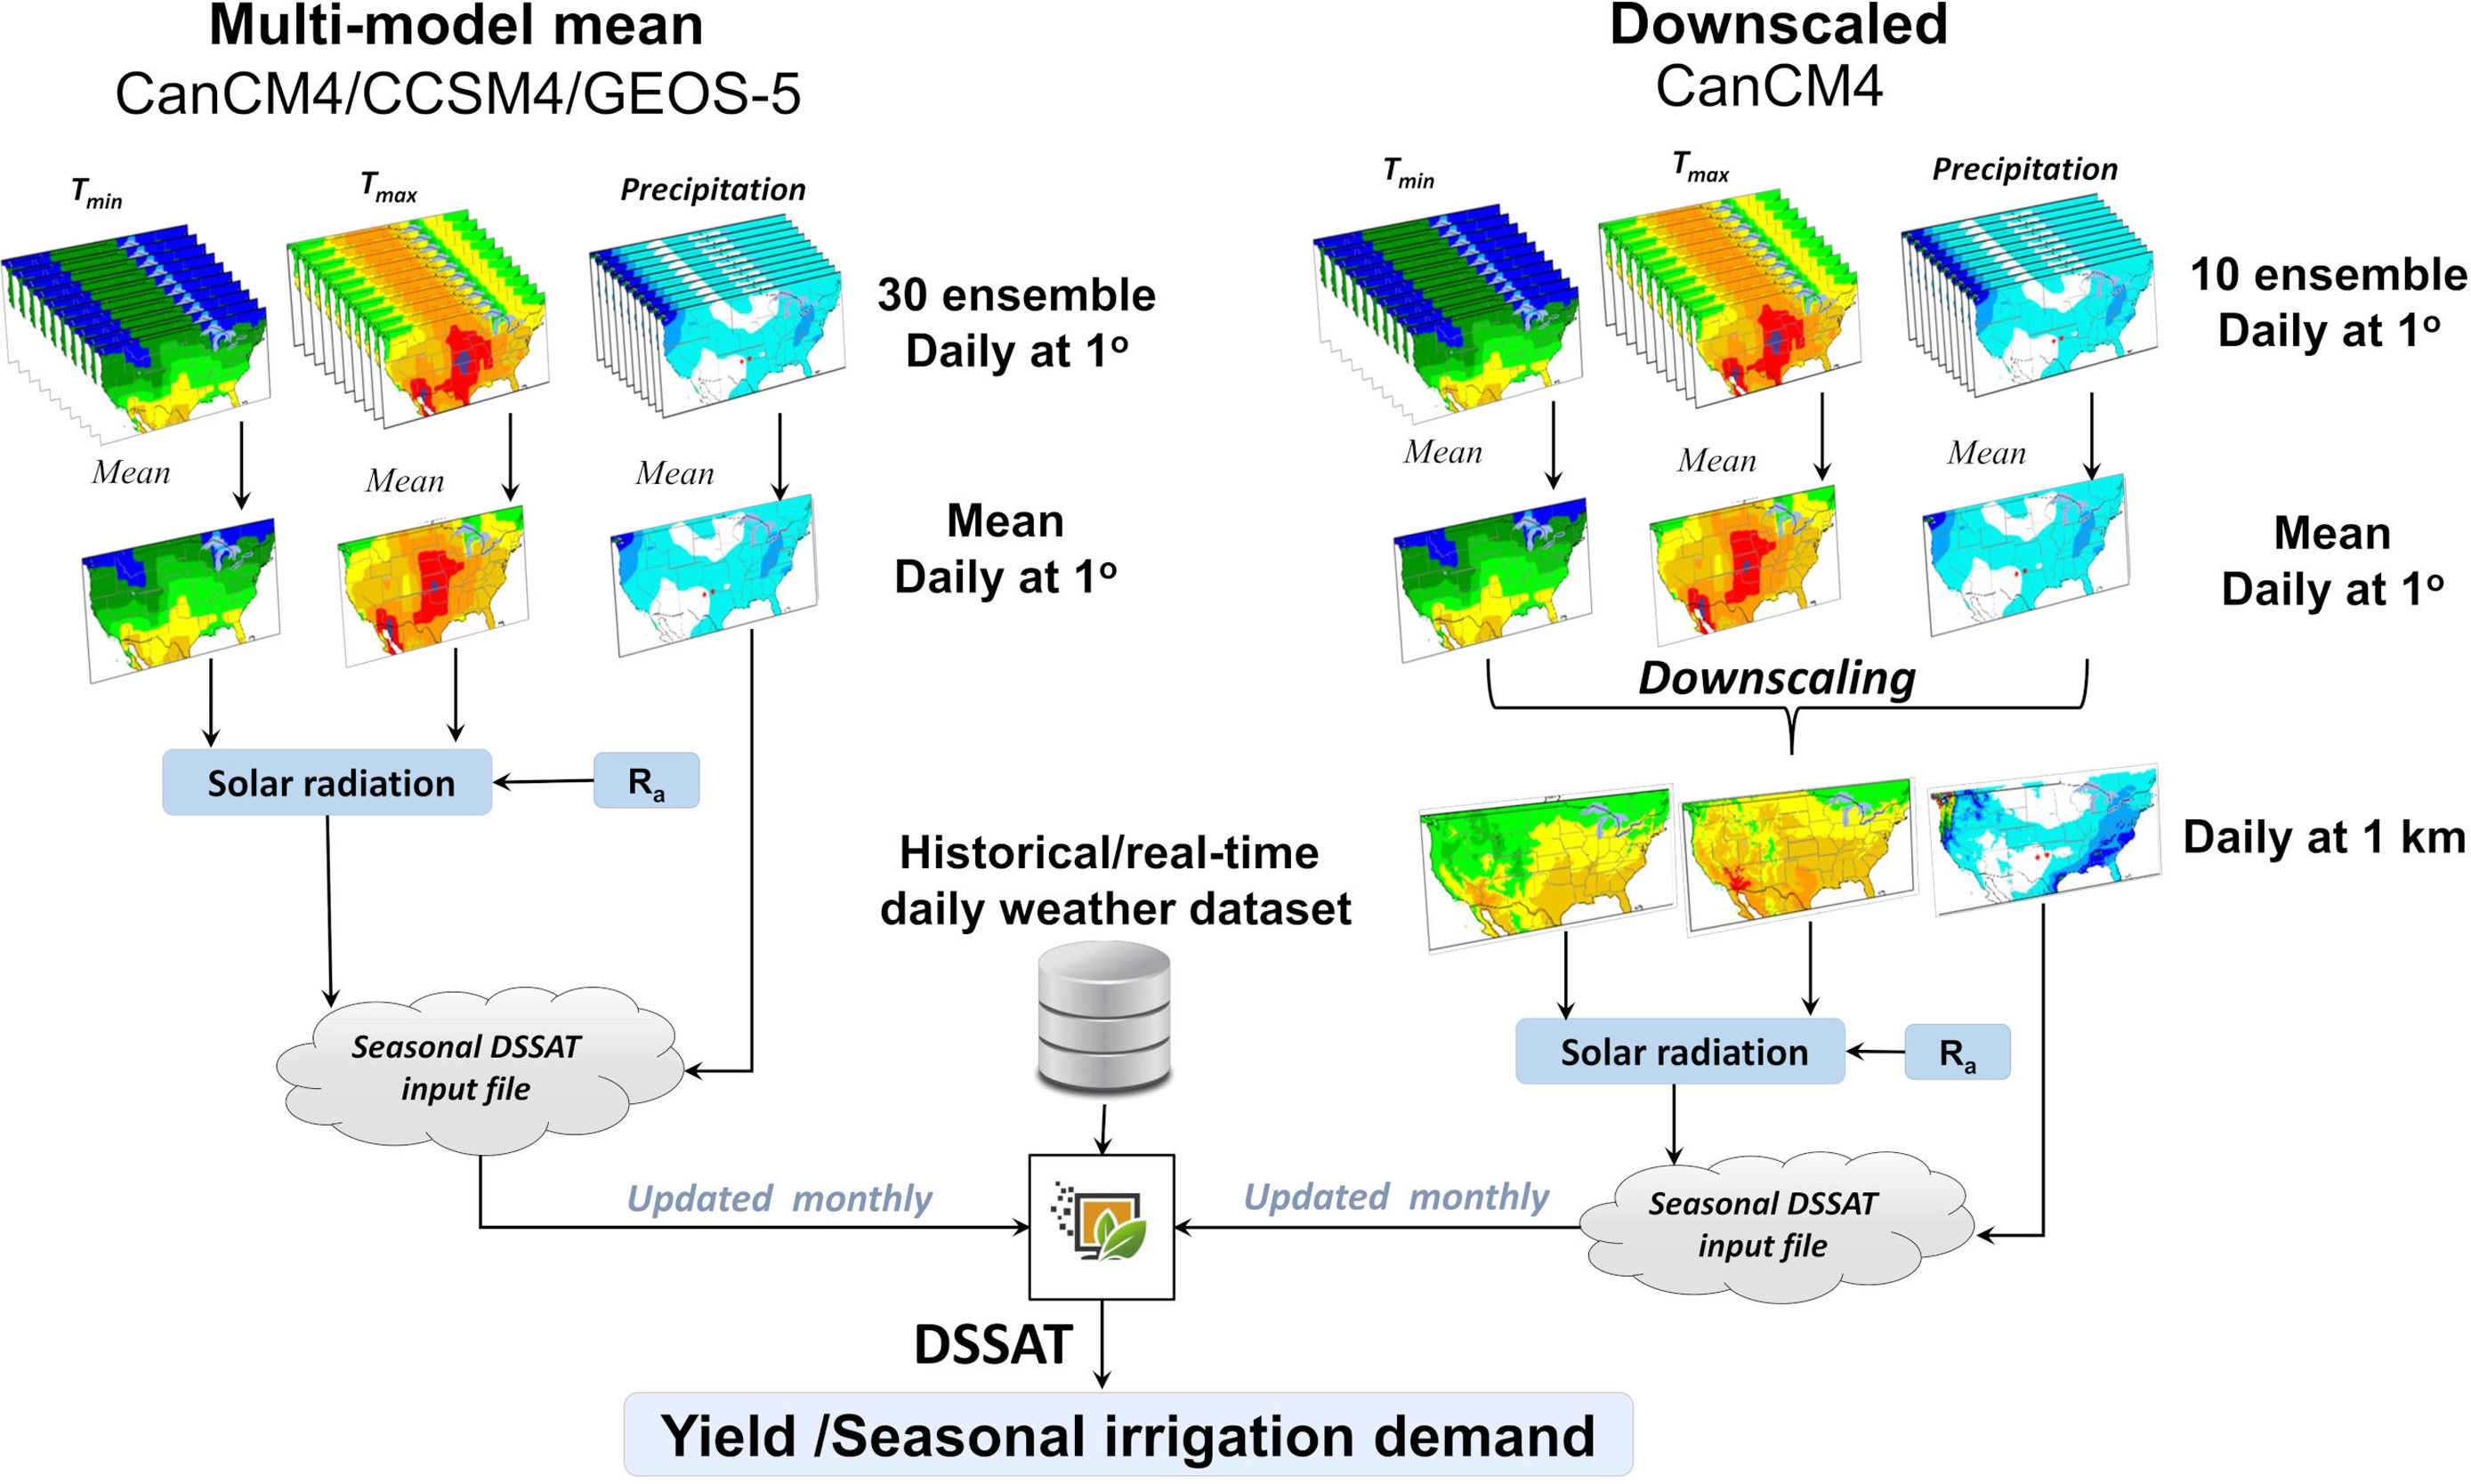
To ensure reliable prediction of crop yield and irrigation water requirements, the DSSAT daily weather file was updated monthly with newly available seasonal forecast weather data along with the historical data as the growing season progressed. This approach provided the crop model with updated weather predictions throughout the growing season, rather than relying on a single static weather forecast file. Historical weather data from January 1 to the day before the planting date was used to ensure proper initialization of the DSSAT model. The historical weather data were obtained from three sources: (1) West Texas Mesonet (http://www.mesonet.ttu.edu/meteograms/), (2) National Climatic Data Center (NCDC) (https://www1.ncdc.noaa.gov/pub/data/ghcn/daily/) and (3) North American Regional Reanalysis (NARR) data (ftp.cdc.noaa.gov/Datasets/NARR/Dailies/monolevel/). The procedure for generating real-time daily weather forecasts covering the growing season can be found in (Ale et al., Reference Ale, Su, Singh, Himanshu, Fan, Stoker, Gonzalez, Sapkota, Adams, Biggers, Kimura and Wall2023).
Crop growth simulation model
The reliability of downscaled seasonal weather forecasts for real-time crop modelling was assessed using a previously calibrated CROPGRO-Cotton module (Himanshu et al., Reference Himanshu, Ale, DeLaune, Singh, Mauget and Barnes2022) of the DSSAT cropping system model version 4.7.5 (Hoogenboom et al., Reference Hoogenboom, Porter, Boote, Shelia, Wilkens, Singh, White, Asseng, Lizaso, Moreno, Pavan, Ogoshi, Hunt, Tsuji, Jones and Boote2019; Jones et al., Reference Jones, Hoogenboom, Porter, Boote, Batchelor, Hunt, Wilkens, Singh, Gijsman and Ritchie2003), which was applied to a cotton field at the Texas A&M AgriLife Research Station at Chillicothe in the TRP region (34°15ʹ N, 99°31ʹ W, 447 m a.s.l.) during the 2020 growing season (May–October). The minimum weather data inputs required for the DSSAT model include daily T max and T min, precipitation and solar radiation. Historical weather data from an onsite weather station at Chillicothe were used to validate the forecasted seasonal weather data. Missing weather data were completed with the data recorded at the West Texas Mesonet weather station at Odell, Texas (Mesonet, 2021) and a National Climatic Data Center (NCDC) weather station at Vernon, Texas. Soil data, including texture, organic carbon content, bulk density, cation exchange capacity, total nitrogen, pH, hydraulic conductivity, field capacity, wilting point and saturated water content, were obtained from previous onsite measurements. Crop management information, including planting and harvest dates, tillage, irrigation and fertilizer and pesticide applications, was based on the practices adopted in the field experiment. The genotype coefficients for the cotton were adjusted during the model calibration process.
The DSSAT CROPGRO-Cotton module was calibrated and evaluated for this site by Himanshu et al. (Reference Himanshu, Ale, DeLaune, Singh, Mauget and Barnes2022) using field data from 2011 to 2020. The simulated soil water content at various soil depths (0–20, 20–40, 40–60, 60–80 and 80–140 cm) showed good agreement with measured values during the calibration and validation periods. For irrigated fields, the R 2 values ranged from 0.54 to 0.98 during calibration and from 0.33 to 0.66 during evaluation. The average percent error in seed cotton yield prediction was -0.3 and -10.9 % during the calibration and validation periods, respectively. More details about the model evaluation are available in Himanshu et al. (Reference Himanshu, Ale, DeLaune, Singh, Mauget and Barnes2022). Ale et al. (Reference Ale, Su, Singh, Himanshu, Fan, Stoker, Gonzalez, Sapkota, Adams, Biggers, Kimura and Wall2023) further performed a comprehensive assessment of the calibrated DSSAT model, focusing on its ability to predict seed cotton yield, irrigation amount and timing across various irrigation strategies. This assessment involved a 30-year simulation (1991–2020) that tested the model under different evapotranspiration (ET) replacement treatments (i.e., 0, 30, 60, 90 and 100 % ET replacements). Results suggest that DSSAT is robust in simulating the required irrigation amounts, effectively adapting to various weather scenarios and irrigation strategies (Figure A2, Supplementary Materials).
The evaluated CROPGRO-Cotton model was used to predict irrigation water requirements and seed cotton yield using both historical weather data and forecasted seasonal weather data (i.e., downscaled/multi-model mean data for the growing season) with a lead time of 0–5 months. Lead time refers to the number of months between the forecast date and target period being predicted. For example, a lead time of 0 months indicates a forecast for the current month, whereas a lead time of 5 months provides forecasts for five months into the future. The seasonal forecasts provide predicted daily weather conditions for the remaining growing season from the specific lead month (e.g., May for a lead of 5 months). For the period prior to the simulation date (e.g., January to May for a May simulation), observed historical weather data from three sources (i.e., West Texas Mesonet, NCDC and NARR) were used to fill in the weather inputs. A complete daily weather file was generated for each run by combining the observed historical data and forecasted weather data for the remaining season. This ensured continuity and accuracy in the weather inputs, allowing the crop model to simulate conditions dynamically as the season progressed. The simulations were conducted in real-time during the 2020 cotton growing season. The crop model was updated monthly with the latest available weather forecasts. Each run reflected the most current forecast data, and the simulations were terminated at the end of the growing season. For example, the model was initialized in May with a 5-month lead forecast and subsequently updated weather forecasts in June, July, August, September and October with lead times of 4, 3, 2, 1 and 0 months, respectively. At the end of the 2020 season, the predicted crop yield and irrigation requirements from each simulation were compared with the observed field data. Details of the field experiment are provided in Ale et al. (Reference Ale, Su, Singh, Himanshu, Fan, Stoker, Gonzalez, Sapkota, Adams, Biggers, Kimura and Wall2023) and Sapkota et al. (Reference Sapkota, Adams, Su and Ale2024).
The ET-based automatic irrigation algorithm in DSSAT was used to manage irrigation scheduling throughout the growing season. For ET estimation, the Priestley–Taylor method (Priestley and Taylor, Reference Priestley and Taylor1972) was used. Irrigation was triggered when the ET demand threshold reached 25 mm. To ensure realistic irrigation schedules, a minimum interval of three days was set between two irrigation events.
Model evaluation
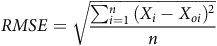
Root mean square error (RMSE) and relative error (RE) were used to evaluate the performance of the downscaling method and the DSSAT model, and these two statistics were estimated as
 $$ \mathrm{R}\mathrm{M}\mathrm{S}\mathrm{E}=\sqrt{{\sum _{i=1}^{n}{({X}_{i}-{X}_{oi})}^{2}}\over{n}}$$
 $$ \mathrm{R}\mathrm{E}\mathrm{}\left(\mathrm{\%}\right)=\mathrm{}{{({X}_{i}-{X}_{oi})}\over{{X}_{oi}}}\times 100$$
where $ {X}_{i}$
and
$ {X}_{i}$
and $ {X}_{oi}$
are the ith calculated data using the predicted weather variable/crop yield and observations from DAYMET/field data, respectively; and n is the number of observations. The RMSE and RE values closer to 0 indicate good method/model performance.
$ {X}_{oi}$
are the ith calculated data using the predicted weather variable/crop yield and observations from DAYMET/field data, respectively; and n is the number of observations. The RMSE and RE values closer to 0 indicate good method/model performance.
Results
Evaluation of the downscaling method for the reference period (1982–2010)
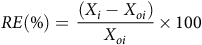
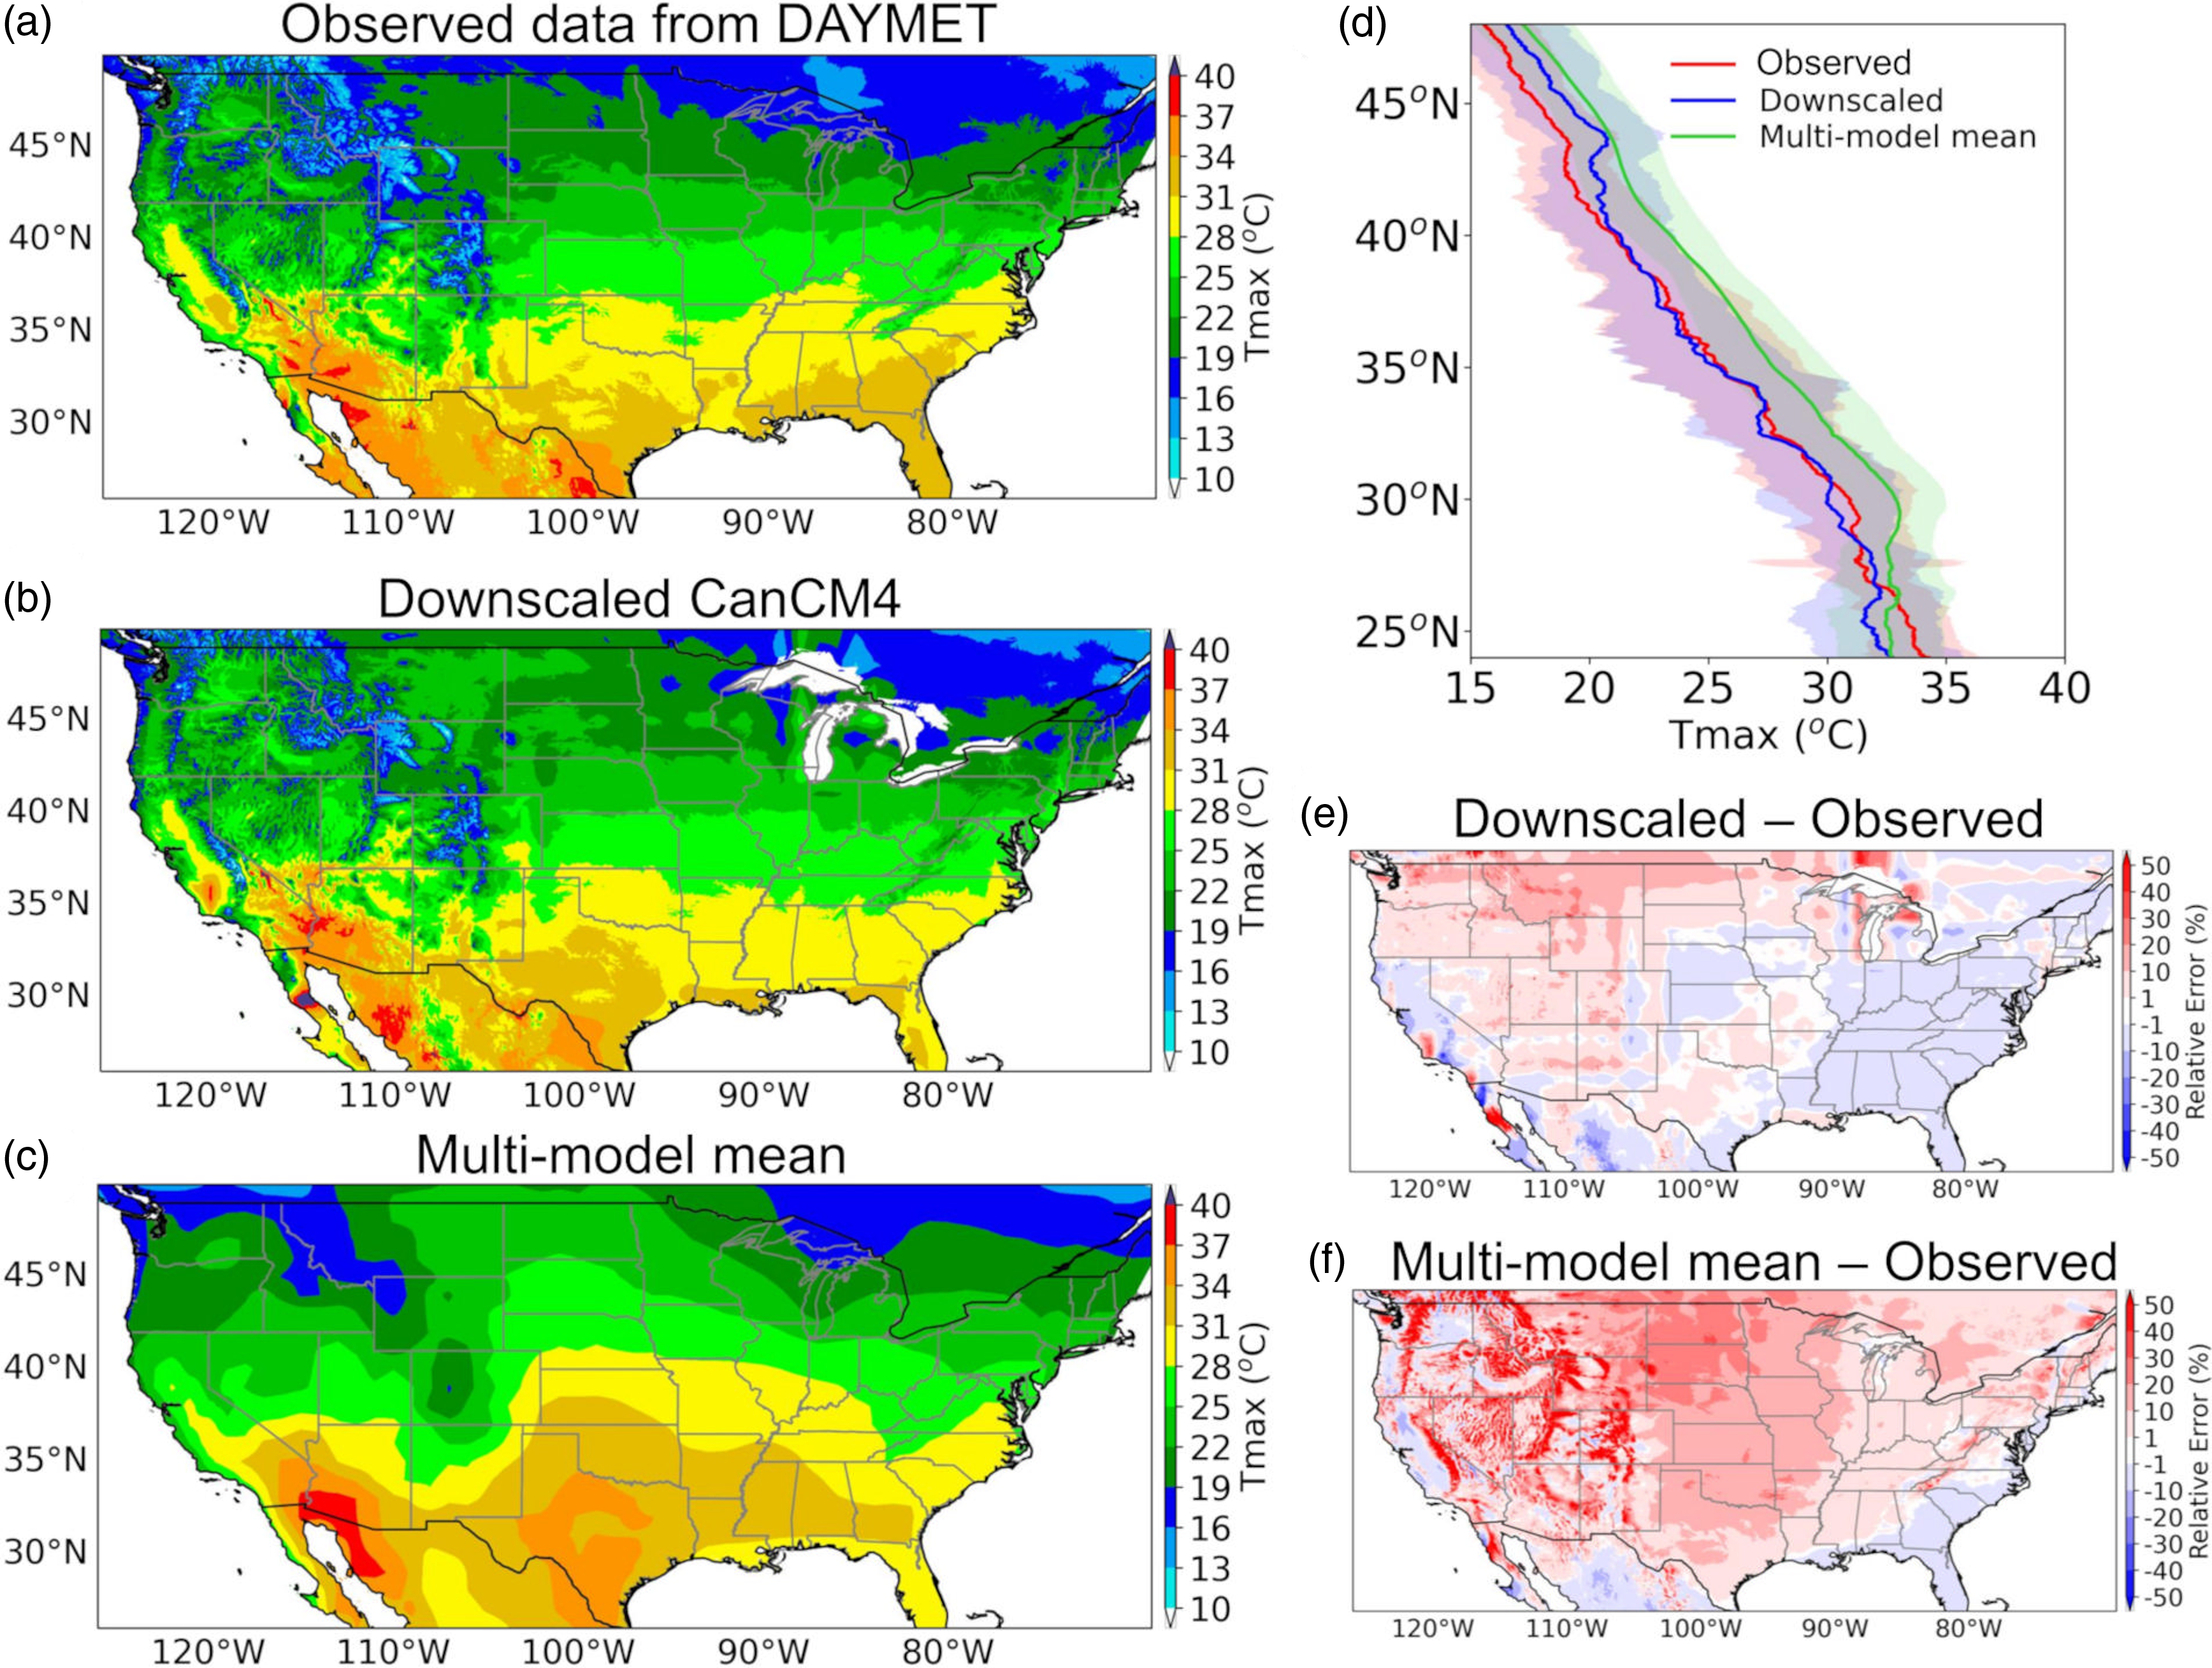
The hindcast of the raw CanCM4 output greatly overestimated T max in most regions compared with the DAYMET observations (Figure 2a–c). The most significant overestimation was found around the Rocky Mountains (by 50 %, Figure 2d), followed by Kansas, Nebraska and Iowa (by 40%). Underestimation was found in the Great Lakes region (by 50 %), Washington (by 20 %), California (by 20 %) and Florida (<10 %). From seasonal variations (Figure 2e), it was found that the raw CanCM4 output overestimated T max from June to September by as high as 5 ºC.
Comparison of hindcast predictions of mean maximum temperature in the growing season (May to October) using different methods. Long-term (1982–2010) seasonal mean T max using (a) observed data from DAYMET; (b) CanCM4 data; (c) downscaled CanCM4 data; (d) relative error (%) of the raw CanCM4 data relative to the observed data and (e) their mean seasonal variations. Note that the mean maximum temperature of hindcast predictions of the downscaled CanCM4 is the same as that of the observed data from DAYMET.
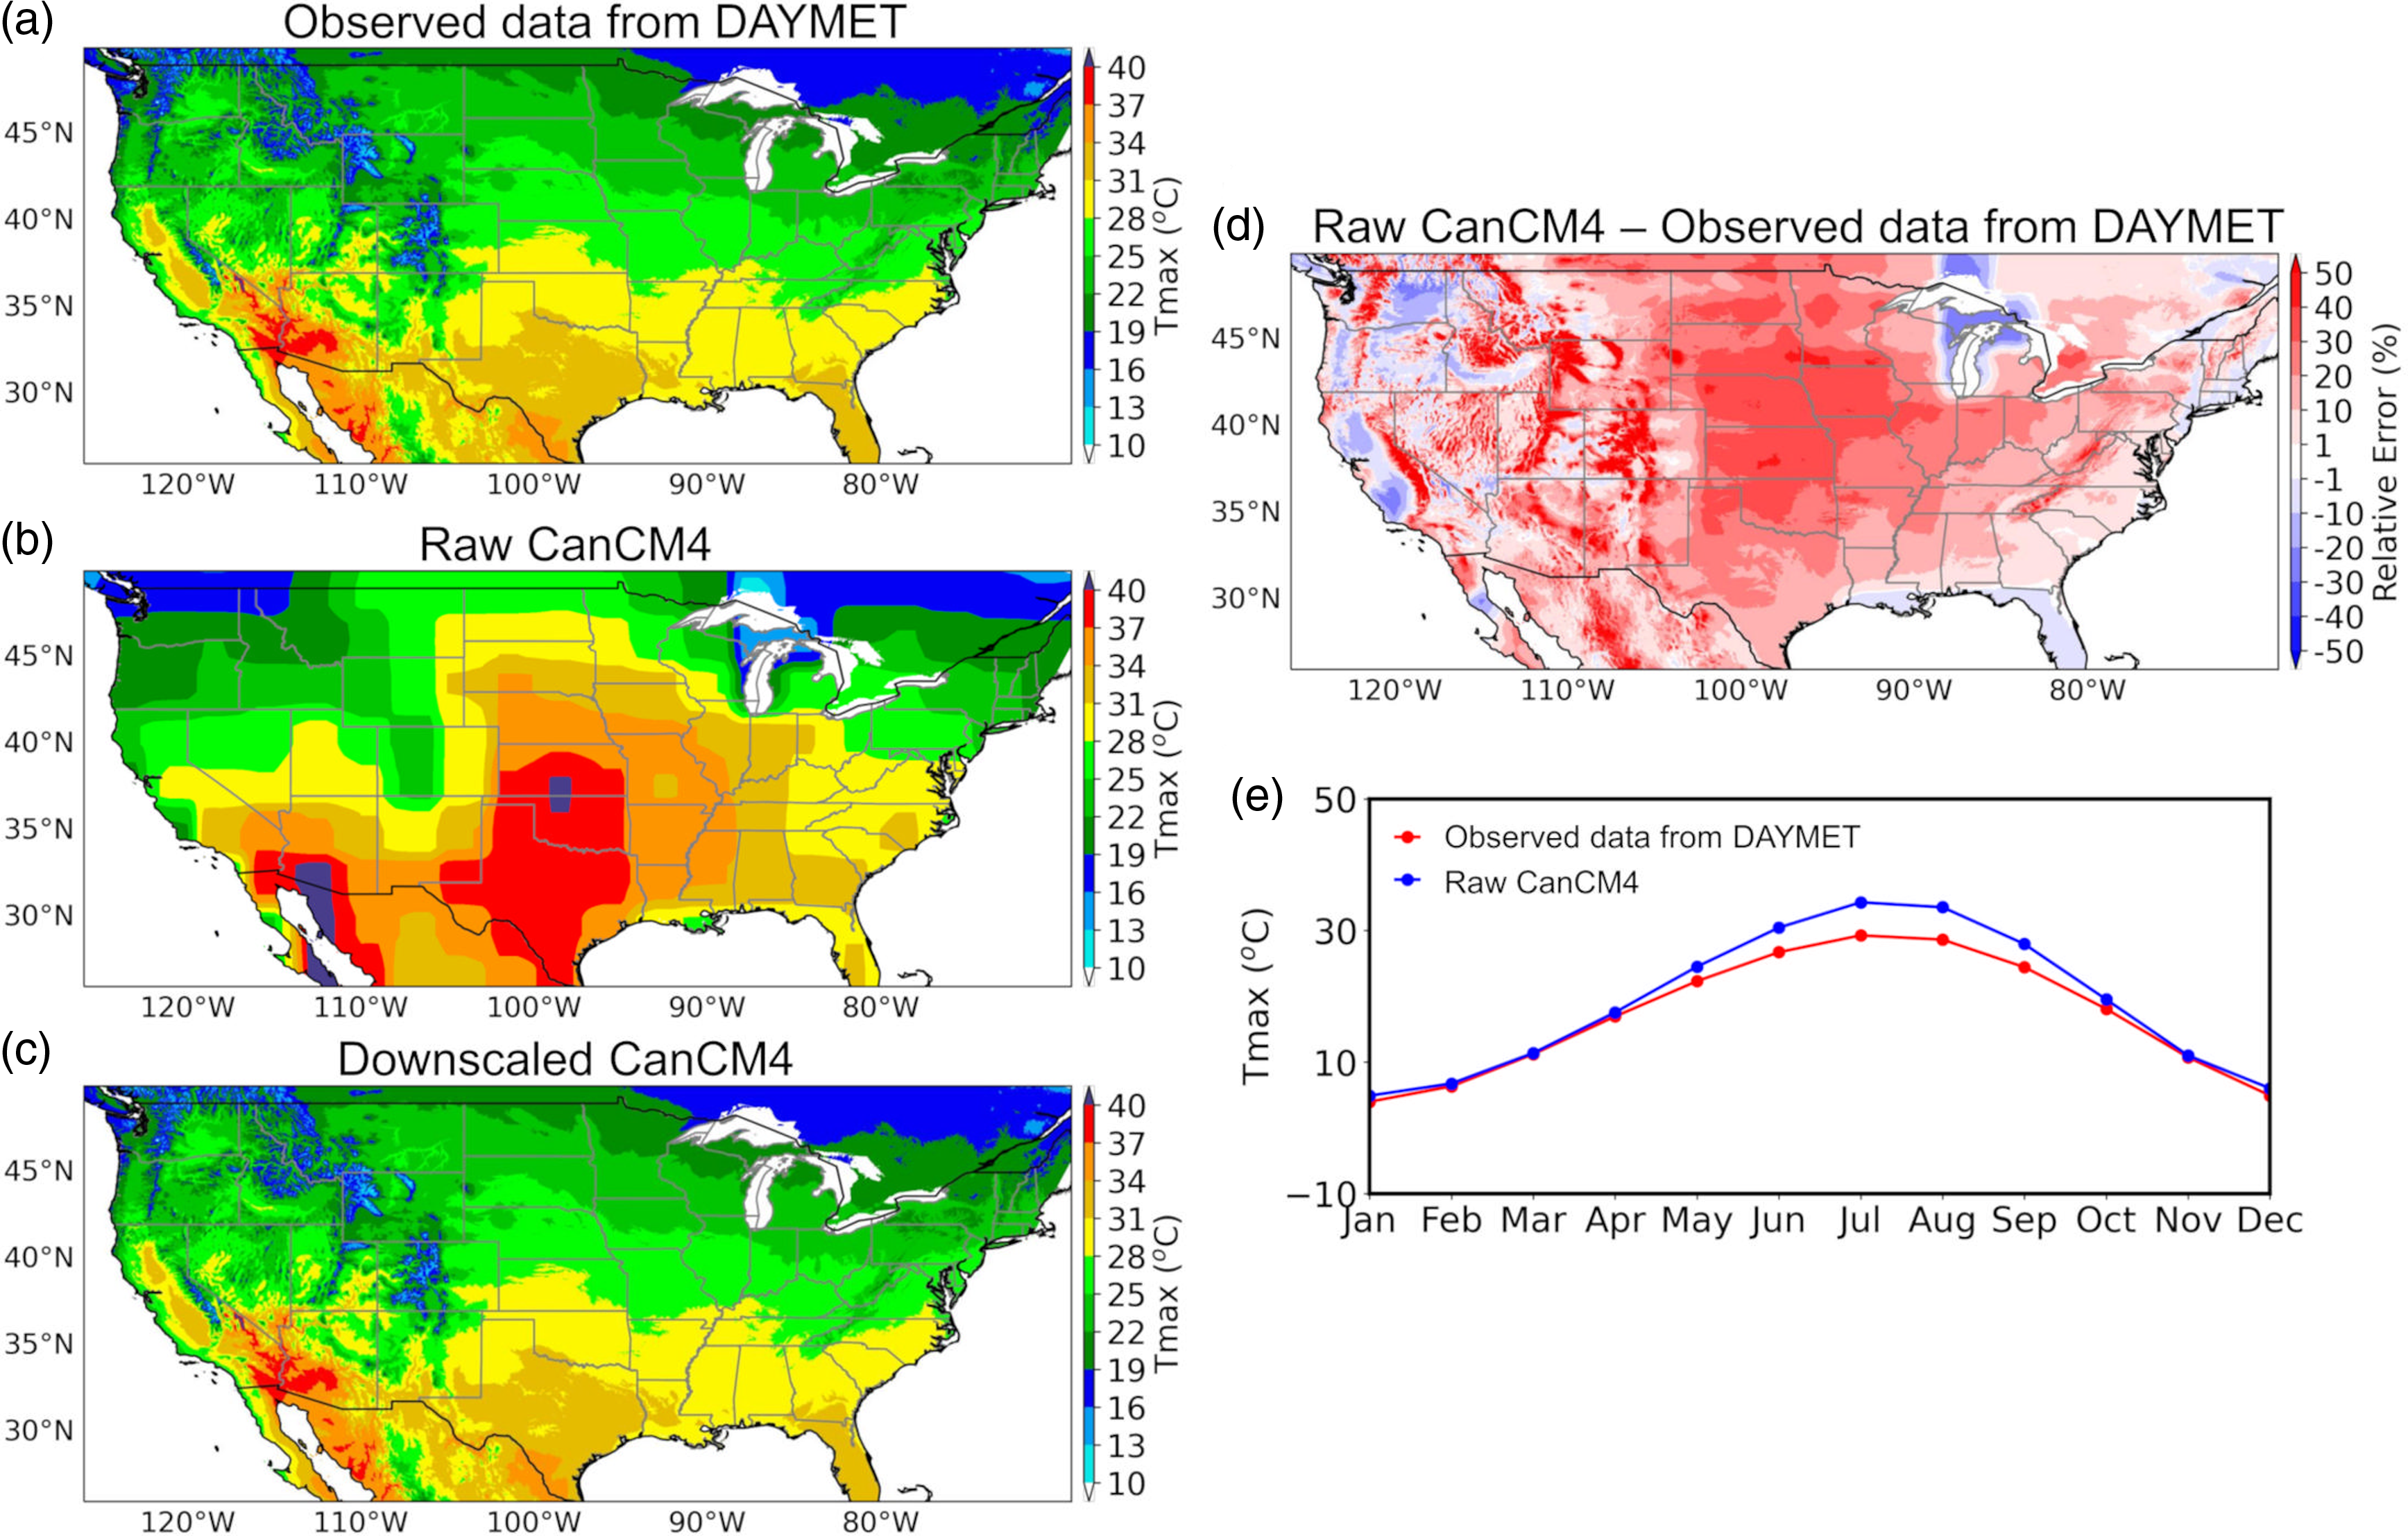
Significant overestimation was also noticed for T min (Figure 3a–d), with a consistent overestimation of around 3 ºC throughout the year (Figure 3e). The overestimation of T min by the raw CanCM4 output was more significant in the northern regions (by 50 %) than in the southern regions (by 20–30 %, Figure 3d).
Comparison of hindcast predictions of mean minimum temperature in the growing season (May–October) using different methods. Long-term (1982–2010) seasonal mean T min using (a) observed data from DAYMET; (b) CanCM4 data; (c) downscaled CanCM4; (d) relative errors (%) of the raw CanCM4 data relative to the observed data and (e) their mean seasonal variations. Note that the mean minimum temperature of hindcast predictions of the downscaled CanCM4 is the same as that of the observed data from DAYMET.
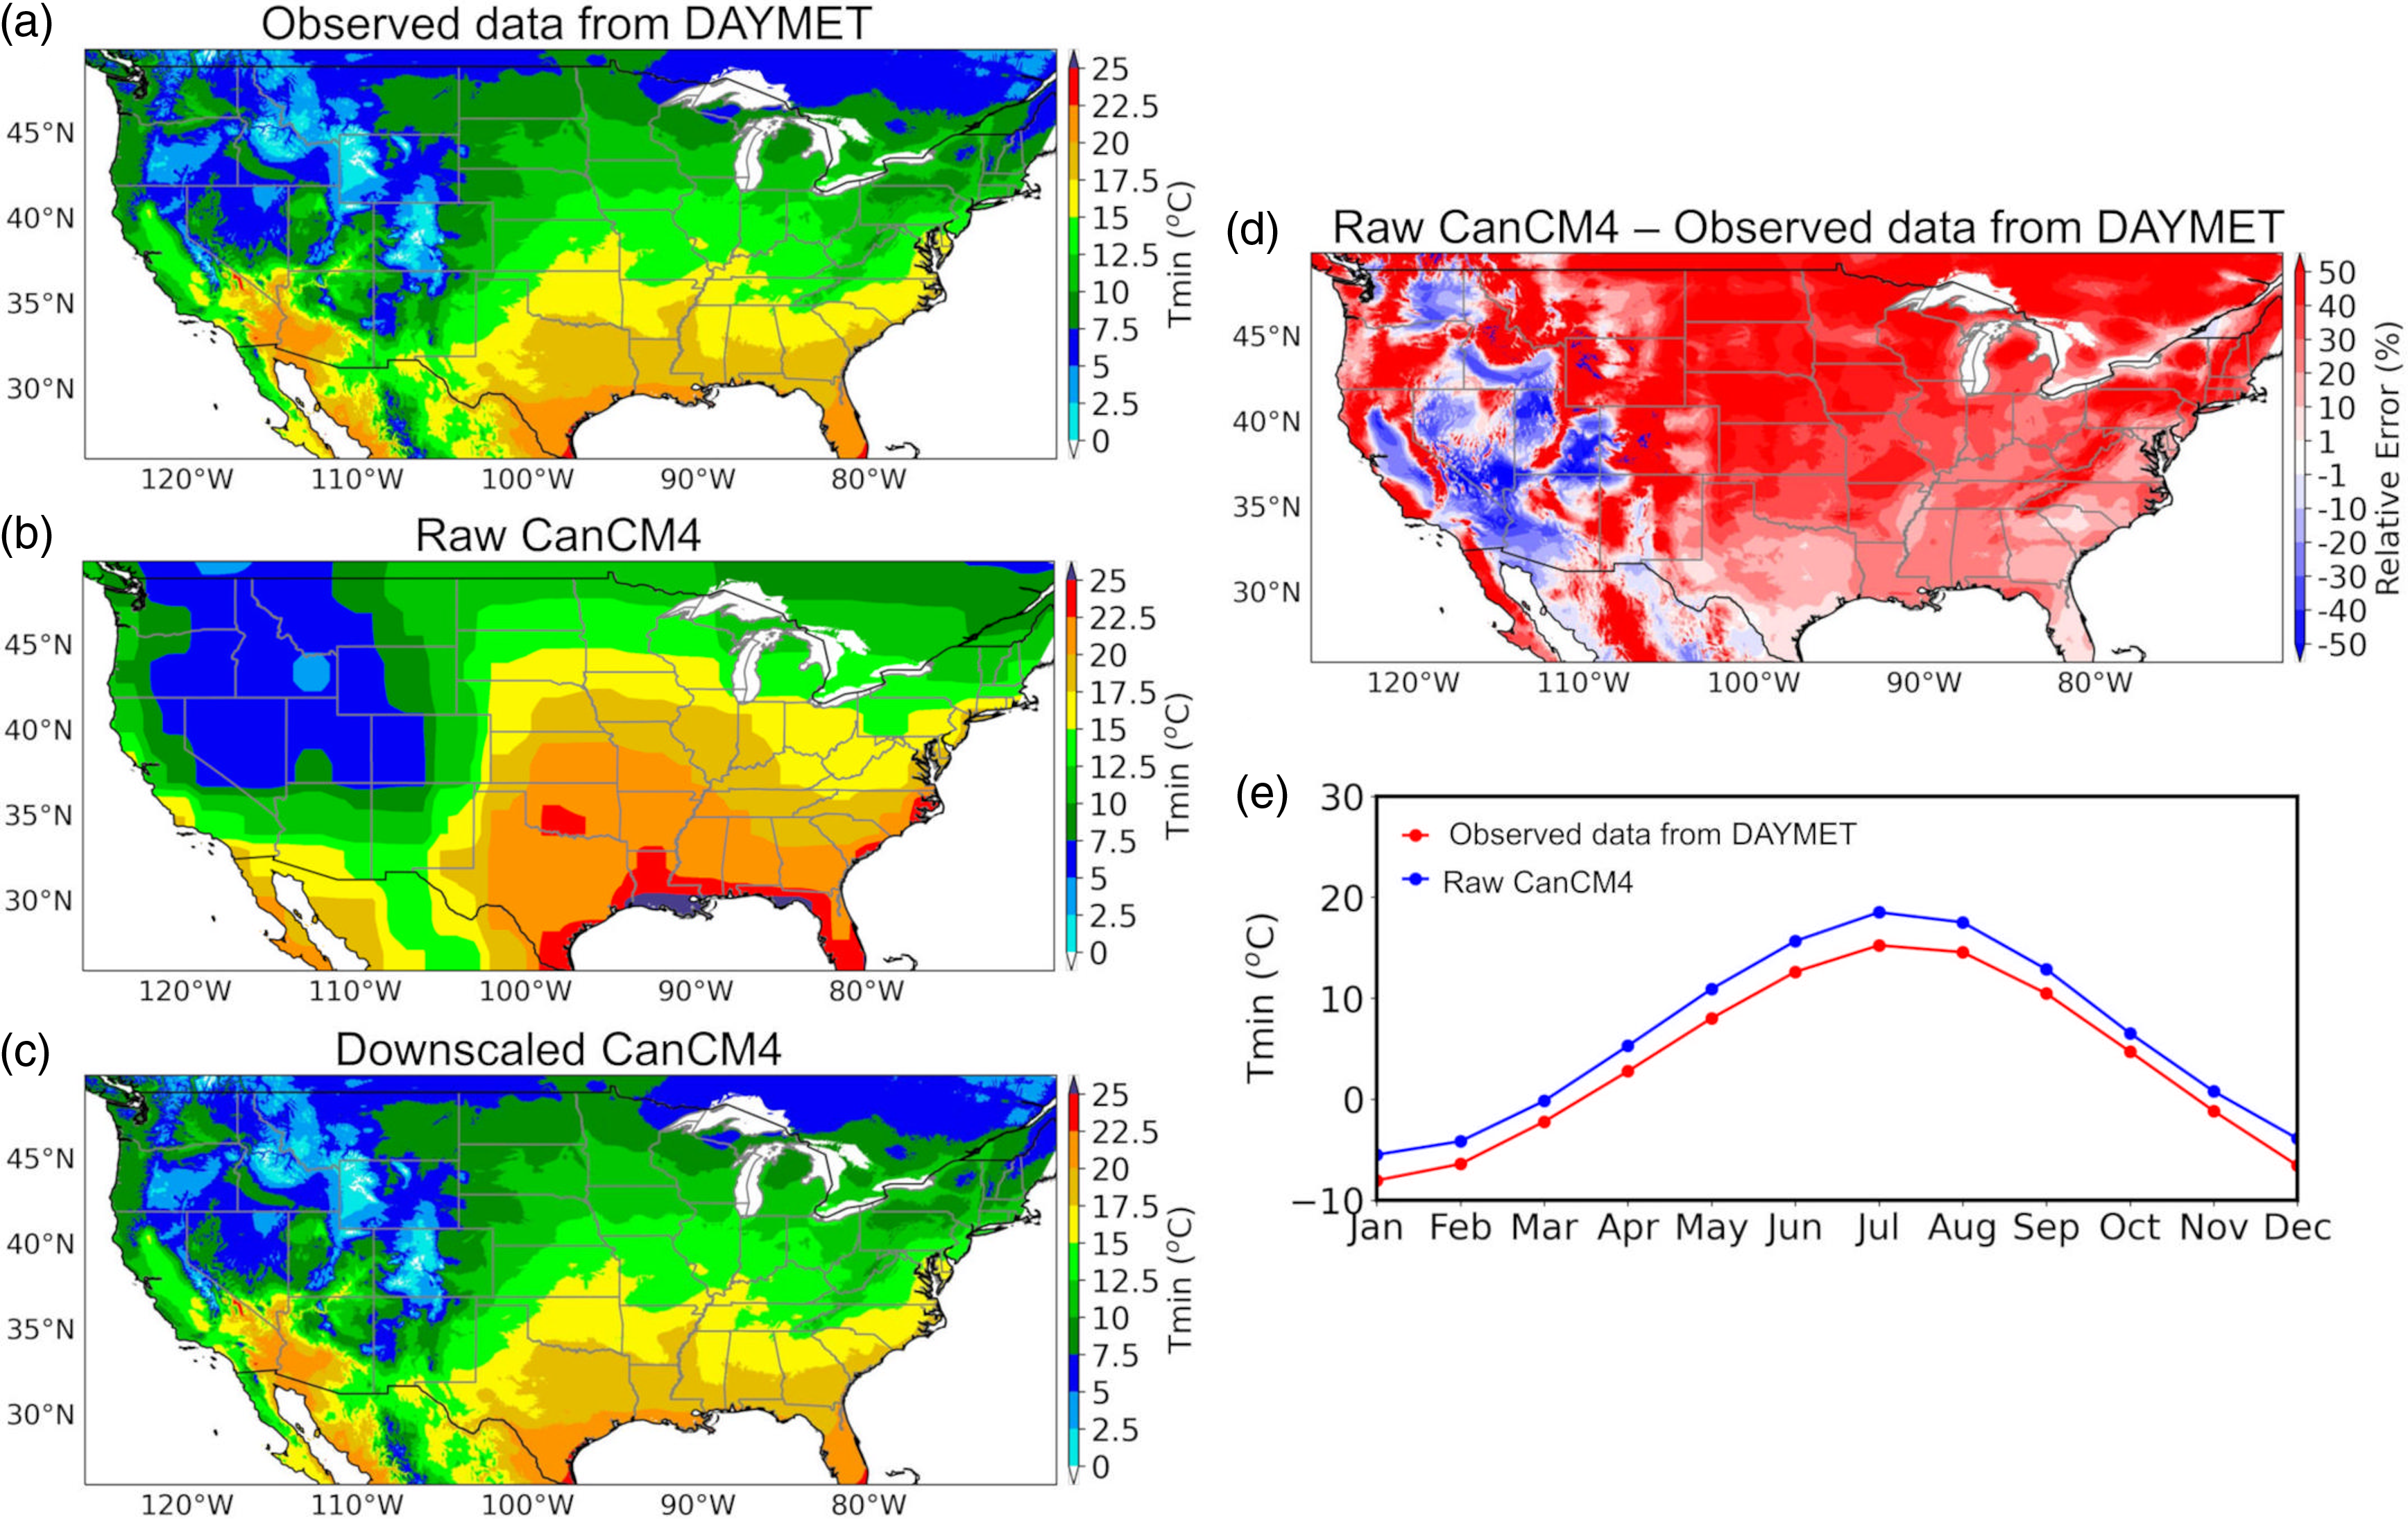
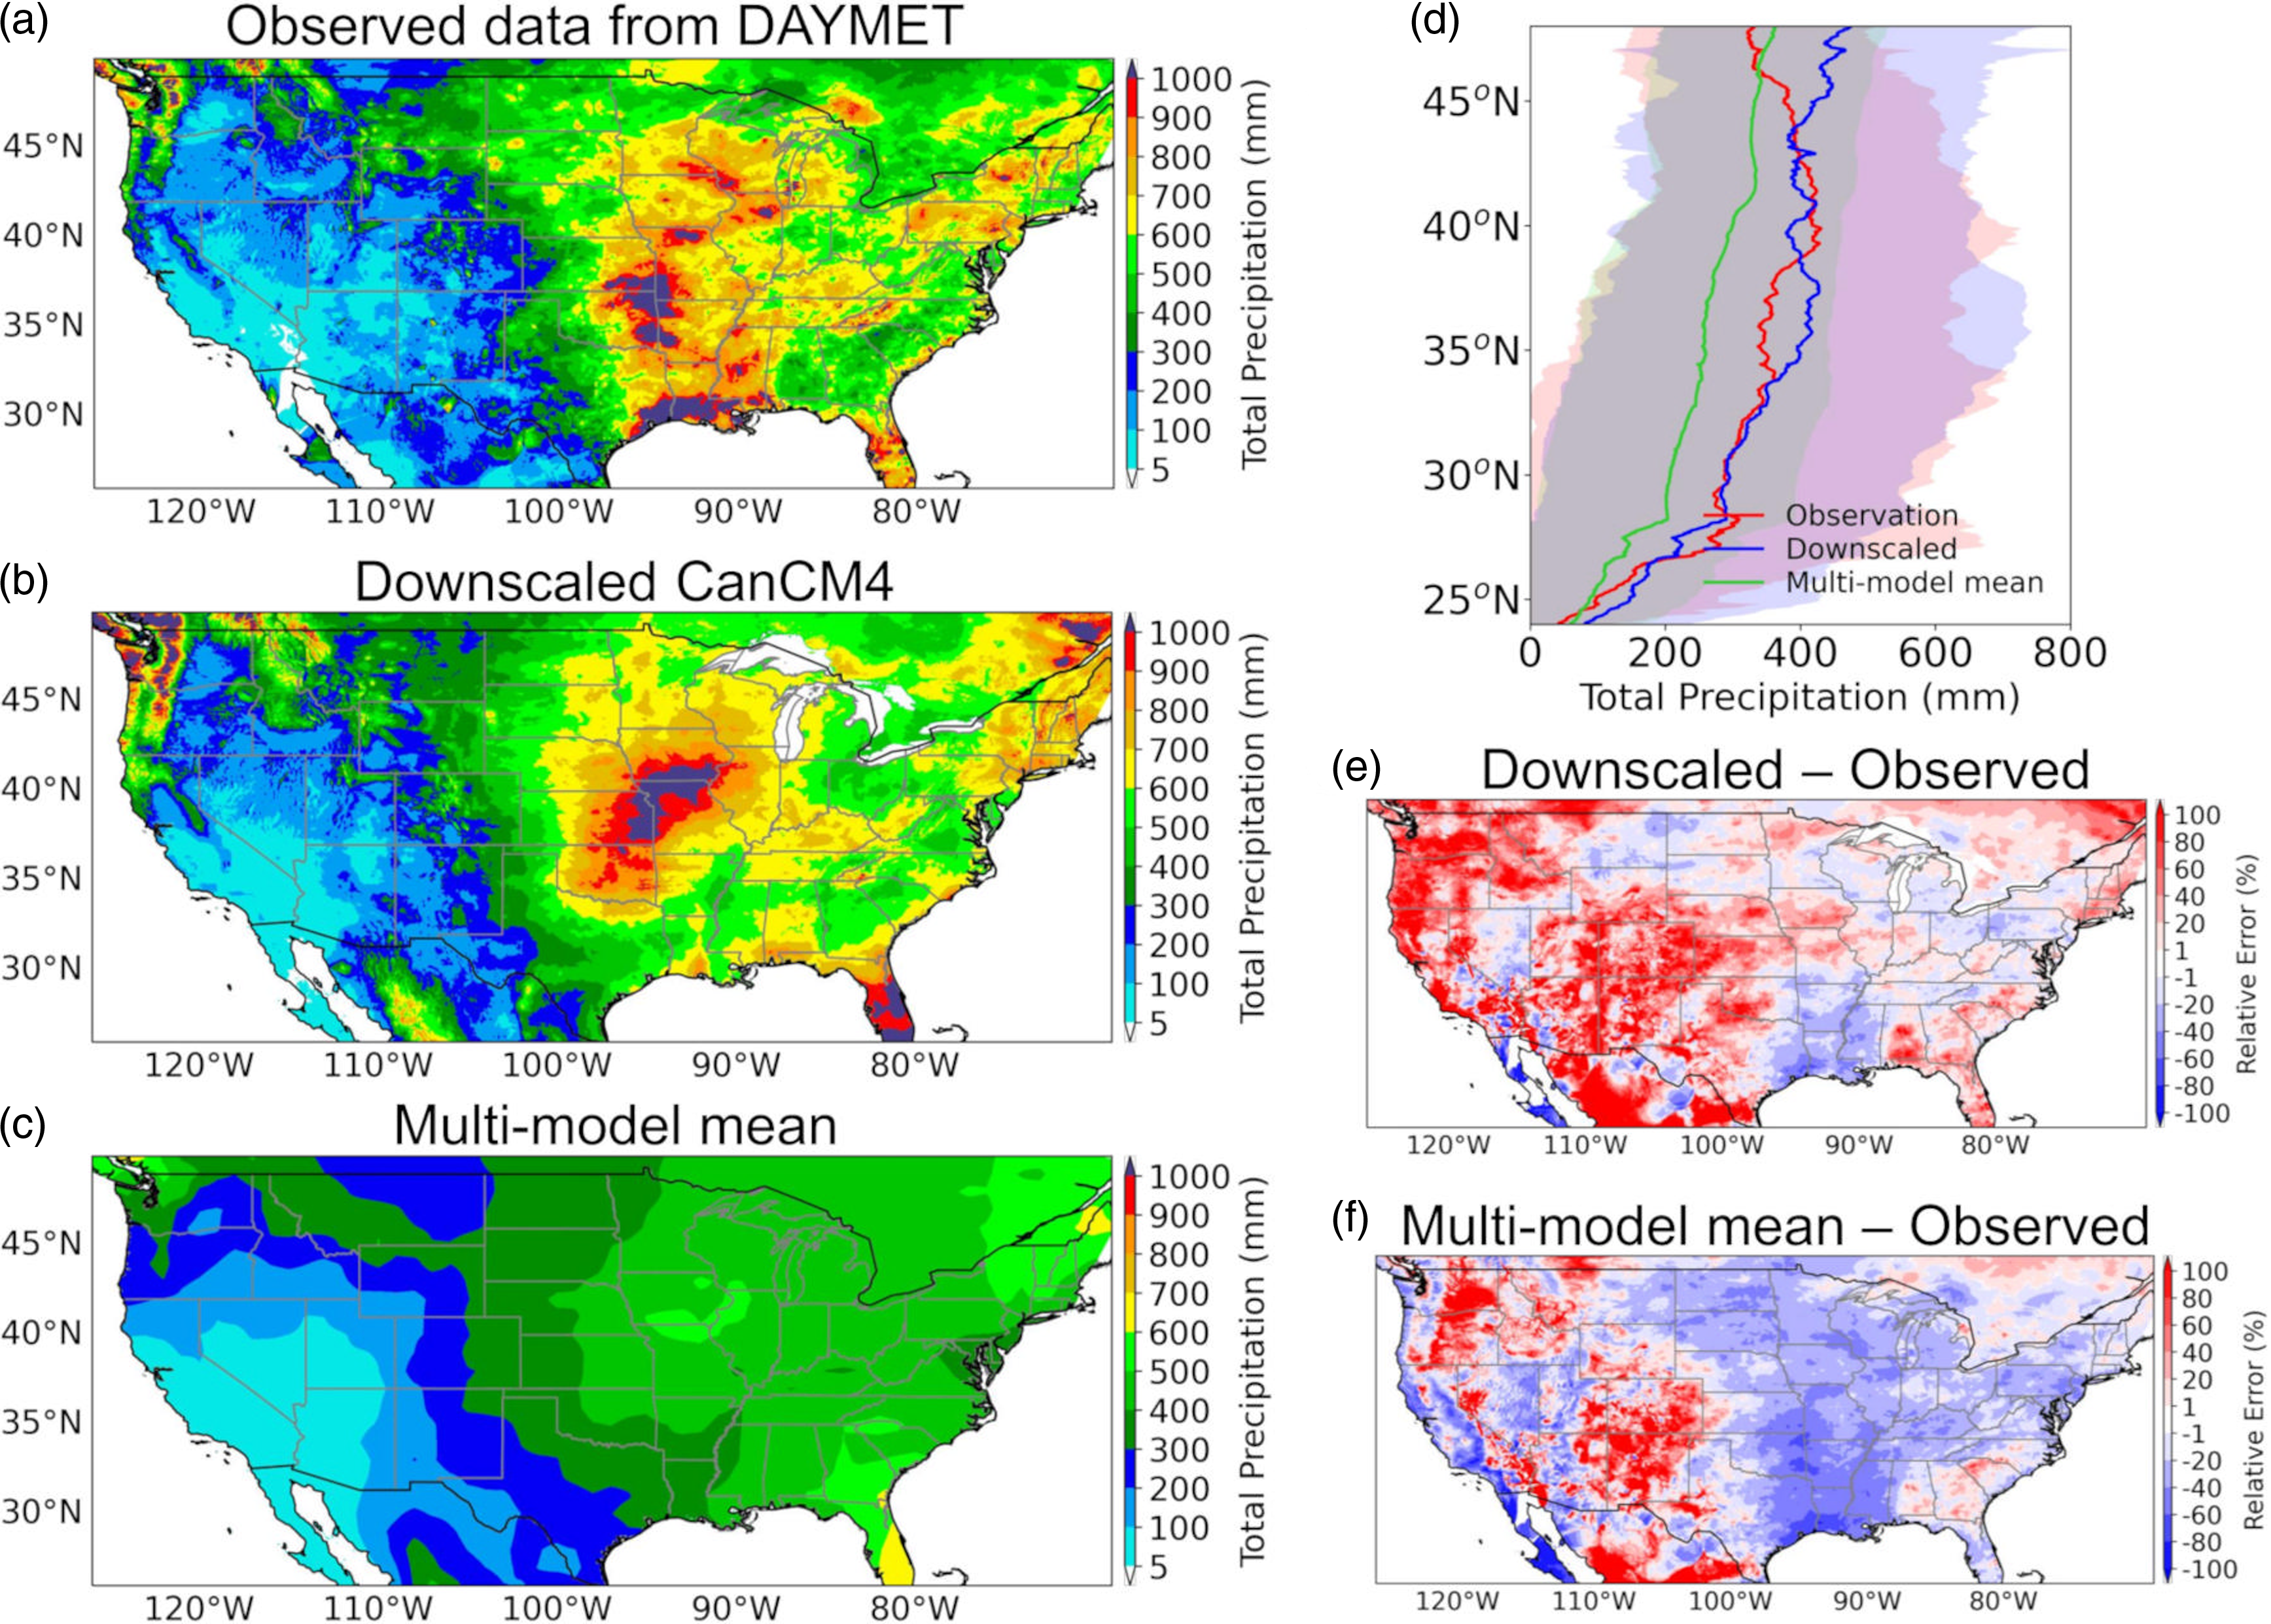
Precipitation data from the raw output of CanCM4 also showed pronounced differences over short distances in regions characterized by complex topography, including the Rocky Mountains and the Appalachian Mountains (Figure 4a–d). Models performed better in cool seasons than in warm seasons (Figure 4e). Slight overestimation was found in cool seasons (February–April) and large underestimation in warm seasons, particularly during the summer growing season, with an average of around 30 mm per month.
Comparison of hindcast predictions of the total precipitation in the growing season (May–October) using different methods. Long-term (1982–2010) mean total seasonal precipitation from (a) observed data from DAYMET; (b) CanCM4 data; (c) downscaled CanCM4; (d) relative errors (%) of the raw CanCM4 data relative to the observed dat and (e) their mean seasonal variations. Note that the mean total precipitation of hindcast predictions of the downscaled CanCM4 is the same as that of the observed data from DAYMET.
Post-processing of the raw CanCM4 outputs was therefore required before using that data for crop yield prediction and seasonal irrigation management. The calibration parameters used to downscale the raw CanCM4 outputs of T max, T min and precipitation at 1 km resolution are documented in NetCDF files, which can be easily used in other studies. The spatial distribution of these parameters is shown in Supplementary Figs. A3-5. As expected, the downscaled CanCM4 outputs successfully replicated the long-term means (1982–2010) of the observed T max, T min and precipitation data from DAYMET (Figures 2–4), demonstrating the validity of the downscaling method used.
Downscaling method versus multi-model mean (2019)
Before applying the 2020 seasonal weather forecasts in crop modelling for the 2020 growing season, a comprehensive evaluation of the downscaling method was conducted using 2019 data. This evaluation included: (1) comparing its performance with the multi-model mean approach at the regional scale, (2) assessing its performance across different lead times at the regional scale and (3) evaluating its effectiveness at local scale predictions for both the reference period and 2019. Grid-scale comparisons of T max, T min and total precipitation were made for the 2019 growing season (excluding August, due to data unavailability) using observations from DAYMET (Figures 5–7). The observed seasonal mean T max in 2019 was 23.8 ± 6.2 °C and the downscaled CanCM4 forecasts showed high consistency with observations, with a seasonal mean of 24.1 ± 5.7 °C. The downscaled method overestimated the seasonal mean T max in 2019 by 1.2 % on average compared with the observations. Most positive deviations were found in the western regions, except for California, while the eastern regions exhibited predominantly negative deviation (within 10 %) (Figure 5e). The spatial distribution of RE in downscaled T max data for each month is shown in Supplementary Figure A6. The multi-model mean forecasts showed a large positive deviation (about 2 °C) in most regions, with a seasonal mean of 25.6 ± 5.7 °C (Figure 5f), which was also inferred in the latitudinal profiles (Figure 5d). The overestimation of T max by the multi-model mean was significantly higher in the western regions, followed by the central and eastern regions, showing similar regional patterns as in the CanCM4 hindcasts (Figure 2e). The multi-model mean performed slightly better in the central and eastern regions than a single model, but overall, the T max forecast skill of the multi-model mean was inferior.
Comparison of mean maximum temperature forecast in the growing season (May–October) in 2019 using different methods. Seasonal mean T max using (a) observed data from DAYMET; (b) downscaled CanCM4; (c) multi-model mean; (d) latitudinal profiles of seasonal mean T max. Color lines indicate the mean value per degree latitude for T max from the three different methods. Shading denotes the standard deviation and relative errors (%) of seasonal mean T max of (e) downscaled CanCM4 and (f) multi-model mean relative to the observation. Note that the August data is not included due to non-availability.
Comparison of mean minimum temperature forecast in the growing season (May–October) in 2019 using different methods. Seasonal mean T min using (a) observed data from DAYMET; (b) downscaled CanCM4; (c) multi-model mean; (d) latitudinal profiles of seasonal mean T min. Colour lines indicate the mean value per degree latitude for T min from the three different methods. Shading denotes the standard deviation and relative errors (%) of seasonal mean T min of (e) downscaled CanCM4 and (f) multi-model mean relative to the observation. Note that the August data are not included due to non-availability.

Comparison of total precipitation forecast in the growing season (May–October) in 2019 using different methods. Seasonal mean T min using (a) observed data from DAYMET; (b) downscaled CanCM4; (c) multi-model mean; (d) latitudinal profiles of seasonal precipitation. Colour lines indicate the mean value per degree latitude for precipitation from the three different methods. Shading denotes the standard deviation and relative errors (%) of seasonal precipitation of (e) downscaled CanCM4 and (f) multi-model mean relative to the observation. Note that the August data is not included due to non-availability.
The multi-model mean forecast significantly overestimated T min, with an average positive deviation of 2.6 °C (13.0 ± 5.2 °C) compared to the observation (10.6 ± 5.9 °C) (Figure 6), a 23 % overestimation. In contrast, the downscaled forecast yielded a seasonal mean T min of 10.4 ± 5.3 °C, which is less than 2 % underestimation (0.2 °C) compared to observations, indicating a marked improvement over the multi-model mean forecast. The RE of the seasonal and monthly mean T min of the downscaled method showed a similar pattern as T max forecast and monthly comparison is shown in Supplementary Figure A7. Similar to T max forecast, the multi-model mean of T min performed slightly better in the central and eastern regions than using a single model, but the overall forecast skill did not show significant improvement.
The seasonal total precipitation in 2019, excluding August due to the unavailability of NMME forecast data, was 309 ± 282 mm (Figure 7a). The downscaled CanCM4 forecast (336 ± 292 mm) captured the geographical pattern of observations well, albeit with a slight overestimation of 9 % on average (Figure 7b and e). However, the multi-model mean showed overestimation in western regions and underestimation in the central regions of the United States, with an overall 18% underestimation (254 ± 192 mm) in seasonal precipitation (Figure 7c,f). The underestimation was more significant in warmer months, such as September and October (Figure A8, Supplementary Materials).
Overall, the latitudinal profile of downscaled seasonal total precipitation showed good agreement with observations and outperformed the multi-model mean (Figure 7d). However, at a local scale, the downscaled CanCM4 forecast exhibited high variability, particularly with a significant overestimation in western regions. This led to a 50 mm overestimation between latitudes 34° and 38°N, as well as above 45°N (Figure 7d and e).
Figures 5–7 revealed that the downscaled CanCM4 data exhibited better performance than the multi-model mean in forecasting T max , T min and precipitation at the regional scale. Therefore, the downscaled method used in this study could be very useful for regional scale real-time crop modelling after giving careful attention to the relatively high variability of precipitation forecast at local scales.
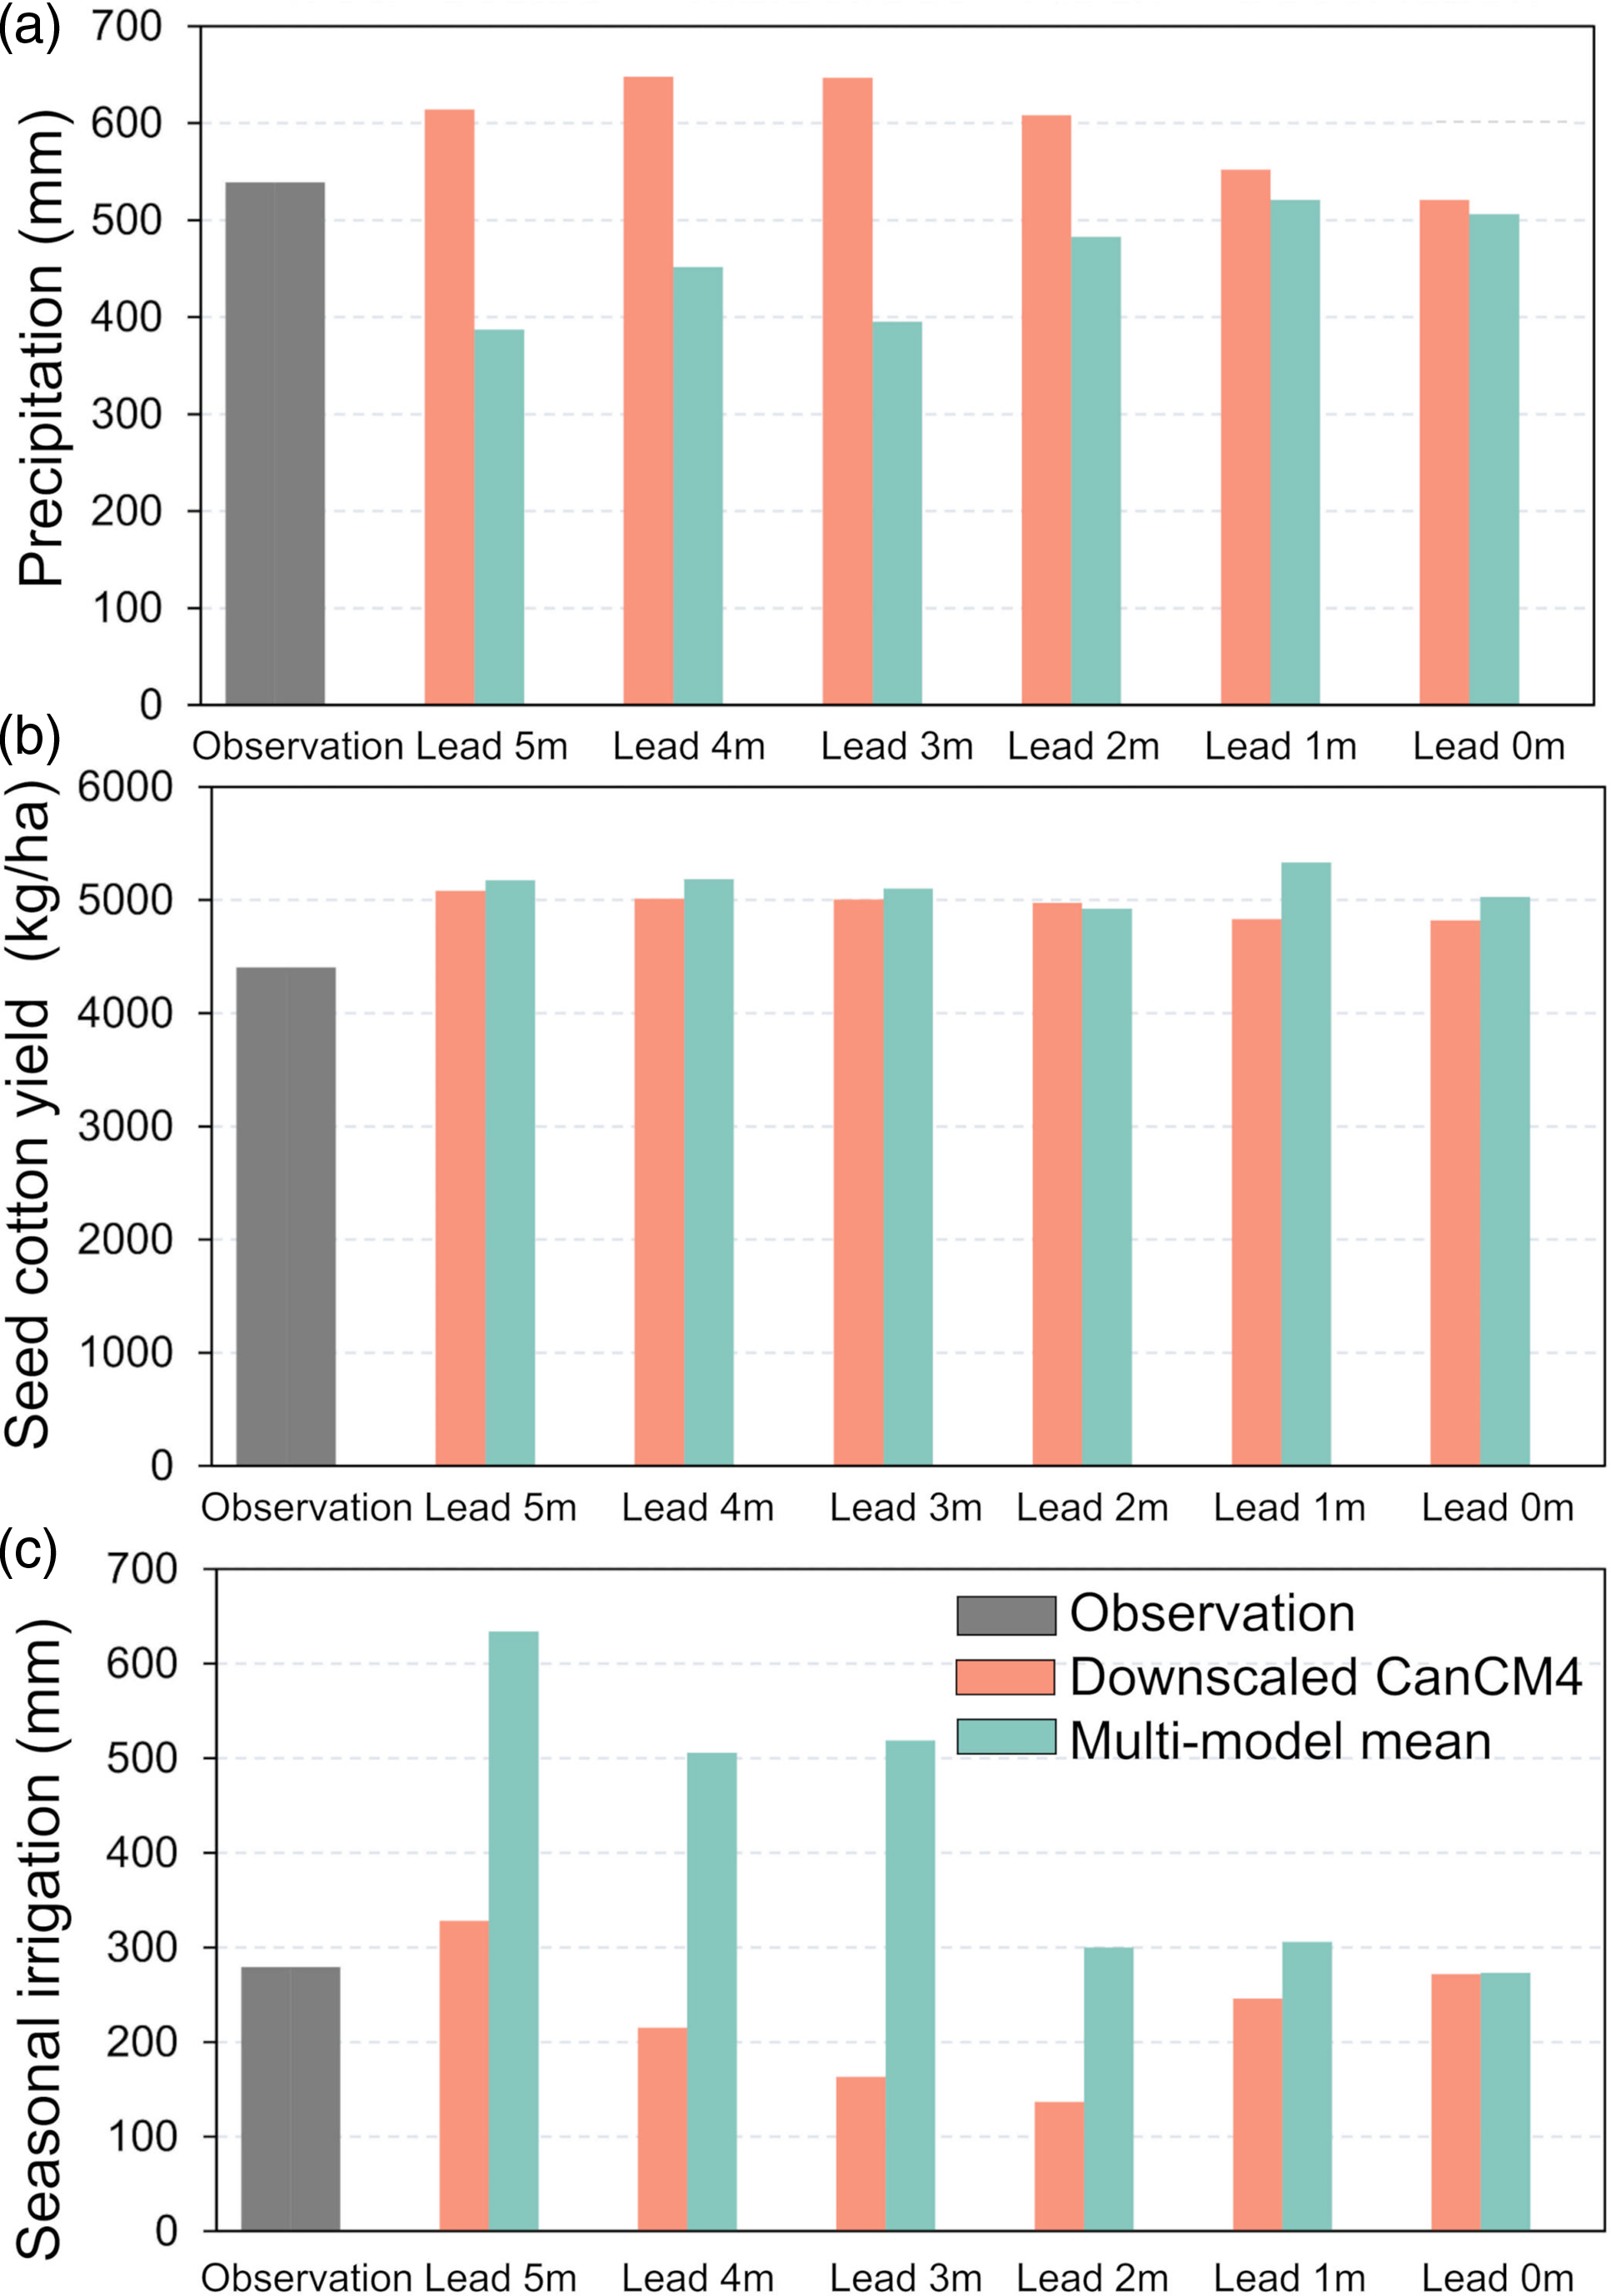
To evaluate the performance of the downscaling method and the multi-model mean in real-time seed cotton yield and seasonal irrigation prediction, forecasts at different lead times were examined (Figure 8). The downscaling method outperformed the multi-model mean in predicting seasonal precipitation, irrigation requirement and seed cotton yield. At the start of the growing season in May 2020 (lead time of 5 months), the downscaling method provided reasonable forecasts for rainfall and predictions of yield and seasonal irrigation, with RE of 14–18 %. As time proceeded, the forecasts improved and became closer to the observed values. It is worth noting that the irrigation demand predicted by the downscaling method showed relatively high variability due to the combined effects of rainfall and temperature predictions, but the variation was still significantly less than that of the multi-model mean.
Comparisons of (a) seasonal precipitation, (b) seed cotton yield and (c) seasonal irrigation predictions using the downscaled CanCM4 and multi-model mean in the 2020 growing season (May–October) at the Chillicothe station at different lead times.
Predictions at different lead times (2019)
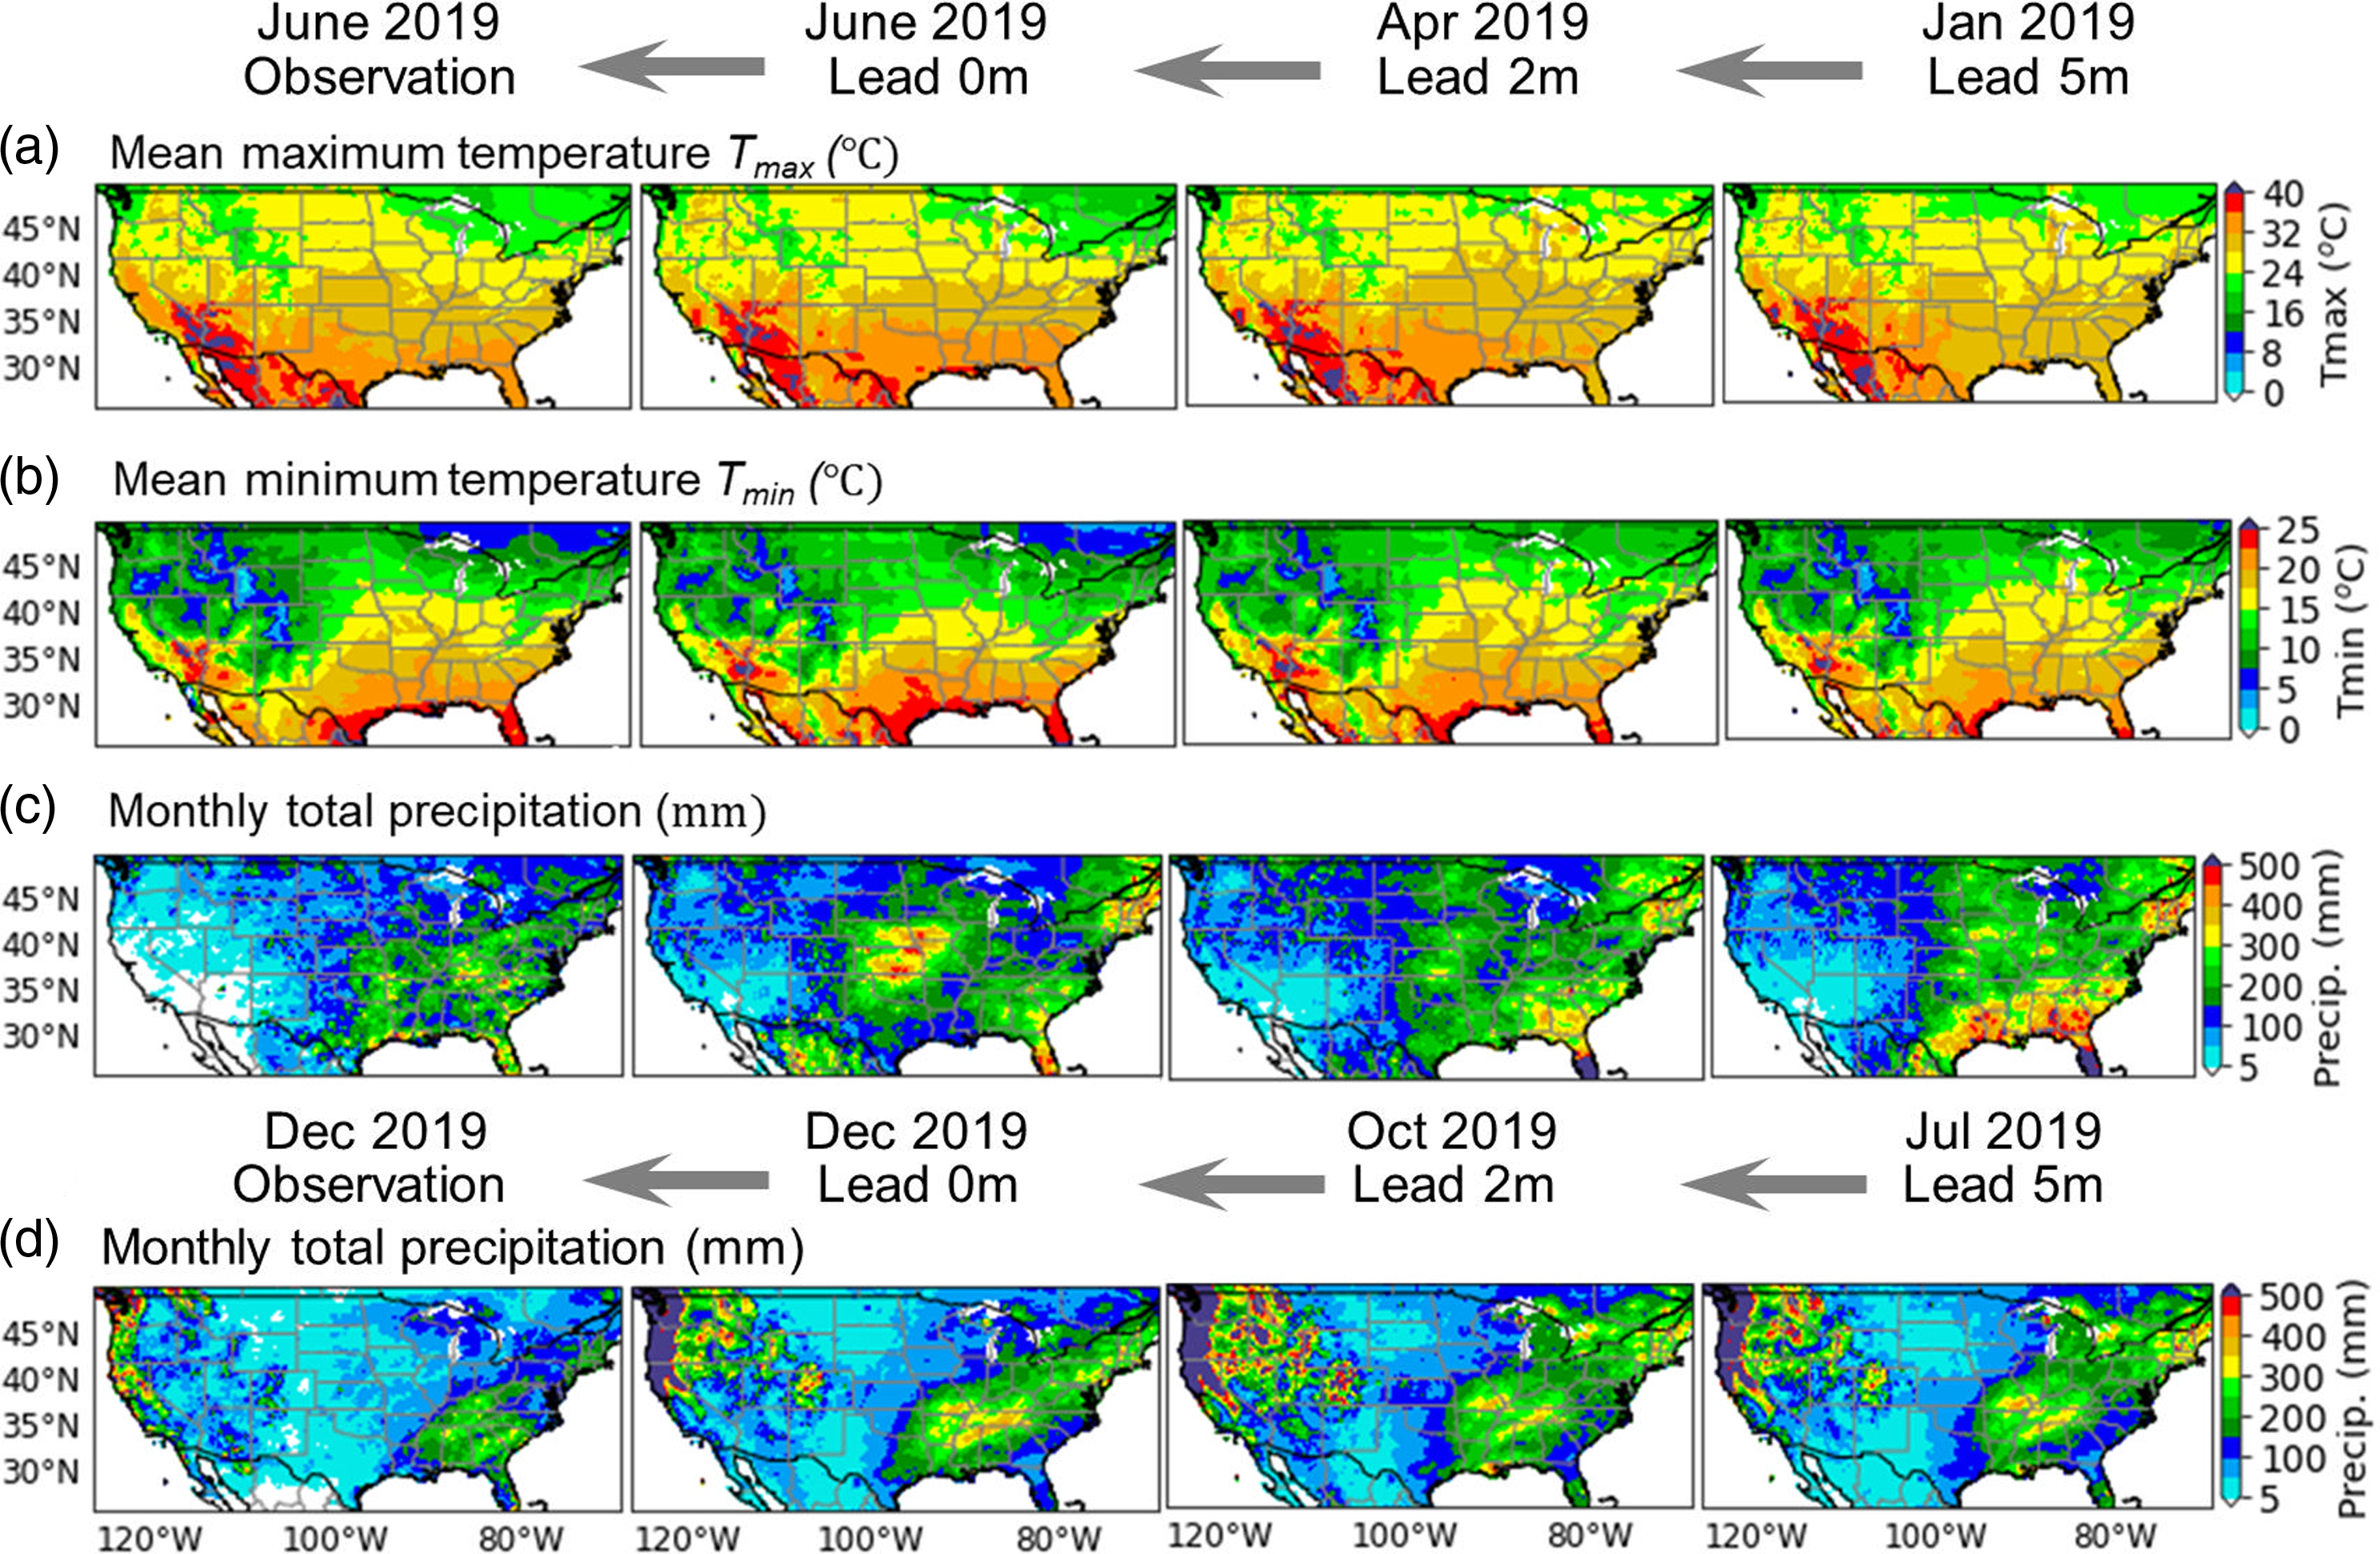
Additionally, to investigate the reliability of the downscaling method at different lead times, predictions with a lead time ranging from 0 to 5 months were analysed. Cotton growing season in the TRP region typically starts in May and continues until October, which suggests a maximum lead time of five months. Here, the predictions in June 2019 at different lead times were taken as an example (Figure 9a–c). Results indicated that the downscaling signature of T max and T min could be persistent for a relatively long lead time, as much as five months. However, the downscaling signature for precipitation diminished quickly as the lead time increased, particularly in warm seasons (Figure A9, Supplementary Materials). However, the decline of the downscaling signature in precipitation was not evident in cold seasons. Precipitation forecasts in cold months, such as in December, exhibited fairly good performance (Figure 9d).
Predictions of (a) mean maximum temperature; (b) mean minimum temperature; and (c) total precipitation for June 2019, and (d) total precipitation for December 2019 at different lead times using the downscaled method.
Cross-validation at local scales (1982–2010 and 2019)
To test the forecast skill of the downscaling method at local scales, cross-validation was performed for both hindcast and forecast periods at the Chillicothe research station (Figures 10–11). During the hindcast period, the downscaling method notably improved the forecast skill of the raw CanCM4 outputs. The RMSE of T
max, T
min and seasonal precipitation reduced from 6.3°C, 4.1°C and 290 mm (the raw CanCM4) to 2.2°C, 1.6°C and 203 mm (the downscaled CanCM4), respectively. Precipitation forecasts displayed greater variability than did T
max and T
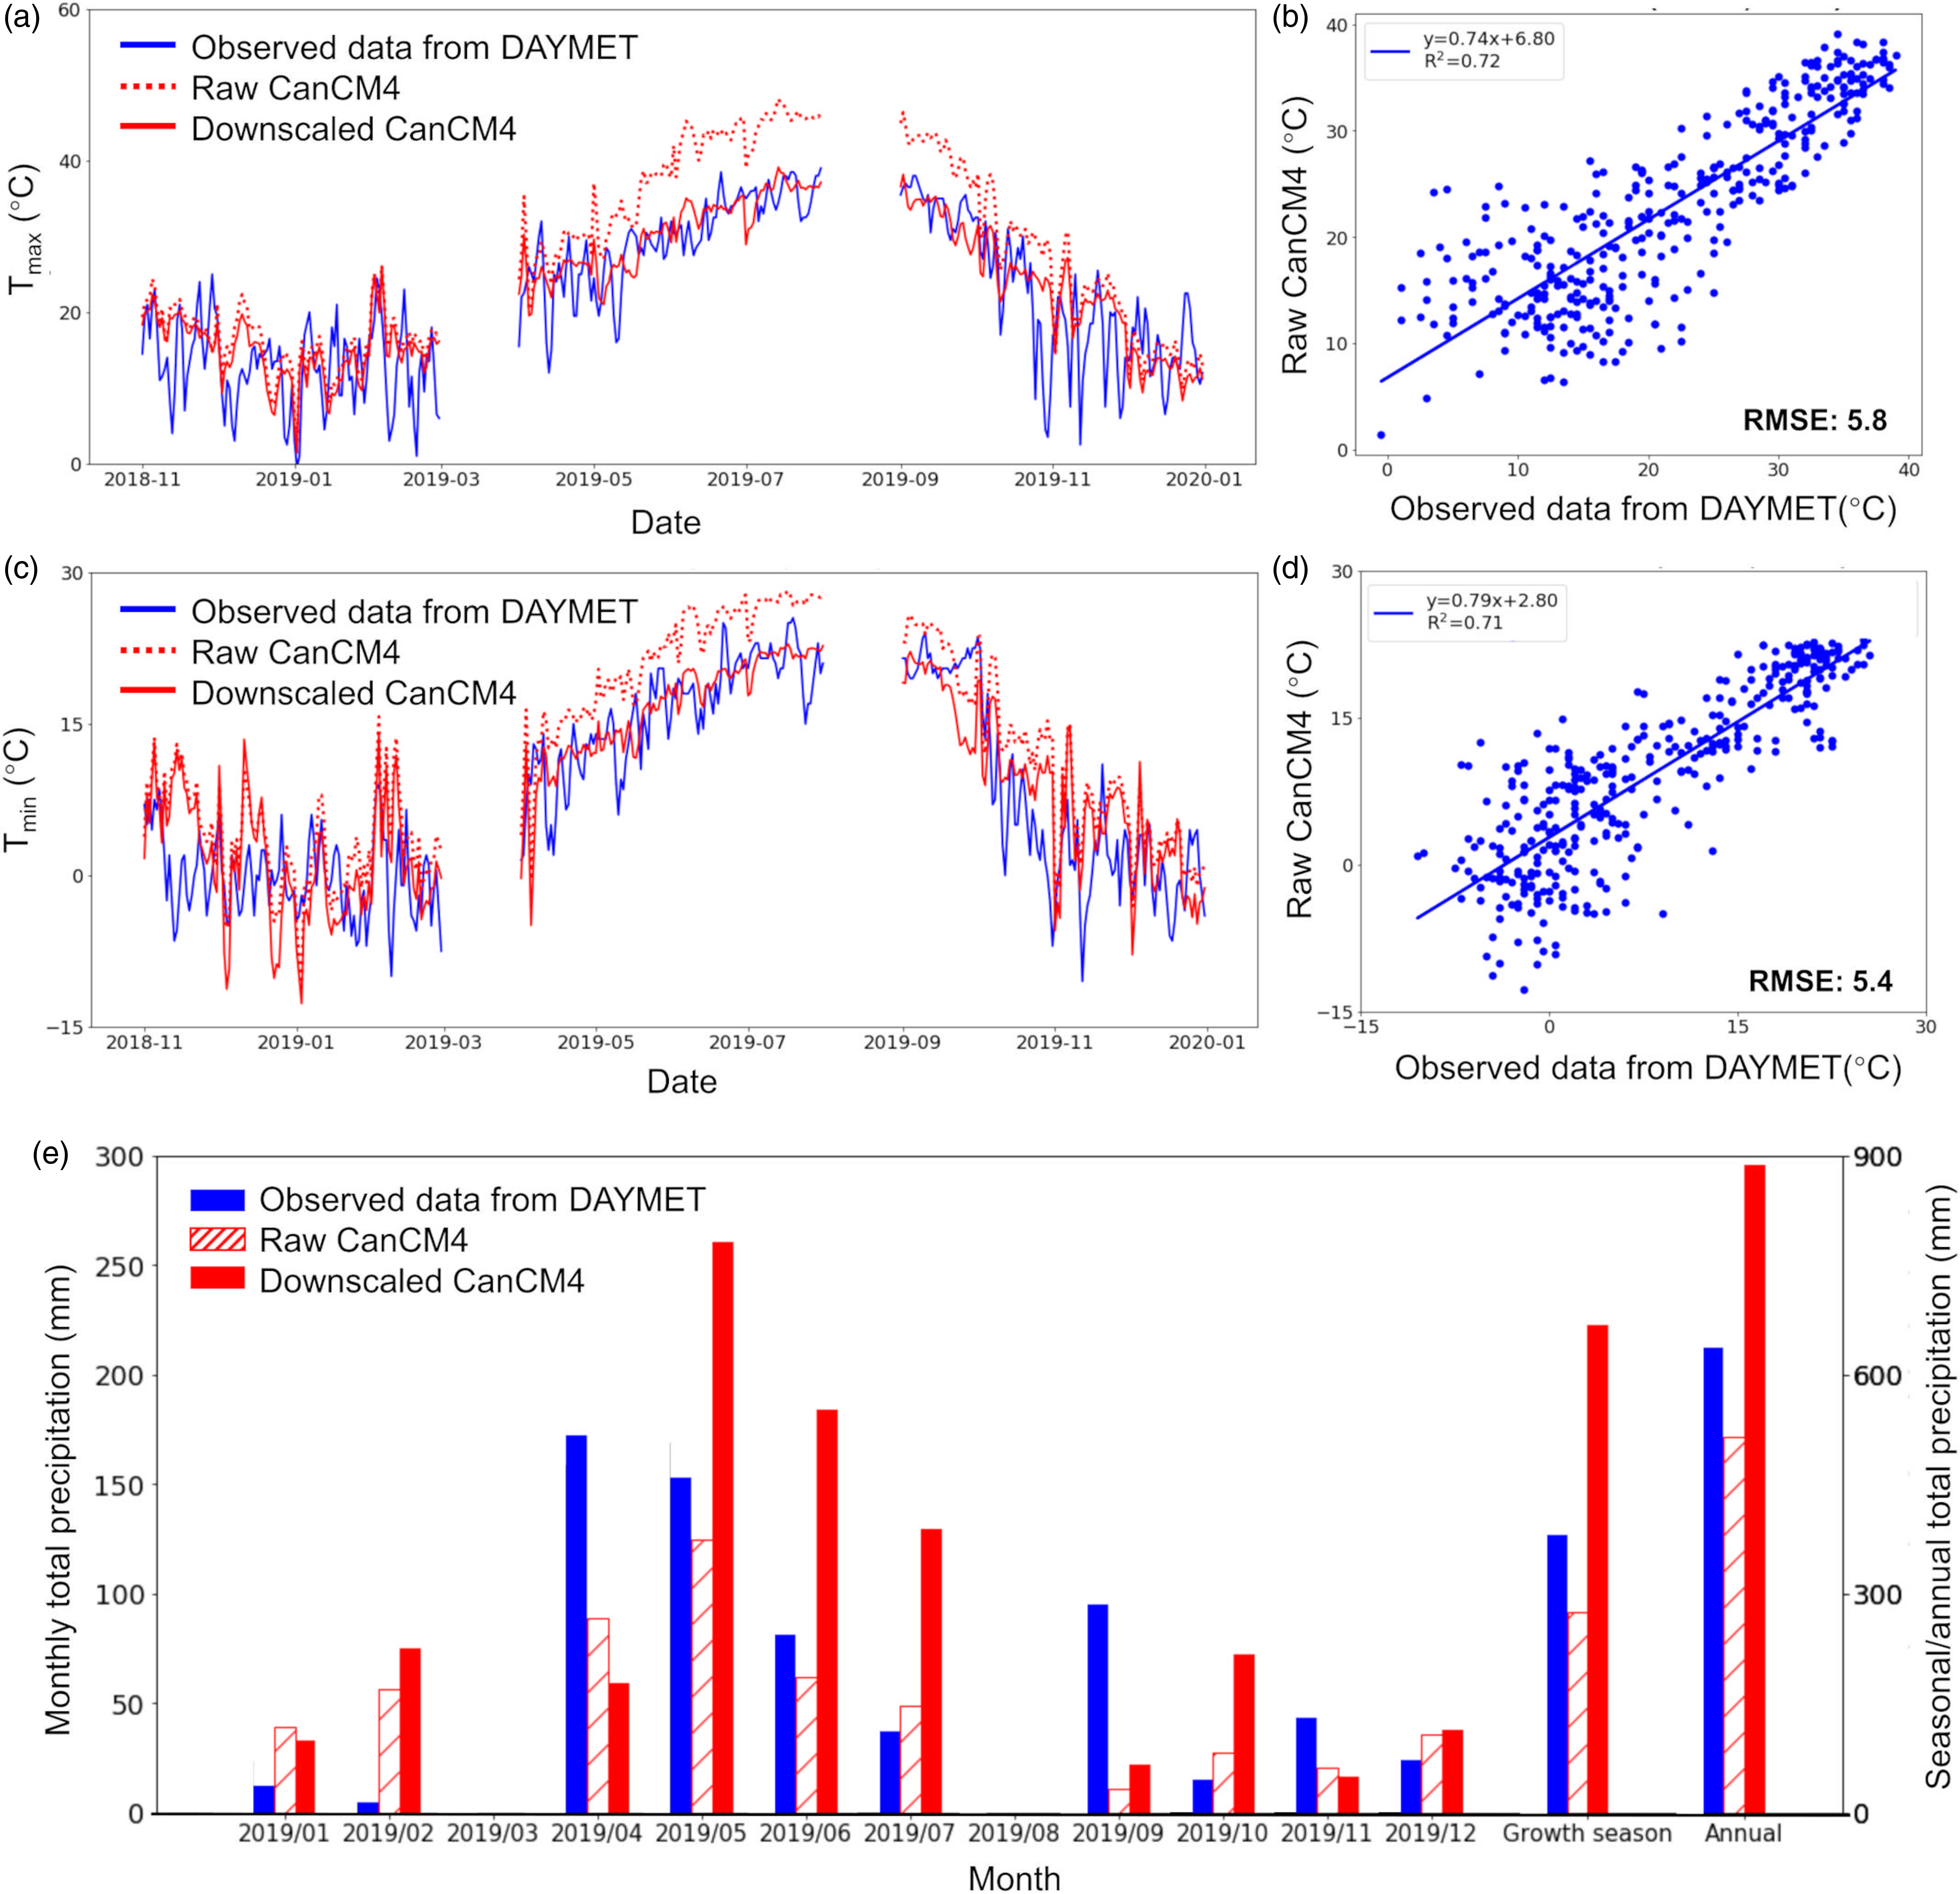
min. Daily forecasts of T
max and T
min and monthly forecasts of precipitation in 2019 are illustrated in Figure 11. Daily T
max and T
min forecasts exhibited high prediction skills (R
2
= 0.72 for T
max and R
2
= 0.71 for T
min). However, the forecasted precipitation was relatively poor this year due to an extreme precipitation event (95 mm) projected by the downscaled CanCM4 in May. After excluding this extreme precipitation event, the seasonal and annual RE reduced from 74 and 25 % to 31 and 1 %, respectively. As shown in Figure A5, the bias correction coefficients for precipitation (i.e., $ {{{\sigma }_{O,ref}}\over{{\sigma }_{M,ref}}}$
) were relatively high in central and southwest regions during the growing season (May to October), indicating that precipitation forecasts from the downscaled CanCM4 were sensitive to high precipitation events.
$ {{{\sigma }_{O,ref}}\over{{\sigma }_{M,ref}}}$
) were relatively high in central and southwest regions during the growing season (May to October), indicating that precipitation forecasts from the downscaled CanCM4 were sensitive to high precipitation events.
Comparison of monthly mean (a) T max and (b) T min, and seasonal precipitation (May–October) for the reference period (1982–2010) using DAYMET (Observation), raw CanCM4 and downscaled CanCM4 at the Chillicothe station.
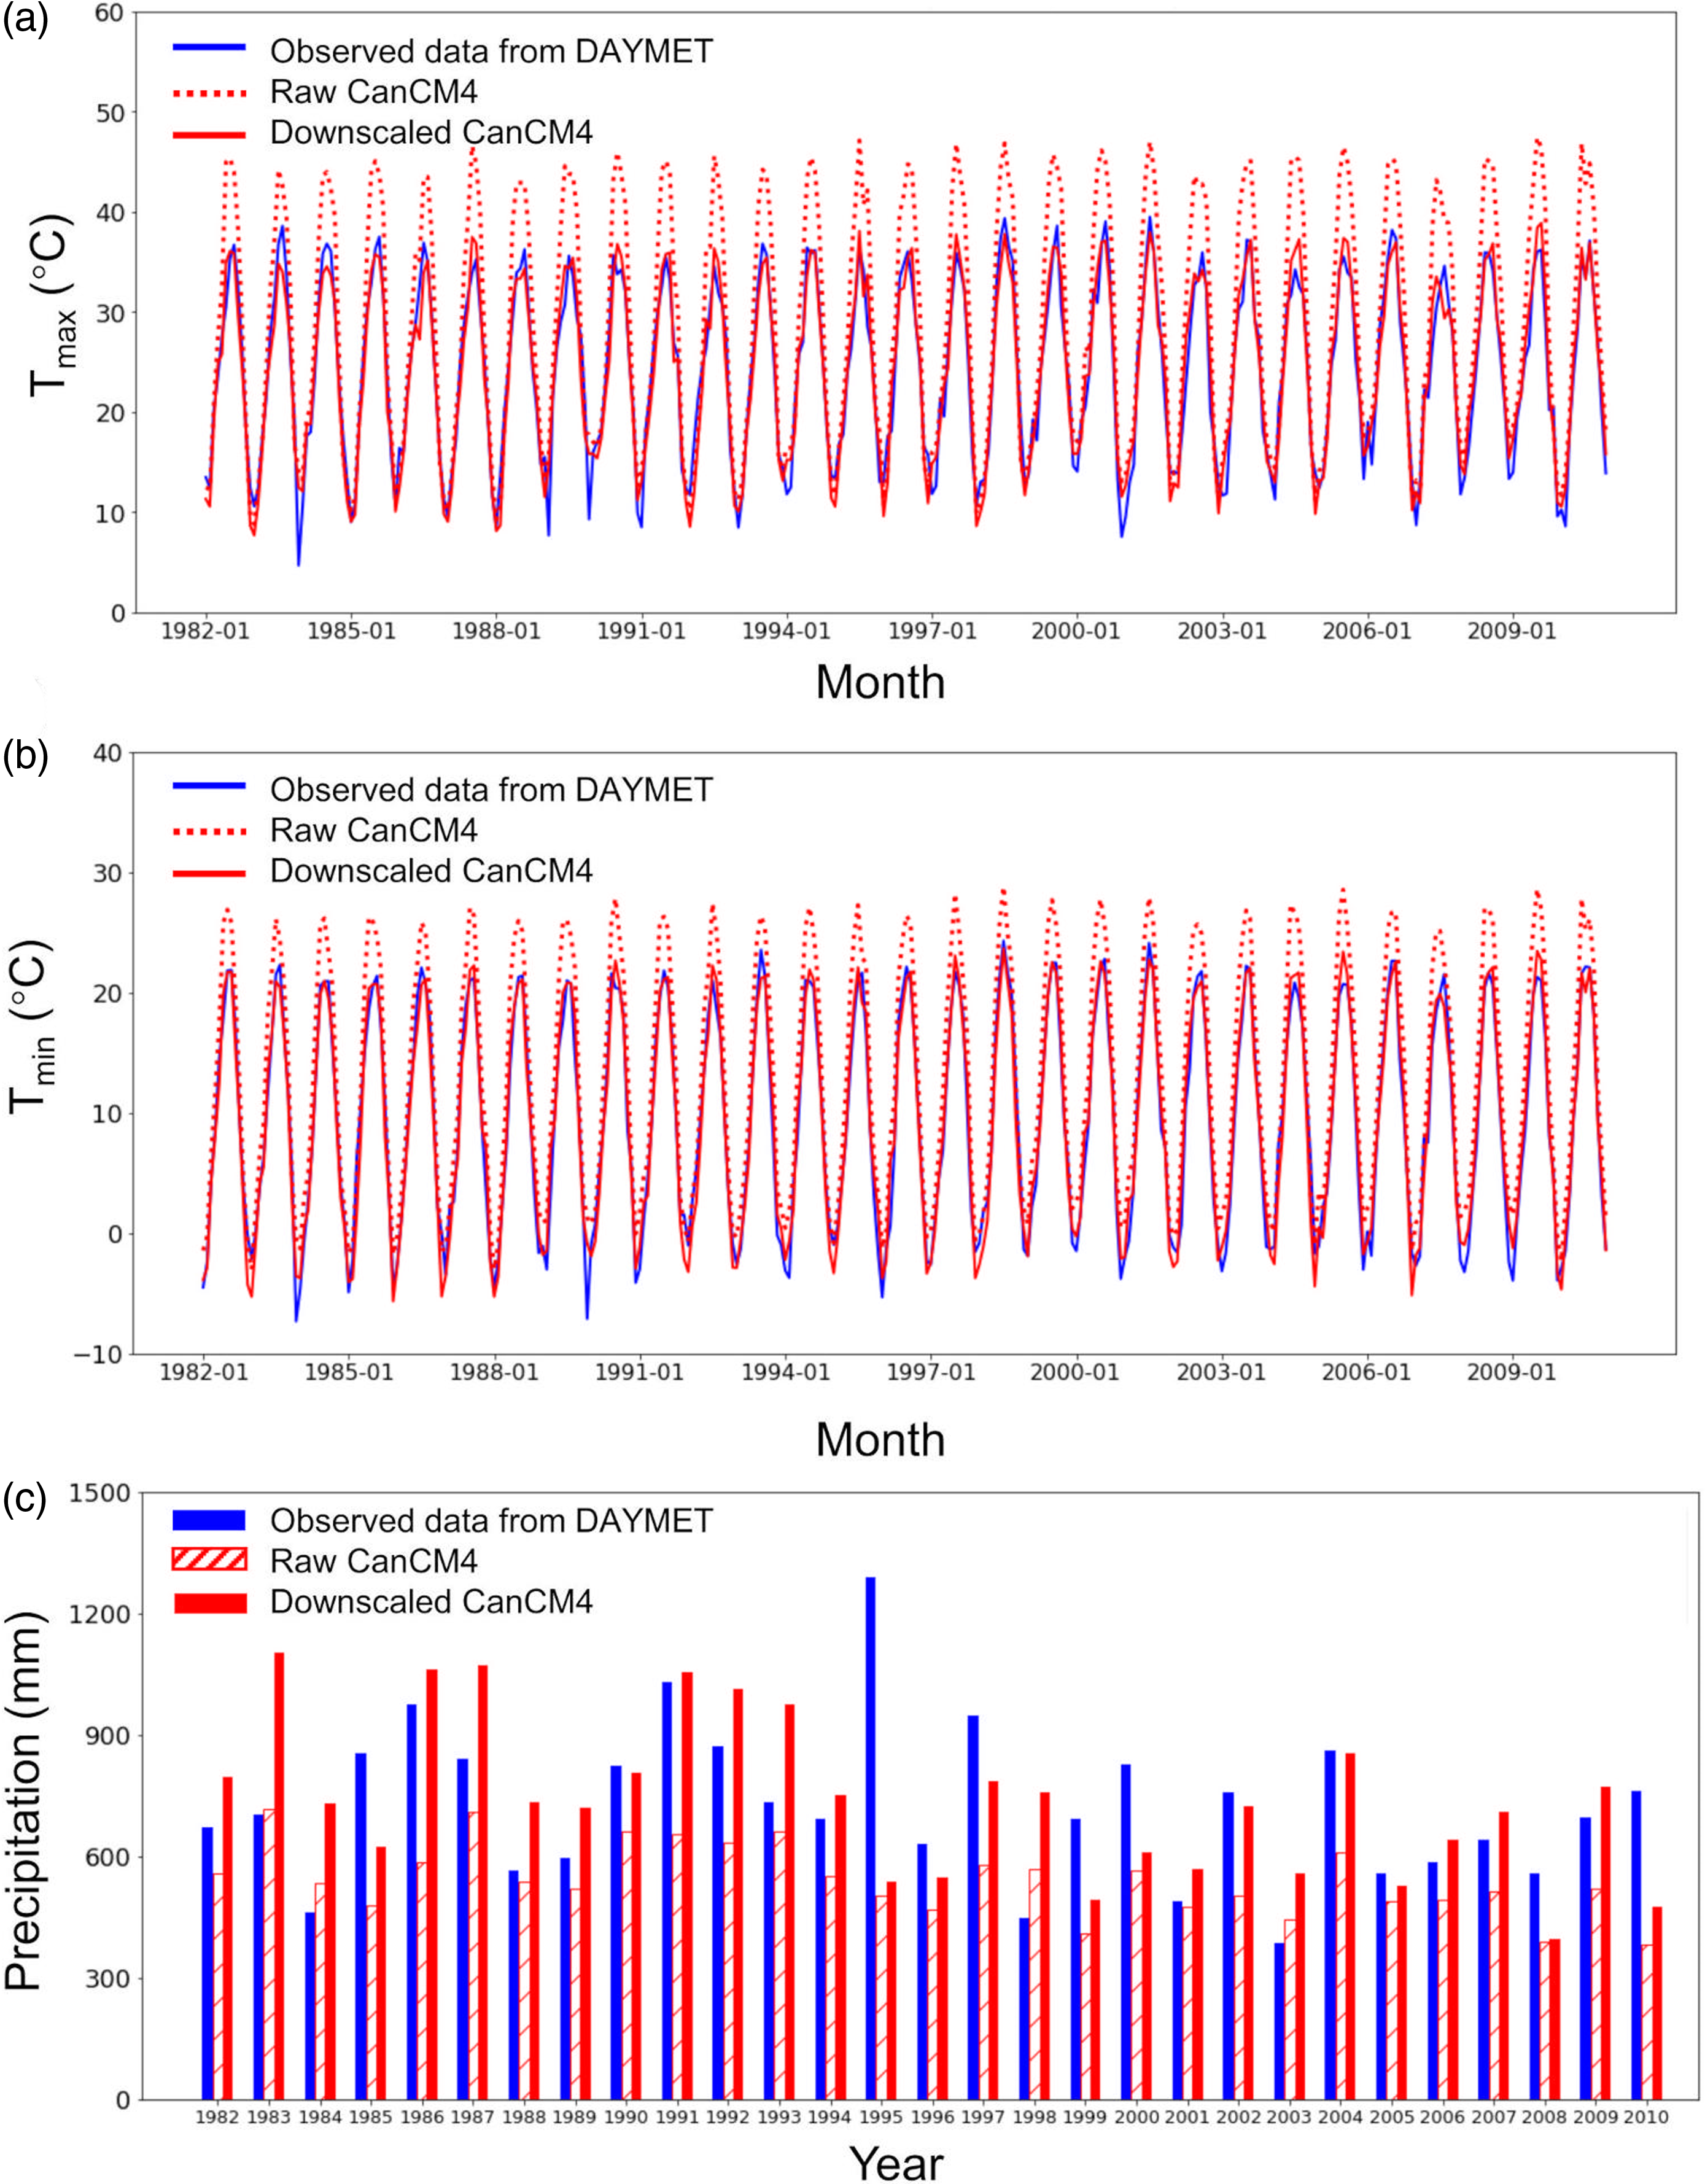
Comparison of daily (a)(b) T max, (c)(d) T min, and (e) monthly/seasonal (May–October)/annual precipitation from DAYMET (Observation), CanCM4, and downscaled CanCM4 in 2019 at the Chillicothe station. Note that the black bar in (e) represents field observation of rainfall. March and August data were unavailable.
Test for crop modelling (2020)
The downscaling method demonstrated strong performance compared with the multi-model mean method at the regional scale, showed reliable accuracy across various lead times and proved effective for local-scale predictions using 2019 data. Based on these evaluations, the high-resolution seasonal weather forecasts generated in this study were further assessed for their applicability in local crop modelling. The predictions of crop yield and irrigation water requirement at the Chillicothe research station were compared for the 2020 growing season at 0 month lead time using different methods (Figure 12). The accumulated precipitation of the downscaled forecasts in the 2020 growing season compared well with field observations, but both the raw CanCM4 output and the multi-model mean method significantly underestimated the accumulated precipitation by 49 and 43 %, respectively (Figure 12a). The downscaling method also demonstrated better performance in predicting T max and T min, compared with the other two methods (Figure 12b and c). The mean T max and T min values forecasted using the downscaling method were slightly underestimated (by approximately 1–2%) in comparison to field observations, while substantial overestimation was found using the raw model outputs and multi-model mean. With the use of multi-model mean, the REs of T max and T min reduced from 27–30 % (raw CanCM4 data) to 15–25 % (multi-model mean).
Comparison of 2020 growing season prediction at the Chillicothe station using different weather datasets (lead 0 m). (a) T max; (b) T min; (c) accumulated precipitation; (d) seed cotton yield and (e) seasonal irrigation (May–October).
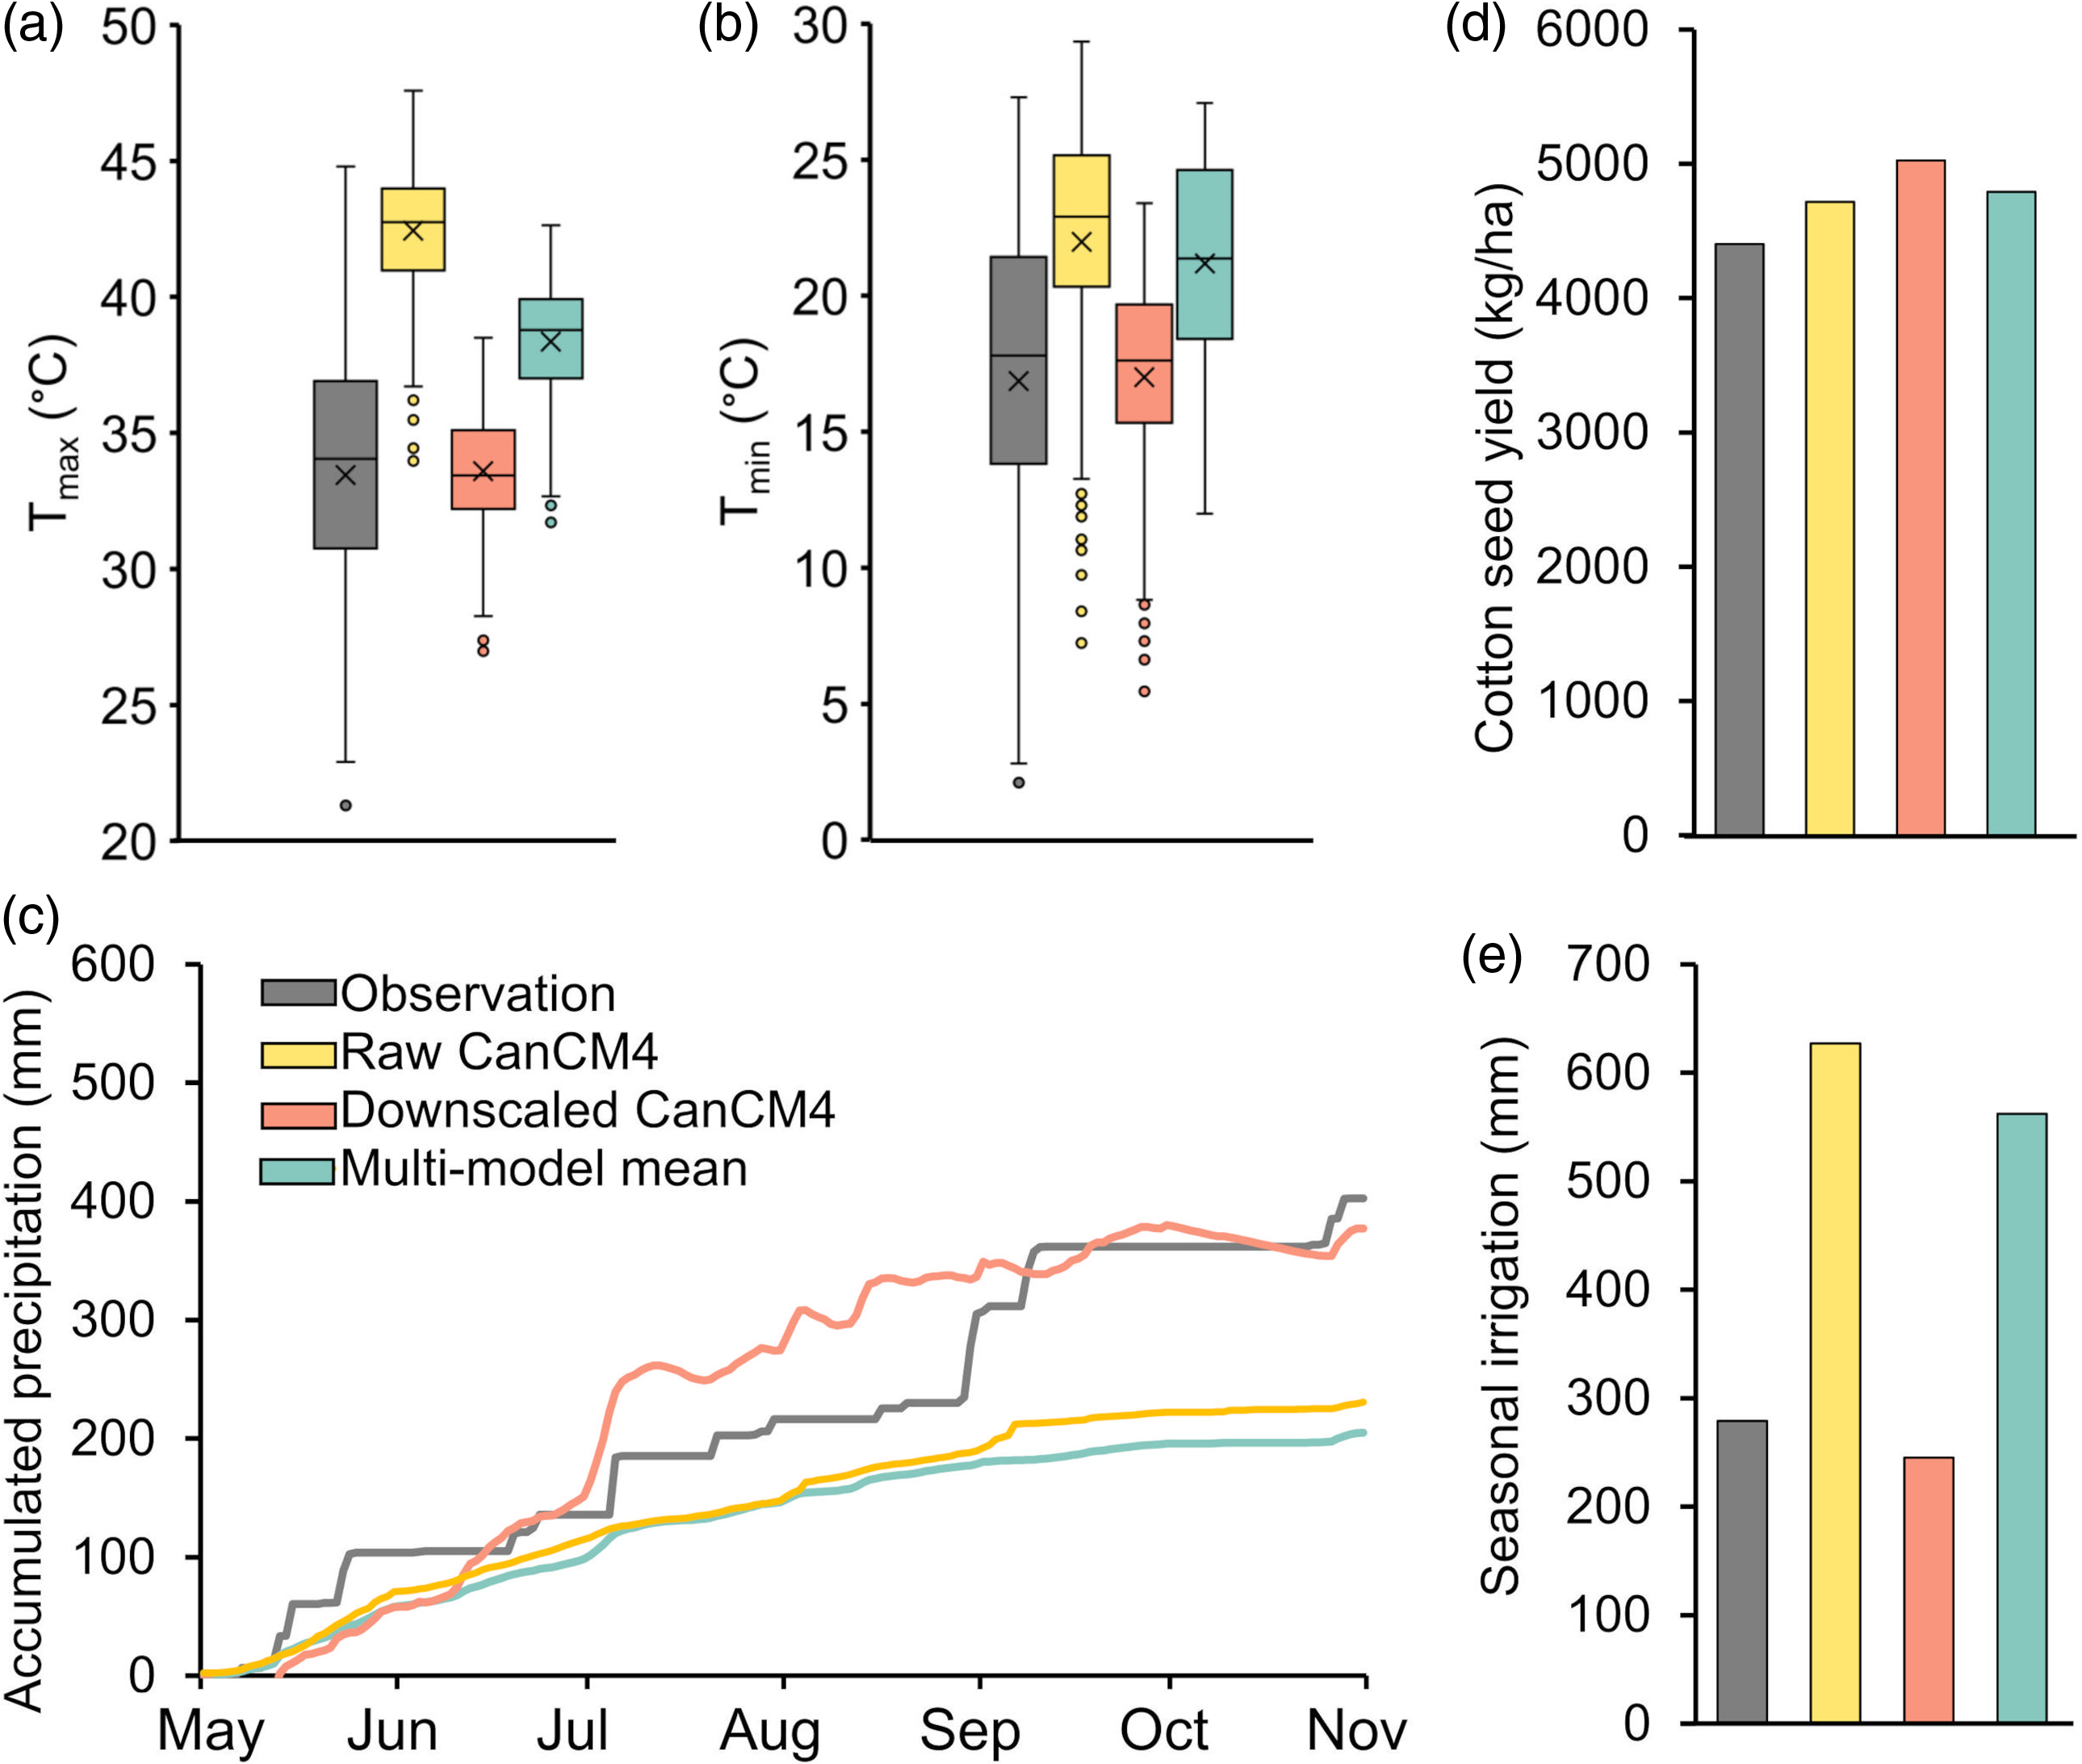
All three methods (the raw CanCM4, the multi-model mean and the downscaling methods) predicted seed cotton yield reasonably in the 2020 growing season, with 7–15 % RE when compared to field observations (Figure 12d). The irrigation amount predicted by the downscaling method was closer to field observations, while the irrigation amounts predicted by the raw CanCM4 and the multi-model mean were more than twice the observed irrigation (Figure 12e). The unrealistically high irrigation amount predicted by the latter two methods was likely caused by the combined effects of the underestimation of rainfall and increased crop ET resulting from overestimated air temperature.
Discussion
Performance of the downscaling method
The downscaling method showed strong forecast skill for temperatures across different lead times. Previous studies have reported that CanCM4 and other GCMs tend to overestimate surface air temperature, particularly during warmer seasons in the central United States (Cheruy et al., Reference Cheruy, Dufresne, Hourdin and Ducharne2014; Ma et al., Reference Ma, Klein, Xie, Zhang, Tang, Tang, Morcrette, Van Weverberg, Petch, Ahlgrimm, Berg, Cheruy, Cole, Forbes, Gustafson, Huang, Liu, Merryfield, Qian, Roehrig and Wang2018; Zhang et al., Reference Zhang, Xie, Klein, Ma, Tang, Van Weverberg, Morcrette and Petch2018). This overestimation was likely associated with biases in the surface evaporative fraction and fluxes of shortwave and longwave radiation. For example, Ma et al. (Reference Ma, Klein, Xie, Zhang, Tang, Tang, Morcrette, Van Weverberg, Petch, Ahlgrimm, Berg, Cheruy, Cole, Forbes, Gustafson, Huang, Liu, Merryfield, Qian, Roehrig and Wang2018) estimated that these two factors accounted for 65 % of the bias (3.5 ºC, June–August) in mean temperature prediction by CanCM4 in the central United States in 2011. The multi-model mean method for T max and T min performed slightly better in the central and eastern regions than using a single model, but the overall forecast skill did not show significant improvement, consistent with the mean temperature forecasts in other studies (Becker et al., Reference Becker, van den Dool and Zhang2014; Roy et al., Reference Roy, He, Lin, Beck, Castro and Wood2020).
High-resolution real-time monthly and seasonal precipitation forecasting using the downscaling method remains a challenge, primarily due to the high spatial variability in regions with complex terrains. Orographic and inversion effects significantly impact seasonal weather patterns, making accurate predictions more difficult (Barbero et al., Reference Barbero, Abatzoglou and Hegewisch2017). Overestimations in the northwestern United States have been widely reported in multiple NMME models, including CanCM3, CanCM4, CCSM4 and GEOS-5 (Khajehei et al., Reference Khajehei, Ahmadalipour and Moradkhani2018; Roy et al., Reference Roy, He, Lin, Beck, Castro and Wood2020; Zhang et al., Reference Zhang, Kim, Yang, Hong and Zhu2021). This overestimation is possibly due to the drizzle effect (i.e., an excessive amount of small droplets of precipitation) (Zhang et al., Reference Zhang, Kim, Yang, Hong and Zhu2021).
Recent studies have shown that multi-model mean approaches tend to outperform single model simulations for precipitation (Becker et al., Reference Becker, van den Dool and Zhang2014; Zhang et al., Reference Zhang, Kim, Yang, Hong and Zhu2021), largely due to the incorporation of new signals from different models (DelSole et al., Reference DelSole, Nattala and Tippett2014). However, in our study, multi-model mean did not significantly improve precipitation forecast skill in western and central regions. This may be attributed to similar precipitation forecast patterns generated by CanCM4, CCSM4 and GEOS-5 models (Zhang et al., Reference Zhang, Kim, Yang, Hong and Zhu2021). Additionally, the overestimation in western regions was not significantly improved when the downscaled method was used, likely due to the complex terrains in these regions (Becker et al., Reference Becker, van den Dool and Zhang2014; DelSole et al., Reference DelSole, Nattala and Tippett2014; Zhang et al., Reference Zhang, Kim, Yang, Hong and Zhu2021). Various bias-correction techniques, such as quantile mapping and copula functions, have been used to improve NMME precipitation forecasts (Khajehei et al., Reference Khajehei, Ahmadalipour and Moradkhani2018). The quantile mapping method tended to degrade the reliability of the multi-model mean forecast in most regions across the United States. In contrast, the copula function performed better than the multi-model mean forecast. Despite this, the RE for western regions using these two methods remained high, ranging from 80 to 140 %. These biases could be addressed by enhancing the performance of the GCMs or utilizing appropriate bias correction and downscaling methods.
Another limitation is the decline in precipitation forecast skill of NMME over extended lead times, a trend observed in previous studies (Baker et al., Reference Baker, Wood and Rajagopalan2019; Wanders and Wood, Reference Wanders and Wood2016; Zhang et al., Reference Zhang, Kim, Yang, Hong and Zhu2021). This decline is mainly due to the weakening influence of initial conditions with longer simulation times (Lavers et al., Reference Lavers, Luo and Wood2009). In contrast, precipitation forecasts in cold months, such as in December, exhibited better performance, which is consistent with other studies (Narapusetty et al., Reference Narapusetty, Collins, Murtugudde, Gottschalck and Peters-Lidard2018; Tian et al., Reference Tian, Martinez, Graham and Hwang2014; Yazdandoost et al., Reference Yazdandoost, Moradian, Zakipour, Izadi and Bavandpour2020). This suggests that the decline in the downscaling signature for precipitation was not evident during cold seasons.
Implications and future research
The findings from this study highlight the importance of post-processing techniques, such as statistical downscaling, in enhancing the use of coarse-resolution NMME seasonal weather forecasts for crop modelling and irrigation scheduling. By significantly reducing biases in temperature and precipitation forecasts, the downscaling method demonstrated strong forecast skill, enabling more accurate predictions of seasonal irrigation requirements and crop yields using crop models.
Despite these advancements, the study highlights the variability in improvement achieved by the downscaling method across different times and locations. This variability underscores the need for further improvement to enhance accuracy, address spatial heterogeneity and capture extreme weather events. To ensure broader applicability and availability of improved decision-making tools for agricultural water management, several improvements are suggested for future research: (1) Expanding the use of NMME models. This study demonstrated the effectiveness of downscaling a single NMME model (CanCM4), and future research could incorporate additional NMME models to further improve forecast accuracy and (2) refinement of downscaling techniques. The downscaling method used in this study faces challenges in accurately representing spatial heterogeneity and capturing extreme weather events, particularly for precipitation during warm seasons. A possible solution to avoid unrealistic extreme values is to set an upper limit based on historical precipitation data. Additionally, machine learning-based approaches, such as convolutional neural networks and random forest models, have significant potential to enhance the representation of rainfall extremes and spatial variability. Further improvement could be achieved through the development of region-specific bias correction models, which could better address local heterogeneity and improve the reliability of precipitation forecasts, particularly in regions with complex topography and variable climatic conditions. Sensitivity analysis could also be used to identify the most appropriate method for specific regions. Furthermore, incorporating additional environmental or climatic parameters may improve the accuracy and robustness of the downscaling algorithms and (3) improving ET estimation. The crop model simulations in this study employed the Priestley–Taylor method for ET estimation, which uses a default coefficient of 1.26. However, this default coefficient may not be reliable across different regions; therefore, local calibration is usually required to ensure accuracy. The Penman Monteith method (Penman, Reference Penman1948; Monteith, Reference Monteith1965) offers a more physically based approach with global applicability. However, its effectiveness is limited as it requires accurate wind speed and humidity data, which are often poorly predicted by GCMs. To address these limitations, Su and Singh (Reference Su and Singh2023) derived an analytical expression for the Priestley–Taylor coefficient using the Penman Monteith method and developed a gridded global monthly Priestley-Taylor coefficient dataset. The incorporation of this dataset into DSSAT could significantly improve the accuracy of ET estimation and irrigation scheduling under varying climatic conditions; (4) improving solar radiation estimation. Solar radiation is a key input for crop models, and this study relied on default coefficients that may lack regional specificity. These coefficients should be regionally calibrated to improve model reliability. Future research should focus on directly downscaling solar radiation data where available, reducing the dependency on empirical coefficients. Regionally calibrated solar radiation models could also improve the reliability of crop simulations and (5) broadening the applicability of gridded climate datasets. The gridded datasets used in this study, such as DAYMET, are limited to the United States, which restricts the potential for applying similar methodologies in other regions. To enable the global applicability of the approach demonstrated in this study, future research should focus on the use of globally available gridded datasets, as discussed by Araghi et al. (Reference Araghi, Martinez and Olesen2022a, Reference Araghi, Martinez, Olesen and Hoogenboom2022b). Incorporating these datasets would facilitate the broader implementation of downscaling techniques and significantly enhance the utility of seasonal weather forecasts for crop modelling and irrigation management on a global scale.
Conclusions
An improved bias-correction and downscaling method was applied in this study to generate high-resolution (1-km) daily weather forecasts (maximum and minimum air temperatures and precipitation) over the CONUS using the CanCM4 outputs from the NMME forecast system. The usability of downscaled seasonal weather forecasts for real-time crop modelling at a local scale was evaluated by comparing the results with the raw CanCM4 outputs and the multi-model mean of three NMME models (i.e., CCSM4, GEOS-5 and CanCM4). The major findings from this study include (1) proper post-processing of the raw NMME outputs was required before using them in prediction of seasonal irrigation requirement and crop yield; (2) the bias correction and downscaling method significantly improved the performance of the CanCM4 outputs and outperformed the multi-model mean method, but its performance in predicting precipitation varied with time and location and (3) the high-resolution seasonal weather forecasts generated in this study ensured reliable predictions of local crop yields. Our study provides valuable insights for enhancing the usability and reliability of high-resolution seasonal weather forecasts in regional crop modelling and irrigation management.
Supplementary material
The supplementary material for this article can be found at https://doi.org/10.1017/S0021859625000139
Data
The calibrated coefficients of T max, T min and precipitation to produce 1-km gridded daily weather projections (maximum and minimum air temperatures and precipitation) over the contiguous United States (CONUS) can be freely downloaded in NetCDF format from Su, Qiong (2025), ‘Calibrated coefficients for high-resolution downscaling: A 1-km gridded daily dataset of temperature and precipitation across the Contiguous United States from NMME Seasonal forecasts’, Mendeley Data, V1, doi: 10.17632/hr6vtfrwv7.1.
Acknowledgements
The authors would like to thank the Texas A&M Water Initiative for funding this research and the Texas A&M High-Performance Research Computing (HPRC) for providing computing resources for this research.
Author contributions
QS and SA conceived and designed the study. QS conducted data collection, model development and simulation. QS wrote the first draft of the manuscript. SA, SH, JS and VPS contributed to review and editing of the manuscript. SA secured the funding and supervised the work. All authors read and approved of the final manuscript.
Funding statement
This research was supported by a Texas A&M Water Initiative grant.
Competing interests
The authors declare no competing interests.
Consent for publication
Not applicable.
Ethical standards
This study did not involve any human participants or animals.


 Open access