This special issue of Perspectives on Politics considers the causes of Donald Trump’s victory in the 2016 presidential election. And perhaps no question regarding the causes of support for his unusual candidacy is as well-worn as the debate over whether racial attitudes or economic conditions were responsible for his victory. Did Trump win the presidency due to voters’ investment in systemic racial inequalities and anxieties regarding demographic change? Or did voters instead punish the incumbent Democratic Party for failing to improve their communities’ economic well-being, placing their hopes in Trump’s promises to bring jobs back to the parts of the United States that had been left behind by globalization?
While this debate over the sources of Donald Trump’s support has been ongoing since his campaign began, its scope has been limited in two important respects that hinder our understanding of the election. First, its participants tend to only consider one possibility as to how these factors could affect voting behavior—namely, choosing Donald Trump over Hillary Clinton. Second, they tend to only consider one particular subset of the electorate for whom racial attitudes and economic distress may have predicted changes in voting behavior—namely, white voters. And when one only seeks to explain binary choice within a subset of the electorate, it becomes intuitive to reduce explanations to an either/or dichotomy, concluding that one factor was more consequential than the other.
Ultimately, limiting the scope of inquiry in this manner obscures important ways in which both of these constructs could have been associated with different voting behaviors among different subsets of the 2016 electorate. Furthermore, it risks writing people of color out of the story of the 2016 election, by telling that story only on white voters’ terms.Footnote 1 Studies examining the intersection of race and gender in the 2016 election have found different relationships between sexism and Trump support across different racial groups,Footnote 2 with gender attitudes being more strongly associated with vote choice among white voters than their non-white counterparts. A similar approach could add nuance to our understanding of racial attitudes and economic distress in the 2016 contest.
To be fair, a limited scope is often necessary for quantitative analysis immediately following an election. The lack of validated voter turnout until months after an election encourages researchers to treat major party vote choice as their outcome variable—to the exclusion of non-voting. Additionally, many publicly available surveys are too small to conduct multivariate analyses among racial sub-groups of the electorate, forcing researchers to either limit their analyses to white citizens or assume that their constructs of interest are similarly associated with their outcome of interest for citizens of different races. Furthermore, economic evaluations on surveys are often subject to expressive partisan responding, complicating the links between stated economic anxieties and reported voting behavior. Finally, researchers who seek to avoid these (and other) limitations with survey research are often forced to move away from individual-level analyses to higher levels of aggregation, such as the county level. This, too, can encourage the use of outcome variables that only consider two-party vote choice, which can obscure important variation in participation in the two-party contest.
Accounting for these methodological limitations allows us to broaden our scope regarding how and for whom racial attitudes and economic conditions may have been associated with voting behavior in the 2016 election, deepening our understanding of its outcome. As a consequence, we reject generalizations regarding whether racial attitudes or economic distress better predicted voting behavior, instead arguing that the story of race cannot be fully separated from the story of economic conditions. We find that both racial attitudes and economic distress at times predict meaningful changes in the likelihood of voting and voting for Donald Trump, but that these relationships are not constant across different racial sub-groups of the electorate. In particular, while both factors are associated with two-party vote choice among white voter file-matched survey respondents, these constructs are more strongly associated with participation in the two-party contest among black voter file-matched respondents.
Relevant Literature
There are good reasons to believe that economic distress played a significant role in the outcome of the 2016 election. In line with fundamental findings in political science,Footnote 3 voters dissatisfied with the state of the U.S. economy could have punished the incumbent Democratic Party by voting for its opponents. Economic distress has also been tied to decreased propensity to vote,Footnote 4 which could also have contributed to Trump’s victory if disproportionately Democratic-leaning citizens did not vote as a result of poor economic circumstances. The macro-level literature provides support for the claim that economic troubles can drive support for far-right parties.Footnote 5 Research on trade shocks has also found evidence of vote shifts driven by economic forces.Footnote 6
There is also a wide array of evidence showing that racial attitudes, coupled with the heightened salience of race in U.S. politics, played a crucial role in organizing public attitudes toward Donald Trump as a candidate.Footnote 7 In this frame, Trump represents an acceleration of pre-existing trends in racial attitude polarization,Footnote 8 as partisans continue to sort along this dimension.Footnote 9 Trump’s more aggressive positioning on the issue of immigration than recent Republican candidates drove the parties to sort along these lines as well.Footnote 10 Extending this area of analysis, Diana Mutz finds that status threat—a construct that, among other things, includes immigration attitudes, domestic prejudice, and perceptions of discrimination against high-status groups—strongly predicted support for Donald Trump, while pocketbook economic indicators did not.Footnote 11
Work that has explicitly tested economic or otherwise materialist hypotheses for Trump support at the individual level has shown mixed results. Voters who expressed favorable views toward him before the election were no more likely to be unemployed or face labor competition through trade or immigration, and had relatively high household incomes.Footnote 12 Nevertheless, that same study found that voters with favorable views toward Trump were more likely to live in geographic areas with worse health outcomes and a higher reliance on income from the Social Security Administration. Furthermore, Bor found that the rate of increase in life expectancy between 1985 and 2010 was negatively correlated with Donald Trump’s vote share at the county levelFootnote 13 – that is, counties that saw slower or even negative growth in life expectancy over the past few decades saw larger Republican shifts in two-party vote share between 2008 and 2016. Finally, Healy and Lenz found that counties that experienced slower wage growth over the course of 2016 saw greater shifts toward Donald Trump than counties that experienced higher wage growth, all else equal.Footnote 14
In the vast majority of this work, the outcome variable is either favorability toward or a binary vote for/against Donald Trump. However, presidential elections in the United States allow for more than two behaviors: citizens vote for the Democratic candidate, the Republican candidate, a minor party candidate, or not at all. Focusing on major-party vote choice alone can obscure other factors that may have played a role in the outcome of the election through their relationship with participation in the two-party contest. Recent research on campaign tactics suggests that campaigns view mobilization as a more effective path to victory than persuasion.Footnote 15 This view is supported by recent research on election outcomes, which finds that differential turnout rates are more consequential than persuasion.Footnote 16 Consistent with this view, a wide range of research has found that campaigns struggle to generate meaningful persuasion effects.Footnote 17
Generally speaking, there are good reasons to suspect that understanding patterns in voter turnout are crucial for our understanding of the 2016 election. According to the American National Election Studies 2016 survey, which has matched respondents to voter file records going back to 2012, only 31% of individuals who identify as Democrats voted in all three elections between 2012 and 2016, as well as 16% of Independents and 40% of Republicans. But only 7% of Democrats voted for Trump in 2016 and only 8% of Republicans voted for Clinton. This suggests that there is far more within-voter variation in turnout than in vote choice, which could have implications for our understanding of the role economic conditions played in the election. Regardless of the extent to which economic distress was (or was not) associated with support for Donald Trump in 2016, it may be the case that some groups of economically distressed voters were less likely to vote at all. If economic distress was more likely to discourage Democratic-leaning voters from participation in the two-party contest, then we could observe higher aggregate two-party vote share for Donald Trump in areas with poor economic conditions with or without any relationship between economic distress and affirmative Trump support.
It is also clear that economic conditions and racial attitudes are complex and may interact in important ways that vary across different groups of potential voters. As McCall and Orloff argue, Donald Trump’s campaign rhetoric constructed a particularly “American” identity through “a certain kind of unabashed intersectionality, targeting whiteness plus economic decline in male dominated fields.”Footnote 18 In this view, Trump’s appeals to “working class white” voters activated both their working class and white identities, linking economic issues to investment in racial hierarchies. To the extent that racial attitudes and economic conditions are intertwined (particularly among the predominantly white voters to whom Trump was appealing), they will be difficult to isolate and compare. This being the case, it may not be appropriate to pit these constructs against one another and ask which one had larger marginal effects on the electorate. Instead, it seems more appropriate to investigate the contexts in which each construct was associated with particular political behaviors.
This dynamic is difficult to adequately measure, which likely contributes to its relative inattention in the quantitative literature. The vast majority of data implicated by the range of relevant voting behaviors—whether people voted, which candidate they preferred, their racial attitudes, and their economic conditions—are often collected using surveys, and different survey questions carry different degrees of reliability for different operationalizations of different constructs. Voting is socially desirable, and so aggregate measures of self-reported voter turnout are likely to include a large and non-random subset of respondents who inaccurately claim to have voted.Footnote 19 By extension, small to medium-sized surveys will not include large enough numbers of self-reported non-voters and minor party voters—especially among racial minorities—to establish meaningful relationships between politically relevant variables and those specific voting behaviors. In a similar vein, self-reported perceptions of economic conditions are in many cases entangled with political attitudes,Footnote 20 with members of the party that is out of power reporting worse economic conditionsFootnote 21 than members of the party that is in power. This complicates findings showing a correlation between racial attitudes and evaluations of the state of the national economy,Footnote 22 as they are unlikely to be robust to changes in political conditions.Footnote 23
We address these measurement issues by augmenting a large-n survey of political attitudes and behaviors with objective measures of voter turnout and community-level economic conditions. Using the 2016 Cooperative Congressional Election Survey (CCES), which matches respondents to voter file data to validate turnout, along with publicly-available economic data at the ZIP code and county levels, we are able to address survey-based measurement problems associated with voter turnout and economic conditions.Footnote 24 Additionally, following Masuoka and Junn,Footnote 25 we present findings broken down by racial identificationFootnote 26 to account for the possibility that different factors mattered differently among these sub-groups of citizens.
Using this ensemble dataset, we find that both racial attitudes and economic conditions are significantly associated with voting behavior in 2016. However, we also find that among different racial sub-groups, different factors are at times associated with different behaviors. These findings make clear the difficulty of directly comparing racial attitudes and economic distress as explanations for the outcome of the 2016 election, or attributing Donald Trump’s election to one as opposed to the other.
Data
The bulk of our analysis relies on the 2016 CCES, which includes 64,600 pre-election responses collected between September 28 and November 7 and post-election responses collected between November 9 and December 14.Footnote 27 In order to test hypotheses concerning community-level economic distress, we merge the CCES with ZIP code-level data publicly available from the IRS for years 2013 through 2015, along with 2012, 2015 and 2016 county-level data on average weekly wages from the Quarterly Census of Employment and Wages. 495 CCES respondents are discarded from this merge due to not having a matching ZIP code and an additional 67 did not have a matching county, resulting in a set of 64,038 observations.
The 2016 CCES includes validated voter turnout for the 2016 election, with a match rate of nearly 70%. Following the recommendation of Ansolabehere and Hersh, we treat unmatched respondents as if they did not vote, since the most likely (albeit not the only) reason for not matching to a voter file is not being registered.Footnote 28 To account for systematic non-response to particular survey questions, such as those dealing with racial attitudes and family income, we impute remaining missing values using the MICE package in R.Footnote 29
Our primary independent variables of interest were operationalized in specific ways that warrant brief discussion:
Racial Attitudes
The 2016 CCES includes four questions about racial attitudes, referred to by the authors of the questions, Christopher DeSante and Candis W. Smith, as FIRE (Fear, acknowledgement of Institutional Racism, and Empathy). They developed the battery in a 2015 working paper in which they examine 45 questions, “nine questions that measure racial resentment, five that we believe to proxy conservative ideology, sixteen questions that measure color-blind racial attitudes and finally fifteen items that measure the psycho-social costs of racism to Whites.”Footnote 30 For the nine resentment questions, they use both explicit racial resentment (5 questions) and the four traditional racial resentment questions typically included on the ANES, as well as measures of old-fashioned racial prejudice, which include comparisons of white and black people on propensities toward violence, trustworthiness, work ethic, and intelligence. The authors then regress the newer measures against the old-fashioned racial attitudes, and generate a heatmap showing the relationships. They argue that racism primarily occurs along two dimensions—one empathetic and one cognitive—and produce a four-item battery with different questions designed to capture each.
The four items, with which respondents are asked to indicate the extent to which they agree (1 = strong agreement, 5 = strong disagreement), are:
• I am angry that racism exists.
• White people in the U.S. have certain advantages because of the color of their skin.
• I am fearful of people of other races.
• Racial problems in the U.S. are rare, isolated situations.
The items correlate well with earlier measures of racial attitudes, and are associated with issue attitudes regarding amnesty, affirmative action, and repeal of the Affordable Care Act. They also predict 2012 voting behavior. In analysis, responses to these items predict vote choice at similar levels of efficiency as responses to the racial resentment battery.
Following DeSante and Smith, who note that each of the four items are designed to tap into distinct aspects of the ways in which white Americans think about race, we do not add them into a scale and instead treat each item separately in our analysis.Footnote 31
Economic Distress
We test multiple measures of individual and community-level economic distress. Some scholars have argued that community-level economic conditions will be more strongly associated with voting behaviorFootnote 32 than individual economic distress. However, as Gerald Kramer has argued, changes in an individual’s financial circumstances can be affected by politically relevant factors such as government policy as well as politically irrelevant factors such as exogenous shocks or life cycle considerations (retirement, for example)—and that for this reason one should not necessarily expect economic voting to be purely sociotropic.Footnote 33 While our dataset does not allow us to fully address the aggregation problems laid out in Kramer’s article, we are able to address some of these concerns using the data we have available. These approaches to operationalizing economic distress are discussed briefly later, and further in the online appendix.
Aside from a baseline measure of family income, the CCES includes two main items that could be interpreted as tapping into individual-level economic distress: a general question asking the respondent whether their household’s income increased, decreased, or stayed the same in the previous four years; and a specific question asking whether the respondent lost a job in the previous four years. The survey also includes a question asking the respondent whether the national economy has gotten better or worse in the previous year. As discussed in greater detail in the online appendix, there is reason to believe that these general economic items—regarding both the state of the national economy and household income trends—reflect some degree of partisan expressive responding, while the specific question regarding job loss does not. For this reason, we use the job loss item to operationalize personal economic distress in our models.Footnote 34
To operationalize economic distress at the community level, we draw inspiration from Healy and Lenz, who find that decreases in county-level average weekly wages from the first to third quarter of 2016 were associated with increases in county-level support for Donald Trump.Footnote 35 Healy and Lenz also find that foreclosures were positively associated with Trump support at the ZIP code level in California. ZIP codes may more closely approximate the “community” level than counties, which are often large enough to contain multiple communities with highly variable economic conditions. While ZIP code-level foreclosure data is not available nationally, we use the IRS’s Statistics of Income database to operationalize economic distress at this geographic level, calculating the percentage of tax returns in each respondent’s ZIP code that reported receiving income from Unemployment Insurance or the Earned Income Tax Credit in 2015.Footnote 36 Models reported in the main body of the paper use 2015 ZIP Unemployment Insurance receipt to operationalize community economic distress; specifications using other operationalizations are included in the online appendix, and lend themselves to substantively similar interpretations.
Economic Distress and 2016 Voting Behavior: Descriptive Analysis
To begin, we explore cross-tabulations of demographics, economic indicators, policy views, and racial attitudes as they pertain to 2016 voting behavior. Respondents are weighted using the CCES’s vote-validated post-election weights, and are based on the subset of CCES respondents who matched to a voter file.
Economic Distress
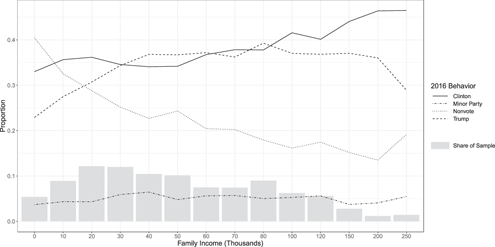
We first examine how voting behavior varied across different dimensions of individual and local economic distress, beginning with self-reported family income. As figure 1 shows, in line with previous literature,Footnote 37 lower-income respondents were much less likely to vote than respondents with higher family incomes. Interestingly, as figure 1 also shows, while Hillary Clinton’s vote share increases at a modest but consistent rate as income increases, Donald Trump received a lower share of the vote at both the low and high ends of the income spectrum.
Distribution of 2016 voting behavior by family income

Next, we examine patterns in turnout and vote choice between those who did and did not lose a job in the previous four years. These patterns suggest that Hillary Clinton received less support among those who lost a job during President Obama’s second term. However, as figure 2 shows, this penalty mostly took the form of not voting, rather than voting for Donald Trump—even among white respondents.
Differences in 2016 voting behavior by race and four-year employment

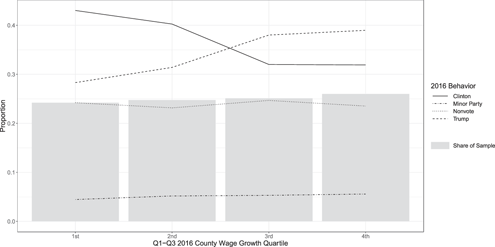
Examining local economic conditions, starting with county-level percent changes in average weekly wages in figures 3 and 4, tells a similar story. Broadly speaking, Hillary Clinton did better in areas with strong county wage trends and Donald Trump did better in areas with weaker county wage trends. However, breaking these trends down by racial sub-group shows that these effects are largely driven by two factors—first, within racial sub-groups, variation in county wage trends is only clearly associated with variation in two-party vote choice among white respondents; second, between racial sub-groups, a greater share of white respondents live in counties experiencing poor wage growth while a greater share of non-white respondents live in counties with strong wage growth.
Distribution of 2016 voting behavior by county wage trends

Distribution of 2016 voting behavior by county wage trends and race

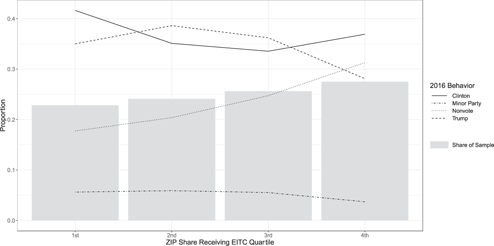
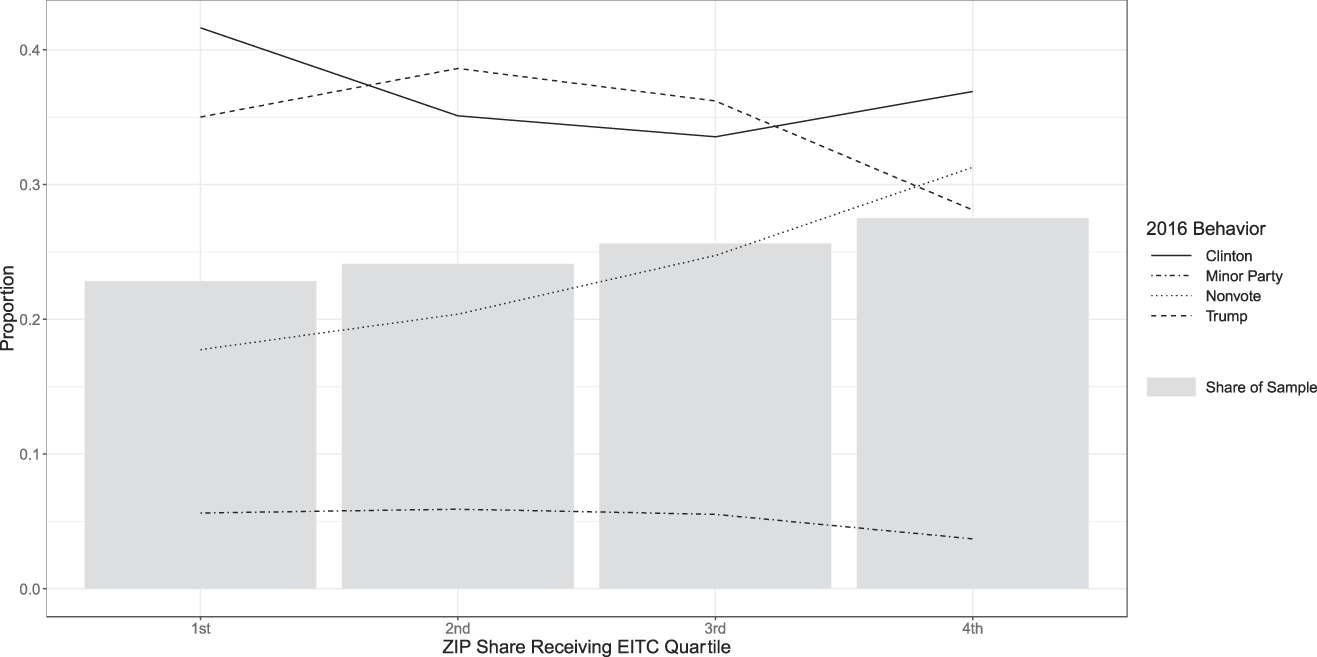
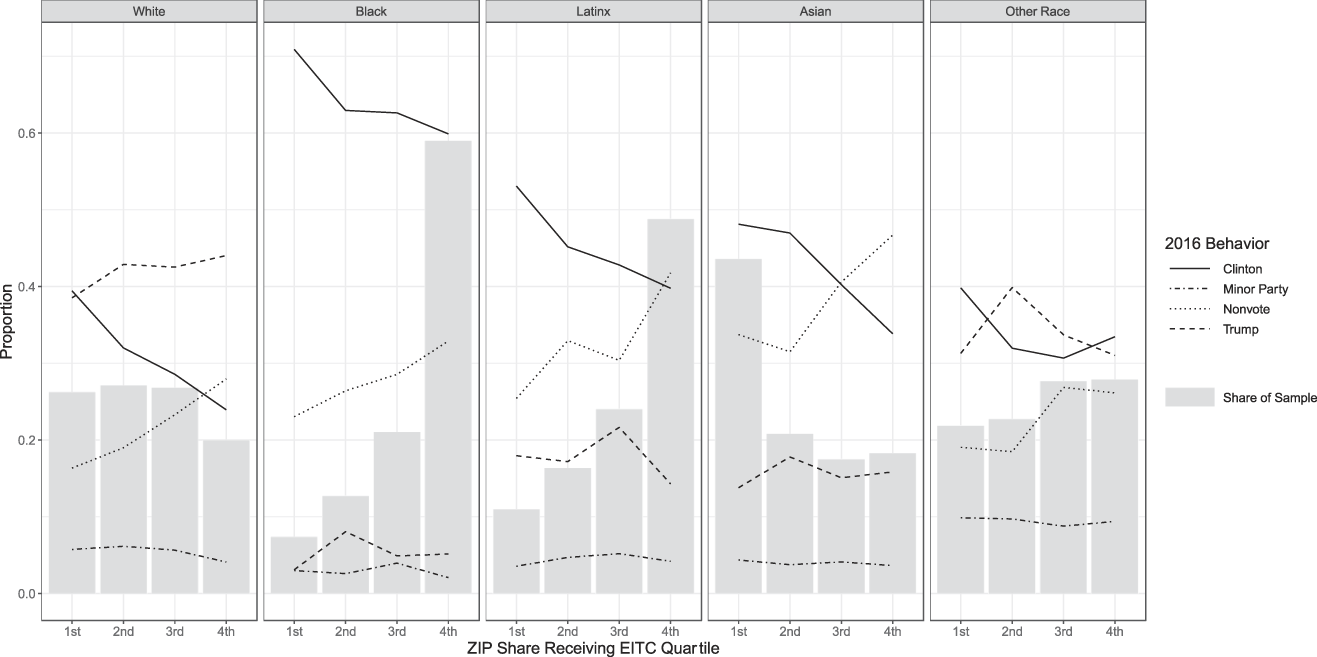
Next we look at static economic conditions, starting with the share of tax returns in a respondent’s ZIP code that reported receiving income from the Earned Income Tax Credit (EITC), a proxy for the working poor. As figures 5 and 6 show, respondents who live in ZIP codes with higher rates of EITC receipt were less likely to vote overall, and were particularly less likely to vote for Trump. The relationship between ZIP-code EITC reliance and non-voting was relatively consistent across racial groups. Notably, while there appears to be a slight trend between local share of working poor and Trump voting among white respondents, even among this sub-group, non-voting accounts for much more of Clinton’s decline in vote share along this dimension. We also note differences in the share of each racial group living in ZIP codes with different levels of EITC reliance. More than half of black respondents, and nearly half of Latinx respondents, live in ZIP codes that are in the top quartile of EITC reliance.
Distribution of 2016 voting behavior by share of ZIP receiving EITC
Distribution of 2016 voting behavior by share of ZIP receiving EITC and race
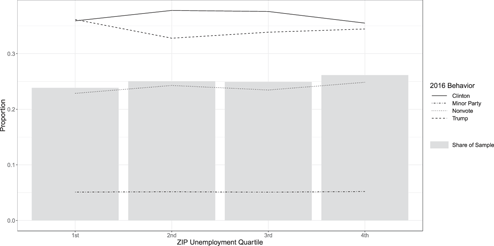
As shown in figures 7 and 8, no clear trends emerge when 2016 voting behavior is cross-tabulated by ZIP-level Unemployment Insurance reliance, bucketed by quartile, and race.
Distribution of 2016 voting behavior by share of ZIP receiving Unemployment Insurance

Distribution of 2016 voting behavior by share of ZIP receiving Unemployment Insurance and race

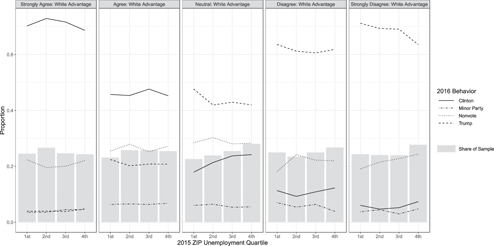
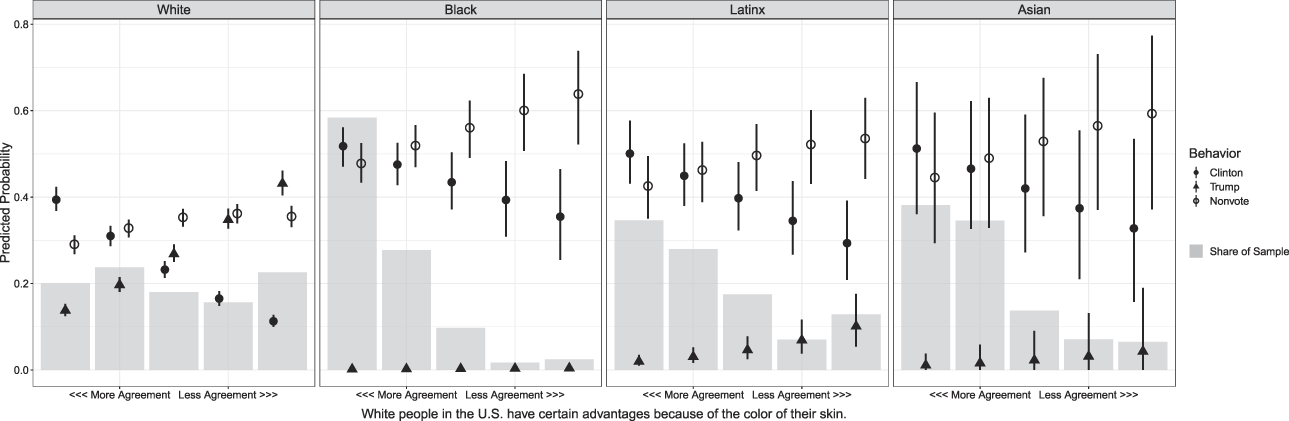
Finally, we find that the bivariate relationship between racial attitudes and voting behavior is consistent across local economic contexts. As figure 9 shows, Clinton won essentially the same share of respondents who agree that white people have certain advantages due to the color of their skin in ZIP codes with the lowest and highest shares of tax returns reporting Unemployment Insurance income in 2015.Footnote 38 Trump won the vast majority of respondents who disagree that white people have such advantages across all levels of Unemployment Insurance receipt and, if anything, won a slightly higher share of these voters in ZIP codes where the lowest shares of tax returns reported receiving Unemployment Insurance in 2015.
Distribution of 2016 voting behavior by local unemployment and acknowledgement of white advantage

Model Specification
Moving beyond descriptive analyses, we specify multinomial logistic regressions with the dependent variable being an unordered category that takes four possible outcomes: voting for Hillary Clinton, voting for Donald Trump, voting for a minor party candidate, or not voting. Following Masuoka and Junn, who note that members of different racial groups experience politics in fundamentally different ways in the United States, models reported here are subsetted to vote file-matched respondents who identify as white, black, Latinx, or Asian, respectively.Footnote 39
Our primary independent variables of interest are responses to the four FIRE scale items and the percent of 2015 tax returns in each respondent’s ZIP code that reported receiving Unemployment Insurance. Additionally, we control for partisan and ideological identification, living in a swing state,Footnote 40 the share of the state’s voting-age population that was disenfranchised due to a felony conviction,Footnote 41 gender, age, sexual orientation and gender identity, college degree, family income, and whether the respondent identifies as a born-again Christian. Age is centered at its mean and divided by its standard deviation. Family income and 2015 ZIP Unemployment are logged to account for non-normality in their distributions.
Results
Results for each model specification, subsetted to voter-file matched respondents who identify as white, black, Latinx, and Asian, are shown in tables 1 through 4, respectively. These results are pooled from models specified across each of the five imputed datasets. As 134 respondents did not report their race and were each assigned to at least two racial groups across the five rounds of imputation, we report the average number of respondents included in each specification. Political identity variables—partisanship and ideology—are included in the model as factor variables and are omitted from the regression tables in the main body of the paper for length; versions of these tables with these coefficients shown are in online appendix tables A18 through A21. In all cases, the reference category is voting for Clinton.
Predictors of 2016 voting behavior among white voter file-matched respondents

Note: Reference category = vote Clinton; standard errors in parentheses.
* p<0.05
Predictors of 2016 voting behavior among black voter file-matched respondents

Note: Reference category = vote Clinton; standard errors in parentheses.
* p<0.05
Predictors of 2016 voting behavior among Latinx voter file-matched respondents
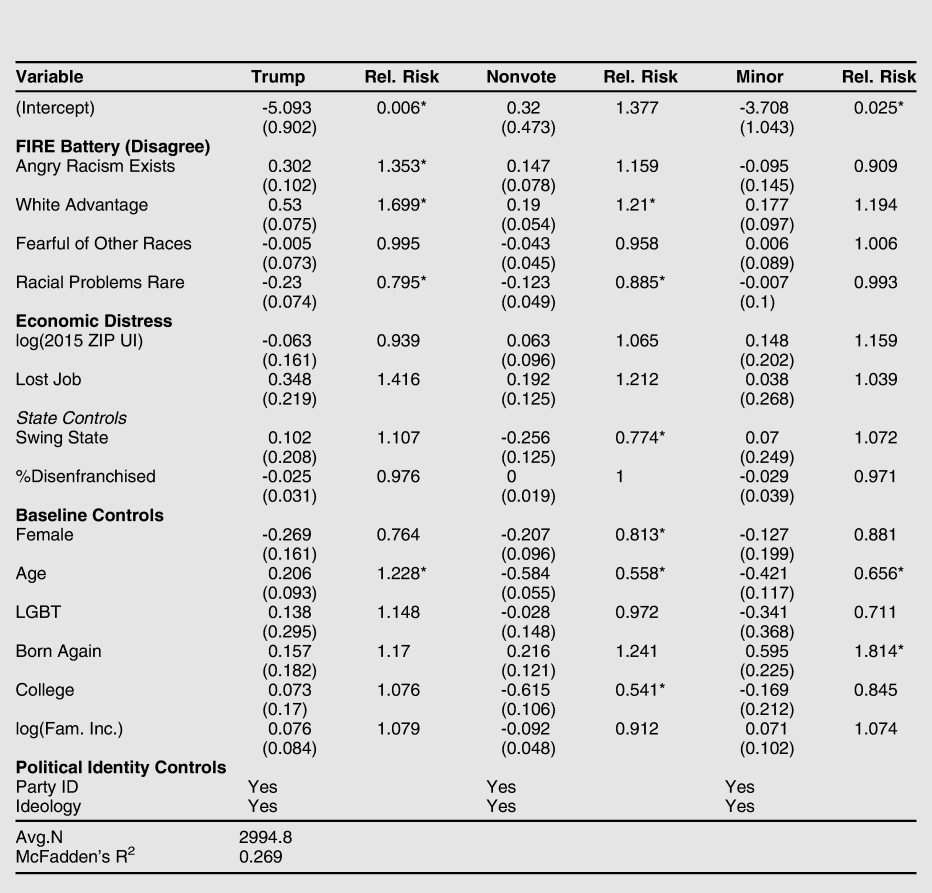
Note: Reference category = vote Clinton; standard errors in parentheses.
* p<0.05
Predictors of 2016 voting behavior among Asian voter file-matched respondents
Note: Reference category = vote Clinton; standard errors in parentheses.
* p<0.05
As the FIRE battery and economic distress variables do not share a common scale and do not have clearly identifiable baselines, we do not directly compare them here. Referring back to concerns raised by Kramer,Footnote 42 we also acknowledge that job loss and local unemployment can both represent a mixed bag of economic phenomena—some of which voters tie to politics, and some of which they do not—and this could lead our models to underestimate the extent to which economic distress is associated with voting behavior among those who do attribute such distress to decisions made by political leaders.
Table 1 outlines the relationships that racial attitudes and economic distress had with 2016 voting behavior among white voter file-matched respondents. This carries a McFadden’s pseudo-RFootnote 2 of .374, indicating a very good improvement in fit over a null model.Footnote 43 As the coefficients and risk ratios indicate, all four of the FIRE battery items and both of the economic distress variables are associated with significant changes in the likelihood of voting for Donald Trump as opposed to Hillary Clinton among white voter file-matched respondents in their expected directions. In many but not all cases, and to slightly lesser extents, these variables are also associated with changes in the likelihood of not voting as opposed to voting for Hillary Clinton.
In substantive terms, holding all else constant, a one-unit movement in the racially conservative direction (disagreement) on the first FIRE battery item, anger that racism exists, is associated with nearly a 36% increase in the relative likelihood that a white vote-validated respondent reported voting for Trump over Clinton, a 24% increase in the relative likelihood that they didn’t vote relative to voting for Clinton, and a 27% increase in the relative likelihood that they reported voting for a minor party candidate as opposed to Clinton. A one-unit movement in the racially conservative direction (disagreement) on the second FIRE battery item, acknowledgement that white people have certain advantages due to the color of their skin, is associated with even higher relative likelihoods of voting for Trump, not voting, or voting for a minor party candidate relative to voting for Clinton—82%, 44%, and 19% respectively. For the third and fourth FIRE battery items, a one-unit increase in disagreement points in the opposite direction. Unit changes indicating weaker agreement/stronger disagreement with the statement that “I am fearful of people of other races” are associated with roughly 10% and 9% reductions in the relative likelihoods of voting for Trump or not voting instead of voting for Clinton, respectively, while being associated with an 8% increase in the relative likelihood of voting for a minor party candidate. Finally, weaker agreement/stronger disagreement with the statement that racial problems in the United States are rare, isolated situations is associated with 24%, 16%, and 20% declines in the relative likelihood of voting for Trump, not voting, and voting for a minor party candidate, respectively, relative to voting for Clinton.
Turning to the economic distress variables, we find that a one-unit increase in the logged share of a white voter file-matched respondent’s ZIP code that reported receiving Unemployment Insurance in 2015 is associated with an 12% increase in the relative likelihood that they reported voting for Trump over Clinton. This change is also associated with a 10% increase in the predicted probability of not voting, relative to voting for Clinton. Holding all else constant, losing one’s job in the previous four years is associated with a 15% increase in the relative likelihood of voting for Trump, a 16% increase in the relative likelihood of not voting, and a 21% increase in the relative likelihood of voting for a minor party candidate, relative to voting for Clinton.
Results from our model specified on black voter file-matched respondents are reported in table 2. As there was less variation in black voting behavior than there was in white voting behavior, this model does not improve fit over a null model by as much as was the case for white respondents, and the McFadden’s pseudo-RFootnote 2 here is .176. Broadly speaking, we find that racial attitudes and economic distress are both significantly associated with black voter file-matched respondents’ voting behavior in the 2016 election in some cases, but that these relationships are different than they are for white respondents.
Responses to the second and fourth FIRE battery items predict similar changes in the relative likelihood of voting for Donald Trump over Hillary Clinton as they do for white respondents, in keeping with previous findings that people of color at times adopt dominant racial ideologies.Footnote 44 However, in only one instance is disagreement with any of these items (acknowledgement of white advantage) associated with the relative likelihood of not voting as opposed to voting for Hillary Clinton. Additionally, the coefficient for the third FIRE battery item, fear of other races, is never statistically distinguishable from zero among this subset of respondents. This is likely to be expected given that, while the other three FIRE battery items deal with more abstract concepts that can plausibly be applied by members of any racial sub-group, “other races” by definition means different things to respondents in different racial sub-groups.
Additionally, we note that the intercept for Trump voting among this subset of respondents is lower than it is for white voter file-matched respondents, and black and white respondents differ on other relevant dimensions (namely, partisan identification). This being the case, similar increases in the relative likelihood of voting for Trump over Clinton do not translate into similar increases in the absolute likelihood of making this selection, and we would caution against interpreting these results as evidence that meaningful numbers of racism-denying black citizens voted for Donald Trump. As we will show later, racially conservative beliefs among black respondents are not associated with a substantively large predicted probability of actually voting for Donald Trump—even if this predicted probability is higher than it is for racially liberal black respondents.
Similarly, we find that economic distress among black voter file-matched respondents carries different relationships with their voting behavior than it does for their white counterparts. Living in areas with higher local unemployment is significantly associated with increases in the predicted probability of voting for Trump (though, again, this does not translate into substantively large predicted probabilities in absolute terms), and the coefficient for job loss and Trump voting is both noisy (with a high absolute value that is still less than two standard errors from zero) and negative, indicating that, if anything, black respondents who lost a job in the previous four years were less likely to vote for Trump, relative to voting for Clinton. Moreover, local unemployment is more strongly associated with non-voting for black respondents than it is for white respondents, with a log-unit increase in the share of a black respondent’s ZIP code that reported Unemployment Insurance in 2015 being associated with a 25% increase in the relative likelihood that the respondent would not vote, as opposed to voting for Clinton.
Results for our model specified on Latinx voter file-matched respondents are reported in table 3. This model explains more fit relative to a null model than the one specified on black respondents, carrying a McFadden’s pseudo-RFootnote 2 of .269. Here, we find that the first, second, and fourth FIRE battery items explain variation in Latinx two-party vote choice relative to voting for Clinton, while the second and fourth are significantly associated with turning out to vote. However, as was the case for black respondents, the fear of other races item is not meaningfully associated with any voting behavior among Latinx respondents.
Furthermore, we do not find evidence that economic distress was meaningfully associated with changes in voting behavior among Latinx voter file-matched respondents. In some cases, the coefficients for these variables are large, but they are noisy, never falling more than two standard errors away from zero.
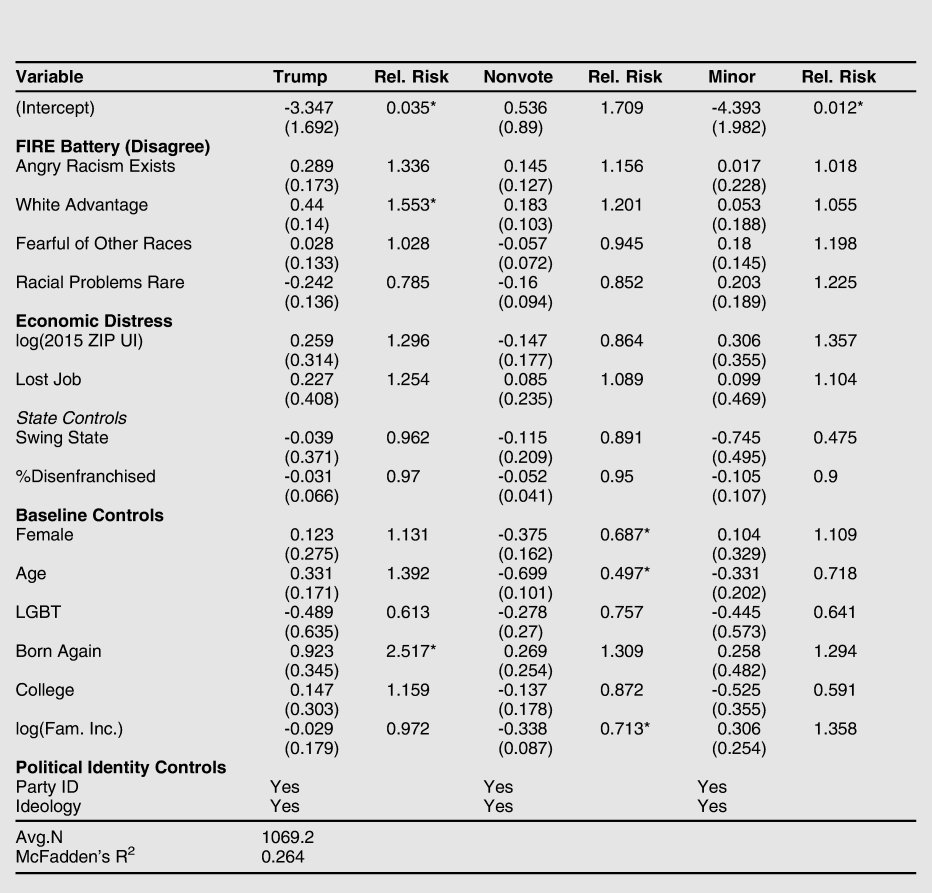
Finally, we present the results of our model specified on Asian voter file-matched respondents in table 4. This model carries a similar fit to the model specified on Latinx respondents, and explains a good amount of variation in Asian voting behavior relative to a null model.
Racial attitudes and economic distress are not consistently associated with 2016 voting behavior among Asian voter file-matched respondents, with only one coefficient for one outcome along these constructs reaching conventional levels of statistical significance. Each additional unit of disagreement with the idea that white people have advantages due to the color of their skin was associated with a 55% increase in the relative likelihood of Asian voter file-matched respondents voting for Trump. Age, education, gender, religion, and household income are also significantly associated with at least one outcome among this subset.
Visualizing Substantive Effects
Selected visualizations of predicted probabilities associated with changes in racial attitudes and economic distress are shown in figures 10 through 15. These probabilities are generated by re-specifying the model on 200 resamples of each of the five imputed datasets and predicting outcomes associated with different values of key independent variables of interest, with all other independent variables held at the medians for their racial sub-group except for swing state, which is set to 1.Footnote 45 This generates 1,000 bootstraps from which we take the 2.5th and 97.5th percentile of each probability to generate prediction intervals. In cases where all four outcomes across all four racial sub-groups are not shown, this is in order to highlight particular outcomes among particular subgroups, and corresponding plots with all outcomes for all sub-groups are shown in the Model Visualizations section of the online appendix.
Modeled voting behavior by race and racial empathy
Note: Estimates with bootstrapped 95% prediction intervals for respondents in a swing state. All other predictors held at their racial group medians.

Modeled voting behavior by race and acknowledgement of white advantage
Note: Estimates with bootstrapped 95% prediction intervals for respondents in a swing state. All other predictors held at their racial group medians.
Modeled voting behavior by fear of other races among whites
Note: Estimates with bootstrapped 95% prediction intervals for respondents in a swing state. All other predictors held at their racial group median.

Modeled voting behavior by race and acknowledgement of systemic racism
Note: Estimates with bootstrapped 95% prediction intervals for respondents in a swing state. All other predictors held at their racial group medians.

Modeled voting behavior by race and local unemployment
Note: Estimates with bootstrapped 95% prediction intervals for respondents in a swing state. All other predictors held at their racial group medians.

Differences in modeled 2016 voting behavior by race, local unemployment, and job loss
Note: Values calculated by subtracting median bootstrapped predictions. Local unemployment and job loss varied, swing state set equal to 1, and all other independent variables held at their racial group medians.

Predicted probabilities associated with changes in responses to the first FIRE battery item, “I am angry that racism exists,” are shown in figure 10. Here, we find that among white voters, more disagreement with the statement is associated with a significantly lower predicted probability of voting for Clinton and a significantly higher predicted probability of voting for Trump, with no notable changes in the predicted probability of not voting. Among Latinx respondents, similar changes in this independent variable are associated with a lower predicted probability of voting for Clinton (though the prediction intervals are much wider). However, this move away from Clinton takes the form of slightly higher probabilities of both voting for Trump and not voting. Finally, this FIRE battery item does not predict substantive changes in any voting behavior among black voter file-matched respondents, as their predicted probability of voting for Trump is negligible in all cases.
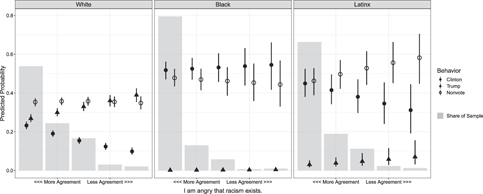
Predicted probabilities associated with changes in responses to the second FIRE battery item, “White people in the U.S. have certain advantages because of the color of their skin,” are shown in figure 11. Here, we find that the same trends that were present for the first FIRE battery are even more pronounced. White voter file-matched respondents who strongly agree with this statement are more likely to have voted for Clinton than they are to have done anything else; white voters who strongly disagree with this statement are more likely to have voted for Trump than they are to have done anything else; white voters who neither agree nor disagree with this statement are only slightly more likely to have voted for Trump than they are to have voted for Clinton, and are most likely to have not voted. As with the first FIRE battery item, voter file-matched Latinx respondents who deny that whites have advantages are less likely to have voted for Clinton and more likely to have either voted for Trump or not voted. A similar, albeit noisier, representation of this trend emerges for Asian voter file-matched respondents. However, while black voter file-matched respondents are similarly unlikely to have voted for Trump conditional on changes in this independent variable as they were in the previous plot, those in this racial sub-group who deny that whites have advantages are significantly more likely to have not voted, contributing to a decline in the probability of voting for Clinton.
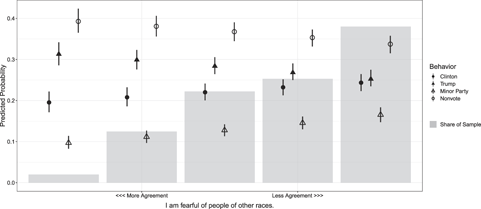
Predicted probabilities associated with changes in responses to the third FIRE battery item, “I am fearful of people of other races,” among whites are shown in figure 12. Here, we find that those who strongly agree that they fear people of other races are over ten percentage points more likely to have voted for Trump; among those who strongly disagree with this statement, the difference in predicted probabilities between Trump and Clinton voting are statistically indistinguishable.
Predicted probabilities associated with changes in responses to the fourth FIRE battery item, “Racial problems in the U.S. are rare, isolated situations,” are shown in figure 13. As disagreement with this item indicates racially liberal responses, the trends are reversed relative to each of the first two FIRE battery items, where greater disagreement corresponds with racial conservatism. As the predicted probability plot shows, white voter file-matched respondents who strongly agree that racial problems in the United States are rare, isolated situations are predicted to be more than twice as likely to have voted for Trump than Clinton, while these probabilities are roughly equal among white voter file-matched respondents who strongly disagree with this statement. The predicted probability of not voting among white voter file-matched respondents is essentially unchanged across different values of this FIRE battery item. However, among the black, Latinx, and Asian sub-groups, greater disagreement with this FIRE battery item is associated with an increased probability of voting—specifically, for Clinton—though the prediction intervals are wide and for the most part overlapping for these outcomes.
Turning to economic distress, we show predicted probabilities associated with changes in local unemployment among white and black voter file-matched respondents in figure 14. Here, we find marked differences in the relationship between community level economic distress and voting behavior among white and black voter file-matched respondents. In the white sub-group, those who live in ZIP codes with low shares of residents receiving Unemployment Insurance have similar predicted probabilities of having voted for Clinton and Trump; as local unemployment increases, the predicted probability of having voted for Clinton decreases and the predicted probability of having voted for Trump or having not voted both increase slightly, with the respondent becoming significantly more likely to have voted for Trump than Clinton near the middle of the log scale. In the black sub-group, local unemployment does not predict meaningful changes in the probability of having voted for Trump. The prediction interval widens very slightly at the extreme high end of the range, but does not substantively change expectations for Trump support among this group of respondents. Instead, black respondents in high-unemployment ZIP codes are significantly less likely to have voted for Clinton due to their being significantly more likely to have not voted at all.
Finally, we show how the degree to which personal job loss changes the predicted probability of voting behavior by racial sub-group by subtracting the estimated probability of engaging in each type of voting behavior by race and local unemployment among those who did and did not report losing a job, respectively. While we generally find that voter file-matched respondents who reported losing a job in the previous four years were less likely to vote for Clinton, this penalty was more severe among people of color and was most likely to take the form of not voting, as opposed to voting for Trump.
Discussion
Our findings highlight the complex roles that racial attitudes and economic distress played in organizing voting behavior in the 2016 election. In line with an emerging consensus in the literature,Footnote 46 we find that racial attitudes are crucial in explaining variation in support for Donald Trump among white voters. We also find evidence that, after controlling for racial attitudes, economic distress at the individual and community levels explain additional variation in white voters’ support for Donald Trump. However, when we expand the scope of analysis beyond whites’ support for Donald Trump, we find different roles for racial attitudes and economic distress that have not been centered in previous individual-level analyses of the 2016 election. In particular, we find that for black voter file-matched respondents, higher local unemployment predicts a lower probability of having voted for Clinton via non-voting, rather than voting for Donald Trump. Furthermore, people of color who endorse dominant racial narratives—denying the existence of systemic racism and white privilege—were also less likely to vote, while endorsement of similar racial narratives more strongly predicted Trump voting among white respondents.
These findings suggest that local economic conditions cannot be interpreted on their own when looking at their relationship to U.S. politics. Different sub-groups of voters are likely to experience different forms of economic hardship, and even when they experience the same forms of economic hardship they may respond to them differently. Much in the same way, even though people of color may at times endorse racially conservative sentiments that are typically associated with whites’ understanding of racial issues on surveys, these responses may not carry the same relationships with voting behavior in practice.
Our paper makes multiple contributions to understanding the 2016 election specifically and U.S. politics more generally. Methodologically, it adds depth and nuance to existing debates regarding the election by leveraging new data that more accurately capture key constructs of interest, subsetting by racial sub-group, and treating voting behavior as more than selection between two major party candidates. More importantly, these methodological changes allow us to broaden the scope of how and for whom there were associations between racial attitudes, economic distress, and presidential voting behavior in 2016. In doing so, it shows that race and economic conditions do not exist as independent stories in the 2016 election, and should not be directly compared for the purposes of concluding that one proved more consequential than the other. While racial attitudes are certainly crucial in explaining support for Donald Trump among white voters, this should not lead observers to discount personal and local economic conditions as explanatory factors for other forms of voting behavior among people of color. As our analysis indicates, both racial attitudes and economic distress mattered in 2016—but they mattered differently among different subsets of the electorate.
Supplementary Materials
Appendix Tables A1–A32
Appendix Figures A1–A18
To view supplementary material for this article, please visit https://doi.org/10.1017/S1537592718003365