


1. Introduction
The video game industry is one of the driving forces behind the entertainment industry. In 2020 alone, it generated revenues for € 23.3 billion across the European Union (Coenen & Lesser, Reference Coenen and Lesser2021). Interestingly, the majority of these revenues were collected through “in-game extras and additional downloadable content for games already purchased” (64%) rather than “full game downloads” (25%) (Coenen & Lesser, Reference Coenen and Lesser2021). For example, in the same year loot boxes generated estimated revenues of at least $15 billion worldwide (Cordes et al., Reference Cordes, Dertwinkel-Kalt and Werner2024).
Loot boxes are digital containers of randomised rewards (Zendle et al., Reference Zendle, Walasek, Cairns, Meyer and Drummond2021). A consumer purchasing a loot box exchanges a predetermined monetary sum with a chance-based assortment of in-game content of different values. Despite the fact that the reward mechanism of loot boxes has been compared to gambling activities (Drummond & Sauer, Reference Drummond and Sauer2018), there are very few regulations on the practices used to sell these items. For example, loot boxes are often sold in exchange for virtual currencies with non-intuitive exchange rates, with time-limited offers, or in bundles (Cerulli-harms et al., Reference Cerulli-harms, Marlene, Christian, Frithjof and Pierre2020; Zendle et al., Reference Zendle, Cairns, Barnett and McCall2020; Macey & Hamari, Reference Macey and Hamari2019). These practices could potentially distort the economic behaviour of the average consumer and, thus, be considered unfair according to the European marketing framework (European Parliament and The Council of the European Union, 2015). In a recent study, Cordes et al. (Reference Cordes, Dertwinkel-Kalt and Werner2024) show that practices such as opaque odds and positively selected feedback, can artificially inflate the belief of winning a prize, increasing the purchasing intentions of loot boxes. Moreover, on March  $21^{st}$, 2025, the European Commission suggested to avoid practices in which the consumer is forced to purchase virtual currencies, which are commonly used to sell loot boxes, with the aim of creating “a safer and more transparent experience for players”(European Commission, 2025). Thus, regulating the practices used to sell loot boxes, could be relevant to increase transparency and protect consumers from inefficient allocation of resources.
Among the many features that could be examined, we focus on the use of in-game virtual currencies, given the interest shown by the European Commission and their relevance from an economic perspective. Virtual currencies can be found in most online games.Footnote 1 Virtual currencies are used by game developers to sell loot boxes as well as cosmetics, characters and cards in games. While virtual currencies are meant to avoid the interference of real money with the game experience (Holin Lin & Sun, Reference Lin and Sun2011), they can disguise the true price of in-game products and, consequently, distort consumers spending behaviours. Moreover, game developers typically set exchange rates between real-world and virtual currencies with nominal prices higher than the corresponding prices in euros, dollars, or any real world currency (RWC). This strategy can lead to the so-called “money illusion effect” (or face value effect), which has been shown to be relevant for consumers’ product evaluation and spending behaviour (Raghubir & Srivastava, Reference Raghubir and Srivastava2002). Finally, exchange rates are often non-intuitive, and it may be cognitively demanding for players to compute the price of a loot box in the corresponding RWC. In the next section, we examine a case in which a loot box is priced at 260 gems and the exchange rate is 177gems=1£.
Our study examines the effect of virtual currencies, money illusion and non-intuitive exchange rates on consumers’ spending behaviour in an incentivised randomised controlled trial with 753 UK participants recruited on the Prolific platform. To investigate consumers’ spending behaviour, we measure participants’ Willingness-To-Pay (WTP) for acquiring different loot boxes. In our experimental setup, and similarly to Cordes et al. (Reference Cordes, Dertwinkel-Kalt and Werner2024), loot boxes are represented as a series of risky and ambiguous lotteries, where the possibility of receiving a reward is based on a random component. In risky lotteries we examine the virtual currency effect, the money illusion effect and the effect of non-intuitive exchange rates on different probabilities of winning and losing a reward. Similarly, these effects are examined with ambiguous lotteries, which mimic a particular, and common, design of loot boxes where the information about the probability of receiving a reward (or losing the endowment) is generic.
Our first result shows that virtual currencies increase the WTP for transactions involving risk and ambiguity compared to transactions in RWC. This evidence challenges the neutrality of virtual currencies and suggests that this practice may distort the economic behaviour of the average consumer. We argue that this effect could be determined by a “Pain of Paying” mechanism (Mazar et al., Reference Mazar, Plassmann, Robitaille and Linder2016). Our second result indicates that participants in our study are affected by money illusion distortions. In particular, participants reduce their WTP for transactions in which the nominal value is higher than the corresponding value in RWC compared to the condition in which participants use virtual currencies with an exchange rate of 1. This effect is found comparing two intuitive exchange rates indicating that the money illusion effect can be independent from participants’ computational skills. In addition, we test the effects of an intuitive exchange rate where the nominal value is below the real value. As expected, we observe the highest levels of WTP across all conditions, but the effect is not significant compared to the condition in which participants use virtual currencies with an exchange rate of 1. Instead, we find a significant difference with the condition in which participants use RWC, a relevant result for cryptocurrency transactions where these exchange rates are fairly common.Footnote 2 Lastly, we find no evidence that the use of non-intuitive exchange rates has an impact on agents’ WTP compared to intuitive exchange rates of comparable size.
Overall, this study suggests that the practices under examination can distort the economic behaviour of the average consumers and supports the regulation of virtual currencies as proposed by the European Commission on March 21 $^{st}$, 2025.
The rest of the paper is organised as follows. As our research spans different sub-fields of behavioral economics, in Section 2 we discuss separately the literature related to virtual currencies, money illusion and non-intuitive exchange rates, as well as the hypothesis of our study. In Section 3 we present the experimental design. In Section 4 we present descriptive, non-parametric and econometric results for our research questions. In Section 5 we discuss our results and conclude with policy implications.
2. Literature review
2.1. Virtual currencies
Virtual currencies (VC) are defined as “digital representations of value, not issued by a central bank, credit institution or e-money institution, which in some circumstances can be used as an alternative to money” (European Central Bank, 2015). From the user perspective, in-game virtual currencies can facilitate trading activities and in-game transactions (Alghamdi & Beloff, Reference Alghamdi and Beloff2015), by framing these activities as part of the game and avoiding the interference of real money with the game experience (Holin Lin & Sun, Reference Lin and Sun2011). However, the use of virtual currency may be considered an “unfair practice” (Petrovskaya & Zendle, Reference Petrovskaya and Zendle2021), which the European Commission defines as the practices that “materially distort the economic behaviour of consumers”.Footnote 3 (European Parliament and The Council of the European Union, 2015). Indeed, on March  $21^{st}$, 2025, the European Commission outlined the minimum requirements for the purchase and use of virtual currencies(European Commission, 2025), suggesting the avoidance of practices in which the consumer is forced to purchase virtual currencies with the aim of creating “a safer and more transparent experience for players”(European Commission, 2025). However, neither the economic nor the game science literature examines the behavioural effects of virtual currencies on consumers’ spending behaviours for transactions involving risk and ambiguity, which are among the most common. Hence, it is still unclear whether the use of virtual currencies for loot box transactions can be rightfully considered an unfair practice.
To address this issue, we review the economic literature debating on the neutrality of experimental currency units (ECU).Footnote 4 Early evidence suggests that ECUs may determine unexpected behavioural effects. Mazar et al. (Reference Mazar, Amir and Ariely2008) show that the rate of dishonest behaviour in a search task is higher when participants are paid with physical tokens instead of cash. Reinstein and Riener (Reference Reinstein and Riener2012) show that donations in a dictator game are higher when money is virtual compared to physical, proving the existence of a tangibility effect. And finally, Shen and Takahashi (Reference Shen and Takahashi2013) compare offers and rejections in an ultimatum game where subjects play either with cash or virtual points with an exchange rate of 1:1. Results show that offers were lower and rejections were more frequent in the virtual points condition, indicating lower levels of risk aversion.
On the other hand, some studies suggest the neutrality of VCs. Drichoutis et al. (Reference Drichoutis, Lusk and Nayga2015) examine changes in bids for an induced value second-price auction (SPA) where the exchange rate between (virtual) cash and (virtual) ECUs is manipulated. No significant differences were found between reported induced values across different exchange rates, concluding that in the particular framework of SPA, ECUs do not distort participants’ behaviour. More recently, Salminen et al. (Reference Salminen, Järvelä and Ravaja2018) studied the effect of virtual currencies, exchange rates and endowments on the spending behaviour of participants in a series of free-to-play game scenarios. No significant differences were found between purchasing intentions using euros and VCs.Footnote 5 This study, however, has two limitations. First, using authentic free-to-play game scenarios led to a limited sample size. Second, the task is non-incentivised, and it might not reflect participants’ real purchasing intentions.
The current literature shows that, depending on the context, virtual currencies may have unexpected behavioural effects on participants. However, to the best of our knowledge, no study examines the VC effect on the WTP for transactions involving risk and ambiguity. Our study contributes to the debate on the neutrality of VCs and ECUs, a central topic for economists who wish to compare conditions with different currencies. Moreover, it contributes to the European policy framework examining whether the use of virtual currencies for in-game transactions can be considered an unfair practice. Adapting the results of Shen and Takahashi (Reference Shen and Takahashi2013), the only study in which VC determines behavioural changes through changes in risk aversion, we expect participants to show less risk aversion in the virtual currency condition. As a result of lower levels of risk aversion, we expect participants in the virtual currency conditions to show higher WTP for transactions involving risk compared to a condition in which RWC (real-world currencies) are used. In particular, we compare the WTP between participants assigned to a control condition (henceforth condition TC) that uses RWC and a condition using VC with a 1:1 exchange rate (condition T1).
Hypothesis 1. We expect the WTP for online transactions involving risk and ambiguity to be higher in condition T1 compared to condition TC.
2.2. Money illusion
The money illusion effect is defined as “the tendency to think in terms of nominal rather than real monetary values” (Shafir et al., Reference Shafir, Diamond and Tversky1997). In the context of online gaming, the nominal value of an item is represented by the price shown to the consumer. For example, a loot box may cost 260 gems. The real value is instead represented by the price of the item in terms of real-world currency (RWC). In the above example, gems can be sold with an exchange rate of 177:1. Thus, the loot box costs 1.47 euros, which represents the price of the item.
The money illusion effect is a well-studied phenomenon in the economic literature. Money illusion has been shown to be relevant in explaining nominal price inertia after negative and positive nominal shocks (Fehr & Tyran, Reference Fehr and Tyran2001), as well as the relationship between inflation and real prices in housing markets (Brunnermeier & Julliard, Reference Brunnermeier and Julliard2008) and stock markets (Cohen et al., Reference Cohen, Polk and Vuolteenaho2005; Acker & Duck, Reference Acker and Duck2013). Furthermore, in a strategic environment, it has been shown that money illusion consistently leads players in an n-player pricing game to choose a Pareto inefficient equilibrium (Fehr & Tyran, Reference Fehr and Tyran2007). Recently, contrary to previous expectations, the money illusion effect has been shown to be relevant over time in strategic interactions (Morales & Fatas, Reference Morales and Fatas2021).
In the context of consumers’ behaviours, the money illusion effect takes different names depending on the specific situation. Gamble et al. (Reference Gamble, Gärling, Charlton and Ranyard2002) show that the money illusion, under the name of euro-illusion, distorted price perceptions for goods and services when the Italian government introduced the euro. The effect was also found to be relevant in the presence of a budget constraint for low-priced products (Gamble, Reference Gamble2006). The euro illusion has also been studied in the context of charitable giving, and it was found to significantly increase donations in Italian churches for the year 2002 (Cannon & Cipriani, Reference Cannon and Cipriani2006). Money illusion also applies to product valuations using foreign currencies, taking the name of face value effect. Raghubir and Srivastava (Reference Raghubir and Srivastava2002) show that consumers overspend when the nominal value of a product is lower than its real value, and they underspend when the nominal value is greater than the corresponding real value. More recently, the face value effect was found to be relevant in 80% of tourist transactions (Saayman et al., Reference Saayman, Li, Fourie and Scholtz2022), especially for less valuable goods.
The contribution of this study to the literature on money illusion is two-fold. First, it extends this concept to in-game virtual currencies context, an economic relevant context. Moreover, it introduces two methodological novelties. The studies which have been reviewed in this section examine the money illusion effect between conditions with different currencies and with exchange rates dependent on computational skills. In our study, we compare condition T1 with a condition in which the exchange rate is 100:1 (condition T100), and with a condition in which the exchange rate is 0.1:1 (condition T0.1). This framework allows us to estimate the money illusion effect controlling for the virtual currency effect and for participants’ computational skills. We expect the results of this analysis to be in line with the literature.
Hypothesis 2. We expect the WTP for online transactions involving risk and ambiguity to be lower in condition T100 compared to condition T1.
Hypothesis 2-b. We expect the WTP for online transactions involving risk and ambiguity to be higher in condition T0.1 compared to condition T1.
2.3. Non-intuitive exchange rates
Video games and online platforms often present non-intuitive exchange rates between real-world and virtual currencies. An example of non-intuitive exchange rate is given in the example of Section 2.2, where the loot box is sold for 260 gems with an exchange rate of 1:177. This practice makes price estimation difficult and cognitively demanding. As a consequence, consumers may resort to quick but inaccurate currency conversion strategies (Lemaire & Lecacheur, Reference Lemaire and Lecacheur2001; Imbo et al., Reference Imbo, Duverne and Lemaire2007), which in turn may distort their spending behaviour, representing another unfair marketing practice.
We contribute to the literature on numerical estimation by investigating the effect of non-intuitive exchange rates between real-world and virtual currencies on the WTP for online transactions that involve risk. We study a unique scenario of a non-intuitive exchange rate, where the conversion is challenging and not further affected by money illusion bias. In particular, we compare the WTP in condition T100 with two conditions in which the exchange rate is 93:1 (condition T93) or 107:1 (condition T107). Previous studies have not extensively researched this area, therefore we adopt an exploratory approach, and we test whether the willingness to pay under non-intuitive exchange rates differs significantly from the one observed in lotteries with intuitive exchange rates of comparable size.
Hypothesis 3. We expect the WTP for online transactions involving risk and ambiguity to be different in condition T93&T107 compared to condition T100.
3. Experimental design
To test our hypotheses, we run an experiment composed of six different treatments, each including 2 within-subject conditions (see Figure 1 for a summary of the experimental structure). All treatments shared the same structure and differed only in the experimental currency used. Each treatment consisted of four phases: (1) Instructions, (2) Decision Tasks, (3) Additional Questions, (4) Payment.
Summary of the study structure. In the condition assignment phase, each participant is assigned to one condition. In the instructions phase, participants receive instructions on the task and are provided with an example to familiarise themselves with the task. Finally, they are given a set of comprehension questions for which a correct answer is necessary to take part in the study. In the decision task phase, participants are required to report their WTP for 16 different lotteries and complete two attention checks. In the additional question phase, participants are asked some additional questions. Additional question 3 is administered in conditions T1, T0.1, T100, T93 and T107. In the payment phase, participants receive a participation fee of £ 0.4 and a bonus payment depending on the outcome of the lottery

3.1. The decision tasks
Loot boxes are represented using risky and ambiguous lotteries, while the participants’ WTP is estimated using the Becker DeGroot Marschak (BDM) procedure (Becker et al., Reference Becker, DeGroot and Marschak1964), as described in Eisenberger and Weber (Reference Eisenberger and Weber1995).Footnote 6 This setup is similar to Cordes et al. (Reference Cordes, Dertwinkel-Kalt and Werner2024). In addition, to avoid the “game misconception effect” we structured the instruction phase as in Plott and Zeiler (Reference Plott and Zeiler2005), Isoni et al. (Reference Isoni, Loomes and Sugden2011) and Brebner and Sonnemans (Reference Brebner and Sonnemans2018), showing: (i) structured instructions; (ii) working examples; (iii) not paid practice examples; (iv) paid tasks; and (v) payment, in this order.Footnote 7 To screen for inattentive participants, we introduced four obligatory comprehension questions to ensure participants’ understanding of the BDM mechanism, to be answered before the experiment proper.
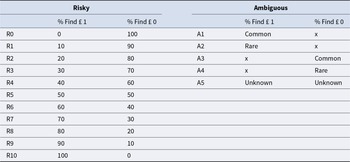
In the Decision Tasks phase, participants’ WTP is estimated for 16 lotteries, 11 risky and 5 ambiguous, with varying levels of risk and uncertainty (see Table 1). While a risky lottery reports all the possible outcomes of the lottery and the probabilities associated with each outcome, an ambiguous lottery reports the possible outcomes but only generic information about the probabilities associated with them. Risky lotteries in our study followed the structure of Holt and Laury (Reference Holt and Laury2002), giving us a complete representation of the change in WTP from lotteries with a sure probability of finding a valuable item to lotteries with a sure probability of finding an item of null value. Such design mimics those loot boxes where the likelihood of finding a valuable item is known. Ambiguous lotteries were, instead, designed to mimic settings commonly observed in free-to-play video games, where the chances of finding a valuable item are purposely kept vague and grouped as “unknown”, “common” or “rare”. In particular, we designed five ambiguous lotteries, two that emphasised the chance of finding a valuable item (either “common” called A1, or “rare” called A2) and two that focused on the chance of finding an item of null value (again “common” or “rare”, called A3 and A4, respectively). Additionally, we introduced a lottery where the chance of either outcomes is unknown (A5). By construction, lotteries A1 with A4, and A2 with A3 were equivalent (although the participants were not aware of this). Lotteries were presented in blocks (risky or ambiguous), one at a time, and their order was randomised. The block order of presentation was randomized too.
Risky and ambiguous lotteries

The chances to find an item worth £ 1 (green ball) or an item worth £ 0 (red ball) are multiplied by 100 for readability. Lotteries from R0 to R10 are risky lotteries. Lotteries from A1 to A5 are ambiguous lotteries. Lotteries A1 and A4 are equivalent to R8. Lotteries A2 and A3 are equivalent to R2. Lottery A5 is equivalent to R5.
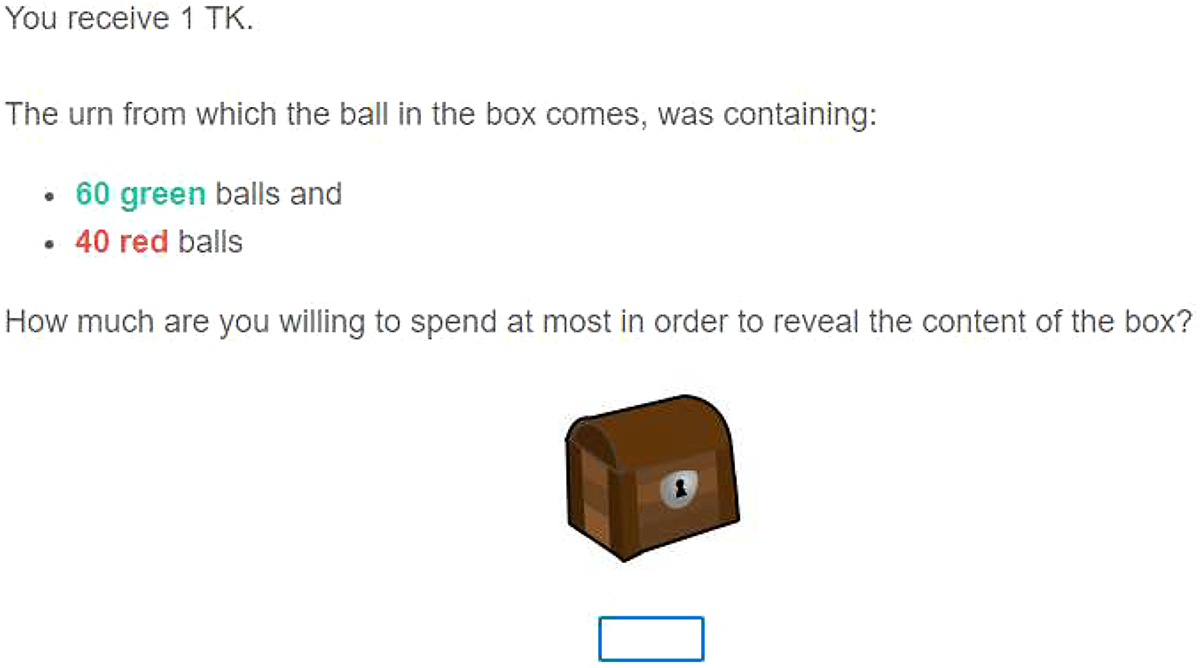
The decision task developed as follows. At the beginning of each round, participants received an endowment of £ 1 (or the equivalent value in tokens (TK): TK1, TK0.1, TK100, TK93, TK107). They were shown a box containing either a green or a red ball with probabilities according to Table 1 (Figure 2 shows the interface for the task).Footnote 8 While the red ball had no value, the green ball rewarded the participant with an additional £ 1. Participants were then instructed to report their maximum willingness to spend to reveal the box’s content, which represents participants’ WTP.
Task’s interface in condition T1 and lottery R6

This design closely reflects the way in which loot boxes operate. In video games, gamers decide whether to purchase/open a box, having only limited information about the likelihood of it containing something valuable, i.e. a good whose value is higher than the cost of opening the box. If the good is valuable, the gamers have an overall gain, as the item is more valuable than its cost. If the good is not valuable, the gamers incur an overall loss, as the item is less valuable than its cost. Their decision of accepting to pay the cost of opening the box indicates that they are willing to pay the demanded price, a mechanism we capture asking participants to report their WTP to reveal the content of a box which contains either a valuable item (green ball) or an item of null value (red ball). The BDM procedure is the ideal tool for capturing the WTP in an incentivised setting.
At the end of the study, we randomly selected one lottery and extracted its cost  $C$ from a Uniform distribution $U[0.01, 1]$. If $WTP \lt C$, the content of the box was not revealed (the gamer decides not to open a too costly box), and the final payment of the participant was equal to £ $1$(the gamer keeps the initial endowment). If, instead, $WTP\geq C$, the content of the box was revealed (the gamer is willing to pay the asked price to reveal the content of the box). Participants got £ $(2-C)$Footnote 9 if a green ball was revealed and £ $(1-C)$Footnote 10 if a red ball was revealed.Footnote 11 Equation 1 formalises the payoff structure. Gamers that do not intend to purchase any box are captured by participants stating a WTP = 0. Information about the outcome of the lottery, its cost and content was revealed at the end of the experiment.
 \begin{equation}
\begin{aligned}
&\text{Payoff}_i =
\begin{cases}
\unicode{x00A3} (2 - C) & \text{if } \text{WTP} \geq C\ \text{and a \textcolor{green}{green} ball is found} \\
\unicode{x00A3} (1 - C) & \text{if } \text{WTP} \geq C\ \text{and a \textcolor{red}{red} ball is found} \\
\unicode{x00A3} 1 & \text{if } \text{WTP} \lt C
\end{cases} \\
&\text{with } C \sim U[0.01, 1]
\end{aligned}
\end{equation}
\begin{equation}
\begin{aligned}
&\text{Payoff}_i =
\begin{cases}
\unicode{x00A3} (2 - C) & \text{if } \text{WTP} \geq C\ \text{and a \textcolor{green}{green} ball is found} \\
\unicode{x00A3} (1 - C) & \text{if } \text{WTP} \geq C\ \text{and a \textcolor{red}{red} ball is found} \\
\unicode{x00A3} 1 & \text{if } \text{WTP} \lt C
\end{cases} \\
&\text{with } C \sim U[0.01, 1]
\end{aligned}
\end{equation}3.2. Between-subject conditions
The six between-subject treatments differed for the experimental currency used. The control treatment (henceforth TC) was administered using a real-world currency, which was well known to the participants: the British Pound Sterling (£).
In treatment T1, participants used experimental tokens, whose exchange rate was 1:1, i.e., each token was worth £1. As the nominal value and the real value of the currency used in TC and T1 are the same, we interpret any observed difference as the product of switching from real to virtual currency. Therefore, the comparison of the WTP in conditions TC and T1 estimates the extent of the “virtual currency effect”.
Treatments T100 and T0.1 were designed to test the money illusion effect. In these treatments, participants used virtual tokens whose exchange rate was 100:1, where 100 tokens were worth £1 , or 0.1:1, where 0.1 tokens were worth £1. In T100 the nominal value of the currency is much higher than the real value, while in T0.1 the nominal value is below the real value. In either case, the corresponding real-world value is easy to compute. Therefore, the comparison of the WTP in conditions T100 vs T1 as well as T0.1 vs TC estimates the money illusion effect in a setting where both currencies are virtual and where the conversion is easy to compute.
To verify whether not only the distance between real and nominal value, but also the complexity of calculating the exchange rate affects gamers willingness to pay, we include treatments T93 and T107, where the exchange rates are 93:1 and 107:1. In these treatments, the nominal value is comparable to that of T100, while the mathematical calculation is more demanding due to the more intricate exchange rate. As such, any difference observed between T100 and T93&T107 can be attributed to a non-intuitive exchange rate effect. While it is possible that participants in T93 and T107 will round the exchange rate to 100 - and consequently show no effect - an exchange rate close to the one in T100 is needed to attribute any observed effect to the exchange rate only and not to the join effect of exchange rate complexity and money illusion.
3.3. Experimental procedure
We conducted a pre-registeredFootnote 12 online experiment. Participants were recruited through the platform Prolific (Palan & Schitter, Reference Palan and Schitter2018), and the experimental interface was developed using Qualtrics (Qualtrics, 2005). The experiment was conducted online to recreate the setting in which virtual currencies are commonly used. Specifically, the Prolific platform has been chosen because it allows to have a sample of UK participants, which is fundamental to ensure the validity of the results in the control condition.
Upon accessing the study, participants were randomly assigned to one of the treatments (TC, T1, T0.1, T100, T93, T107) and the experimental instructions were provided (Instructions phase). Participants had to answer four comprehension questions to proceed. Those who failed to answer all comprehension questions correctly within three attempts were excluded from the study. After successfully completing the comprehension questions, participants took part in the Decision Task phase, where the different lotteries were presented, one at a time. Once the decision tasks were completed, participants were asked three additional questions (Additional Questions phase, Figure A.5 shows AQ n.1, AQ n.2 and AQ n.3). The first was to report their risk preference using the item proposed by Falk et al. (Reference Falk, Becker, Dohmen, Enke, Huffman and Sunde2018) (AQ n.1), while the second tested their familiarity with the definition of loot box (AQ n.2). Participants were then informed of their winnings, presenting the amount in the same currency used throughout the experiment. Participants in T1, T0.1, T100, T93, and T107 were asked to convert their token-based winnings into British pounds (AQ n.3).Footnote 13 This task was used to further test the participants’ level of understanding regarding exchange rates, and it did not influence their final payment. After this last question, participants were given the show-up fee (Payment phase). The bonus payment was instead paid off after at most two weeks from the end of experiment.
We recruited 753 participantsFootnote 14 through the Prolific platform. Initially, data were collected from 602 participants, which corresponded to the pre-registered sample size.Footnote 15 Then, in July 2025, we conducted an additional session recruiting 151 participants to examine condition T0.1. We recruited 153, 151 and 149 participants in conditions TC, T1 and T100, respectively, while 73 and 76 in conditions T93 and T107. Treatments T93 and T107 offer a joint sample of 149, comparable to the size of the other treatments. Data from treatments T93 and T107 will be mostly analyzed jointly, as together, the two treatments allow to test the impact of a non-intuitive exchange rate without the possible confound of a “two digits” versus. “three digits” effect. As we show in Section A.2 participants do not perceive exchange rates in T93 and T107 as different.
The sample included only UK participants to control for nationality-fixed effects and guarantee they were accustomed to the use and value of British pounds. The sample was balanced in age, gender, risk preferences, percentage of students, loot box knowledge and time taken in the experiment across treatments. Relevant summary statistics for the participants that satisfy our inclusion criteria are reported in Table 2, while we report relevant sample balance tests in the Appendix A.1 concluding that the sample is balanced in the variables considered across treatments. The experiment lasted around nine minutes, and participants received a participation fee of £  $0.4$, plus an average bonus payment of £ $1.13$.
Descriptive statistics

Note. We report the average values and the relative standard errors. Age is the individual’s age; Female = 1 if the individual is a female; Risk Preference is the average answer to the Falk question; Student = 1 if the individual is a student at the moment of the experiment; Loot Box Knowledge = 1 if individuals answered positively to the relative question; Duration in minutes is the time spent to conclude the experiment. See Table A.1 for sample balance tests.
4. Results
In this section, we report the results of our statistical analyses. Section 4.1 presents descriptive and non-parametric analyses, while Section 4.2 presents the results of the econometric analysis. To allow for cross-treatment comparisons, participants’ WTP is normalised by dividing it by the exchange rate, thus obtaining a continuous variable in the interval  $[0,1]$.
In Appendix A.2 we verify that exchange rates in conditions T93 and T107 are perceived as less intuitive compared to T1, T100, T0.1. We find that despite the absolute conversion rate is close to 1 in all treatments, deviations from 1 (the correct value) are larger in T93 and T107 compared to T1, T100 and T0.1. Therefore, in the following analyses, conditions T93 and T107 will be merged and treated as a unique treatment with non-intuitive exchange rates, avoiding the two-digits versus three-digits effect.
4.1. Descriptive and statistical analyses
Figure 3 present the average WTP across conditions and lotteries together with the corresponding 95% confidence intervals. Figure 3 panel (a) shows that in risky lotteries, the marginal increase of the average WTP is linear. Further considerations on the distribution of values for each lottery, ambiguity aversion and framing effect for ambiguous lotteries are presented in the appendix, Section A.5.
Average WTP across conditions and lotteries in risky and ambiguous lotteries and 95% confidence intervals

To test the impact of the different treatments on the average WTP, a standard comparison of means is not feasible for two reasons. First of all, the normality assumption for the average WTP across lotteries is consistently rejected (all p-values $ \lt 0.001$, see Section A.4 of the Appendix). Second, some lotteries display unequal variances, as confirmed by a series of Levene’s tests of homogeneity of variances (see Appendix A.4). Moreover, any non-parametric rank-based test, such as the Wilcoxon signed-rank test or the Mann–Whitney U test, would not be appropriate. Since WTP values tend to be ordered sequentially as the WTP increases marginally across lotteries (e.g., $WTP_{TC,R0} \lt WTP_{T1,R0} \lt WTP_{TC,R1} \lt WTP_{T1,R1} \lt ...$), rank-based procedures lack power to detect differences between treatments. Therefore, to estimate the significance of the effect of our treatments we employ the sign test (Dixon & Mood, Reference Dixon and Mood1946), which is a non-paramteric test used for the comparison of pairwise differences. First, we estimate the differences between two treatments for each lottery, obtaining 16 (paired) data points. Then, under the null hypothesis $H_0$ of no difference between treatments, we assume that the distribution of positive (greater than 0) and negative (smaller than 0) valuesFootnote 16 can be distributed as a Binomial $(16,0.5)$. In other words, in absence of an effect of the treatment, we expect half positive values and half negative values. Finally, for each pairwise comparison, we estimate the probability of obtaining the observed number of positive values from the specified Binomial distribution. For probabilities smaller then 0.05 we reject
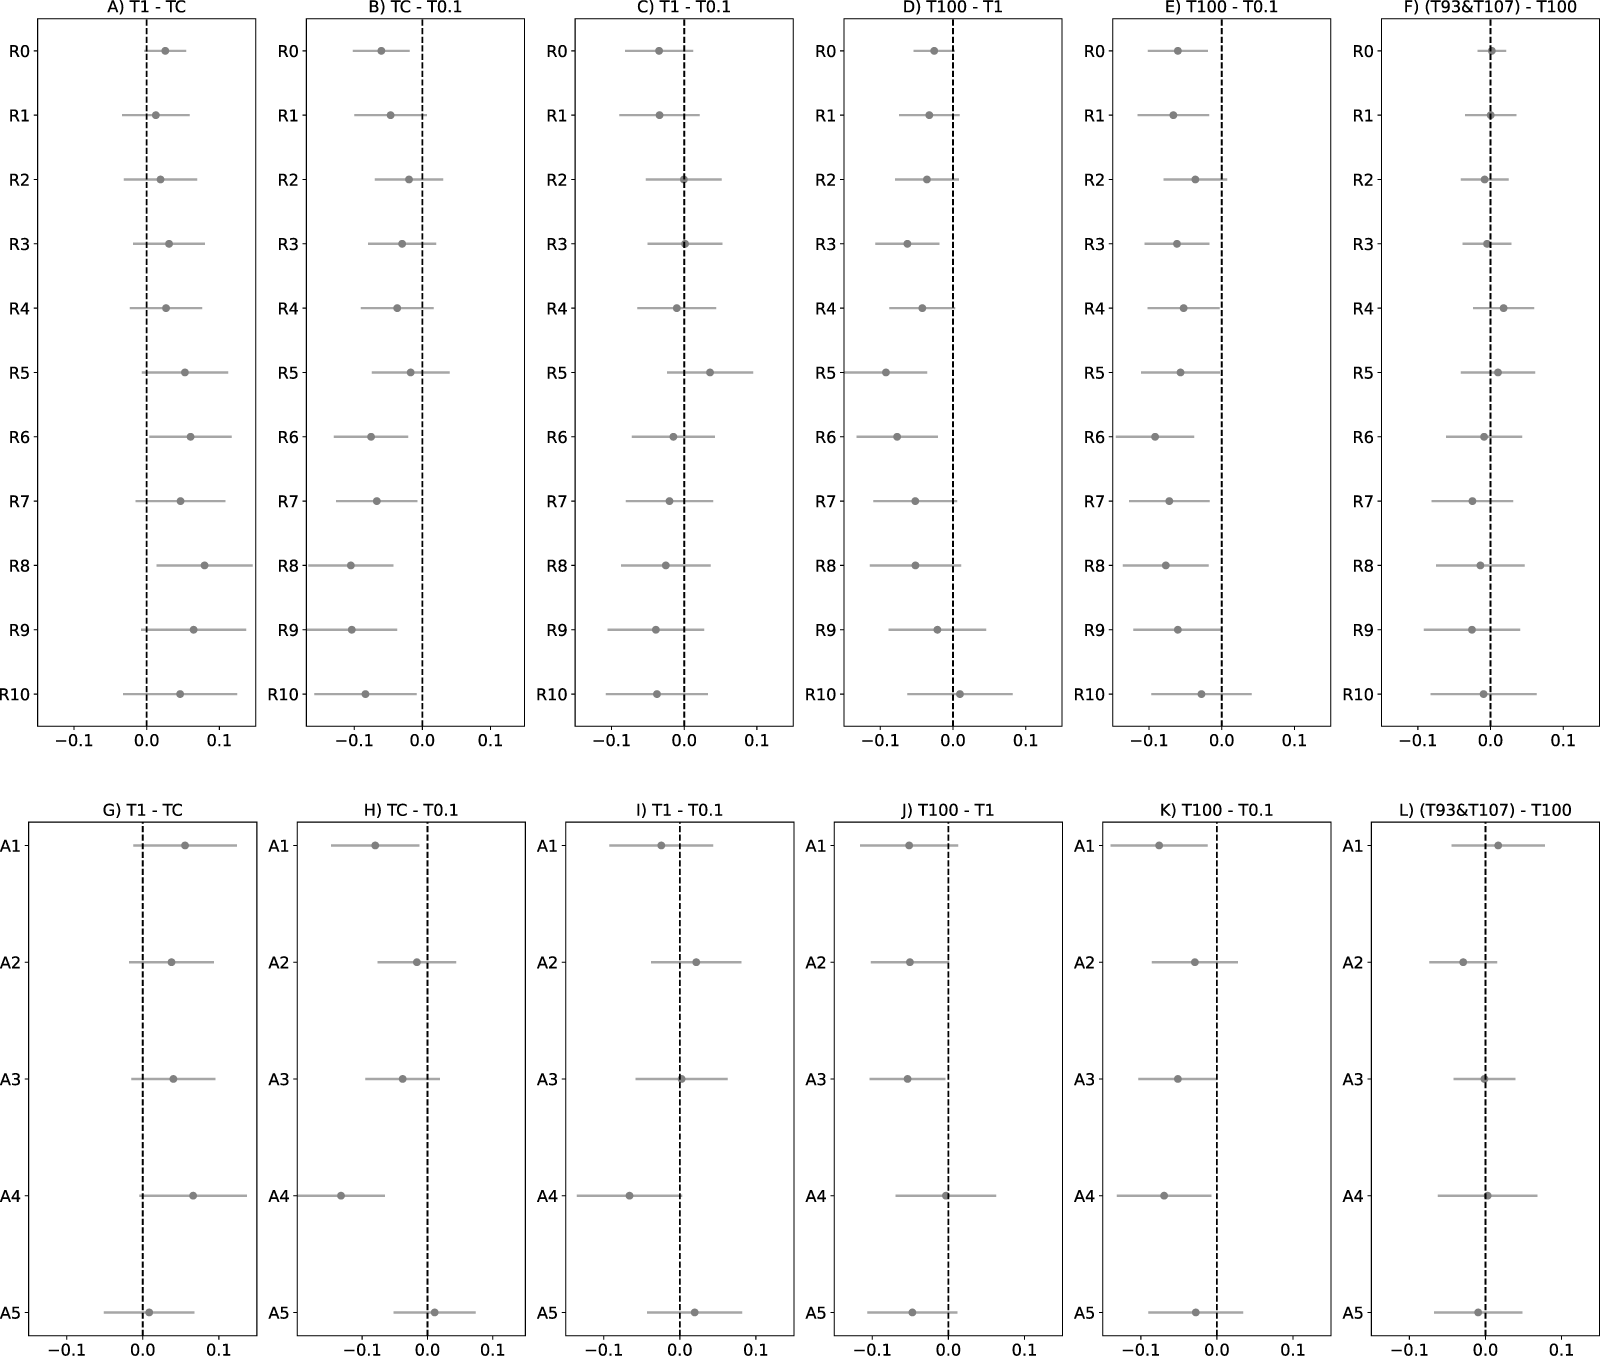
  $H_0$, and assume an effect of the treatment. Figure 4 presents the difference in average WTP (and 95% CI) across conditions and lotteries.
According to Hypothesis 1, we expect higher WTP in treatment T1 than in treatment TC, as virtual currencies should reduce subjects’ risk aversion. Consistently with our hypothesis, in panel A (risky lotteries) and panel G (ambiguous lotteries) of Figure 4, the average WTP is always higher in T1 than in C. The sign test indicates a significant virtual currency effect on the average WTP of participants with a probability of obtaining 16 positive values from a Binomial $(16,0.5)$ which is $ \lt 0.001$.Footnote 17
Hypothesis 2 and 2-b address the money illusion effect. According to Hp2, we expected the WTP for online transactions involving risk or uncertainty to be lower in T100 compared to T1. Consistently with our hypothesis, in panel D (risky lotteries) and panel J (ambiguous lotteries) of Figure 4, the average WTP is always lower in T100 than in T1. The sign test indicates a significant money illusion effect on the average WTP of participants, with a probability of obtaining 0 positive values from a Binomial $(0,16,0.5)$ which is $ \lt 0.001$. To further support this claim, we conduct the same analysis comparing T93 and T107 with T1, replicating the results (see Appendix A.6).
According to Hp2-b, we expected the WTP to be higher in T0.1 compared to T1. Indeed, we observe in Figure 3 that the WTP in T0.1 is the highest for most lotteries. However, comparing T1 and T0.1, Panels C and I in Figure 4 show ten negative values, three positive values (R5, A2, A5) and three values close to 0 (R2, R3, A3). Hence, the effect is not significant (Probability of a Binom(10,16,0.5): p-value=0.1222). On the other hand, we find a significant effect of T0.1 compared to TC (Binom(1,16,0.5): p-value $ \lt 0.001$) and a significant effect of T0.1 compared to T100 (Binom(0,16,0.5): p-value $ \lt 0.001$). While qualitatively it is apparent that WTP in T0.1 is the highest, the lack of significance compared to T1 could be driven by the fact that the two exchange rates are too close to one another.
Finally, we examine Hypothesis 3, which tests the effect of non-intuitive exchange rates on participants’ WTP. We merge data from T93 and T107 and compare them against T100. As shown in Figure 4, the average WTP difference is approximately 0 in each lottery. Moreover, Table A.6 shows 10 negative, 5 positive (R0, R4, R5, A1, A4) and 1 null effect size(R1). The probability of obtaining 5 positive values from a Binomial $(16,0.5)$ is equal to 0.067. Therefore, the null hypothesis of the sign test is not rejected, and our results do not provide support to the hypothesis that non-intuitive exchange rates might impact the WTP. In the Appendix, Section A.6, we provide evidence showing that the WTP in T93 is smaller with respect to WTP in T100 and T107, which is not explainable by money illusion alone. We further discuss this result in Section 5.3.
Following the work of Anvari et al. (Reference Anvari, Verdeş and Marchiori2022), we repeat these analysis with Cohen’s d effect sizes estimates (Table A.6) , obtaining no significant differences with the analysis presented above. Our results remain robust after adjusting for multiple comparisons. Specifically, considering six pairwise comparisons (as illustrated in Figure 4), we apply a Bonferroni correction, yielding an adjusted significance threshold of  $\hat{\alpha} = \frac{0.05}{6} \approx 0.0083$. The null hypothesis is consistently rejected for the comparisons (T1–C), (TC–T0.1), (T100–T1), and (T100–T0.1), with all corresponding p-values $ \lt 0.001,$ below the adjusted threshold $\hat{\alpha}$.
Average difference between WTP across conditions and lotteries and 95% confidence intervals

4.2. Regression analysis
To further examine the hypotheses, we conduct an econometric analysis using a linear random effect model with lottery-specific effects. The model, represented by Equation 2, is defined for individuals  $i\in(1,..., N)$, treatments $m\in(0,...,4)$ and lotteries $l\in(1,...,16)$.
 \begin{equation}
WTP_{il}= \beta_1 + \sum_{m=0}^{4} \Biggl( T_{i,m}\ \beta_m \Biggl) + \mathbf{X}'_{i} \boldsymbol{\beta} + L_l + \alpha_i + \epsilon_{il}
\end{equation}
\begin{equation}
WTP_{il}= \beta_1 + \sum_{m=0}^{4} \Biggl( T_{i,m}\ \beta_m \Biggl) + \mathbf{X}'_{i} \boldsymbol{\beta} + L_l + \alpha_i + \epsilon_{il}
\end{equation} In Equation 2  $WTP_{il}$ is the dependent variable and represents the Willingness to Pay for individual $i$ in lottery $l$;
$l$;  $\beta_1$ is a constant term; $T_{i,m}$ are dummy variables representing the $m$ treatments and $\beta_m$ are the associated marginal effects; $\mathbf{X}'_{i}$ is a (1xK) matrix containing the individual characteristics presented in Table 2 , with $\boldsymbol{\beta}$ being the characteristics’ marginal effects; $L_l$ are lottery fixed effects; $\alpha_i$ are the individual-specific random effects to control for individual-specific heterogeneity;
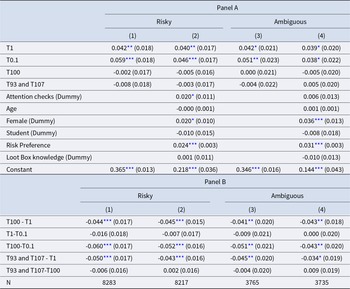
  $\epsilon_{il}$ is the idiosyncratic component. Econometric results of Equation 2 are reported in Table 3. The econometric analysis is conducted separately on risky lotteries, models (1) and (2), and ambiguous lotteries, models (3) and (4). In models (2) and (4), we introduce the covariates reported in Table 2. Namely, we consider the variables Age; Female, a dummy equal to 1 if the participant is female; Student, a dummy equal to 1 if the participant is currently a student; Risk preference, which takes value between 0 and 10; Loot box knowledge, a dummy equal to 1 if the participant reports knowing what a lootbox is; and Attention checks, a dummy equal to 1 if the participant succesfully completed both checks. Analyses in Table 3 Panel AFootnote 18 use condition TC as the baseline to examine the treatment effects.
Random effect estimates of the average WTP and Marginal estimates across treatments

Note. Significance levels are indicated as follows:  $*^p \lt 0.10$, $**^p \lt 0.05$, $***^p \lt 0.01$. Standard errors are clustered at the individual level and reported in parentheses. Estimates are computed in the long format; hence, there are 16 observations per participant, one for each lottery. Models (1) and (2) consider risky lotteries. Models (3) and (4) consider ambiguous lotteries. Models (1) and (3) are estimated without further controls. Models (2) and (4) are estimated with the reported controls.
In models (1) and (3), the coefficient for condition T1 is positive and significant indicating that using a virtual currency instead of a real one increases participants’ WTP. This supports hypothesis 1 and the emergence of a virtual currency effect. The virtual currency effect is robust to the introduction of individual characteristics, with the coefficient slightly decreasing from 4.2% to 4.0% and 3.9%, respectively for risky and ambiguous lotteries. Further investigations are conducted in the Appendix. In Appendix A.7 we estimate the effect of our conditions conditioning by risk profile. We find that the effect of T1 is mainly driven by risk neutral (RN) and risk lover (RL) participants. Moreover the effect of T1 is robust to the exclusion of the variable Risk preference as shown in Table A.7.
To test hypothesis 2 and 2-b, we compare the post-estimation differences of T100 and T0.1 with T1 (see Table 3 Panel B). For all models (1 to 4) subjects in T100 have a WTP of around 4% lower than that observed in T1. On the other hand no significant differences are found between T1 and T0.1. The inclusion of covariates (models (2) and (4)) does not modify the magnitude nor the significance of the difference between conditions. In addition, we find that subjects in T93 and T107 have a WTP of around 4.5% lower than that observed in T1. Overall, these results support Hypothesis 2, indicating that the money illusion effect reduce participants’ WTP for risky and ambiguous lotteries, both with intuitive and non-intuitive exchange rates. On the other hand, hypothesis 2-b has not been verified. Nonetheless, subjects in T0.1 have a WTP of around 5% higher than that observed in TC.
Lastly, the role of non-intuitive exchange rates is examined by comparing the average WTP of conditions T100, T93 and T107. Models (1) and (3) in Table 3 Panel B indicate non significant and very small (less than 1%) estimates, suggesting an overall null effect of non-intuitive exchange rates. Similar considerations can be drawn comparing coefficients T93, T100-T1 and T107-T1 in Table 3 Panel B, where T93, T100 and T107 induce similar changes in WTP compared to T1.
We conclude from an heterogeneity analysis that none of the individual characteristics per se have a significant effect, with exception for the variables Risk Preference, according to which subjects with higher risk propensity have a higher WTP (2.4% and 3.1% more in risky and ambiguous lotteries) and the variable Female for ambiguous lotteries.
Additional analyses are reported in Appendix A.6. First, we find no significant difference between T100 and TC, and between T93 and T107 and TC. However, we observe that individual differences between lotteries are frequently negative for lotteries with a small probability of winning, i.e. lotteries from R1 to R7 and lotteries A2, A3 and A5. This pattern may suggest an effect of loss aversion when the nominal value of a currency is higher than the real value. Then, we find small differences between T93 and T100 and between T93 and T107. We discuss these results in Section 5.3.
5. Discussion and conclusions
Loot box transactions are very common in free-to-play games and mobile apps. Recently, however, the practices used for these transactions have received attention from scholars and legislators for their potential negative impact on consumers. We examine three practices common to most loot box transactions that could potentially distort the economic behaviour of the average consumer, and thus be considered unfair practices. An online randomized controlled trial is conducted to examine the influence of virtual currencies, money illusion, and non-intuitive exchange rates on consumers’ spending behaviour. Participants’ WTP is measured across a series of risky and ambiguous lotteries (representing different loot boxes), and in four between-subjects conditions useful to examine each effect separately.
5.1. The Virtual Currency effect
In our experimental setting, participants’ WTP is impacted and artificially increased by the use of virtual currencies, both in risky and ambiguous lotteries. Our result contributes to the literature discussing the neutrality of virtual currencies, showing that the spending behaviour of the average consumer can be affected by the currency itself, as exchange rates between conditions are fixed by design. This supports the regulation of virtual currencies as proposed by the European Commission on March 21st, 2025, even though we hesitate to conclude that using virtual currencies for transactions represents an unfair marketing practice. According to the European Parliament and The Council of the European Union (2015), an unfair practice must also be “contrary to the requirements of professional diligence”, an assessment which is beyond the scope of this analysis. The reasons behind the virtual currency effect are yet to be explored. In accordance with Cerulli-harms et al. (Reference Cerulli-harms, Marlene, Christian, Frithjof and Pierre2020), the average WTP could increase as a consequence of smaller levels of “pain of paying”, which is defined as the immediate sense of displeasure associated with paying the price of a transaction (Prelec and Loewenstein, Reference Prelec and Loewenstein1998; Mazar et al., Reference Mazar, Plassmann, Robitaille and Linder2016). Recently, it has been shown that credit cards can mitigate the “pain of paying” effect, increasing consumers’ expenditure (Park et al., Reference Park, Lee and Thomas2021; Huang et al., Reference Huang, Lim and Lin2021). A similar effect may influence participants in our study. Lesser known and intangible currencies can deceive the opportunity cost of a transaction, decreasing participants’ pain of paying and increasing the overall spending. Future research on the matter should examine the exact causes of this phenomenon and in particular its relationship with the pain of paying mechanism. Furthermore, considering the widespread adoption of virtual currencies in both economic and psychological experiments, future research should explore the relevance of the effect in different tasks, such as investments.
5.2. The Money Illusion effect
According to our results, when the nominal price of a transaction exceeds the corresponding price in real world currencies (RWC), consumers decrease their WTP as a consequence of higher levels of risk aversion. This result contributes to the literature on money illusion and face value effect by showing their validity for transactions involving virtual currencies. Moreover, while previous studies in the context of consumer behaviour compared situations with different exchange rates and different currencies, our experiment varies the exchange rate maintaining the currency fixed. This reveals that the face-value effect can be the result of only the difference in exchange rates. Furthermore, our experiment shows evidence of money illusion effect between two intuitive exchange rates, namely conditions T1 and T100. This evidence suggests that the money illusion effect can be independent of computational skills. The results holds when comparing T1 with treatments where the exchange rate was computationally more complex to manage (T93 and T107).
In addition, we examine the scenario in which the nominal price of a transaction is lower than the corresponding price in RWC. As expected, the WTP in T0.1 is the highest of all treatments for most levels of risk. However, when comparing conditions T1 and T0.1, the observed effect is not significant. The WTP in T0.1 is instead significantly higher than the one observed in T100. This results partially confirm money illusion predictions (Raghubir & Srivastava, Reference Raghubir and Srivastava2002) according to which participants should have exhibited higher WTP in T0.1 compared to T1 and T100. One possible explanation is that the exchange rate between T0.1 and T1 is too close to produce a significant effect. The analysis of T0.1 provides also valuable insights for the literature on cryptocurrency transactions. While in the vast majority of the games, exchange rates are such that the nominal value is above the real value, for transactions with cryptocurrencies it is common to observe the opposite scenario, similar to T0.1. In this case, the natural comparison is a transaction in RWC, and comparing T0.1 with TC we find higher WTP in T0.1. Hence, this is a first result showing that agents’ spending behaviour could be artificially increased by crypto-currencies.
An open question is whether the money illusion bias linearly increase with the distance between real and nominal values. Future research should investigate this issue to improve understanding of how and when distortions arise. Moreover, future research should focus on crypto-currency transactions, and see whether distortions take place in real world settings, and for transaction which do not involve risk.
5.3. Discussion on non-intuitive exchange rates
Our last analysis examines whether non-intuitive exchange rates influence risk attitudes and consumers’ WTP. Our results suggest that this might not be the case. In our setting, the average WTP does not significantly differ between conditions T93, T100 and T107, nor between TC and T93 and T107. A possible interpretation is that participants use effective conversion strategies. However, accurate conversion strategies can be ruled out based on the findings presented in Section A.2, which indicate that participants were unable to convert the amounts they acquired during the task precisely. A further possible explanation is that the similarities in exchange rates between conditions T93 and T107 with that of condition T100 are too small to be detected by our experimental design. However, as shown in the Appendix, Section A.6, some differences are detected between T93 and T100, and between T93 and T107, ruling out this hypothesis. Interestingly, Figure A.3 in the Appendix shows that these results are driven by lotteries with low probability of winning, which consistently shows smaller WTP in T93 wrt to T100 and T107. It is as if participants exercised more caution when playing with T93, which is however, not coherent with money illusion theories.
Future research should examine more in detail the interplay of non-intuitive exchange rates and money illusion bias and how it could affect consumers’ WTP. For example, an open question is how the WTP is affected by an exchange rate which is non-intuitive and affected by money illusion, for example 133:1. This topic is particularly relevant as the majority of transactions in video games and mobile apps involve non-intuitive exchange rates with nominal values far greater than the corresponding real value. However, our experimental design is not suited to pursue this issue. For example, comparing T133 and T100 it would not be possible to distinguish additional money illusion effects from the effects of non-intuitive exchange rates. Such limitations could be addressed by future research on the topic.
5.4. Final remarks
In this study, we examined the role of virtual currencies, money illusion and non-intuitive exchange rates on consumers’ spending behaviour for online transactions involving risk and ambiguity. One of our goals was to contribute to the recent literature exploring whether the use of virtual currencies could be considered an unfair practice. Our results support the new regulation of virtual currencies as proposed by the European Commission on March 21st, 2025. Indeed, virtual currencies have the potential to decrease the transparency of transactions and induce consumers to allocate resources in undesired ways.
Future research could explore the causes of these effects, assisting the development of policy interventions aimed at improving consumer protection in digital marketplaces.
Supplementary material
The supplementary material for this article can be found at https://doi.org/10.1017/eec.2026.10049.


 Open access