


(O)ne would need to be endowed with perfect foresight to have been able to predict how the financial crisis would unfold, spilling over from one institution to another, and from one market to another. …The moral from this is one should not expect to be able to predict the timing and scale of these sorts of events with any precision.
Charlie Bean, Deputy Governor for Monetary Policy at the Bank of England, speech to the Royal Statistical Society User Forum, London, 27 October 2010.
There was no need for perfect foresight to predict the Great Recession of 2008; following the data was enough. Turning points, admittedly, are hard to spot, both downturns and upturns although the former matter more. Being overly optimistic at a turn down is likely worse than being too pessimistic about an uptick, especially if institutions and investors limit their exposures in the face of a predicted downturn that does not come. Inevitably estimation involves extrapolation of existing trends, hence at down turns estimates tend to be too high and at upticks, they tend to be too low. Real time data are also problematic: quarterly GDP estimates are constantly revised by statistical authorities as new data arrive, so early releases tend to have a high proportion of estimate and little data. As time goes on more data arrive and the estimated proportion declines. As we shall see below there are also issues with revisions to labour market data.
The simplest way to identify the start of a recession outside the United States is to see when there are two successive negative quarterly growth estimates for GDP. The problem in spotting the timing of the Great Recession was that initial estimates of GDP change at the turning point were heavily revised. We only know definitively when the start of the Great Recession began a decade or so later. As data come in over time the estimates at the turning points tend to be revised a lot, but it takes a while.Footnote 1 Consequently policymakers have little sound information in real time to make judgements about the past, the present and the future. The Monetary Policy Committee (MPC) in its August 2008 Inflation Report (IR) wrongly forecast no recession but also in its backcast assumed the past and the present would be revised upwards, which they were not. Chart 1 presents the MPC’s forecast and backcast, from August 2008, 5 months after recession in the UK started and many months after it started in the USA. The forecast band widens to the right as the further out the forecast the greater the errors. It shows that the central forecast is no recession in the future, as the green swathe does not go below zero.
(Colour online) GDP projection based on market interest rate expectations

The green band to the left narrows due to revisions over time becoming more accurate and the black line is the latest data from the Office for National Statistics (ONS). The fact that the green band is above the ONS line implies the MPC expects data from the past, and the present, to be revised up. It wasnot and as we show below there was a recession that lasted five quarters from Q22008 to Q22009. The forecast was conditioned on market interest rates which at the time suggested they would remain above 5 per cent for the duration of the forecast, which turned out to be too high, given that rates were cut to 0.5 by March 2009. Getting GDP revisions wrong really matters.
A major issue is what data is available to call the start of recession, and when? It turns out that qualitative data are available first, usually in the month it refers to, which as we will see is a major advantage because of its timeliness.Footnote 2 Then labour market data is released, but the data takes time to collect and is also subject to revision.Footnote 3 For example, the estimate of non-farm payrolls (NFP) is revised for two subsequent months. In some countries, labour market data are available much earlier than others.Footnote 4 The UK is the slowest to produce national statistics although it does publish monthly estimates that it does not use as a national statistic because of their variability.Footnote 5 Early estimates of quarterly GDP growth are usually available shortly after the quarter ends, but these data are open to revision.
Now a decade after the revisions we find that the qualitative data give an accurate early indicator of recession. In the US, the labour market data turned down before the downturn in the revised GDP data. In contrast in almost all the other OECD countries declining GDP preceded labour market declines. This is what also happened during the COVID-19 pandemic when the US unemployment rate jumped from 3.5 per cent in February to 19.8 per cent in April, whereas other countries saw much lower and smaller rises in unemployment.Footnote 6
This article is a companion to Blanchflower and Bryson (Reference Blanchflower and Bryson2021a) where we used panel data for 29 European countries over 439 months between 1985 and 2021 in an unbalanced country*month panel of just over 10,000 observations, to predict changes in the unemployment rate 12 months in advance. This was based on individuals’ fears of unemployment, their perceptions of the economic situation and their own household financial situation. We found fear of unemployment predicts subsequent changes in unemployment 12 months later in the presence of country fixed effects and lagged unemployment. Individuals’ perceptions of the economic situation in the country and their own household finances also predict unemployment 12 months later. Business sentiment we also found to be predictive of unemployment 12 months later. It also is a companion to Blanchflower and Bryson (Reference Blanchflower and Bryson2021b) where we use data from both The Conference Board and the University of Michigan to predict recessions. The data suggests the possibility that the US is headed into recession in 2022.
In this article, we focus in more detail on the Great Recession of 2007–2009. We examine the value of qualitative data and establish our own rule for predicting recessions. We compare it to the Sahm Rule that has been proposed as a way of identifying recessions in the United States by looking at movements in the unemployment rate. It has not previously been applied elsewhere. The labour market started loosening in the US before GDP started to fall. The complication in the USA is that there were not two successive quarters of negative growth until Q32008:Q12008 was negative, but Q42007 and Q22008 were positive.
We examined quarterly GDP growth rates in 2007 and 2008 in 39 OECD countries (table 1). This is after more than a decade of revisions. Using the two successive quarters of negative growth to signal recession, seven countries did not conform to the rule—Australia, Bulgaria, Iceland, Korea, Malta, Norway, Poland and Slovakia. Norway, it should be noted, had three of five negative quarters from Q12008 while Iceland had negative growth in Q32007 (−2.2 per cent); Q12008 (−2.9 per cent); Q32008 (−5.6 per cent) and Q12009 (−10.1 per cent) but positive growth in Q42007 (+4.6 per cent); Q22008 (+3.6 per cent) and Q42008 (+6 per cent).
Quarterly GDP growth, Q42007–Q12009

Note: Bold means there are not two negative quarters.
Source: OECD and Eurostat.
However, 31 countries did fully conform to the rule, and in all but one of these cases recession started in 2008. One saw growth starting in Q42007 (Estonia); and five in Q12008 (Finland, Ireland, Luxembourg, New Zealand and Sweden). Nine countries saw two quarters of negative growth starting in Q22008 (Denmark, France, Germany, Greece, Italy, Japan, Latvia Portugal and the UK) with 10 in Q32008 (Austria, Belgium, Chile, Hungary, Lithuania, Netherlands, Russia, Slovenia, Spain and the USA). Finally, six countries saw their economic activity head downwards in Q42008 (Canada, Czechia, Israel, Mexico, Romania and Switzerland).
We have unemployment rates for all of these OECD countries and in the majority the Sahm Rule, which compares a 3-month moving average of the present with the lowest value of the moving average over the preceding year, suggests recession started after the date indicated by two-quarter declining GDP. In 16 countries, the Sahm Rule suggests recession started in 2009 whereas in no case was that true using the two successive quarters rule. But that is an ex-post judgement. The Sahm Rule is likely to indicate a downturn, even before the GDP data does, given the long revision cycles at turning points as we show below in the case of the US and especially the UK.
We then examined qualitative data for 29 European countries, which seems to give a much better and more-timely indicator of turning points in 2008 than either the unemployment rate or GDP. We also focus on the UK where there were a number of qualitative series in the Spring of 2008 consistently suggested recession had started at that point. The official GDP estimates did not show that until June 2009.
The remainder of this article is structured as follows. The next section describes traditional means of identifying business cycle turning points in the United States and elsewhere. Section 2 shows the value of the Sahm Rule in predicting the Great Recession across the United States and at state-level. Section 3 extends this analysis to previous US downturns. In Section 4, we turn to the UK and show that the Sahm Rule does not perform so well. Instead, we show that qualitative metrics of economic activity available at the time were ‘flashing red’ and were good at predicting the onset of recession. Section 5 presents similar evidence for the rest of the OECD. Section 6 offers another rule for predicting recession based on percentage point shifts in the fear of unemployment. Section 7 concludes.
1. Dating US business cycles
We first need to look at, traditionally, how peaks of business cycles are identified. In the US, there is an official committee to retrospectively date recessions: the NBER Business Cycle Dating Committee (BCDC), who do so well after the event. Over the last six recessions they took at least 6 months to make the call. This has the advantage that relevant data has become available as it is published with lags and some revisions have occurred.Footnote 7 As Stock and Watson (Reference Stock and Watson2010) note ‘the problem of dating turning points differs from the forecasting problem because turning points are estimated retrospectively’. And later ‘We consider the problem of dating a reference cycle turning point, once it has been established that a turning point has occurred’. This is of little use to policymakers who want to call turning points as they happen, not many months after they have passed.
There is a large literature using financial variables such as the inversion of the yield curve to predict recessions, see, for example, Bauer and Mertens (Reference Bauer and Mertens2018), Cooper et al. (Reference Cooper, Fuhrer and Olivei2020) and Henry and Phillips (Reference Henry and Phillips2020). Aastveit et al. (Reference Aastveit, Anundsen and Herstad2018) examined the role of residential investment. Kelley (Reference Kelley2019) showed the importance of using Leading Indicator. He constructed a Composite Leading Indicator Index which included data on employment, manufacturing activity, housing, consumer expectations, and the return on the stock market. He shows that a composite index of 17 of these measures outperforms the yield curve. We take a somewhat similar route focusing primarily on qualitative measures from businesses and especially from consumers as additional measures to the yield curve. We also find a role for labour market variables. In two companion papers, Blanchflower and Bryson (Reference Blanchflower and Bryson2021a,Reference Blanchflower and Brysonb), we examine US data from The Conference Board and the University of Michigan used by Kelley (Reference Kelley2019) to predict recessions.
On 1 December 2008, the BCDC determined that a peak in economic activity occurred in the US economy exactly a year earlier in December 2007.Footnote 8 The peak marked the end of the expansion that began in November 2001 and, the NBER argued, the beginning of a recession. The expansion lasted 73 months; the previous expansion of the 1990s lasted 120 months. They noted that ‘the currently available estimates of quarterly aggregate real domestic production do not speak clearly about the date of a peak in activity’.Footnote 9 They noted that NFP reached a peak in December 2007 and declined every month after that. The BCDC also noted that their preferred measure of real personal income less transfers peaked in December 2007 while industrial production peaked in January 2008. The unemployment rate for December 2007, was 5.0 per cent up from 4.7 per cent in November.
No other country has the equivalent, to our knowledge of the BCDC. Instead, more informal ways are used to identify turning points. The most widely used rule is that two successive quarters of GDP constitute a recession. That presents a couple of problems as the NBER noted. The first is that GDP growth, as noted above, is revised for a long time and sometimes by a lot especially at turning points. But second, the rule often does not give a clear-cut answer of when a recession started. In some cases, there are not two successive quarters but may be alternating negative quarters (e.g. Norway) or one very large negative quarter (Slovakia).
The United States presented a particular problem in 2007/2008. GDP growth in Q42007 was positive (0.6 per cent), Q12008 was negative (−0.4 per cent) while Q22008 was positive (0.6 per cent). It was then followed by three negative quarters. So according to the two successive quarters rule the US recession started in July 2008, at the start of the third quarter. In the US estimates are reported as annualised percentage growth rates so that is what we report here. Below we report the first to third and current final estimates of quarterly changes in GDP. As we can see below the first estimate for Q12008 was positive, but it eventually switched to negative. 2008Q3 and 2008Q4 became more negative over time and as the economy started to improve in Q1 and Q2 2009 the early estimates were revised up. Over time Q22008 has become more positive over time. The four quarters 2008Q3–2009Q2 were negative, suggesting the recession using GDP growth started in Q32008.

As noted in Blanchflower and Bryson (Reference Blanchflower and Bryson2021a,Reference Blanchflower and Brysonb) the problem in the UK was that the first estimate of GDP growth in Q22008 produced by the Office of National Statistics in July 2008 was of growth of +0.2 per cent. It took until June 2009 for that estimate to turn negative: it is currently −0.6 per cent. In October 2008, Q32008 was reported at −0.5 per cent (now −2.0 per cent) and in January 2009, Q42008 was reported at −1.5 per cent (now −2.3 per cent). So, from January through June 2009, it was wrongly thought the recession started in Q3 2008 whereas, in GDP terms it started in Q2.Footnote 10 At downturns initial releases tend to overestimate growth.
Table 2 shows changes in employment in the US from both the household and establishment surveys.Footnote 11 Employment in the household survey declined first in April 2007 (−734 k), was positive in May, June, September and November 2007 and January 2008 and then went negative from February 2008 and was negative in 22 of the next 24 months. Using a rule of two successive negative months of employment growth data gives the start of the US recession as July 2007 using household data. We find similarly below using state data.
Monthly changes in US employment in thousands

Note: For details of the surveys see the Employment Situation, published monthly by the BLS.
In contrast NFP first went negative in February 2008 and stayed negative for 22 of the next 23 months. The decline in employment over the period 2007–2009 was slightly larger on the household survey −7.96 million and on the establishment surveys 7.46 million which is to be expected given its broader scope. If we use NFP that suggests that February 2008 was the start of the recession in the United States.
2. The Great Recession, the Sahm Rule and the United States
2.1. The Sahm Rule
For the United States, Sahm (Reference Sahm2019) has invented the Sahm Rule, which identifies turning points in the unemployment rate, to identify the start of recession. It identifies signals related to the start of a recession when the 3-month moving average of the national unemployment rate (U3) rises by 0.50 percentage points or more relative to the 3-month moving average low during the previous 12 months.
Detailed data are available at FRED for the United States on the Sahm Rule. Data are available for both real time and for currently available data and they are very similar. The one instance where there is a little difference is in 2008 when the real time data suggested April 2008 as the starting point of the Great Recession while the revised data suggests February 2008. The series using the current data, available since March 1949 and is plotted with the unemployment rate in chart 2.Footnote 12
(Colour online) US unemployment rate and Sahm rule, 1971–2021

Data are also available on a broader measure of labour market slack that includes a measure of underemployment, the so-called U6 measure. That reached 0.50 in December 2007, the same month the BCDC called the recession.Footnote 13 It is plotted in chart 3. Feng and Sun (Reference Feng and Sun2021) suggest that the unemployment rate is subject to misclassification error due to difficulties in classifying some groups of people, like marginally attached worker and involuntary part-time workers who are included in the U6 variable. They also find that their corrected recession indicator identifies recession start dates a few months earlier than the original Sahm recession dates. Their indicator is rather complicated to calculate.
(Colour online) U6 measure of US labour market utilisation and the Sahm Rule

We also examined the unemployment rate by state and the Sahm Rule suggested that the first state to turn to recession was Florida as it did in the 1930s (Knowlton, Reference Knowlton2021).Footnote 14 There were 10 states that began the recession, as measured by the Sahm Rule, in 2007. Alaska and North Dakota were the last to enter recession in December 2008.
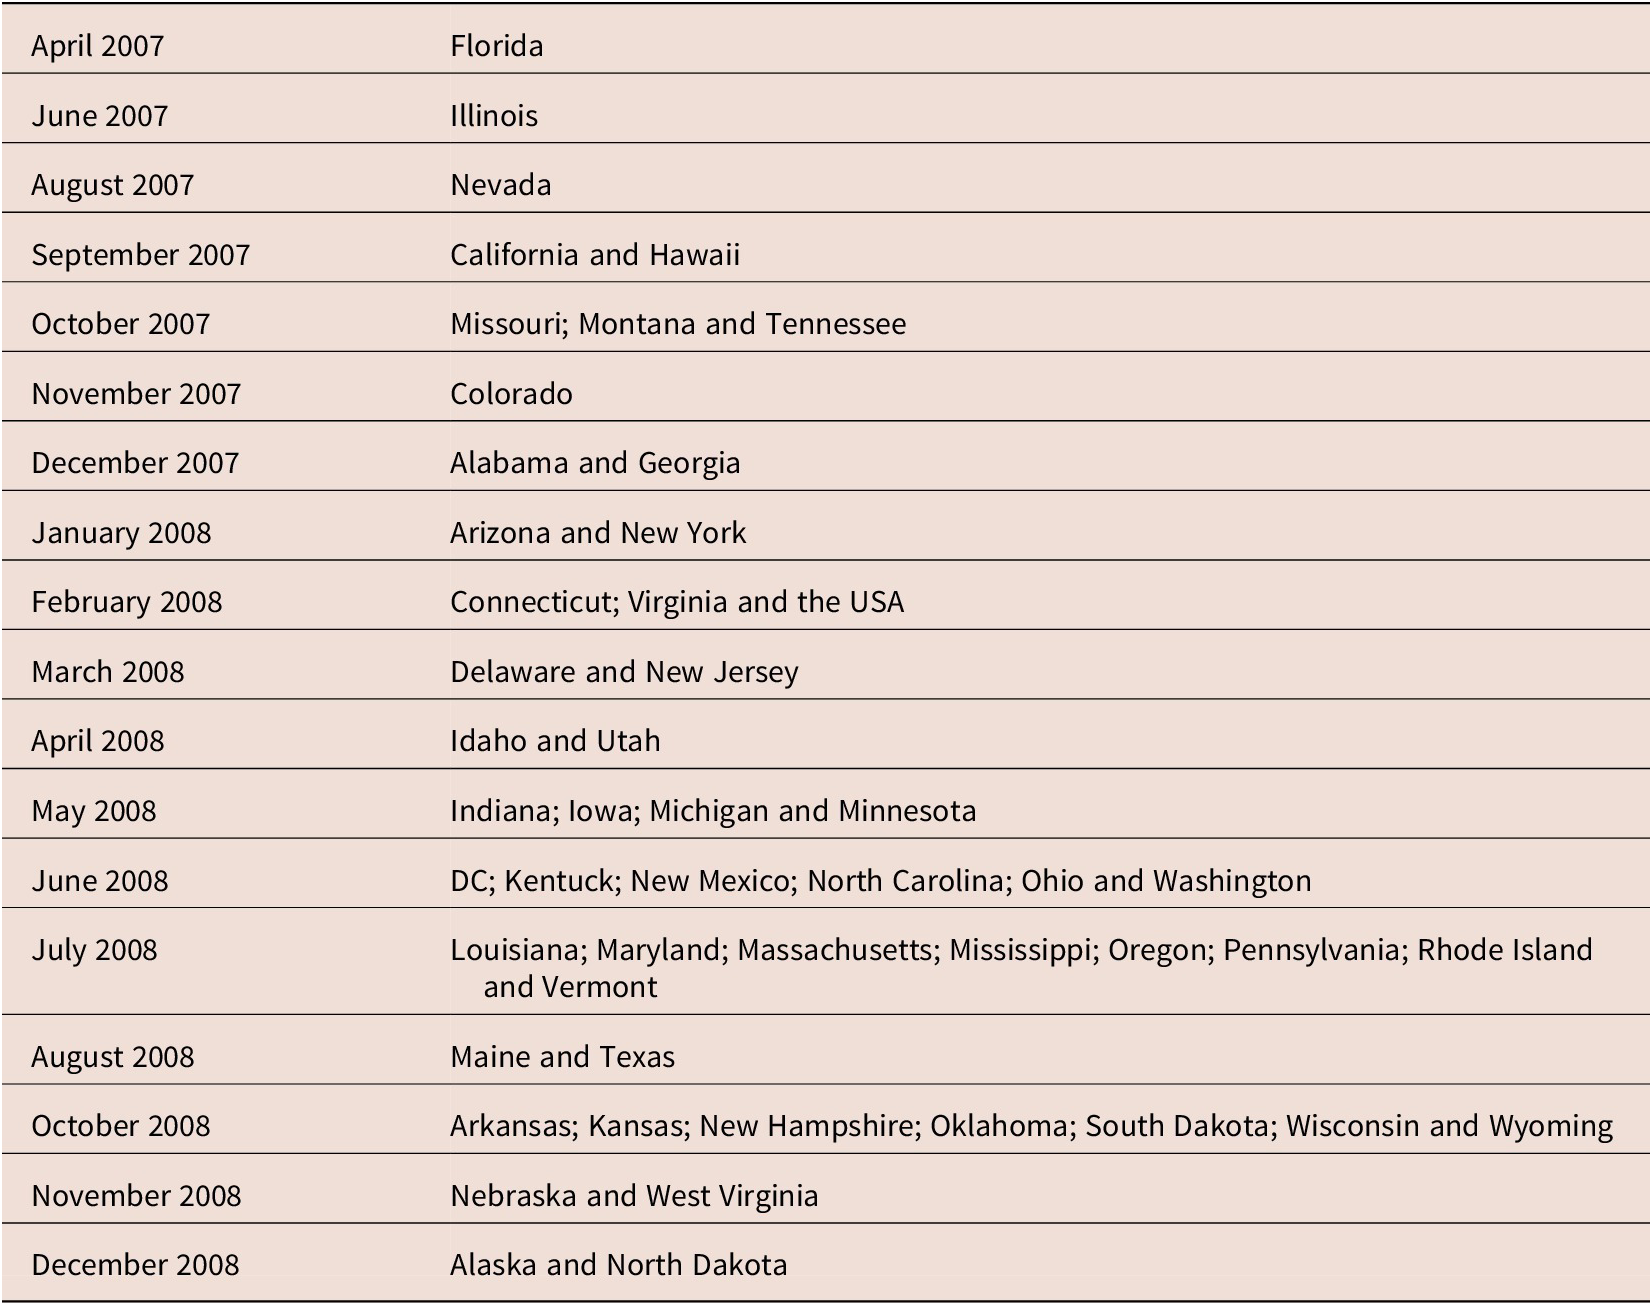
All 50 states plus DC saw their estimated Sahm Rule values hit 0.5 between April 2007 and December 2008.
2.2. Employment declines by US state
We then examined employment growth by month by state as reported by the BLS and most states. We identified when there were two successive months of negative employment growth. Here we focus on employment levels. The data source is the Current Population Survey which includes the most marginal workers includes self-employed workers whose businesses are unincorporated, unpaid family workers, agricultural workers and private household workers, who are excluded by the establishment survey.
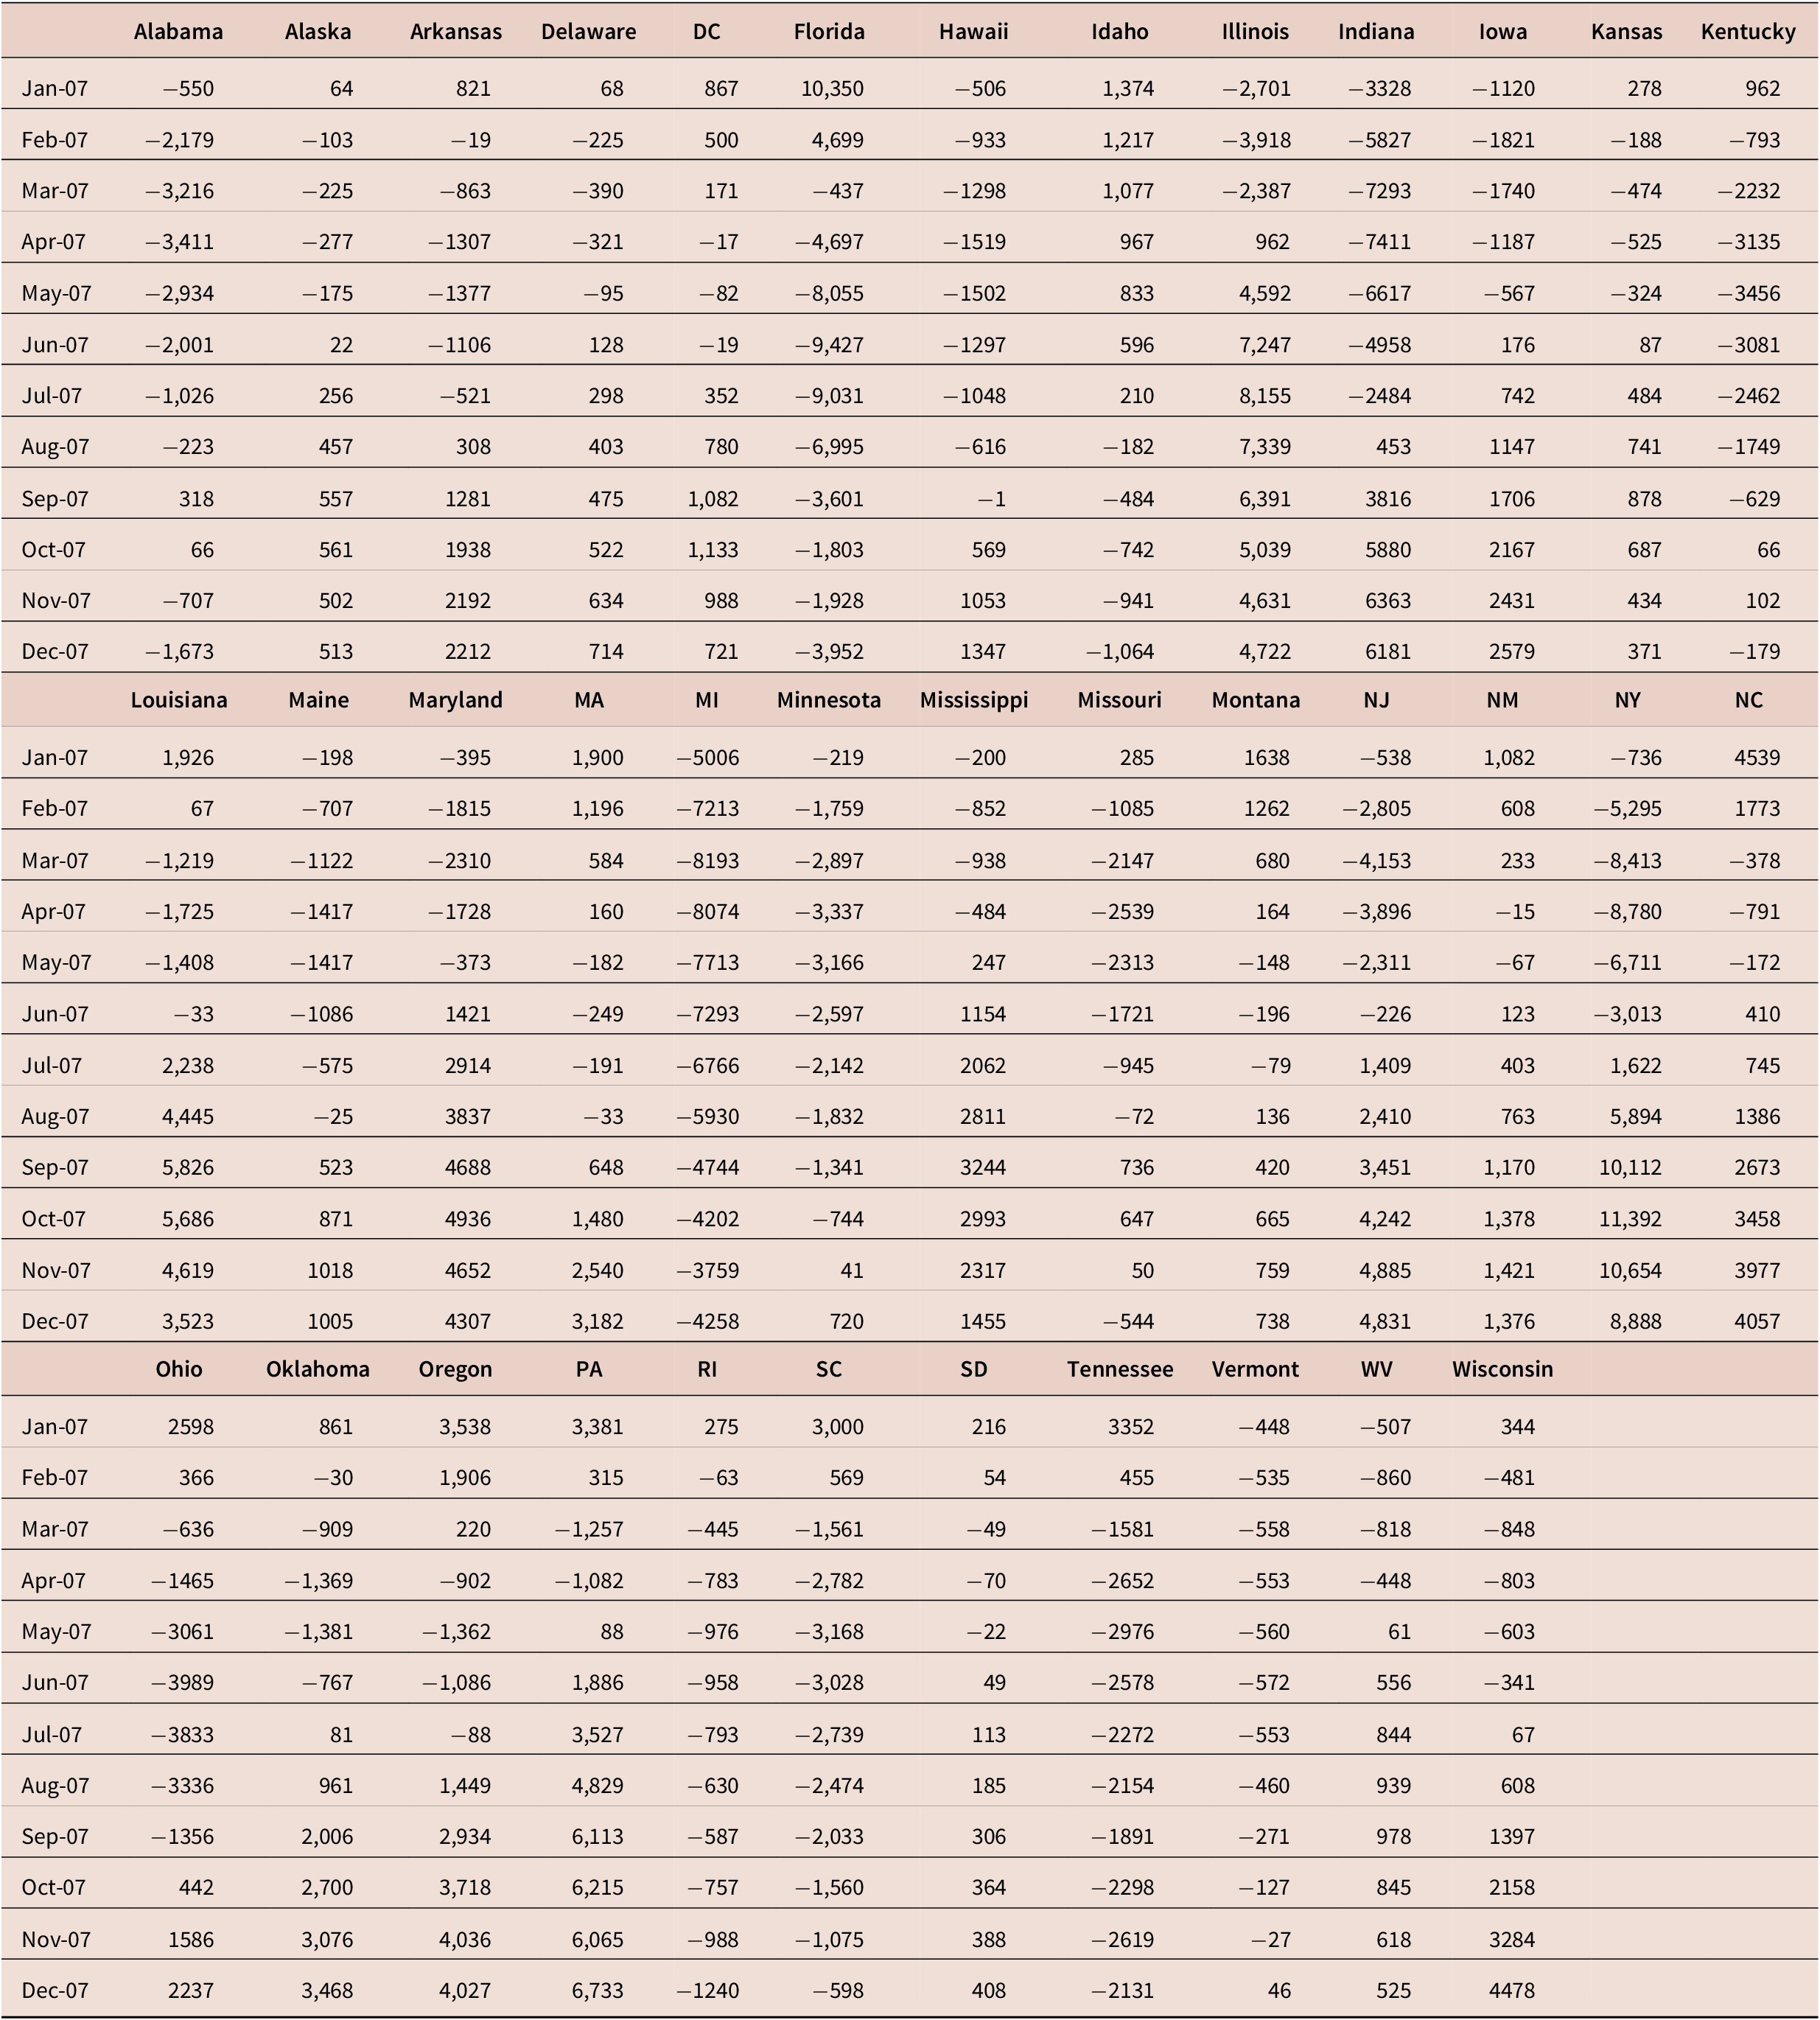
In the majority of states this occurred in 2007. Looking back at the US numbers for 2007 from table 2, there were 5 months with negative growth (April, −734; July −158; August, −223; October −298 and December −332) including two successive ones (July and August). This is reflected by state also and it complicates determining starting points. The 12-monthly observations for these 33 states with more than one successive negative monthly observation in 2007 are reported in table A.2.
Below we report the starting month, which is the first of two negative months of employment growth for 21 states that had one continuous spell of unemployment ranging from 12 months (Texas) to 52 months duration (Michigan). The details of the start and end dates of the spell and duration in continuous months is reported below.Footnote 15
The earliest start, and the longest spell, was for Michigan in September 2005 lasting 52 months through December 2009. Vermont started in November 2006 with five others in 2007 and with the rest in 2008. Spells mostly lasted through the end of 2009 but in two cases they did not end until 2010 (Colorado and Nevada) while two other starts did not complete their spell until 2011 (Arizona and Utah).
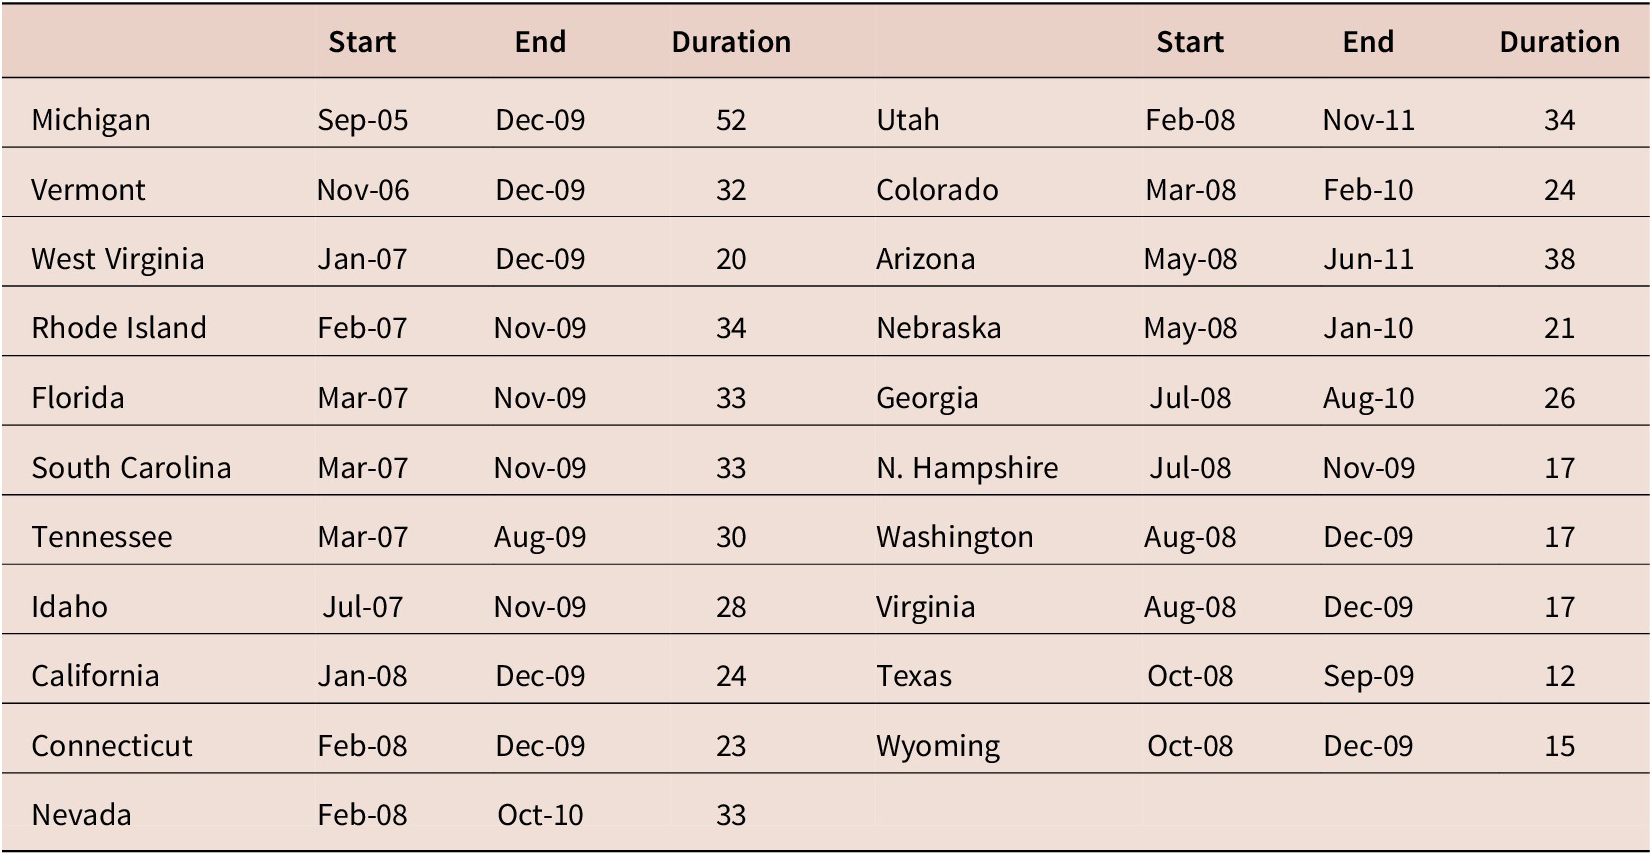
The remaining 30 states and DC had two broken spells, meaning two consecutive falls in employment level month on month followed by a subsequent spell of two consecutive falls but interrupted by months of growth. With the exception of Indiana, which started in December 2006, first spells all started between January and May 2007.
In Alabama, Kentucky and Missouri the second spell started in December 2007 but in all the other states it started in 2008. The finish date was also in 2008 except for Kansas and Missouri (January 2010), Oklahoma (October 2010) and Alabama (July 2011). Texas and Wyoming started last, in October 2008. The data are reported below.

As an example of the prevalence of negative growth months, in May 2007, 33 states experienced negative growth in that month. This includes seven states with one ongoing spell and 26 in their first spell of two had negative growth in May. The exceptions are Arizona*, California*, Colorado*, Connecticut*, Georgia*, Idaho*, Illinois, Mississippi, Nebraska*, Nevada, NH*, Pennsylvania, Texas*, Utah, Virginia*, Washington*, WV and Wyoming*, where * notifies a long single spell to start in 2008.
As was clear from table 2, the US had two successive negative months in July and August 2007 and then again in February 2008, with 5 months alternating positive to negative months and back. From February 2008, the US saw a spell of 22 negative months from Feb-08 through October 2009. From Nov-09 through Dec-10 there were another 7/14 months with negative growth.
By July 2007, all but 14 states in 2007 had also experienced at least two successive months of negative employment growth. That is also the date we get if we used two consecutive months of employment falls for the US as a whole.Footnote 16
2.3. Policymakers missed the Great Recession
Despite many measures available with only a lag of a few weeks, suggesting the US labour market had been in recession for many months even by the summer of 2008 policymakers still seemed unaware. The transcript of the minutes of the FOMC meeting of 5 August 2008, suggested that their next move of monetary policy was likely to be a tightening.Footnote 17
Most members did not see the current stance of policy as particularly accommodative, given that many households and businesses were facing elevated borrowing costs and reduced credit availability due to the effects of financial market strains as well as macroeconomic risks. Although members generally anticipated that the next policy move would likely be a tightening, the timing and extent of any change in policy stance would depend on evolving economic and financial developments and the implications for the outlook for economic growth and inflation.
Lehman Brothers went bankrupt in September 2008. At the October 2008 meeting the FOMC was forecasting in its Economic Projections that the central tendency of the unemployment rate would be 7.1–7.6 per cent in 2009 and 6.5–7.3 per cent in 2010.Footnote 18 This was up from their economic projections in June 2008 of 5.3–5.8 per cent in 2009 and 5.0–5.6 per cent in 2010. Monthly unemployment in the US averaged 9.3 per cent in 2009 and 9.6 per cent in 2010, peaking at 10.0 per cent in October 2009. This was a big miss.
3. Previous US downturns
The following six peaks have been identified by the Business Cycle Dating Committee (BCDC).Footnote 19 (a) January 1980 (5 months), (b) July 1981 (6 months), (c) July 1990 (9 months), (d) March 2001 (8 months), (e) December 2007 (12 months) and (f) February 2020 (4 months). The numbers in parentheses are how many months since the onset of recession it took the CBDC to call the recession.
However, if we were to simply use the two quarters of negative GDP growth rates that would show 11 recessions starting since Q21947. Table A.3 reports GDP quarterly growth rates for the USA. In the 297 quarters from Q11948 to Q22021 there have been 42 quarters of negative growth and 11 recessions measured by two successive negative quarters of GDP growth. Historically there are 13 occasions between 1949 and August 2021 that the Sahm rule reaches 0.5 and hence, according to Sahm (Reference Sahm2019) identifies the start of recession.
It turns out that the Sahm Rule approximates very closely the starting dates for recession that would be identified if we simply looked at the starting data for two successive months of negative growth in either NFP or Current Population Survey (CPS) employment. Table 3 illustrates monthly changes in NFP and CPS employment for the month identified as the start of the recession by the Sahm Rule (year t) plus 5 years earlier (t − 1 through t − 5) and 3 years later (t + 1 through t + 3). The data identified as the start point (shown in green in the table) by the change in NFP is very close to the Sahm Rule date and is as follows.

Sahm Rule hits 0.5 versus monthly changes in employment (’000 s)

Note: Bold identifies months of negative employment growth.
November 1959 using NFP does not have two quarters of negative growth but does have negative growth in t − 1 and t − 3.
CPS employment, start dates are as follows.

Two successive monthly negatives for CPS employment were not seen for November 1959 or July 1974.
Overall, in eight of the occasions the start based on NFP gives an earlier read than the Sahm Rule. On three occasions it was later and in the Great Recession they were the same. For the CPS five gave earlier starts, three were the same and one was a month later and two were 2 months later. If we just take the six NBER identified recessions since 1980 this is what we see.

If anything, the 2-month employment decline rules using the NFP, and CPS give a slightly earlier read of NBER recession start dates than does the Sahm Rule. All three, though, are broadly consistent and give an earlier read than the BCDC.
The qualitative data in the US in the Great Recession gave an even earlier indication of what was coming in the United States. This is consistent with claims made in Blanchflower (Reference Blanchflower2008) in April 2008, which examined how slowing started in the US housing market, first in prices which started falling at the end of 2006 and then spread to quantities such as permits to build, and housing starts, which slowed sharply in 2007. Consumer confidence data started falling around August 2007. Retail sales growth slowed from the spring of 2007 while real consumption and real disposable income slowed from around August 2007. As background chart 4 plots the Michigan Consumer Confidence Index and the US unemployment rate which track each other pretty closely. As Blanchflower (Reference Blanchflower2008) noted this started to decline from a peak of 96.9 in January 2007 to 75.5 in December 2007. By April 2008 it was clear the US was in recession. This led to the following conclusion.Footnote 20
For some time now I have been gloomy about prospects in the United States, which now seems clearly to be in recession…. By approximately December 2007 the housing market problems have now spilled over into real activity. The US seems to have moved into recession around the start of 2008.
(Colour online) US Michigan consumer confidence index and unemployment rate, 1978–2021

The same process then followed in the UK a few months later, based on the equivalent data. Recession in the UK started in the housing market at the end of 2007 and, as in the US, spread far and wide. This led to the conclusion.
More bad news is on the way. I think it is very plausible that falling house prices will lead to a sharp drop in consumer spending growth. Developments in the UK are starting to look eerily similar to those in the US six months or so ago. There has been no decoupling of the two economies: contagion is in the air. The US sneezed and the UK is rapidly catching its cold (Blanchflower, Reference Blanchflower2008).
As we show below that is exactly what happened across the OECD.
4. The United Kingdom in the Great Recession
4.1. The Sahm Rule
The Sahm Rule does not do such a good job in the UK. As noted in table 1 above using the two negative quarters of GDP growth rule the recession started in the UK in April 2008. Table 4 presents the latest revised data for the UK by month for employment and its monthly change in the first two columns and the unemployment rate and the Sahm Rule estimates in columns 3 and 4, respectively. Employment growth goes negative in May 2008 and continues to be negative for 11 of the next 13 months. The unemployment rate jumped from 5.2 to 5.4 per cent in May 2008—reported as April–June 2008 by the ONS.
Monthly UK, Employment levels and changes ’000 s and the unemployment rate
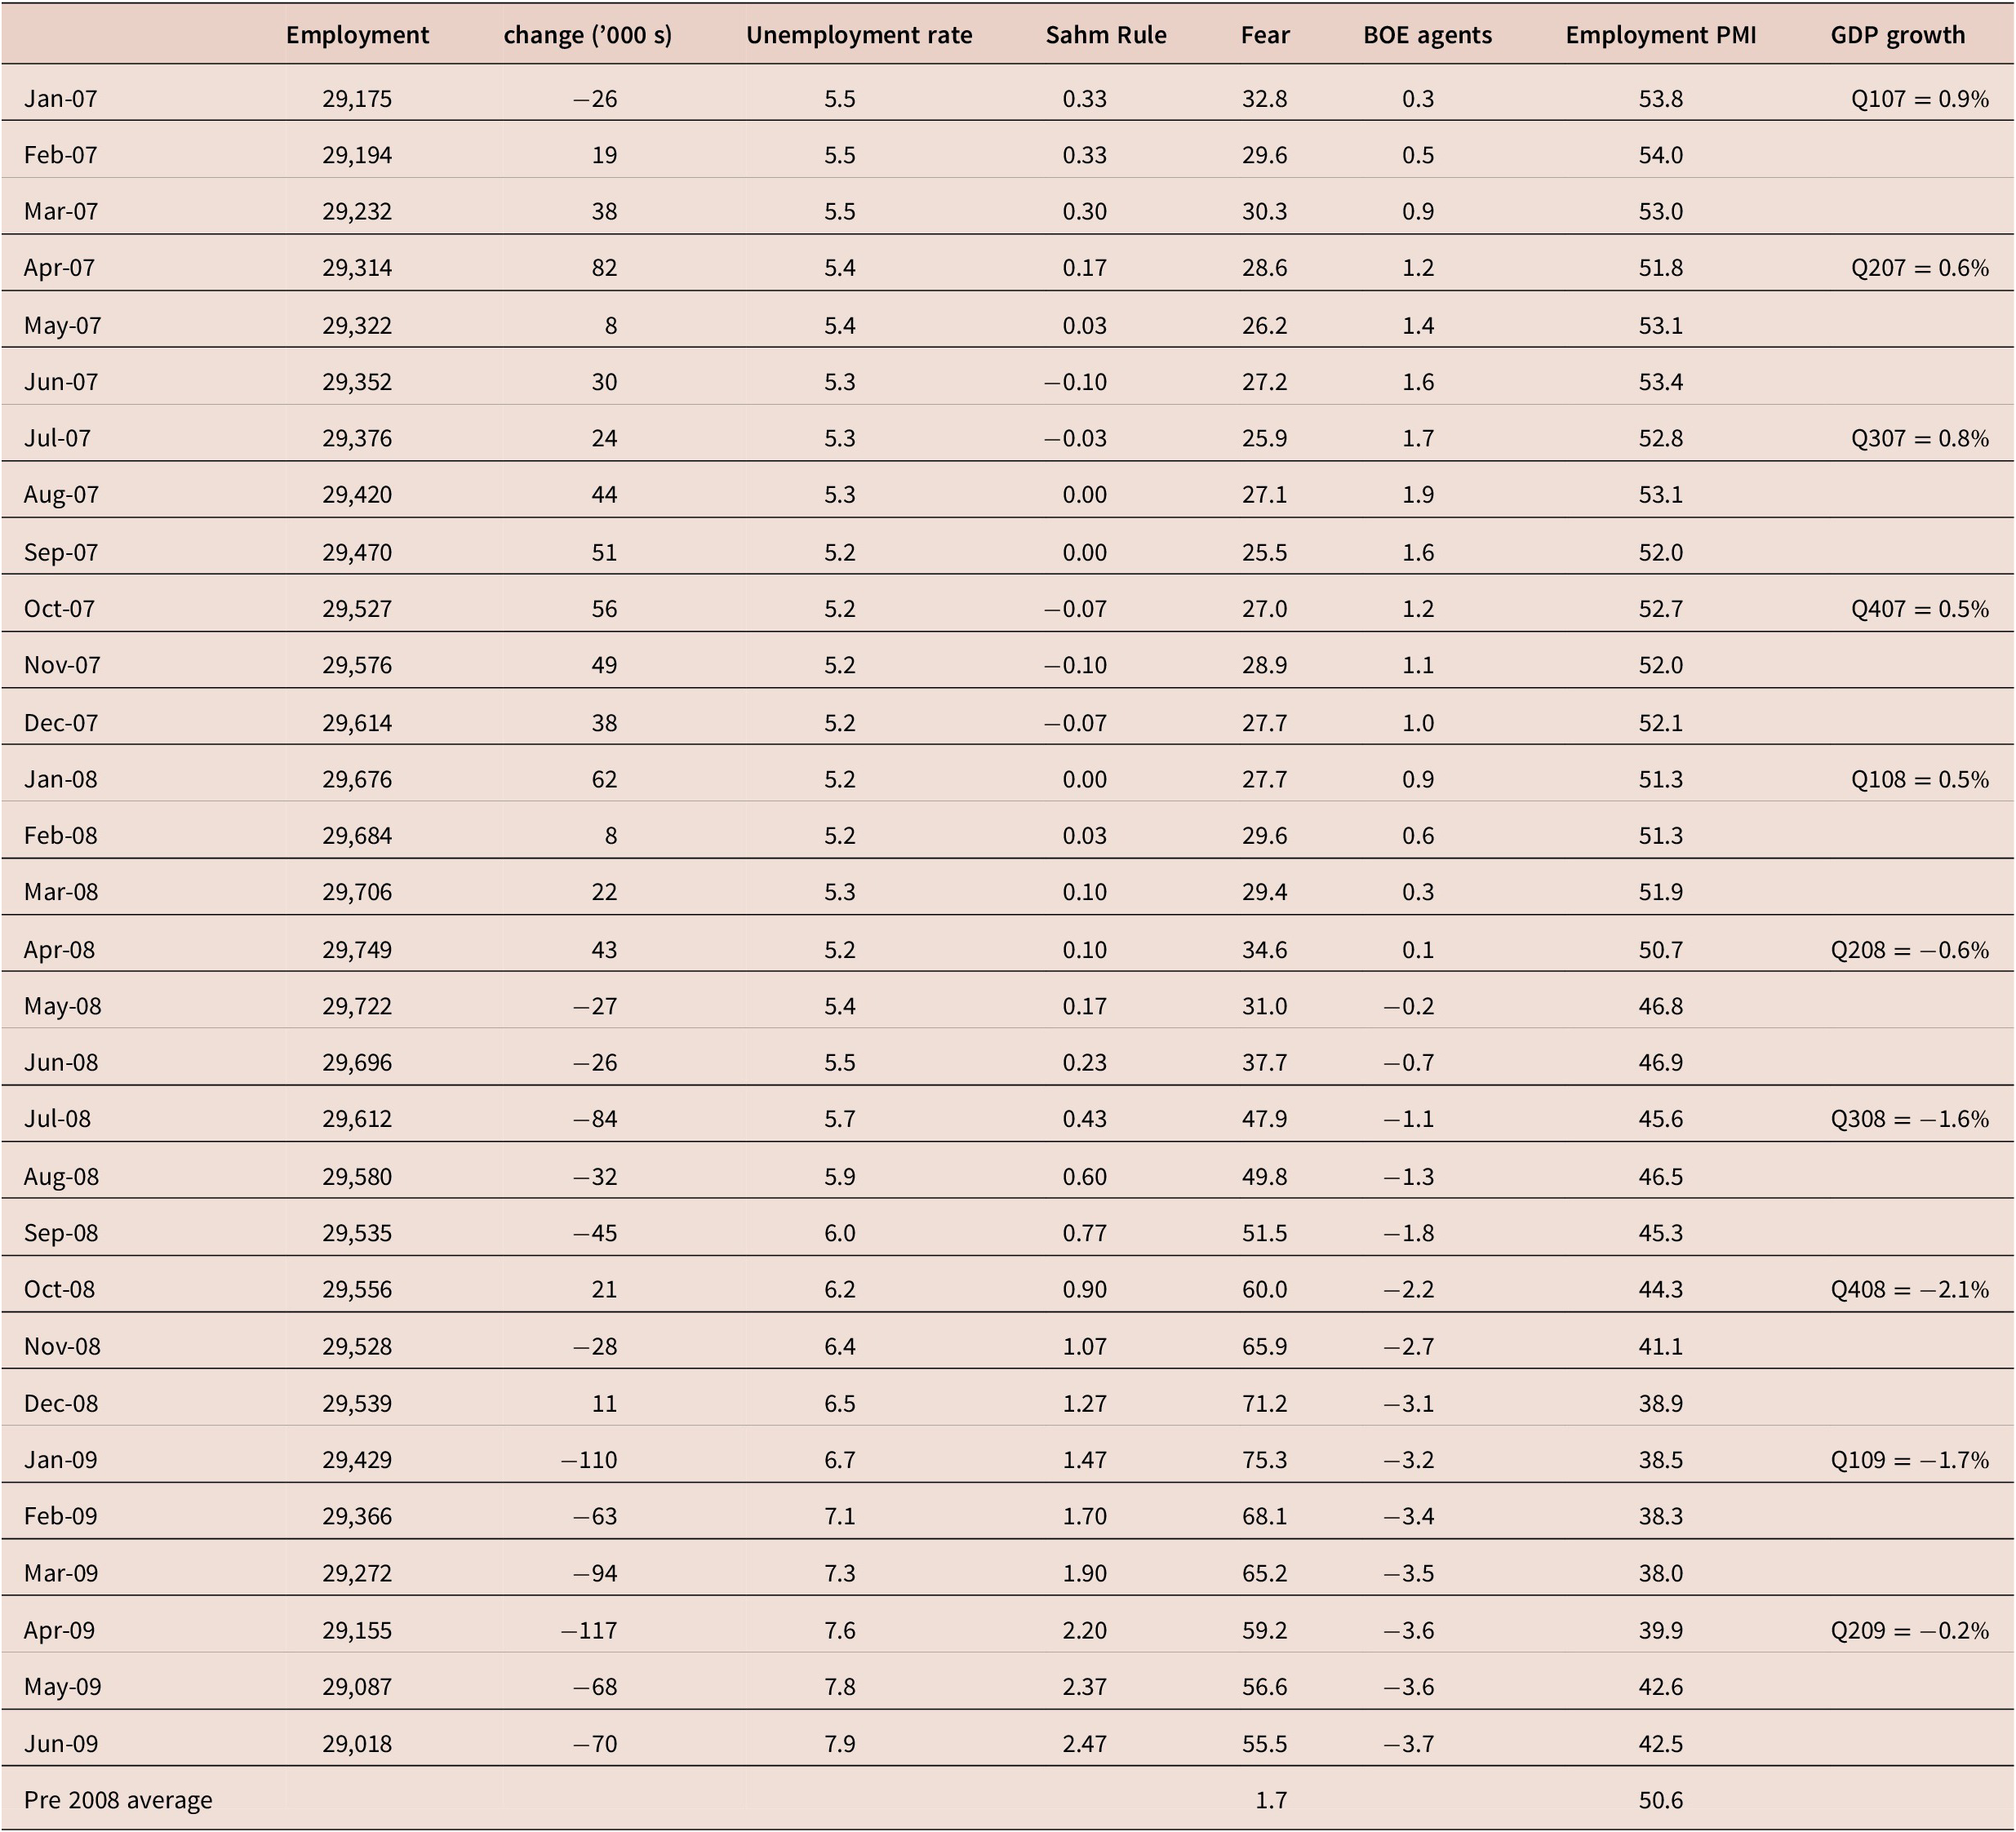
Note: BOE agents score is recruitment difficulties. https://www.bankofengland.co.uk/agents-summary/2018/2018-q3.
The Sahm Rule for the UK went to 0.5 in August 2008 (chart 5). It does seem that the unemployment rate is more of a lagging indicator in the UK than it is in the United States. But we should note that is 10 months before GDP growth in Q22008 was revised negative and Q32008 was not reported as negative until October 2008. Negative employment growth in two successive quarters does suggest the recession started 3 months earlier in May 2008.
(Colour online) UK unemployment rate and Sahm rule

4.2. The fear of unemployment
Blanchflower and Bryson (Reference Blanchflower and Bryson2021a,Reference Blanchflower and Brysonb) have already noted that there is considerably more qualitative data for Europe in general than for the USA, including the EU Business and Consumer Surveys and the Purchasing Manager Indexes (PMI), plus for the UK there were the Bank of England Agent’s monthly scores. The question is whether these help with turning points in 2008. Columns 6–8 of table 4 for the UK report the fear of unemployment series from the EU Commission; the Bank of England Agents’ Recruitment Difficulties score, and the Employment PMI from Markit.Footnote 21 These are timely indicators available often in the relevant month itself and are not revised.
In particular we make use of qualitative survey data from the Joint EU Harmonised Programme of Business and Consumer Surveys conducted by the European Commission (EC). Our major focus here is on the fear of unemployment (Blanchflower, Reference Blanchflower1991; Blanchflower and Shadforth, Reference Blanchflower and Shadforth2009) expressed not just by workers but based on a sample of working and non-working adults.
The question asked is:
Q1. How do you expect the number of people unemployed in this country to change over the next 12 months? The number will…
+ + increase sharply (PP)
+ increase slightly (P)
= remain the same (E)
− fall slightly (M)
−− fall sharply (MM)
DK (N)
Hence PP + P + E + M + MM + N = 100.
On the basis of the distribution of the various options for each question, aggregate balances are calculated for each question based on the proportions in each category. Balances are the difference between positive and negative answering options, measured as percentage points of total answers. The score is calculated as B = (PP + ½P) − (½ M + MM) which means the scores can vary between −100 and + 100.
Chart 6 for the UK plots the fear of unemployment rate and the unemployment rate itself over a longer time run. The UK fear series jumped sharply in April 2008, and the other two scores rose abruptly in May 2008. All suggested a sharp downturn in the second quarter of 2008, which is the month where the recession started based on two successive negative growth quarters.
(Colour online) UK fear of unemployment

The fear of unemployment started picking up from March 2005 (=14.7) and rose steadily through November 2006 (34) and then fell back through July 2007 (25.5). The unemployment rate started rising from 4.5 per cent in August 2005 to 5.5 per cent in January 2007 before falling back to 5.2 per cent in February 2008. The movements of the fear of unemployment preceded the changes in the unemployment rate. From September 2007 the fear series started picking up reaching a peak in January 2009. The unemployment rate started rising in March 2008, reaching a peak in September 2009. In August 2008 the fear series reached 49.8; the previous time it reached that level was when the unemployment rate was over 10 per cent.
Many other qualitative indicators in the UK were flashing red by the second quarter of 2008 and were approaching or even passing historic lows. Chart 7 plots the Bank of England Agents’ Scores on recruitment difficulties. Prior to 2008 the lowest level the series had reached was −0.7 in August 2006. The series started declining from the start of 2008. The series had gone negative in May 2008 and at −1.1 was below its historic low when the MPC in August 2008 declared there was no recession. Chart 8 plots Markit’s Employment PMI and shows that the previous low of the series was 45.6 in December 2001; that number was reached in July 2008 and the series continued down.
(Colour online) Bank of England agent’s score on recruitment difficulties

(Colour online) Markit’s UK employment PMI

Both series suggests the UK was slowing sharply, and presumably in recession, having reached historic lows certainly by July 2008. This was apparent in July 2008.
4.3. Other qualitative surveys
Table 5 reports results by sector from the same source as the fear of unemployment series for the period January 2007 to May 2009. Here, we report confidence series by four business sectors and for the consumer. Together they are aggregated to calculate the Economic Sentiment Index.Footnote 22 Each is an aggregation of several components. Details are provided in the notes to the table. We also report pre-2007 averages. It is notable that all five series started declining in 2007.
Business and consumer sentiment scores for the UK from EU Commission
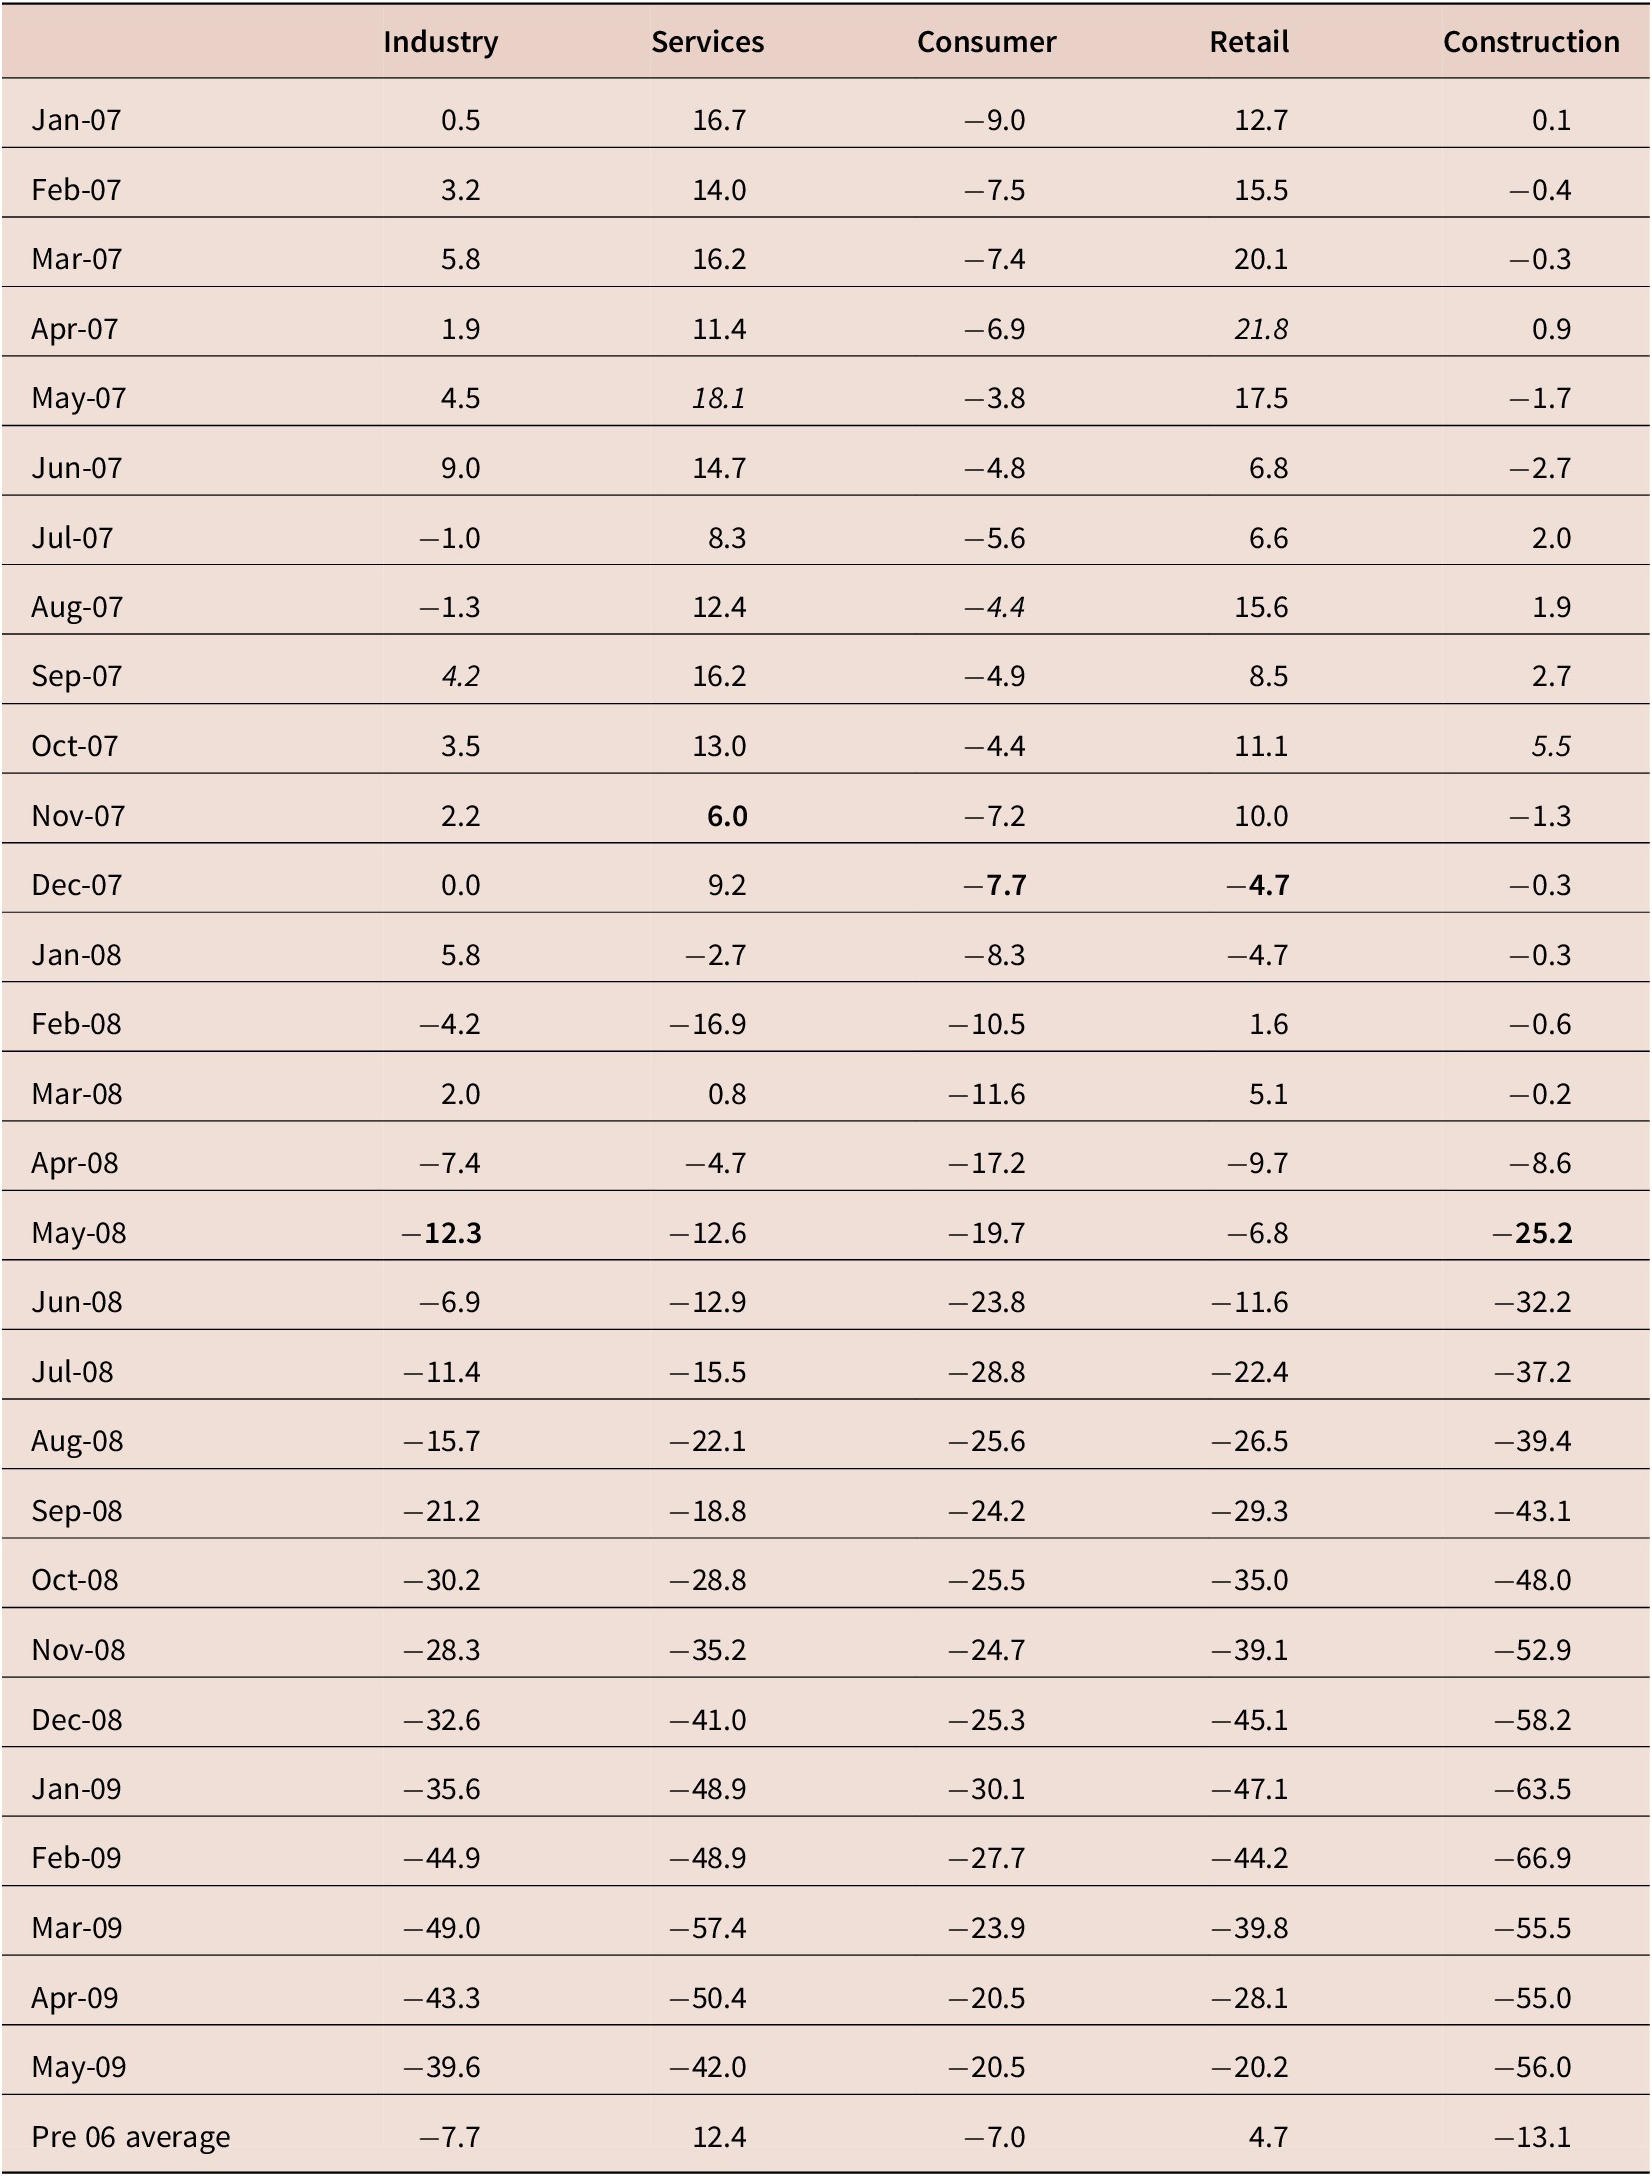
Note: (a) Industry: COF, Confidence Indicator (Q2 − Q4 + Q5)/3; Q2, Assessment of order-book levels; Q4, Assessment of stocks of finished products; Q5, Production expectations for the months ahead. (b) Services: COF, Confidence Indicator (Q1 + Q2 + Q3)/3; Q1, Business situation development over the past 3 months; Q2, Evolution of the demand over the past 3 months; Q3, Expectation of the demand over the next 3 months. (c) Retail: COF Confidence Indicator (Q1 − Q2 + Q4)/3; Q1, Business activity (sales) development over the past 3 months; Q2, Volume of stock currently hold; Q4, Business activity expectations over the next 3 months. (d) Construction: COF, Confidence Indicator (Q3 + Q4)/2; Q3, Evolution of your current overall order books; Q4, Employment expectations over the next 3 months. (e) Consumer: COF, Confidence Indicator (Q1 + Q2 + Q4 + Q9)/4; Q1, Financial situation over last 12 months; Q2, Financial situation over next 12 months; Q4, General economic situation over next 12 months; Q9, Major purchases over next 12 months. https://ec.europa.eu/info/business-economy-euro/indicators-statistics/economic-databases/business-and-consumer-surveys/download-business-and-consumer-survey-data/time-series_en. Bold shows the month the score was 10 below its 2007 peak, marked in italics.
In the case of manufacturing the index started deteriorating in March 2008 and went below its long run average (−7.7) in May 2008. Similarly, Construction started declining in November 2007 also went below its long run average (−13.2) in May 2008. The other three sectors all went below their long run averages at the end of 2007. Services went below the long run average in November 2007 while retail and the consumer indices went below those averages in December. By August 2008 when the MPC said there would be no recession the Service score of −22.1 was below its historic low of −17.6, as were both the Consumer (−25.6 vs. −25.3) and Retail scores (−26.5 vs. −22.4).
4.4. The Bank of England missed the Great Recession
When setting interest rates, for example, the problem is not only trying to understand where the economy is going but also, as noted above, where the economy has been and where it is at that time. Time lags in data releases on the labour market are also problematic especially in the UK, where data releases are delayed more than in any other country.Footnote 23
In its August 2008 IR the MPC forecast no recession: ‘the Committee’s central projection is for GDP to be broadly flat over the next year or so’ (p. 37). Indeed, the word ‘recession’ is nowhere to be found in the report. It seems the MPC spotted, but ignored, the rapid decline in both the Nationwide and EU surveys of household’s expectations of employment as shown in chart 9 (IR chart 3.8). The MPC also reported that the percentage growth of LFS employment had slowed from 0.5 per cent in Q407; to 0.4 per cent in Q108; 0.3 per cent in Apr08 and 0.2 per cent in May08. Plus, hours of work growth had halved between Q108 and April and May08 (IR table 3.8) while vacancies had collapsed (IR chart 3.7). The evidence of slowing was blindingly obvious as was pointed out in Blanchflower (Reference Blanchflower2008).
(Colour online) MPC’s indicator of household’s employment expectations, August 2008.
Sources: Nationwide and research carried out by GfK NOP on behalf of the European Commission.; (a) The Nationwide survey asks respondents whether they think there will be many or few jobs available in 6 months’ time; (b) Non-seasonally adjusted. The GfK survey asks respondents how they expect unemployment to evolve over the next year. The series has been inverted, such that a lower net balance reflects an increase in unemployment expectation

The latest data on the labour market available from the ONS, now available from the National Archive, reported on 16 April 2008 showed an unemployment rate for December 2007–February 2008 of 5.2 per cent.Footnote 24 The main headline in the report is that it was down 0.1 per cent compared with the 3 months September–November 2007. Blanchflower (Reference Blanchflower2008) however, did note on the basis of this release, that there were broad signs of the UK labour market starting to slow.Footnote 25 The signs included the following:
-
1. Hourly earnings growth is sluggish—both the average earnings index and Labour Force Survey measures are slowing.
-
2. Total hours and average hours started to fall in early 2008.
-
3. Claimant count numbers for February 2008 are revised up from a small decline to an increase.
-
4. There is a growth in the number of part-timers who say they have had to take a full-time job because they could not find a part-time job—up 37,000 in March alone.
-
5. Even though the number of unemployed has fallen, the duration of unemployment appears to be rising, which means that the outflow rate from unemployment has fallen. The numbers unemployed over 6 months in March 2008 was up 22,000 while the numbers unemployed for less than 6 months was down 47,000.
-
6. As in the United States, recent declines in employment in the UK, Blanchflower noted, were concentrated in manufacturing, construction and financial activities. The numbers presented below are in thousands, seasonally adjusted and relate to the number of workforce jobs. The quarterly data relate to the period September–December 2007 while the annual data refer to December 2006–December 2007.

It was clear that the UK labour market in April 2008 was slowing fairly quickly but it took several months to show up in the data. In the 13 August 2008, Labour Market Release from the ONS, which provided evidence for April–June 2008, much had changed, and the unemployment rate had now jumped to 5.4 per cent. By the 15 October 2008 release, the unemployment rate for June–August had reached 5.7 per cent. The subsequent rises were reported in table 4 below which showed that employment started declining in May 2008.
The August release seasonally adjusted employment for those age 16+ for April–June 2008 was reported from the Labour Force Survey as 29,558,000, up from 29,541,000 in March–May 2008. However, the ONS subsequently adjusted the population weights and now the two numbers have been revised, as shown in table 4, to show a fall of employment of 27,000 between April and May 2008. See for example Chandler (Reference Chandler2009) and Palmer and Chandler (Reference Palmer and Chandler2008) and especially Office for National Statistics (2014) that revised the May–July 2008 estimate to be consistent with the 2011 Census.
Blanchflower (Reference Blanchflower2008) also looked at qualitative indicators that were available at the end of April 2008 as an alternative and these are reported in table A.4. Many were at historic lows. They have not been revised. The table reports on five qualitative indicators showing what was known at the time at the end of April 2008. In part (a) there are four consumer confidence indicators, along with their long run averages, one from Nationwide and three from GFK with an overall balance, indictors of views of the future economic situation and views on major purchases. All four started dropping sharply at the end of 2007.
By March 2008, which was the most recent data available in April 2008, all four were well below their long run historical averages. For example, the Nationwide Consumer Confidence Index stood at 77 compared to a series average of 96, and down from 110 in January 2005. Part (b) of table A.4 reports on changes in a qualitative labour market series from REC on the demand for staff. This series started tumbling rapidly from around July 2007 and was at 49.0 in February 2008, compared with 64.1 in July 2007. All were good predictors of what was to come.
By the Spring of 2008, it was apparent from a large variety of UK qualitative data series, from the Nationwide Consumer Confidence series, The REC Series on demand for staff, the Bank of England Agents, the PMIs and the EU Commission Business and Consumer Surveys, all of which were saying the same things. The UK had followed the US into recession. It turns out, using the data in table 1, that by the start of Q32008 another 22 OECD countries had also entered recession, but neither the MPC, the FOMC or the European Central Bank (ECB) to name but a few seemed to notice. It was possible to spot the recession coming across the OECD, including in the US and the UK.
5. The rest of the OECD
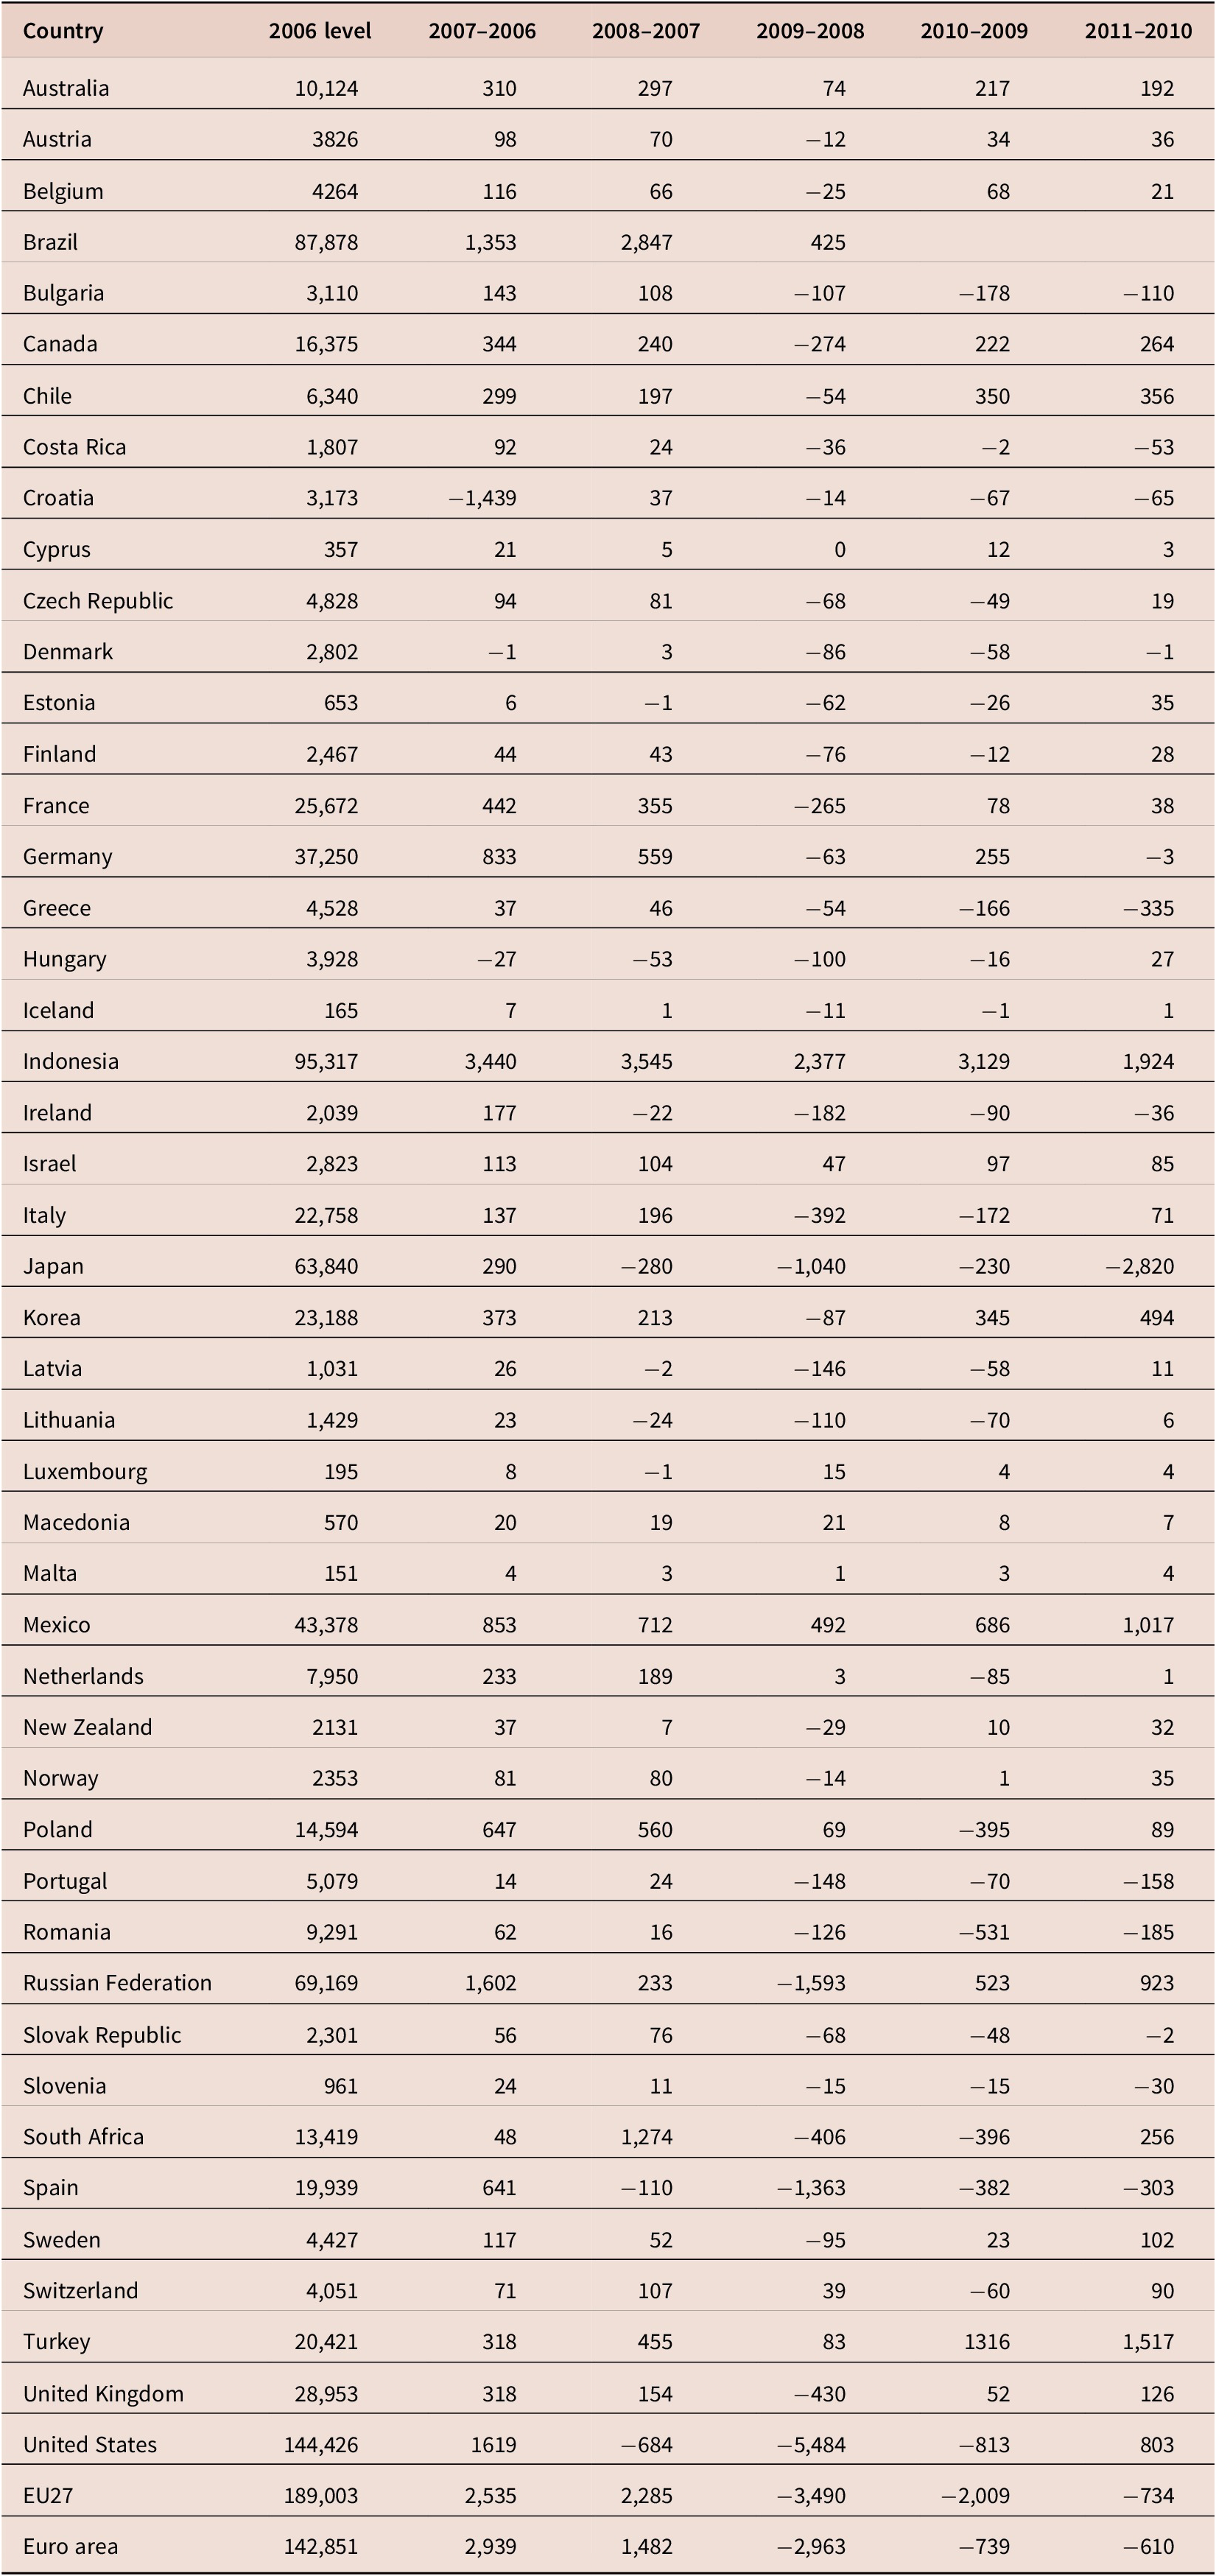
In most OECD countries, the unemployment rate took somewhat longer to respond than it did in the United States where the Great Recession started. The monthly unemployment rates for these countries are reported in table A.1 from December 2007 through April 2009. Annual rates are reported in table A.5 and annual changes in employment are reported in table A.6. In Germany and the Netherlands, the unemployment rate fell steadily through October 2008, before rising. In France, it started rising from June 2008, while in Italy the rise started in April 2008. In Spain and Greece, the rate started rising from November 2007. In the UK, the first big jump, from 5.2to 5.4 per cent was between April and May 2008.Footnote 26
We then obtained monthly unemployment rates across 40 OECD countries and estimated the Sahm Rule. The full excel data file is available on request from the authors. The first column of table 6 reports what we found, ranked by date, derived using the data in table A.1. We report Q32008 for New Zealand as they only publish quarterly data.Footnote 27 Sixteen of the estimates are for 2009, including five of the countries that did not have two successive negative GDP quarters—Australia, Bulgaria, South Korea, Malta, Poland and Slovakia. For the remaining 11 this is well after recession is indicated by the GDP data. The Sahm Rule for Canada identifies the start of recession as December 2008, consistent with the GDP data which suggests Q42008.
Recession dates by Sahm Rule, fear of unemployment and two negative quarters GDP growth

Abbreviation: NR, no recession.
Even for those countries with Sahm Rule estimates in 2008 most are later than would be indicated by the GDP data. For example, the GDP data suggest that the recession started in France (Dec-08), Germany (Apr-09), Italy (Feb-08), Japan (Feb-09) and the UK (Aug-08) in the second quarter of 2008 with the Sahm date in parentheses. The GDP data looks a better indicator of recession, but the problem is that these are estimates more than a decade later that have been subject to revision. These numbers were generally not available in 2007 and 2008.
6. Predicting turning points
The big question is, was this all foreseeable before it happened? Should the MPC and other central banks like the ECB have spotted it? Were the data there? It turns out they were. Hence, we now turn to table 7 where we report the consumer fear of unemployment data by month from January 2007 through June 2008 for 29 European countries including Turkey. We identify the month in 2007 when the fear series reached its minimum and identify that in red. We then identify when the fear series had risen by 10 fear points versus the low point in 2007. We think of this as a potential alternative ‘rule’ to the Sahm Rule.
Fear of unemployment by month, January 2007–June 2009 Western Europe
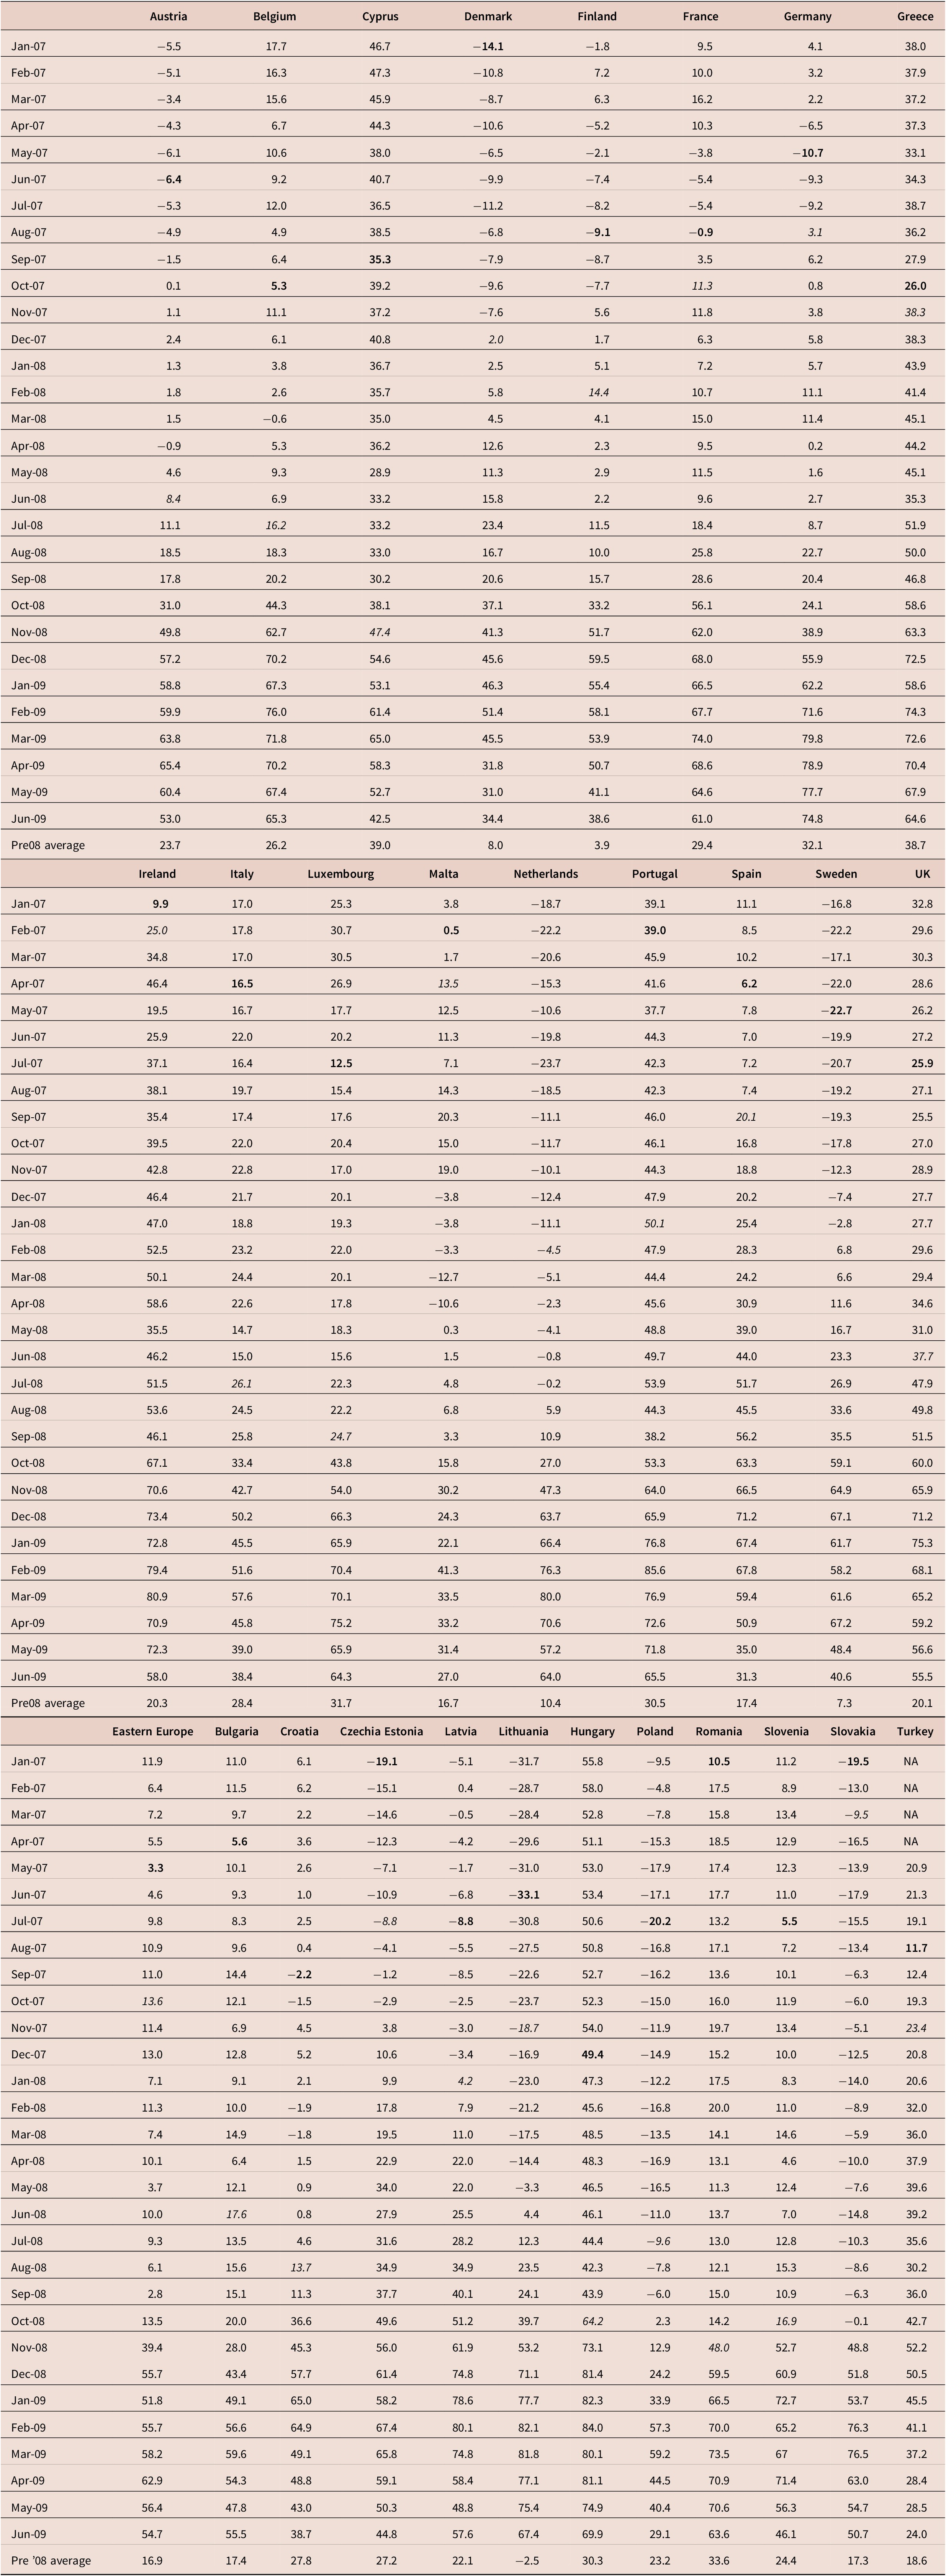
Note: Bold means low point of fear while italics means month of ten point growth.
Another possibility to the plus 10 Rule is to identify when scores raise above the long run pre 2008 average. With the exception of Hungary, Portugal and the UK all of these starting points are below their long run averages. Using this rule we report in column 2 of table 6, the month identified in the table using the plus 10 rule. Almost all of these are well before the Sahm rule dates in column 1 and none are in 2009, whereas 16 countries according to the Sahm Rule are.
The plus 10 rule works well in Europe. In 24/28 countries the start date of the recession identified by the plus 10 rule comes before the first of two quarters of negative GDP growth reported in column 3 of table 6. The exceptions are fairly close. We miss four: (a) Italy where we identify July08 as the turn whereas GDP suggests Apr-08, (b) Luxembourg where we identify Sept-08, and GDP suggests Jan-08 and (c) Hungary and Slovenia where we identify Oct08 whereas GDP dropped first in Jul-08. The start as measured by the first of two negative GDP quarters comes before the Sahm rule date in 17/28 countries. Four are the same—Belgium, Bulgaria, Lithuania and Slovakia. The Sahm Rule precedes that determined by GDP in five countries—Hungary, Ireland, Italy, Latvia and Spain.
Results are very similar if we simply look to see evidence of big monthly increases without imposing a rule. Another possibility is to look for large upward monthly changes. Examples in Western Europe from table 7 are: Austria Oct-08 (+13); Belgium Jul-08 (+9) and Denmark Apr-08.
If we look at table 5 which has the four business and one consumer indicators for the UK from January 2007 to May 2009, we can also use the plus 10 rule. In that case we see all give recession start dates from the end of 2007 through May 2008.

The Sahm Rule dates mostly come after those identified using the fear data either using the 10plus rule or looking for big monthly changes. These dates are also after those identified using GDP in 17 countries including most of the major Western countries—Austria, Croatia, Czechia, Cyprus, Denmark, Estonia, Finland, France, Germany, Greece, Luxembourg, Netherlands, Portugal, Romania, Slovenia, Turkey and the UK.
Returning to the US there is one suitable employment confidence survey series available to calculate the plus 10, rule. The Conference Board’s Plentiful Jobs Index as reported in Blanchflower (Reference Blanchflower2008, table A.1) can be used.Footnote 28 The highest value in 2007 was in March at 30.7. It took until March 2008 for the series to drop at least 10 points to 18.5. The 10+ rule appears to also work in the United States. We knew this in March 2008.
7. Conclusions
This article examines various data series for the United States, the UK and the rest of the OECD and considers how movements in these data helped identify the onset of the Great Recession. For the majority of OECD countries, it is feasible to identify the start of the Great Recession using the rule of two successive negative quarters of GDP growth. We found this in 32 of the 39 countries we examined. Of these only three saw the recession start in 2007, while the rest started in 2008. However, we only know this more than a dozen years after the onset of recession due to data revisions. At the time GDP estimates tended to overestimate GDP growth. Thus, a major problem with using these data is that it may well take a while to find the true turning point. This was the case in the UK when it took until June 2009 to establish that the recession started in April 2008.
The United States is in a unique position as it has the NBER BCDC who do not mechanically call recessions based on the two negative quarter GDP rule. In December 2008, the NBER called the start of recession as December 2007 despite the fact that there is a good deal of evidence from state-level employment data suggesting the start was around July 2008. The reason for this was mostly based on developments in the labour market, including declining employment and rising unemployment. Unlike in the US, most other countries saw labour market declines coming after two negative quarters (e.g., France, Germany, Japan and the UK). This is what appears to have happened too in the pandemic when US unemployment rose sharply during 2020 but did so much less in other OECD countries.
We then evaluated the Sahm Rule which has been suggested as a way of signalling recession based on looking at the unemployment rate. It indicates recession started in February 2008. We applied this to 39 other countries and found that more often than not the start date was later than that derived from using GDP. But that is an ex-post rationalisation, given that we know that at turning points GDP data itself is revised down and the Sahm Rule can indicate what is coming.
Evidence of employment declines across US states using household data suggests that recession started in 2007. By August 2007, 38 states and the US as a whole had seen at least two successive quarters of negative growth in 2007. NFP declines suggest February 2008.
The major point of this article is to argue that the qualitative data are the best indicators of recession across the OECD. In the US, the labour market data turned down before quarterly GDP did. The reverse is true in other OECD countries. But in all of these countries qualitative data had turned down earlier, and especially so in the United States. Policymakers should focus on the qualitative data as an indicator of turning points. We find a good measure of when the recession started is when the fear of unemployment series begins to rise sharply. We adopt a ‘10 point rule’: recession is signalled when the fear of unemployment series rose 10 points above its 2007 low. We use this rule as the data series had started to rise early in some countries such as the UK and the mean of the pre 2007 series differs a lot by country. It is especially low for example, in Denmark, Finland and Sweden, which are well known to be the happiest countries in the world, as shown in the 2021 World Happiness Report (see Helliwell et al., Reference Helliwell, Layard, Sachs and De Neve2021).
We found this rule helped predict GDP calculated recession across the 28 countries we examined. In 11 countries, the spike was in 2007 and unlike the Sahm Rule none was in 2009. In 5 countries, it was in the same quarter as suggested using GDP (Belgium; Cyprus; Finland; Romania and the UK). In 17 countries, it was in an earlier quarter (Austria, Bulgaria, Croatia, Czechia, Denmark, Estonia, France, Germany, Greece, Ireland. Latvia, Lithuania, Netherlands, Portugal, Slovakia, Spain and Turkey). In three countries, it was in the following quarter (Hungary, Italy and Slovenia) while in Luxembourg it was two quarters later. In two countries, that GDP did not identify a recession we found the recession started in Poland in July 2008 and in Malta in April 2007, compared with February 2009 for both using the Sahm Rule.
The qualitative data were flashing red for recession across the OECD by April of 2008. Later GDP data confirmed that fact. It was also apparent that what was happening in the US had spread around the world as it did in the 1929 Great Crash. The data showed clearly by the spring of 2008 that the US had been in recession for several months (Blanchflower, Reference Blanchflower2008). This should have suggested the rest of the advanced world as going to follow a financial crisis in the US given the global banking system. Almost everywhere, and certainly in all the major Western countries, all of the qualitative data series we looked at were tumbling by the Spring of 2008. That was true by country and also true in manufacturing, services, retail and construction and consumer confidence was also plunging.
There is some evidence from chart 6 that these fear data have some forecasting value in subsequent periods. The fear of unemployment series in the UK started picking up from 2014 even as the unemployment rate continued to fall through September 2019. It then started to pick up before the pandemic hit. Single month unemployment rates went from 3.5 per cent in October 2019 to 4.0 per cent in January 2021. It should also be noted that not only had the unemployment rate started to rise pre-pandemic, but quarterly GDP growth had also started to slow with the latest estimate for 2019Q4 of 0 per cent.
It turned out though that a big difference was that it took a while for the unemployment rate in particular to pick up outside the United States, just as happened in the Spring of 2020 as the COVID lockdown was implemented. Sadly, even by the time Lehman Brothers failed on 14 September 2008, central bankers, policymakers and most economists had not understood what was happening on the ground. It was there right in front of their very eyes in the qualitative data, but they failed to look. This article suggests this would not have happened in Europe if they had implemented the Plus 10 Rule. The moral from this is there was sufficient data available in early 2008 such that policymakers should have been able to predict the timing and scale of these sorts of events with quite a lot of precision. There was no need for perfect foresight; looking at the data would have been enough.
Acknowledgements
We thank Phillipa Dunn, David Kotok, Claudia Sahm and Chris Williamson for their help with earlier versions of the paper.
Appendix
Monthly unemployment rates December 2007–April 2009 OECD and EU Countries
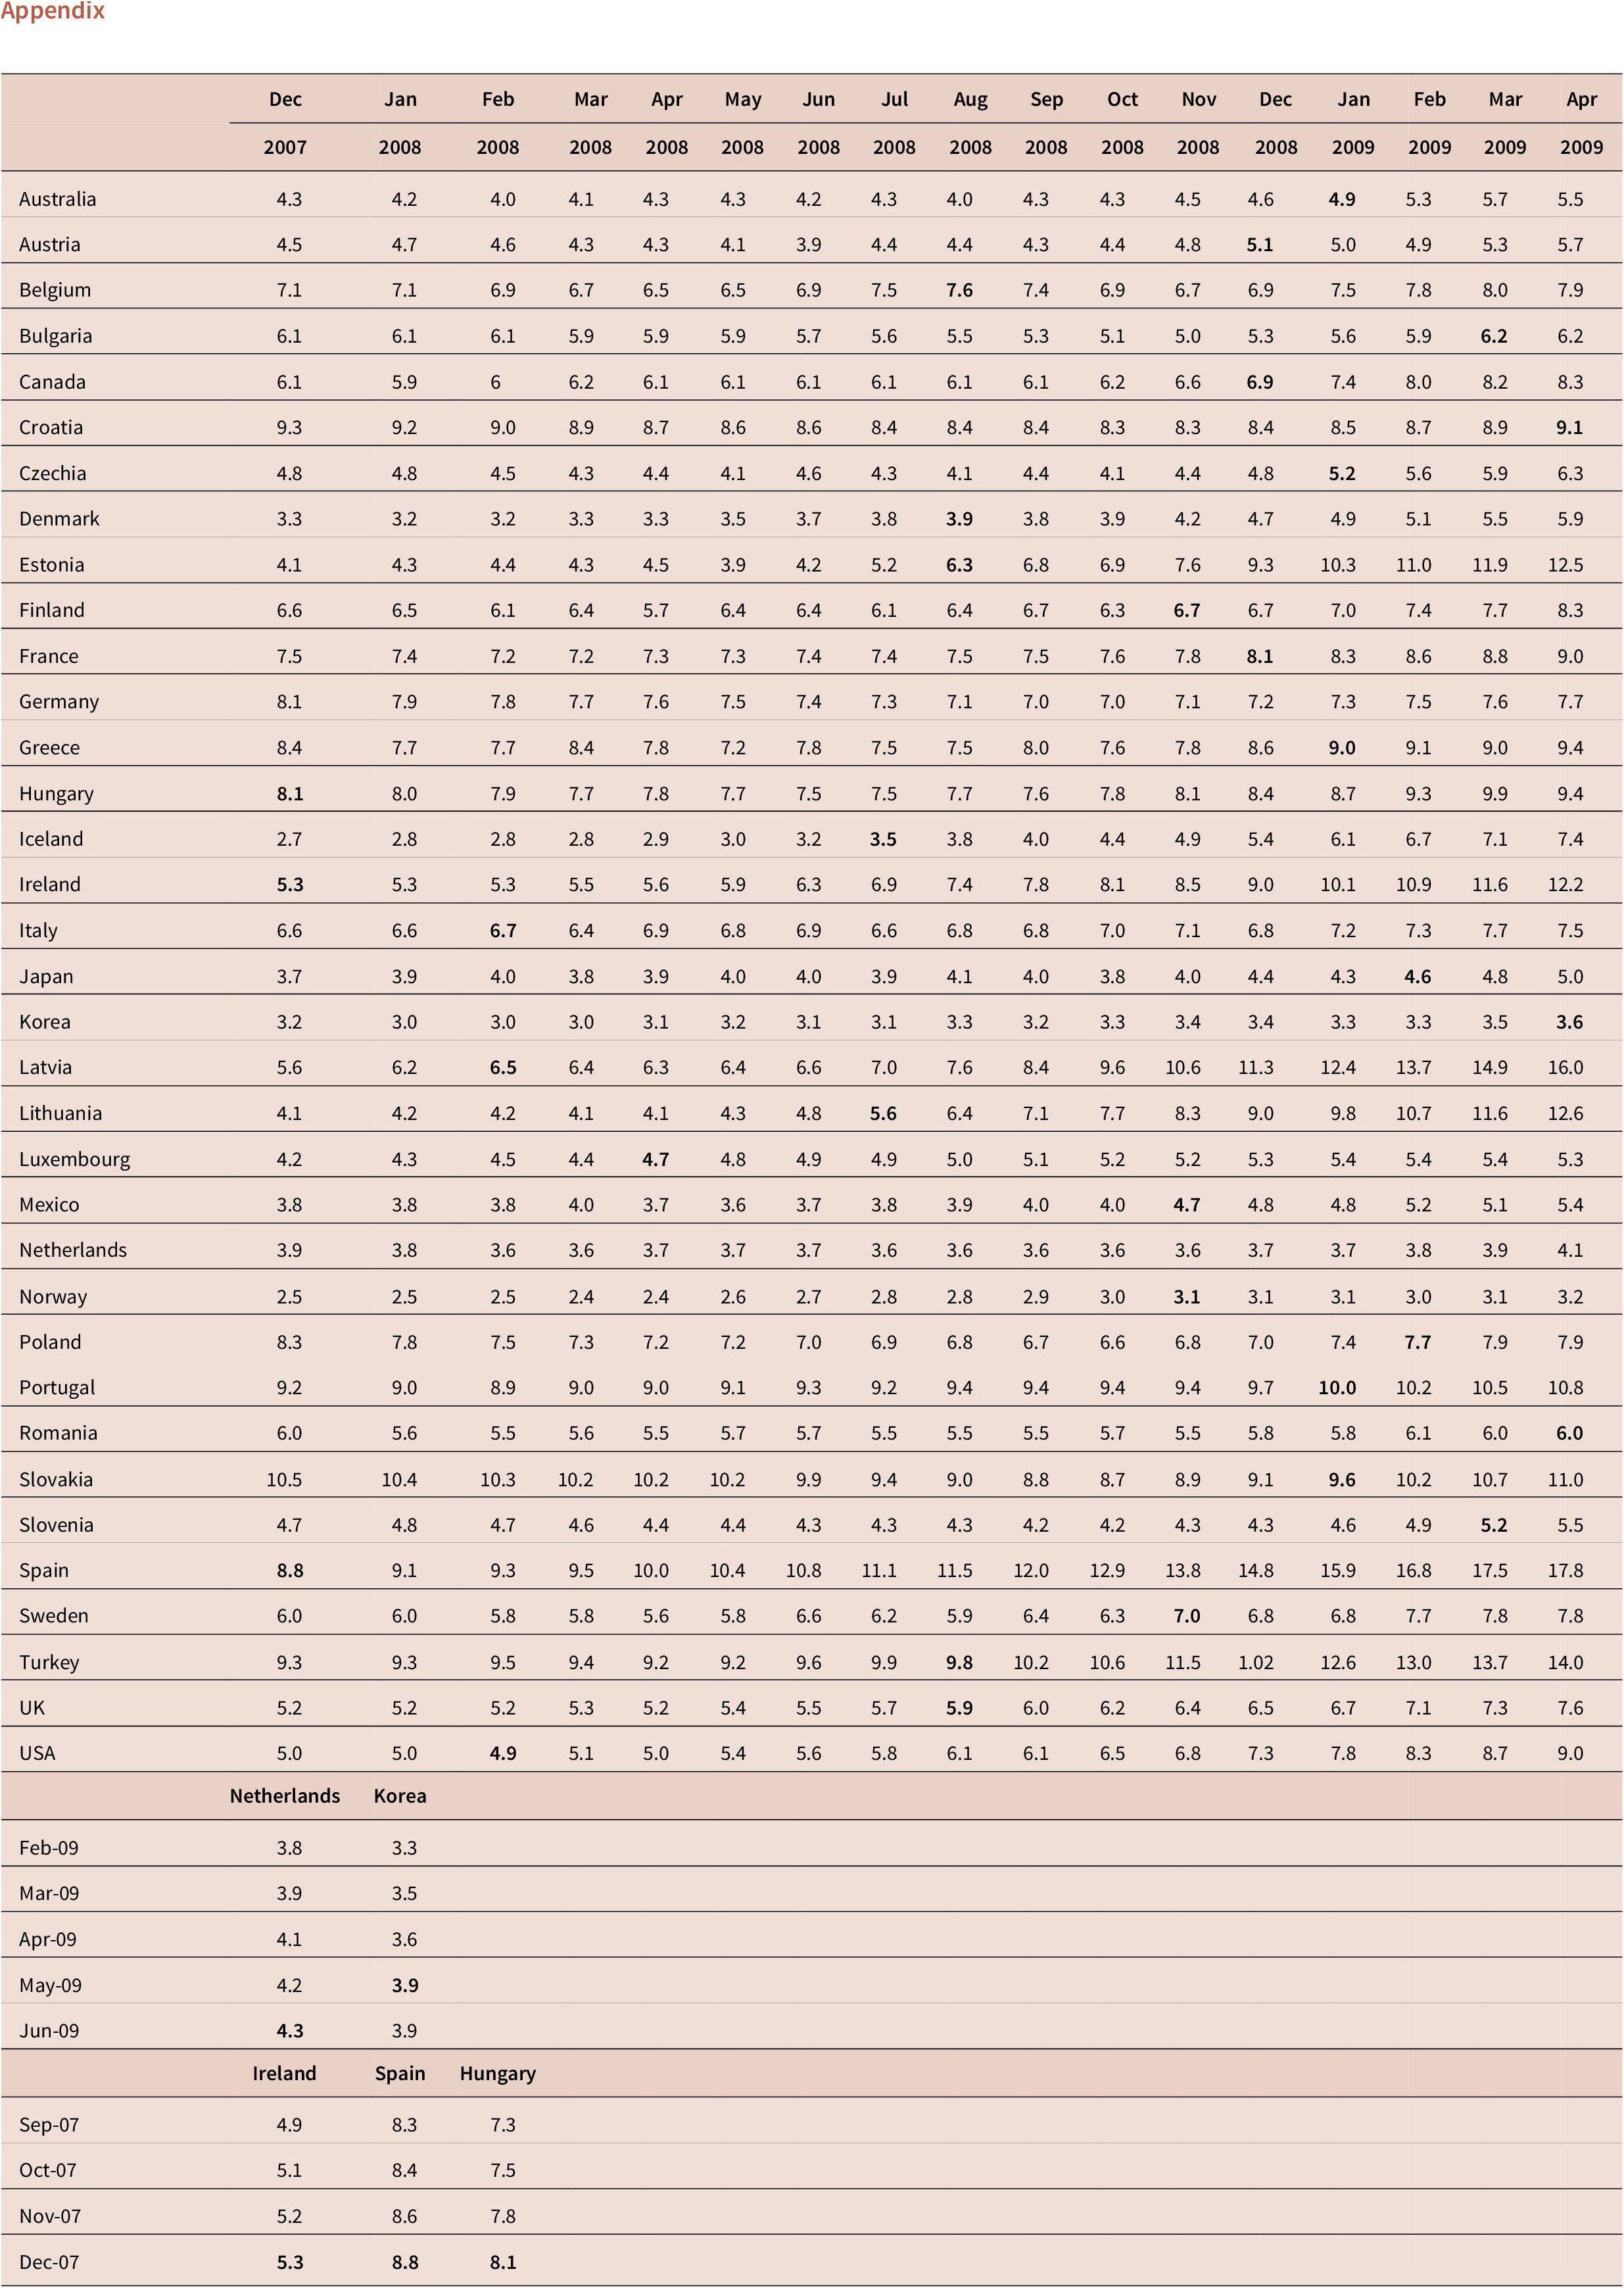
Note: Bold shows Sahm Rule month > 0.5.
Employment change 2007, for states with >1 negative month
US quarterly GDP growth rates (%)

Note: Numbers identify start of recession, based on two negative quarters GDP growth. Bold means negative quarter of GDP growth. Italics means NBER dated recession.
UK Economic Conditions May 2004-March 2008. Source: Blanchflower (Reference Blanchflower2008)

Source: Blanchflower (Reference Blanchflower2008).
Annual OECD unemployment rates for 30 countries (https://data.oecd.org/unemp/unemployment-rate.htm)

Annual employment change versus 2006 level (’000 s)


 Open access

