

1. Introduction
The available spatial coverage of snow, firn and ice records is inadequate to document climatic and environmental change over the vast Asian continent. However, environmental records from the northwestern periphery of the central Asian mountain system (CAMS), obtained from Tien Shan firn/ice cores (Reference Kreutz, Aizen, Cecil and WakeKreutz and others, 2001, Reference Kreutz, Wake, Aizen, Cecil and Synal2003; Reference Aizen, Aizen, Melack, Kreutz and CecilAizen and others, 2004) and snow/firn-core records from alpine areas in Siberia (Reference OlivierOlivier and others, 2003; Reference Aizen, Aizen, Joswiak, Fujita, Takeuchi and NikitinAizen and others, in press), are extending the area of climatic and environmental analyses in Asia.
The research reported here focuses on the Siberian Altai, the most continental northern periphery of the CAMS and the southern periphery of the Asian Arctic basin (Fig. 1). It is an ideal area for the analysis of climatic records relating to the major northern Eurasian circulation systems, i.e. the westerly jet stream and the Siberian high. Altai glaciers, located at the center of the Eurasian continent, provide records on the advection of fresh water transported from the Atlantic and Pacific Oceans to the Arctic Ocean (Fig. 1). Firn records from the Altai glaciers can also be associated directly with the large Aral–Caspian internal water system, with moisture transferred from this closed Asian drainage basin to the great Siberian river basins. The Atlantic, Arctic and Pacific Oceans are considered external moisture sources for the Siberian Altai. Internal moisture sources refer to evaporation from continental sources, such as the closed Aral and Caspian drainage basins, or convection from local basins, subjected to stronger kinetic effects and greater continental recycling. In the analyses, moisture transferred from the eastern Black Sea to the Altai mountains is also considered as evaporated from an internal moisture source. Thus, Altai glaciers store unique information on climate dynamics and on the internal and external hydrological cycles of northern Eurasia.
Map of the research area. Meteorological stations are numbered: 1. Kara-Turek; 2. Akkem; 3. Aktru.

Data on the stable-isotope content in precipitation and firn core have contributed to our understanding of environmental signals from different regions of the globe (Reference Friedman, Redfield, Shoen and HarrisFriedman and others, 1964; Reference JohnsenJohnsen, 1977; Reference Yao and ThompsonYao and Thompson, 1992; Reference DansgaardDansgaard and others, 1993; Reference ThompsonThompson and others, 1995; Reference Aizen, Aizen, Melack and MartmaAizen and others, 1996, Reference Aizen, Aizen, Melack, Kreutz and Cecil2004; Reference JouzelJouzel and others, 1997; Reference Yao, Masson, Jouzel, Stiévenard, Sun and JiaoYao and others, 1999; Reference WelkerWelker, 2000; Reference Froehlich, Gibson and AggarwalFroehlich and others, 2002; Reference NaftzNaftz and others, 2002). In general, the main controls affecting the stable-isotope content in snow, firn and ice are the atmospheric deposition conditions, especially temperature, and the associated air-mass trajectories and source regions. The overall levels and seasonal fluctuations of the δ18O and δD relationship provide insight into changes in the hydrologic cycle and have been used as a climatic indicator in ice-core records (Reference Hammer, Clausen, Dansgaard, Gundestrup, Johnsen and ReehHammer and others, 1978; Reference Jouzel, Koster, Suozzo and RussellJouzel and others, 1994; Reference PetitPetit and others, 1999; Reference Vimeux, Masson, Jouzel, Stiévenard and PetitVimeux and others, 1999) and in isotopic modeling of atmospheric processes (Reference Ciais and JouzelCiais and Jouzel, 1994; Reference Hoffmann, Jouzel and MassonHoffmann and others, 2000; Reference Tian, Masson-Delmotte, Stievenard, Yao and JouzelTian and others, 2001).
The main objective of this research is to determine the physical processes controlling the δ18O and δD stable- isotope content recorded in the Altai glaciers and to couple these records with the precipitation-origin time series through analysis of synoptic-scale atmospheric dynamics. Information on the distribution of stable isotopes in firn cores from the Siberian Altai can be used to evaluate the contribution of water vapor, associated with external and internal water cycles, to snow accumulation over the northern periphery of the CAMS.
2. Long-Term Data
For our climatic analysis, we used 50 year long-term meteorological data from the Akkem (49º54′ N, 86º32′ E; 2045 m a.s.l.), Kara-Turek (49º57′ N, 86º29′ E;2600 m a.s.l.) and Aktru (50º5′ N, 87º46′ E;2110 m a.s.l.) stations, respectively located 10, 15 and 30 km north, northwest and northeast of the Belukha snow/firn plateau. Data from these stations have the highest correlation with air temperature and precipitation at Altai glaciers (Reference GalakhovGalakhov, 1981). All meteorological data were checked for homogeneity, inspected for the presence of random errors and plotted for periods with missing observations, following recommendations by Reference Easterling, Peterson and KarlEasterling and others (1995).
To describe atmospheric circulation patterns over southwestern Siberia that influence regional precipitation regimes at seasonal timescales, we used monthly data on the frequency of synoptic patterns observed in the Altai mountains developed by Reference PopovaPopova (1972) and Reference Narojniy, Narojnaya and PopovaNarojniy and others (1993), and partially presented in the Central Asia Data Base completed and maintained by authors at the University of Idaho. Daily data begin from 1954, and generalize information derived from daily synoptic maps that include 2500 elementary circulation patterns. As a result, eight types of macro-synoptic processes for the Siberian Altai were identified (see Appendix). The derived classification was based on the probability of different synoptic conditions tracking the main troposphere airflows (e.g. cyclonic and anticyclonic currents over the surface and at the 500 mbar level). A similar classification developed for central Asia is presented in Reference Aizen, Aizen, Melack, Kreutz and CecilAizen and others (2004).
3. Field Measurements
The west Belukha plateau (Figs 1 and 2) is the only Siberian location where the Altai glaciers have sufficiently cold temperatures and enough snow accumulation to preserve climatic and environmental records that are unaffected by meltwater percolation. The west Belukha snow/firn plateau is in the cold recrystallization zone where positive temperatures were never observed at the drill site (4100ma.s.l.). There is no record of positive air temperatures near the drill site during 2000/01, as measured every 3 hours using a Grant Instruments automatic weather station (Fig. 3).
(a) View from Akkem lake and meteorological station to the Belukha massif. (b) The drill site, west Belukha plateau (4115 m), Siberian Altai. Photo by V. Aizen, August 2003.

(a, b) Diurnal (a) and monthly (b) mean air temperatures on the west Belukha snow/firn plateau measured by automatic weather station, July 2002–April 2003. (c) Borehole temperature profile, August 2003. (d) Snow-pit temperatures.

The long-term average monthly air temperature at the drill-site altitude was calculated from linear extrapolation of Akkem station air temperatures with mean altitudinal gradients, and demonstrates the regime of negative air temperatures (Fig. 4a). The spring, summer, autumn and winter mean altitudinal gradients of air temperatures (6.8, 7.2, 3.9 and 2.1 °C10–3 m–1) were calculated using long-term data from Akkem, Kara-Turek and Aktru stations.
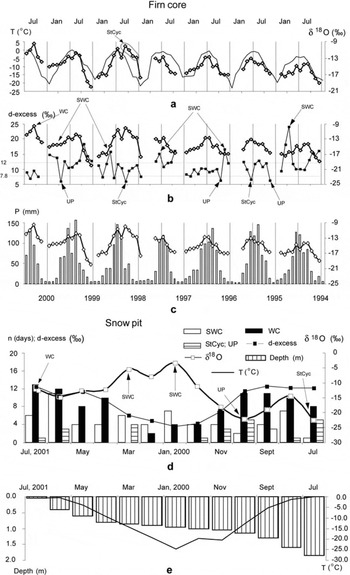
(a) Long-term monthly means of air temperature at the drill site, precipitation and share/fraction of monthly precipitation in annual total at Akkem station. (b) Long-term monthly means and standard deviations of δ18O and d-excess averaged from Altai snow/firn-core records, 1984–2001. (c–e) Long-term mean number of days with different synoptic patterns: southwest cyclones (c); western cyclones and western anticyclone (d); and stationary cyclones/ultra-polar intrusion (e).

Snow/firn/ice temperatures were measured every 10m in the 170 m borehole at 4115 m a.s.l. (Fig. 3c), and every 3 cm in the snow pit (Fig. 3d) using electric sensors. The lower temperatures in ice than in air indicated the non-existence of melt. From 0°C at the snow surface, temperature dropped to –10°C at 2 m depth (Fig. 3d), to –15.8°C at 50–70m depth and to –14.2°C at the bottom (Fig. 3c), lower than the annual mean air temperature at this elevation (T air(1984–2000) = –10.2°C;see Table 1).
Mean annual and seasonal oxygen and deuterium isotope ratios and deuterium excess in firn/ice-core (f/iC), snow-pit (snP) and precipitation (Pr) records from the Belukha plateau, the Altai and other glaciers and sites along the northern periphery of central Asia

The melt index (Reference Koerner and FisherKoerner and Fisher, 1990) compiled from the measured 5 cm density data (Fig. 5d), and the analyzed stratigraphy (Fig. 6) showed <5% of melt caused by solar radiation at air temperatures close to zero (Fig. 3). This minimal melt may form thin ice crusts and ice lenses on the snow surface but is insufficient to penetrate downward (Fig. 6).
(a-e) Isotopic composition in the snow/firn core: δ18O (a); δD (b); sulfate content SO4 2 (c); snow/firn density, p (d); and cumulative snow water equivalent, ΣAc (e). (f) Correlation between annual accumulation (Ac) records from firn/ice core and precipitation, P at Akkem station. (g) Annual accumulation records from snow/firn core and precipitation at Akkem station. Years (1984–2001) represent winter intervals.

Stratigraphy of 21 m snow/firn core recovered in 2001 (a), and stratigraphy (b) and snow/firn density (c) of 7 m snow/firn pit dug in 2002 from the west Belukha plateau with seasonal and annual-layer identification: 1. fine-grained snow/firn; 2. medium-grained snow/firn; 3. coarse-grained snow/firn; 4. 1–2 mm radiation of wind ice crusts; 5. ice lenses or ice layers up to 5 mm thick; 6. regelate snow/firn; 7. finegrained snow/firn with aeolian particles; 8. compact white snow/firn.

The drill site selected by a Swiss team (Reference OlivierOlivier and others, 2003), on the saddle (4062 m a.s.l.) of a narrow field between the Belukha (4499 ma.s.l.) and west Belukha (4406 m a.s.l.) peaks (Figs 1 and 2), is lower and warmer. Furthermore, because of very strong snow and wind redistribution, particularly in the winter between the two peaks, the saddle is not as suitable for snow/firn-core records as the west Belukha plateau, where seasonal δ18O and δD signals (Fig. 5a and b) are better preserved.
In the summers of 2001 and 2002, snow samples were collected every 3–5 cm from five 2–3 m snow pits and one 7.0 m snow pit from the Belukha snow/firn plateau (4110–4120 m a.s.l.). A 21 m snow/firn core was recovered at 4115 m a.s.l. (49º48′ N, 86º33 Έ), where radio-echo sounding indicated the ice was about 176 m thick (Fig. 7). Snow- pit, precipitation and fresh snow samples were collected into pre-cleaned plastic bottles. The density of fresh snow and snow pits was measured at 5 cm intervals using a 100cm3 stainless-steel sampler. The firn core (19 m long, 9.5 cm in diameter) was extracted from the bottom of the 220cm snow pit with a Polar Ice Coring Office (PICO) fiberglass auger. The diameter, length and weight of each recovered core section were measured to calculate density. Firn-core sections, sealed in pre-cleaned polyethylene bags, were packed into insulated shipping containers and delivered to the Japanese National Institute of Polar Research (NIPR), Tokyo.
Ice-thickness profiles, snow pits, the weather station and snow/firn drill site on the west Belukha plateau, projected onto an aerial photograph.

Five stakes and benchmarks were installed for location measurements by precise global positioning system (GPS) during summer field seasons on Belukha glacier (2001: GP-SX1, TOPCON;2002: Allstar, CMC Electronics). An automatic snow-depth gauge was installed at stake 2 on 18 July 2001 (KADEC-SNOW, KONA system). The sensor detected snow and open air using photo-diodes in increments/declines of 1 cm to 26 October 2001. The surface level was measured twice daily, in the morning and evening (Fig. 8). Daily snow accumulation (snow water equivalent (SWE) in mm; Equation (1)) was computed based on positive changes in the snow surface level (ΔH in cm) and assuming a density of new snow (p) of 0.22 gcm–3 (Fig. 6c). Negative or zero values of Δh observed during snow sinking were considered as absence of daily snow accumulation.
Twice-daily measured snow surface level (h), snow water equivalent (SWE) and accumulated snow water equivalent (SWES) at the drill site (a) and daily precipitation (P and accumulated precipitation (PS) (b) at Akkem meteorological station, 2001.

where Δh m and Δh e are positive differences of morning/evening and evening/morning changes in snow surface level;10 is the unit transfer coefficient.
4. Laboratory Analysis
The Altai cores were processed in a dedicated cold room at NIPR using techniques established for ultra-clean sample preparation. Frozen 18 mΩ water blanks were passed through the entire system to ensure there was no contamination, and for quality control. Each 3–5 cm of the upper 11 m of the snow/firn core, as well as samples from five snow pits, and fresh snow, were analyzed for δ18O and δD at NIPR. The bottom 10 m of the core was analyzed for δD at the University of Maine and for δ18O at the University of Idaho. Oxygen isotope ratios were measured using the standard CO2 equilibration technique (Reference CraigCraig, 1957). Hydrogen isotope ratios were measured using Cr reduction in a continuous flow system (Reference Morrison, Brockwell, Merren, Fourel and PhilipsMorrison and others, 2001). Data are reported in standard delta (δ) notation vs Standard Mean Ocean Water (SMOW). The analytical precision for measurements of oxygen and deuterium isotope ratio was ±0.05% and ±0.5% respectively. Analytic uncertainty in d-excess was estimated at
which is mainly dependent on the analytical precision of deuterium. The technique of snow/firn-core stable-isotope analysis has been described by Reference Kreutz, Aizen, Cecil and WakeKreutz and others (2001).
The concentration of sulfate was measured at NIPR by ion chromatography (Dionex 500 using AS14 separation column and conductivity detection). To examine the temporal modes of variation in the stable-isotope records obtained from the snow/firn core, regression, spectral and K-mean clustering analyses (SYSTAT version 9 (SPSS Inc.)) were used.
5. Results
5.1. Establishing a depth–age relationship
No significant post-depositional effects were apparent in the oxygen and hydrogen records from the firn core, as the amplitude of the signal near the bottom of the core was similar to that observed near the surface (Fig. 5a and b). To determine annual snow accumulation layers, we used stable-isotope records with existing, well-preserved seasonal δ18O and δD signals (Fig. 5a and b), visible seasonal accumulation evidence in snow/firn stratigraphy (Fig. 6) and annual precipitation data from Akkem station (Fig. 5f and g). Identification of annual accumulation layers in the snow/firn core was based on the extreme values of δ18O and δD, as minimum winter and maximum summer air temperatures are a distinctive characteristic of the Altai meteorological regime (Fig. 4a). In cases of double isotopic peaks during the warm seasons of 1984, 1985, 1994, 1996 and 1998 (Fig. 5a and b), visible seasonal accumulation evidence in snow/firn stratigraphy (Fig. 6) was used as the basis of dating, with corresponding annual accumulation compared to annual precipitation data from Akkem station for these years.
Snow and firn–ice densities (Fig. 5d) were used to establish cumulative depth/water-equivalent profiles (Fig. 5e). The correlation between annual accumulation layers in the snow/firn core and precipitation at Akkem station reached 0.82 (Fig. 5f and g). The mean annual accumulation rate calculated at the drill site was 690mmw.e. a–1 from summer 1984 to summer 2001; this agrees with the calculated accumulation rates presented in the World Atlas of Snow and Ice Resources (Reference KotlyakovKotlyakov, 1997) and with the rate of annual net accumulation obtained and validated through tritium and 210Pb records by Reference OlivierOlivier and others (2003).
To verify the core chronology, we used the marker horizon of the Pinatubo (Philippines) volcanic eruption of June 1991 (Reference Soden, Wetherald, Stenchikov and RobockSoden and others, 2002). The ice layers of volcanic origin have been deduced from acidity measurements (mainly H2SO4) along firn/ice cores (Reference Zielinski, Mayewski, Meeker, Whitlow and TwicklerZielinski and others, 1996; Reference ClausenClausen and others, 1997; Reference Schwander, Jouzel, Hammer, Petit, Udisti and WolffSchwander and others, 2001; Reference De Angelis, Simoes, Bonnaveira, Taupin and DelmasDe Angelis and others, 2003). The sulfate profile of the firn core reported in Figure 5c indicated two spikes in the SO4 2– outside the regular seasonal variations. The strong peak of 50.88 µEL–1 measured at 14.01m corresponds to summer 1991 (Figs 5c and 6), documenting the Pinatubo eruption. The second sulfate peak at 5.8–6.0m is associated with the large forest fire that occurred in Siberia in 1998.
In addition, to validate the 17 annual accumulation layers identified in the snow/firn core, we used single series Fourier analysis, which reveals major physical processes causing periodic rhythms in the δ18O and δD ratios (e.g. regular annual cycles) (Table 2). The confidence interval for standardized spectral density of the white noise was determined according to the Kolmogorov–Smirnov criterion. The largest values of the δ18O periodogram relate to the high-frequency part of the spectra. The maximum variance in the δ18O and δD is explained by variations with a period of 30.8 in the 524 records (where 524 is the number of snow/firn-core samples from the west Belukha plateau). The period of 30.8 is associated with 17 regular annual cycles (i.e. 524/30.8 = 17) in air temperature during precipitation. These cycles correspond to 17 annual accumulation layers (1984–2001) identified both in stable- isotope ratios and in the snow/firn stratigraphy (Figs 5 and 6).
Largest periodogram values of δ18O and δD records in 524 snow/firn-core samples from the west Belukha plateau
5.2. Seasonal/monthly snow accumulation
To verify the correlation between snow accumulation on the Belukha plateau (Acds) and precipitation at Akkem station (Ғ∂kkem) obtained through ice-core annual records, measurements of snow surface level at the drill site were used at daily and event scale (Fig. 8). The F test demonstrated a statistically significant correlation of r = 0.72 and 0.89 (under n-2 = 31 and 18, at p = 0.90) between daily/event precipitation at Akkem station and daily/event snow accumulation at the drill site (Fig. 9). Two months of automatic daily measurements of the snow surface level did not allow development of a snow accumulation/precipitation relationship at a monthly scale. The relative value of standard error (STE in %) of regression increases with decreasing duration of averaging: STE(year) = 104 mm (i.e. 14% of 690 mm average), STE(event) = 7.5 mm (i.e. 25% of 29.4 mm event mean) and STE(day) = 4.5 mm (i.e. 37% of 12.6 mm daily mean). Therefore, STE(season/month) should be less than 25% (STE(event)) and more than 14% (STE(year)).
(a, b) Relationships between precipitation at Akkem station (P Akkem) and automatically measured daily accumulation (snow water equivalent; SWEds) at the drill site, and between monthly precipitation at Akkem station (P Akkem) and monthly snow accumulation (Acds) data obtained from ice-core records through normalization technique.

Significant correlation (Acds/PAkkem) validated application of the normalization technique (Reference Barlow, White, Barry, Rogers and GrootesBarlow and others, 1993; Reference Shuman, Alley, Anandakrishnan, White, Grootes and StearnsShuman and others, 1995; Reference Yao, Masson, Jouzel, Stiévenard, Sun and JiaoYao and others, 1999; Reference Aizen, Aizen, Melack, Kreutz and CecilAizen and others, 2004) to develop the seasonal/monthly/event snow accumulation (Ac(s/m/e)ds) from snow/ice records. Annual accumulation (Ac(y)) at the drill site was normalized by the share/fraction (k) of monthly/seasonal/event precipitation in annual total (P(y)Akkem) at Akkem station (Equation (2)) (Table 3).
where i is the seasonal/monthly/event period (e.g. January, February ... December), Ac(i)ds is the snow accumulation for the ‘i’ period of time, and k = P Akkem(i)/P(y)Akkem.
Monthly snow accumulation values for 2000 calculated by the normalization technique agreed with corresponding values calculated using the linear relationship of event snow surface/precipitation data (Fig. 9) and verified the developed evaluation of seasonal/monthly/event accumulation (Table 3).
Calculation of monthly accumulation by normalization technique (Acds) from ice-core records and by developed equation (Fig. 9) based on snow accumulation measurements (SWEds) at the drill site

Furthermore, calculated seasonal snow accumulation values were verified using the snow/firn stratigraphic profile (Fig. 6), where winter layers could be differentiated from others by their homogeneous bright-white crystal structure. In the spring layers, there are signs of 1–2mm slender radiation crusts, while summer layers have ice lenses up to 8 mm thick. The autumn layers could be identified by more compact firn and yellow-brown aeolian particles. Uncertainty in calculating seasonal accumulation using the normalization technique was less than ±10% of the seasonal accumulation rate obtained from the snow/firn- core stratigraphic profile. Snow/firn stratigraphic profiles (Fig. 6) allowed partitioning of the firn-core layers with a seasonal resolution, while monthly precipitation data from the Akkem and Kara-Turek meteorological stations enabled profiling of the firn-core records, with monthly/event resolution for the spring, summer and autumn seasons. For example, the sulfate peak measured at 14.01 m is related to the firn-core layer of May–June 1991, corresponding to the Pinatubo eruption (in June). The thin winter layers were considered as the sum of accumulation over 3 months.
The corresponding annual seasonal/monthly δ18O and δD compositions were averaged as arithmetic means of every 3–5 cm of measured stable-isotope ratios in each seasonal accumulation layer of the snow/firn core. Reference Barlow, White, Barry, Rogers and GrootesBarlow and others (1993), Reference Shuman, Alley, Anandakrishnan, White, Grootes and StearnsShuman and others (1995), Reference Yao, Masson, Jouzel, Stiévenard, Sun and JiaoYao and others (1999) and Reference Aizen, Aizen, Melack, Kreutz and CecilAizen and others (2004) have used the same approaches to evaluate seasonal accumulation in snow/firn/ice cores.
5.3. Stable isotopes from firn core and snow pits
The mean δ18O and δD isotope ratios from the Altai core, –13.6‰ and –98.14‰ respectively, are in accordance with other stable-isotope records obtained from central Asia and Siberia (Table 1). The concordance is related to the mean annual isotopic composition of precipitation from the Omsk and Eniseisk stations in southwest and southeast Siberia. However, seasonal means and deuterium excess from the station precipitation differ from the firn-core records.
The higher average annual as well as cold-season air temperatures at the Altai drill site correspond to higher mean annual and cold-season oxygen isotope ratios showing slightly less depletion of the heavy isotopes than measured in the Inilchek glacier core, in the Tien Shan (Table 1). The higher minimum δ18O values in the Altai snow/firn core than from the Tien Shan winter records are caused by shorter trajectories of air masses bringing moisture to the Altai glaciers from the same moisture source, demonstrating the continental effect depleting the meteoric water moving farther from the source of water vapor (Reference DansgaardDansgaard, 1964; Reference Friedman, Redfield, Shoen and HarrisFriedman and others, 1964). During the cold season, the air- mass influxes move over the Eurasian continent, eastward along the main route: from the high latitudes of Iceland to western Siberia and then to central Asia (Reference Glukh and KononovaGlukh and Kononova, 1982). Furthermore, proportionally less cold- season, i.e. October–April, precipitation amounts at the Altai drill site compared to the Tien Shan result in a higher mean isotope ratio in the Belukha plateau firn-core records (Table 4). For example, 17% of cold-season precipitation at the Altai drill site, with –15.3‰ of δ18O mean during the cold season, resulted in a 1.7‰ depletion of the annual mean level, while 28% of cold-season precipitation at the Tien Shan, with –21.78‰ of δ18O mean, resulted in a 5.74‰ depletion of the annual mean level.
Clustered average/extreme δ18O and d-excess values from accumulation layers formed by precipitation originating from central Asian (CA) and oceanic moisture sources, their share (%) in the total annual and seasonal accumulation layers and uncertainty (%) of clustering

Mean δ18O isotope values of the annual records show similar averages throughout the period 1984–2001, varying from –15.5‰ to –12.3‰. The distribution in δ18O and δD records from the Altai snow/firn core shows well-preserved seasonal variations (Fig. 5) and is significantly controlled by temperature (Table 1), by share of cold/warm-season precipitation amount and by precipitation origin (Appendix; Fig. 10). The share of cold/warm season, i.e. October–April precipitation/May–September precipitation, was determined as the fraction of monthly total precipitation amount (Fig. 4a) in the annual total. Mean monthly oxygen isotope ratios from the Altai snow/firn core reflected a typical continental climate with an overall range between absolute maximum and minimum values of 16.6‰, corresponding to the amplitude of maximum and minimum air temperatures observed from 1984 to 2001 (ΔT = 31 °C) (Table 1).
(a–c) Monthly means of δ18O averaged from Altai snow/firn-core records and air temperature at the drill site (a) and d-excess (b), and precipitation amount at Akkem station (c). (d) Monthly means of δ18O and d-excess records obtained from snow pit, 2000/01, and number of days with synoptic patterns, n, that brought precipitation to the Altai. (e) Mean monthly air temperature at the drill site and snow accumulation measured from snow pit, 2000/01.
The highest monthly mean δ18O values of –13.4‰ are related to the warm-season accumulation layers, with mean air temperatures of –1.8°C (Table 1). Cold season minimum mean δ18O values of –15.3‰ were associated mainly with minimum mean air temperatures of –14.8°C. The highest variability in seasonal δ18O and δD was observed in the cold-season firn layers, whereas the most variable season for air temperatures is from the end of autumn to the beginning of spring (Fig. 4a and b).
5.4. Relationship between stable hydrogen- and oxygen-isotope ratios
The slope and intercept in the covariance between the stable hydrogen and oxygen isotopic concentration found in most meteoric water and defined by Reference CraigCraig (1961) as the global meteoric water line (GMWL) are useful in understanding the systematics of isotopic fractionation (Reference Kendall and McDonnellKendall and McDonnell, 1998). The slope of the GMWL, 8, is related to the ratios of fractionation factors, when the minor dissimilarity is caused by a kinetic fractionation effect during evaporation. The intercept of the GMWL, 10, is termed the deuterium excess (d-excess), a concept introduced by Reference DansgaardDansgaard (1964), i.e. d-excess (‰) = δD–8δ18O. Deuterium excess is a parameter reflecting re-evaporation at land surfaces and/or mixing along air-mass trajectories. A smaller or larger intercept in the local relationship, from the snow/firn core, fresh snow, snow pit and precipitation, compared with the GMWL (Fig. 11a) reflects different kinetic evaporation effects on the transferred water vapor (e.g. initial water vapor was more quickly or slowly evaporated under non-equilibrium conditions (Reference Kendall and McDonnellKendall and McDonnell, 1998)). The amount of d-excess is dependent on sea surface temperatures during evaporation, as well as other physical conditions including fractioning of isotopes during ice crystal formation in clouds, re-evaporation/sublimation of snow below clouds in unsaturated air, and post-depositional modification of the isotope signal, for example by melting, evaporation, sublimation and wind erosion (Reference Merlivat and JouzelMerlivat and Jouzel, 1979; Reference Jouzel and MerlivatJouzel and Merlivat, 1984; Reference Ciais and JouzelCiais and Jouzel, 1994).
(a) Annual and seasonal deuterium (δD) and oxygen (δ18O) isotope relationship (Altai MWL) in snow pit, fresh snow, precipitation and snow/firn core on the west Belukha plateau, 2001. (b) Distribution of d-excess and δ18O and ten-sample averages from Altai 2001 snow/firn core.

The δ18O–δD relationship in the precipitation, snow pits and snow/firn core from the Belukha plateau (Fig. 11a) has a similar slope to the covariance (i.e. 8) as that of the GMWL, indicating the same initial relationship of fractionation factors, and points to the absence of strong melt and percolation in the snow/firn core. The slopes did not approach typical sublimation/evaporation line slopes of about 5 (Reference Clark and FritzClark and Fritz, 1997).
The spatial distribution of the long-term annual averages of d-excess in snow/firn-core records and precipitation is characterized by a significant spread, ranging from 23‰ for the Tien Shan firn-core records to 4.1 ‰ from precipitation at Irkutsk station in eastern Siberia (Table 1). Another eastern Siberian station, Eniseisk, also demonstrated a relatively low d-excess value of 7.9%. At the western Siberian stations, Omsk and Novosibirsk, long-term annual averages of d-excess gradually increase to 8.9‰ and 12.8‰ respectively.
The average d-excess of snow/firn-core records varies around 10.9‰, similar to the intercept of the GMWL. There is a correlation between the two isotope parameters (r2 = 0.93) and close accordance between the Altai meteoric water line (MWL) and GMWL (Fig. 11a). The d-excess variability is preserved throughout the core record, ranging from 1.8‰ to 29.7‰. The d-excess values vary from 8‰ to 14‰ in >50% of snow/firn-core records (Fig. 12).
Probability distribution of d-excess values (F in %) in snow/firn-core records from precipitation originating over different moisture sources.

Along with the significant influence of snow formation temperature on d-excess, we assume that in the alpine areas of central Asia the large (up to 18‰ in 1994/95; Figs 4b and 10b and d) seasonal fluctuations in Altai d-excess values (Reference Hoffmann, Werner and HeimannHoffmann and others, 1998; Reference Holdsworth and KrouseHoldsworth and Krouse, 2002; Reference Kreutz, Wake, Aizen, Cecil and SynalKreutz and others, 2003) are explained by regional-scale hydrological processes such as source, transport and recycling of atmospheric moisture. Low air temperatures during cold dry seasons and high humidity during warm seasons, when the main precipitation occurs (83% (Fig. 4a; Table 1)), reduces the effect of partial re-evaporation of snowflakes below clouds and of sublimation from snow surfaces on the firn-core records. Post-depositional effects of melt/refreezing and evaporation/sublimation from the surface on the west Belukha plateau are negligible because positive temperatures were never observed at the drill site which is located in the cold recrystallization zone (Fig. 3a and b).
The long-term monthly means of d-excess show well- defined and systematic seasonal variations (Figs 4b and 10d), with a mean maximum in February/January and a minimum in August/July. A firn/ice core drilled in the Tien Shan (Reference Kreutz, Wake, Aizen, Cecil and SynalKreutz and others, 2003) exhibits seasonal d-excess and δ18O variability similar to that in the Altai, i. e. lowest d-excess and highest δ18O values correspond to the summer season with maximum precipitation and air temperatures. On the other hand, a firn core from Tsast Ula ice cap, Mongolia, displays inverted seasonal levels of d-excess and δ18O (Reference Schotterer, Fröhlich, Gäggeler, Sandjordj and StichlerSchotterer and others, 1996).
From May to January, the long-term monthly means of d-excess are almost constant, 9.5–11.2‰ (Fig. 4b), with about the same intercept as for the GMWL. From February to April, d-excess increased and reflects the modification of air masses during passage over relatively warm continental waters (Reference Gat and DansgaardGat and Dansgaard, 1972; Reference Gat, Carmi, Solomon, Beran and HoggGat and Carmi, 1987).
Compared to the Northern Hemisphere stations, where the average d-excess values reach a maximum in December/January and a minimum in June/July (Reference Froehlich, Gibson and AggarwalFroehlich and others, 2002), Altai snow/firn-core records show a delay of about 1 month (Fig. 4b). This insignificant asymmetry probably reflects the interior and elevated location of the Altai drill site, and complexly originated precipitation inputs to the west Belukha accumulation areas. The long-term mean extremes in the seasonal variation of d-excess values from the Altai snow/firn-core record range from 15.5‰ to 9.5‰ (Fig. 4b), insignificantly higher than corresponding values from Northern Hemisphere stations, which varied from 12.1 ‰ to 7.7‰ (Reference Froehlich, Gibson and AggarwalFroehlich and others, 2002). Low snow- formation temperatures partially caused increasing d-excess values in the firn-core records (Reference Ciais, White, Jouzel and PetitCiais and others, 1995).
At the end of winter/beginning of spring, warming occurs faster in the inner-continental regions than in the coastal regions, increasing inland evaporation. Low-humidity conditions in the cold-season continental air masses cause rapid evaporation, and hence high d-excess values in subsequent precipitation. Long-range transport of air masses from the eastern Black Sea, Caspian and Aral Seas causes conditions favorable to rapid evaporation and the formation of high d-excess values in the insignificant precipitation that accumulates on the Altai glaciers during these months (Fig. 4a and b).
During the warm season, moisture is brought by western and northwestern air masses formed under relatively high air temperatures and humidity conditions that are associated with low d-excess values.
5.5. Synoptic patterns and precipitation origin
To identify the origin and trajectories of moisture, the mean seasonal amount of precipitation, δ18O isotopic content and d-excess values in the snow firn-core records were compared with the monthly frequency of synoptic patterns using correlation analysis.
The main synoptic pattern that brings moisture to the Siberian Altai during the year is the western cyclones (WCa,b) and western anticyclones (WAa) (Appendix), which have a high correlation with monthly precipitation amount (Table 5) and a significant number of events (Fig. 4c–e). The frequency of WCb and WAc is positively associated with δ18O isotopic content in related firn-core accumulation layers.
Correlation (at 10%) between seasonal frequency of synoptic patterns (SP) observed over western Siberia and the amount of precipitation at Akkem station (PAkkє m) based on data for 1954–2001; annual association (at 20%) between monthly mean SP and monthly mean of δ18O concentration and d-excess in snow/firn core obtained from the west Belukha plateau

Air masses originating over the Arctic Ocean bring precipitation to the Siberian Altai by northwestern cyclones (NWC) in spring, by ultra-polar influxes (UP) in autumn, and partially by WAc in the summer. Strong depletion in δ18O and in d-excess records associated with these synoptic patterns (Table 5) points to the rain-out effect of water vapor (Rayleigh distillation model) and is in agreement with results presented by Reference Froehlich, Gibson and AggarwalFroehlich and others (2002). Mixing with water vapor evaporated from more northern oceanic areas may account for the observed slight depletion of d-excess values.
Summer precipitation is significantly associated with the frequency of stationary cyclones (Table 5), which increase the level of δ18O enrichment and d-excess depletion in firn- core accumulation layers. Stationary cyclones bring precipitation to the Altai that originates from the Pacific Ocean. This result is in agreement with estimations based on aerological observations (Reference KuznezovaKuznezova, 1984) that the mean summer horizontal moisture transport over the Altai has a strong eastern component.
There is a positive correlation between the frequency of southwestern cyclones and spring/winter amount of precipitation and d-excess values. These results are in agreement with the nature of the synoptic processes (see Appendix). Moisture in the southwestern cyclones originates over the eastern Black Sea, the Caspian and Aral Seas and is transferred to the Altai at low altitudes and from low latitudes, precipitating with exceptionally high d-excess values. According to Reference Froehlich, Gibson and AggarwalFroehlich and others (2002), exceptionally high d-excess values were recorded at stations receiving precipitation from the eastern Mediterranean Sea. A negative correlation coefficient between the southwestern-cyclone frequency pattern and δ18O is a result of reevaporating water vapor from the southern internal moisture sources in winter, which moves northward over the cold Asian continent, mixing with cool air masses, and accounts for strong δ18O depletion.
6. Discussion
6.1. Clustering precipitation transferred from external (oceanic) and internal (continental) moisture sources
Stable-isotope distribution in the snow/firn core (see section 5.4) and the synoptic regime (see section 5.5), examined from the Siberian Altai, shows evidence of multiple moisture sources. In order to distinguish the sources of precipitated moisture, the K-means clustering and regression analyses were applied.
6.1.1. K-means clustering analysis
To distinguish oceanic moisture from water vapor evaporated from internal drainage basins and transferred to the high/middle latitudes of Asia, the δ18O isotopic ratio and d-excess values from the Altai snow/firn core were clustered into two distinct datasets. The clustering procedure was based on the K-means clustering analysis method of splitting a dataset into two groups by maximizing between-cluster variation relative to within-cluster variation. The first cluster is typified by the more depleted δ18O values (down to –24.7‰) and d-excess values higher than 12‰, with an average value of 14.7‰ and maxima reaching 25.6‰ (Table 4). The d-excess values in the other cluster are lower than 12‰, with an average value of 8.1‰ and an absolute minimum of 1.1‰. The δ18O mean and maximum values are slightly more enriched than in records related to the first clusters.
6.1.2. Calibration of precipitation events
To evaluate the link between stable-isotope concentrations in the firn-core profile and atmospheric circulation dynamics, we matched the measured δ18O concentration and d-excess values in snow-pit layers to corresponding precipitation events observed at the Akkem meteorological station from July 2001 to July 2000. These snow accumulation event values were calculated using a normalization technique (Equation (2)) which was verified through the linear relationship obtained from snow accumulation measurements (Equation (1)) (see Fig. 9). The δ18O concentration and d-excess mean in snow layers during precipitation events were related to the synoptic patterns (see Appendix) of associated precipitation (Fig. 13). Analysis of synoptic processes prevailing during precipitation events over western Siberia and the Altai is in accordance with results from the K-means clustering with ±7.4% or about 15% of deviation (i.e. amount of accumulation, 929 mm, in total accumulation, 12 591 mm, where the stable-isotope distribution was not in accordance with developed clustering). Greater uncertainty occurred during winter months, when several insignificant precipitation events with both internal and external moisture sources were associated with the same snow accumulation layer (Table 4).
(a) Verification of d-excess and δ18O clustering at the event timescale through precipitation occurring during the observed synoptic pattern at the meteorological station. (b, c) Corresponding snow-pit isotope records.
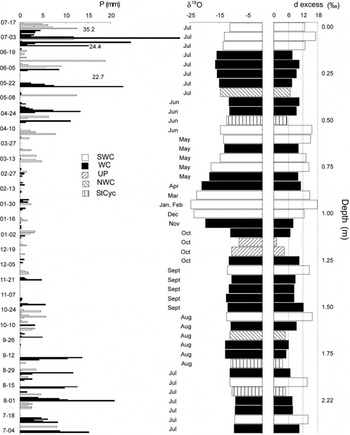
The records with the highest deuterium excess (d-excess ≥ 12‰) are associated with precipitation occurring during southwestern cyclones, bringing internal moisture. The records with the lowest deuterium excess (d-excess <12‰) are associated with synoptic processes bringing moisture that originates from external (oceanic) moisture sources. The snow/firn-core records with external moisture sources (d-excess <12‰) were further verified by examining the observed synoptic processes during precipitation events of 2000/01 (Fig. 13). Atlantic moisture sources are associated with slightly higher d-excess, ranging from 7.0‰ to 12‰. Moisture of Arctic and Pacific origin is associated with the lowest d-excess levels (<7.8‰) (Table 4).
6.1.3. Verification at a monthly average scale
6.1.3.1. Snow-pit records
Monthly average d-excess and δ18O values in snow-pit layers (Fig. 10d and e), together with the corresponding monthly frequency of synoptic patterns, verified the developed clustering of precipitation origin (Table 4):
-
1. Southwestern cyclones were the prevailing synoptic pattern from January to March 2001, when d-excess was higher at 12‰ and continental, low-humidity air masses brought insignificant amounts of recycled precipitation, with depleted δ18O values, to the Altai from internal moisture sources. In the cold season of 2001, southwestern cyclones caused a growth of monthly d-excess means that reached 16‰ (Fig. 10d).
-
2. Annual monthly frequency of ultra-polar influxes reached a maximum (up to 6 days) in October, resulting in depleted d-excess monthly values (down to 5‰) despite an intensive development of western cyclones. Ultra-polar influxes are associated with Arctic or North Atlantic Ocean moisture origin.
-
3. In July 2000, intensive development of stationary cyclones (up to 5 days) brought moisture from the east, causing depletion in d-excess values (down to 5‰).
-
4. Monthly d-excess means ranged from 7‰ to 12‰ during the remaining months, with the main precipitation associated with western cyclones bringing moisture from the Atlantic Ocean.
6.1.3.2. Snow/firn-core records
The monthly δ18O and d-excess means from firn-core records were compared to the instrumental air-temperature and precipitation monthly means at the drill site (Fig. 10a–c). Observed interannual δ18O fluctuations that cannot be accounted for by air-temperature fluctuations were explained by increased monthly frequency of synoptic patterns. For example, an abnormally enriched δ18O mean of –10‰ from the accumulation layer of May 1998 (falling above the long-term May average of –13‰; Fig. 4b) coincides with an abnormally depleted d-excess monthly mean of 6.9‰ (falling above the long-term average of 11 ‰) and is inconsistent with the May mean air temperature (Fig. 10a). Abnormally frequent development of stationary-cyclone synoptic patterns, which brought moisture from the east (e.g. Pacific Ocean), were observed at the end of spring, reaching 6 days in May (falling above the long-term average of 0.4 days in May (Fig. 4e)) and caused a disparity between the monthly levels of δ18O and air temperature. The uncertainty in developed clustering, which was validated by analyzing deviations in monthly means of δ18O, d-excess, air temperature, precipitation and synoptic pattern frequency (Fig. 10a–c), was at ±4% (Atlantic cluster in summer and autumn), reaching ±21% during the winter months.
6.2. Contribution of precipitation transferred from external and internal moisture sources to Altai accumulation
Total snow/firn accumulation in the Altai core from June 1984 to July 2001 amounted to 12 591 mmw.e. Of this total, 67% corresponds to precipitation transferred by western, northwestern and stationary cyclones, western anticyclones, and ultra-polar intrusions from oceanic moisture sources (Table 4). Precipitation over the Siberian Altai is mainly marine in origin during all seasons, with the oceanic share quite steady, ranging from 76% in winter to 60% in autumn accumulation. Moisture associated with synoptic patterns corresponding to water vapor evaporated over the Atlantic Ocean comprises 56% of annual accumulation. Precipitation transferred from an external moisture source, with the lowest d-excess levels, comprises on average 11% of annual accumulation, with an autumn maximum (up to 24%) and a summer minimum (8%) (Table 4).
The remaining 34% of annual precipitation is transferred by southwest cyclones from internal moisture sources, with the largest share, 40%, occurring in autumn (Table 4). The smallest share of recycled precipitation (24%) transferred from internal moisture sources to the Altai glaciers was observed in winter, when the Siberian high is strongest over northern and central Asia, blocking the intrusion of air masses, and conditions for inland evaporation and local convection are weakest because of low continental heating.
Summer is the main season for accumulation, from both external and internal moisture sources (Fig. 14). There are no records with low d-excess values (Arctic Ocean) in accumulation layers related to winter months, while Atlantic moisture as well as recycled moisture over central Asia was brought to the Siberian Altai year-round. From autumn to spring, δ18O records associated with inter-land moisture sources are more depleted than δ18O records related to Atlantic moisture sources (Fig. 14) because of lower air temperatures over the continent than over the ocean. Summer mean isotope records are almost the same. The mean values of δ18O from summer accumulation layers, with Arctic/Pacific precipitation sources, are the most enriched of the three clusters considered, reaching –11.7‰. The highest δ18O values may be associated with the highest air temperature during precipitation and/or nearby water-vapor formation (e.g. Arctic/Pacific Ocean or local summer convection).
Annual and seasonal contributions to accumulation of precipitation originating from external and internal moisture sources: percentage of average oxygen, deuterium and deuterium excess.

7. Conclusion
The west Belukha snow/firn plateau is in the cold recrystallization zone where positive temperatures were never observed at the drill site. The post-depositional effect of melt/refreezing and evaporation/sublimation from the surface on the west Belukha plateau is negligible, and we found no sign of water percolation.
A clear seasonal signal in δ18O and δD isotopes was the basis for identification of annual accumulation layers, along with stratigraphic analysis. Validation of the dating through the marker horizon of the Pinatubo volcanic eruption showed monthly correspondence. The mean accumulation rate of 690 mm w.e. a–1 agrees with the annual accumulation rate validated through tritium and 210Pb records by Reference OlivierOlivier and others (2003) and snow accumulation measured by snow stakes during 3 years.
The distribution of isotope records and d-excess values shows well-preserved seasonal variations, which are significantly controlled by temperature, cold- or warm-season precipitation amount, and precipitation origin.
The δ18O–δD relationship in the Altai snow/firn-core records has the same slope to the covariance as that of the GMWL, indicating the same initial relationship of fractionation factors, and points to the absence of melt/percolation in the firn core. The average d-excess of firn-core records varies around 10.9‰, about the same as the intercept in the covariance of the GMWL.
The technique of coupling synoptic climatology and meteorological data with δ18O and d-excess firn-core records was developed to determine climate-related signals and to identify the origin of moisture. The firn-core records were calibrated at event-scale level and validated using the monthly meteorological data.
Clustering analysis of 17 year snow/firn-core isotope records and examination of synoptic atmospheric patterns show that two-thirds of the annual accumulation is formed from oceanic precipitation; the rest of the precipitation is recycled over Aral–Caspian sources. More than half of the accumulation has an Atlantic Ocean origin, and precipitation from the Arctic and Pacific Oceans contributes on average 11% to the annual accumulation.
On an annual basis, the main synoptic pattern that brings moisture to the Siberian Altai is the western cyclones, and the western cyclone frequency is positively associated with δ18O isotopic content. Deuterium excess values in related firn-core accumulation layers ranged from 7%o to 12%o. Strong depletion in δ18O and in d-excess records is associated with synoptic patterns of northwestern and ultra-polar cyclones that bring moisture from Arctic oceanic areas, and contributed similar accumulation to the spring, summer and autumn seasonal layers. Increased development of stationary cyclones is associated with δ18O enrichment and d-excess depletion in firn-core accumulation layers. Stationary cyclones bring eastern- originated precipitation from the Pacific Ocean to the Altai glaciers.
The interior moisture sources contributed the remaining 33% of annual precipitation. These data are in reasonable agreement with recent findings by Reference Kurita, Yoshida, Inoue and ChayanovaKurita and others (2004) that more than half of the summer moisture forming the precipitation in Siberian plain stations originates from land surfaces. High d-excess values (up to 25.6‰) are associated with precipitation carried by southwestern cyclones and are a result of re-evaporating water vapor from internal moisture sources (e.g. Caspian and Aral Seas) with observed low air humidity. Their movement northward over the cold Asian continent and mixing with cool air masses resulted in strong δ18O depletion.
The technique developed here will be used for climatic and environmental reconstruction of snow accumulation, moisture origin and atmospheric circulation in north-central Asia over recent centuries, from oxygen isotope and deuterium records recovered from a 176m surface-to- bottom ice core obtained in 2003 from the Belukha snow/firn plateau.
Acknowledgements
This research was supported by the US Department of Energy (DE-A107) and the Research Institute for Humanity and Nature, Kyoto, Japan. The authors thank T. Prokopinskaya for her inestimable contribution in organizing our expeditions. We also thank all the members of our expeditions: A. Lushnikov, A. Chebotarev, A. Surazakov, S. Polesskiy, M. Yoshihiro and M. Kenichiro, and V. Yakubovskiy and V. Podoprigora, the chief pilots of Russian helicopter MI-MTV from Altai Regional Rescue Department. For valuable comments and corrections we thank C.S.L. Ommanney, V. Masson-Delmotte, D. Peel, B.M. Vinther, D.R. Joswiak and an anonymous reviewer.
Appendix
Synoptic processes observed over western Siberia (WS) (Reference PopovaPopova, 1972; Reference Narojniy, Narojnaya and PopovaNarojniy and others 1993)


