


Part I of the book laid the foundation for understanding how globalization affects democratic representation. Armed with information about the mechanics of promissory representation and the ways in which globalization constrains national policymaking, we now shift the focus to the ways in which globalization affects the ability of governing parties to keep their campaign promises and how voters respond to the effects of these constraints.
We argue that globalization exerts its influence on promise keeping primarily through three of the four constraints discussed in the previous chapter: international legal obligations, market actors, and economic uncertainty.Footnote 1 These forces make it difficult for parties to implement their promised policies, particularly those that conflict with global market constraints. While right-leaning parties are better positioned to navigate these constraints due to their alignment with market-friendly policies, left-leaning parties face greater challenges as their agendas often involve regulation and welfare expansion that clash with global economic priorities. We also discuss a fourth constraint in the previous chapter in the form of citizens’ changing expectations of their governments. We argue that these changing expectations primarily affect the content of what (some) parties promise, particularly parties on the center-right. These expectations do not have as significant a bearing on promise keeping compared with the other three constraints, as discussed in this chapter.
We find support for this argument using evidence from comparative data on pledge fulfillment concerning over 7,000 election pledgesFootnote 2 of fifty-seven political parties that gained executive power across twelve countries. The main finding is that countries’ exposure to economic globalization reduces the likelihood that governing parties keep the election pledges they previously made. This effect is particularly marked for parties to the left of the left–right dimension. Another important finding relates to the difference between de jure and de facto globalization. De jure globalization refers to the extent to which national legal frameworks, including tariffs and regulations, are conducive to free trade, while de facto globalization refers to actual flows of goods, services, and finance. The evidence indicates that de facto globalization exerts a stronger negative impact on promise keeping due to the direct pressures it imposes on governments to align with market forces. The chapter also presents and discusses the finding that parties do not significantly adjust the number or types of promises they make in response to globalization. In other words, parties do not promise less when their countries are more exposed to globalization, in the knowledge that globalization’s constraints may prevent them from delivering on those commitments. Instead, partisan ideology remains the dominant factor in shaping pledge-making behavior, with left-wing parties more likely to make expansionary promises and right-wing parties focusing on cuts.
How Globalization Constraints Lead to Broken Promises
There are two very general reasons why we believe politicians make promises they cannot keep due to the constraints of globalization. The first is unintentional; parties have imperfect information on the precise implications of globalization constraints for the feasibility of their election pledges and therefore make promises that they find impossible to keep. This argument aligns with realistic models of economic policymaking that recognize that policymakers have imperfect information regarding economic business cycles (Dubois Reference Dubois2016; Sargent and Wallace Reference Sargent and Wallace1975). Similarly, parties are often simply unable to anticipate the full consequences of globalization constraints when they formulate their campaign promises. This is apparent when we consider the ways in which parties typically formulate their election programs, which contain their most considered and definitive campaign commitments (see Naurin, Royed, and Thomson Reference Naurin, Royed and Thomson2019 for a review). Parties take different approaches to formulating their programs; some are drafted by party elites and presented to party conferences as fait accompli, while others involve more active participation from grassroots party activists and even ordinary members. Notwithstanding these important differences in processes, few party elites or activists have deep insights into the complexities of international law, the realities of the influence of market actors, or the vicissitudes of economic uncertainties.
The second reason is intentional. Parties face trade-offs between the benefits of making clear and ambitious promises and the costs of not being able to keep those promises. On the one hand, parties gain votes from making clear promises in line with their supporters’ policy preferences. If they are incumbents, they may gain additional votes from fulfilling their previous promises. On the other hand, they bear costs in the form of lost votes when they compete in an election as an incumbent governing party with a record of breaking the promises they made during the previous election campaign. These costs in the form of lost votes are called retrospective sanctions by voters. Theoretically, parties could avoid retrospective sanctions by making no substantive promises whatsoever or only promises that they were certain they could keep when in government, but such vacuous and unambitious election programs would not appeal to many voters. Moreover, crafty politicians may reckon on voters having imperfect information about both promise breaking and the complex constraints of globalization, which might take the edge off electoral punishment for broken promises. This second reason implies that globalization leads to broken promises because parties knowingly decide not to anticipate the effects of globalization on broken promises.
International Legal Constraints on the Fulfillment of Campaign Promises
If international laws are indeed a constraint that leads to broken promises, we would expect to see a range of things happening, not necessarily in every case of promise breaking, but with some regularity. The starkest manifestation of this effect would be the initiation of legal proceedings against governments for breaching international laws when they attempt to fulfill their campaign promise. These may take the form of individuals or corporate actors initiating proceedings in domestic or international courts that invoke the national government’s international legal obligations. There are many cases in which governments have attempted to formulate popular policies, for instance in relation to the health concerns induced by smoking and climate change, only to be legally challenged by firms claiming that those policies violate international investment commitments these governments made (Berge and Berger Reference Berge and Berger2021; Foster Reference Foster2021; Moehlecke Reference Moehlecke2019). In some cases, informal legal proceedings may be sufficient to stop governments from pursuing a policy that contravenes its international commitments. In more than half of United Nations General Agreement on Tariffs and Trade/WTO cases a formal panel is never established, but cases are resolved through an informal process where states receive clarity about whether and how their policies comply with international law and then act upon this new information (Busch and Reinhardt Reference Busch and Reinhardt2000).
In addition, we would expect to observe that international legal obligations feature prominently in political discourse if they are indeed a constraint on promise keeping. Governing politicians who made promises they find unable to keep may refer to international law as an unwelcome “excuse” for promise breaking. In some cases, the promise makers demonize international actors as standing in the way of the will of the people. Such rhetoric is not uncommon in national policy debates of European Union (EU) member states, in which Brussels bureaucrats and EU laws are questionably portrayed as undemocratic (De Vries, Hobolt, and Walter Reference De Vries, Hobolt and Walter2021; Hobolt and De Vries Reference Hobolt and De Vries2016; Hobolt and Tilley Reference Hobolt and Tilley2014; Schlipphak and Treib Reference Schlipphak and Treib2017; Schneider Reference Schneider2019). This can include increased populist rhetoric, which characterizes international elites having undue influence over national governments to the detriment of citizens. Moreover, the promise-making politicians downplay the possibility that they could have anticipated these constraints at the time they made the promises. Instead, they highlight the fact that international laws are open to interpretation and that working through the legalities is a highly complex process. Governing parties may try to frame legal constraints not as a certainty, but as a negotiation with officious international institutions.
Other actors with interests in the relevant policy issues include opposition parties, national and international bureaucratic agencies, and market actors. These actors may voice more specific concerns about the extent to which campaign promises conform to international laws, typically in ways that are less politicized in the party-political sense. Opposition parties generally welcome governing parties’ failure to fulfill their campaign promises as a political opportunity. In addition to opposing the substance of what the governing parties are attempting to do, opposition parties criticize governing parties for failing to anticipate the legal constraints. In contrast to the promise-breaking governing parties, opposition parties contend that the international legal constraints were clear. This enables opponents to portray governing parties as incompetent. Opponents question the competence of a party that was apparently unable to formulate a realistic and implementable election program. Political opponents also use broken promises as opportunities to question the trustworthiness of governing parties and individual party leaders.
Inside national bureaucracies, government officials are charged with preparing policy and legislative proposals that fulfill governing parties’ campaign promises. At this stage, government officials who are generally more knowledgeable about the intricacies of international laws than politicians may raise concerns about the compatibility of campaign promises with the state’s international obligations. Government officials, certainly career officials rather than political appointees, may face a dilemma between assisting their democratically elected political masters to realize their policy intentions and ensuring that the government meets its international legal obligations. Furthermore, career civil servants are not entirely neutral public servants devoid of policy preferences of their own. Rather, they are highly skilled professionals who naturally develop opinions about which policies and practices work best as they accumulate extensive experience of the policy areas in which they work. In policy areas that involve international cooperation, national officials are members of policy communities that develop common ways of framing problems and formulating policies. These policy preferences are often aligned with existing policies, which are compatible with states’ international legal obligations. Therefore, government officials’ policy preferences can be an additional reason why governing parties find it impossible to keep campaign promises that challenge the state’s international legal obligations.
Market actors and international organizations may also voice concerns about campaign promises that appear to contravene states’ international legal obligations. We present the empowerment of market actors as a distinct constraint. That is indeed true, as market actors will use all means at their disposal, not only legal arguments and proceedings, in pursuit of their interests. In practice, the constraints of globalization may become intertwined. Like bureaucratic agencies and officials, market actors often have more technical expertise in relation to the relevant legal provisions than career politicians. Market actors are obviously also more specialized in the issues that concern their operations, while governing party elites must contend with the full breadth of issues on their governments’ agendas. This combination of specialist legal expertise and high levels of issue salience means that when market actors raise concerns about legal conformity of government proposals, they can do so with compelling force. Similarly, as international organizations are the guardians of the treaties and provisions that constitute those organizations, they are well placed to marshal legal arguments if their interests, which depend on states complying, are threatened. For EU member states, the European Commission keeps a close watch on national governments’ policy proposals with a view to ensuring compliance with EU laws.
On balance, international legal constraints are generally more significant constraints on campaign promises made by center-left parties than center-right parties. In relation to policy decisions concerning the extent of state intervention in the economy, the left generally favors more intervention than the right. For instance, in relation to employment rights, environmental protection standards, and product standards, center-left parties generally favor stronger regulation than center-right parties, which favor more market-led policies. Moreover, economic globalization has been associated with the prioritization of liberal market regimes, and these regimes have been embodied in the contents of trade agreements that states have signed up to. Consequently, when national policy proposals – such as those that follow from left-wing parties’ campaign promises – intend to introduce higher levels of regulation of markets, these can come into conflict with established international laws.
Although we expect international legal constraints to be more of a constraint on center-left than center-right parties, there are numerous exceptions to this general tendency. First, international legal constraints are not only regulatory ceilings above which states cannot introduce higher standards. They also include floors or minimum standards above which states commit themselves to remaining. Consequently, progressive left-wing initiatives to improve standards do not always meet with resistance from established international legal commitments. Likewise, market-motivated policy initiatives proposed by center-right parties to lower standards may not be compatible with international laws in some contexts. EU laws include minimum standards, for instance, to ensure that states do not engage in unfair competition with others. Second, center-right parties sometimes make proposals that are impossible to reconcile with international obligations that safeguard elements of free markets. For example, in the next chapter we discuss a famous campaign promise by the UK Conservative Party to cut net migration. When the party took office and attempted to fulfill this promise, it soon found that constraints of the United Kingdom’s legal commitment to freedom of movement of EU citizens was one of the key impediments to doing so. Third, there are many electorally salient policy areas in which international legal commitments do not pose significant constraints to governing parties delivering what they promised. For these reasons, while the negative effect of economic globalization on promise keeping may be greater for parties of the center-left than for parties of the center-right, we do not expect the difference to be very large.
Market Actors and the Fulfillment of Campaign Promises
The second constraint of globalization on promise keeping is the empowerment of market actors such as multinational corporations and national industries with significant interests in free flows of labor, capital, goods, and services. If this is indeed a significant constraint, we would expect to observe such actors being prominent opponents of some policy proposals that were inspired by parties’ campaign promises. As noted, market actors may make references to the state’s international legal commitments if these commitments strengthen their opposition to the government’s proposals. Beyond this, market actors argue that proposals are likely to undermine their competitiveness. This lack of competitiveness may, they argue, lead to declining turnover, profits, employment, and contributions to public finances in the form of taxes. Depending on the industry concerned, companies may threaten to relocate their economic activities overseas to countries with more favorable regulatory regimes. The credibility of such threats depends on the costs and feasibility of relocating. Market actors generally represent concentrated interests with highly specialized knowledge. These characteristics are conducive to lobbying styles that prioritize direct access to policymakers, as distinct from broad public lobbying campaigns that may be more suitable for actors that represent diffuse interests. To some extent, this may make it more difficult to observe lobbying by market actors directly. Nonetheless, market actors also lobby in public through such avenues as public statements and submissions to public consultations and legislative committee hearings.
As with international legal constraints, market actors are more of a constraint on the fulfillment of campaign promises made by parties on the center-left of the socioeconomic left–right dimension than by parties on the center-right. Center-right parties are generally more closely aligned with the interests of market actors than are parties of the left. When social democratic parties propose higher standards in terms of employment protections for workers, internationally oriented firms may claim that this undermines their competitive positions compared with firms in jurisdictions with lower standards. Center-right parties are usually less inclined to introduce such initiatives and therefore their policies are less likely to be opposed by market actors when they govern.
While the constraint of market actors weighs more heavily on center-left than center-right governing parties, there are several mitigating factors. One is that in some countries, market actors are broadly supportive of relatively high labor standards and social welfare protections that are typically supported by the center-left. According to the varieties of capitalism thesis, coordinated market systems such as Sweden, Denmark, and (arguably until recently) Germany, are known for market actors that broadly support high standards (Hall and Soskice Reference Hall and Soskice2001). These protections enable firms to mitigate the risks associated with high value-added products and services that require firms and workers to invest in skills that are transferable to a limited extent only when market conditions change. By contrast, economic elites in liberal market economies such as the United Kingdom and United States are generally less supportive of such policies. Another mitigating factor is that parties of the center-right often find it politically expedient to support policies that raise concerns among sections of the business community. Finally, at least in the short term, some social democratic parties have embraced liberalizing reforms to labor markets and welfare systems, such as the reforms introduced by Gerhard Schröder’s Social Democratic Party in Germany between 1998 and 2005. Consequently, while market actors are typically a more significant constraint on center-left governing parties, this effect may be muted in some contexts.
Uncertainty and the Fulfillment of Campaign Promises
Uncertainty is the third constraint of globalization that leads to broken campaign promises. In the last chapter we define uncertainty as the presence of unforeseeable and significant changes in conditions that are largely outside the control of national policymakers and that negatively affect the feasibility and desirability of policy options. Here, the passage of time between the points at which parties formulate their campaign promises prior to elections and the subsequent points at which those parties, as governing parties, may be expected to fulfill those promises is crucial. The time between the formulation of campaign promises and related government decisions could be up to several years; campaign promises may be formulated months prior to the election and relevant government decisions may be taken anytime during the subsequent governing period, which could typically last up to four years after the election. During that passage of time, national economic conditions may change significantly as a consequence of countries’ embeddedness in the international economic system, making what was promised unfeasible or undesirable even to the parties that made the promises. As an elevated level of uncertainty may be a consequence of a country’s exposure to the international economic system, we can think of uncertainty as an intervening variable. Exposure to economic globalization causes uncertainty, which in turn leads to promise breaking.
Where uncertainty is a relevant factor in broken campaign promises, we would expect to see this feature prominently in public discourse. Governing parties’ representatives are expected to refer to unforeseeable changes in conditions when justifying their actions. In many cases, governing parties do not explicitly acknowledge their broken promises, but instead highlight their efforts to pursue policies that align with their election appeals despite challenges being posed by conditions outside their control. In some cases, governing parties may acknowledge that their actions amount to broken promises, but when doing so highlight that they are prioritizing responsible policymaking in the face of adverse conditions. Conversely, opposition parties are likely to argue that competent governing parties should be able to anticipate changes in conditions.
A quintessential example of a broken promise due to the constraints of uncertainty played out in Australia. The Australian Labor Party, which belongs to the social democratic tradition, entered the May 2022 national election with a clear election pledge to keep the tax cuts that the incumbent governing parties had legislated. These included the so-called stage-three tax cut, which would come into effect in July 2024 and would benefit mainly higher income earners. The Australian Labor Party took office after the 2022 election. Throughout 2023, inflation continued to rise, prompting the Australian Central Bank to increase interest rates. In response, commercial banks raised mortgage rates, affecting many borrowers in Australia who are on variable-rate mortgages. A cost-of-living crisis ensued for many lower and middle-income Australians, putting pressure on the government to provide relief. In January 2024, following protracted internal party discussions, the government announced that it would change the planned stage-three tax cuts to distribute them more evenly. Higher earners would receive roughly half of the tax cut they would have received under the original plan, and the savings would be reallocated to tax cuts for lower and middle-income earners.
As we would expect, Australian Prime Minister Anthony Albanese emphasized that the change in circumstances was largely beyond the government’s control and due to factors that originated overseas. The global pandemic and the war in Ukraine were singled out as factors linked to the change in policy by the prime minister when he spoke at the National Press Club to defend the change in policy in January 2024. While the pandemic and the war in Ukraine were known at the time of the 2022 election, he argued that their effects could not have been anticipated accurately. With respect to the COVID pandemic the prime minister said:
The impact of the pandemic didn’t end. Of course, people are still getting COVID, we are still dealing with the consequences, but the aftershock has been much greater than what was anticipated.
With respect to the war in Ukraine, he said:
The other thing that was not envisaged in 2022 … [was that] … the Russian war on Ukraine and the invasion would be ongoing over such a long period of time, that impact on energy prices that then flows through, to the logistics industry, to supermarket shelves, was very significant indeed. No-one in 2022 at the election, I don’t think was pointing towards those factors at all.
He also insisted “that when economic circumstances have changed, it is a responsible thing to do to change our policy” (Prime Minister of Australia 2024). Moreover, as would be expected, critical journalists and the opposition party attempted to frame the change in policy as an indication of the lack of competence and trustworthiness of the Labor Party and the Prime Minister in particular.
Like the constraints of international legal commitments and market actors, we expect economic uncertainty to weigh somewhat more heavily on the fulfillment of promises made by center-left than by center-right parties. Economic uncertainty leads to broken promises primarily through the reduction in available or expected public revenue with which to fund campaign promises. Traditionally, center-left parties’ campaign promises require expenditure of substantial public funds, such as promises to invest in public education, health care, and social services. When public revenues decline due to global economic downturns and the resulting lower national tax intakes, such promises must be funded by either deficit spending or increases in tax rates. The extent to which deficit spending is practically possible is limited by the state’s international commitments – as is the case for Eurozone members that committed themselves to limiting deficit spending – or by the extent to which international investors influence governments through their investment decisions. Increasing taxes may also be infeasible due to the political opposition they provoke. Nevertheless, not all center-left parties’ campaign promises require the allocation of government revenues. Likewise, center-right parties commonly make promises, including promises to cut taxes, that require substantial public funds and are therefore not immune to the effects of economic uncertainty of promise breaking.
Taken together, these globalization constraints present significant challenges to the ability of governments to fulfill their campaign promises. Our theoretical argument suggests that (1) political parties in executive power are less likely to fulfill their campaign promises in countries and during time periods where governments are more exposed to economic globalization. In addition, we hypothesize that (2) this effect is weaker for center-right parties, whose campaign promises tend to converge with market interests.
Data and Variables
We now test our argument using large-n observational data, examining how globalization impacts the ability of governing parties to deliver on their promises and whether parties’ ideological positions mitigate these constraints. The information on the fulfillment of campaign promises that we use for the analyses in this chapter comes from the Comparative Pledges Project (CPP) dataset (Naurin, Royed, and Thomson Reference Naurin, Royed and Thomson2019; Thomson et al. Reference Thomson, Marsh, Farrell and McElroy2017). The CPP is a network of researchers that study campaign promises in democracies around the world. They coordinate their efforts by developing and following common ways of defining key concepts and measures, notably how to define campaign promises and their fulfillment. The dataset we examine has been subject to peer review and examined extensively in previous research. It includes information on over 20,000 campaign promises made by political parties in twelve countries prior to the formation of fifty-seven governments. The countries covered are Austria, Bulgaria, Canada, Germany, Ireland, Italy, the Netherlands, Portugal, Spain, Sweden, the United Kingdom, and the United States. The time period ranges from the 1970s to the 2010s, with the data on some countries covering longer time periods than others. The dataset includes information on campaign promises made by parties that did and did not go on to hold executive power after the election campaigns in which they made the promises. For the purposes of testing our main argument, we focus on the promises made by parties that went on to hold executive office. This refers to the fulfillment (or nonfulfillment) of 7,770 promises made in eighty-one election programs. When we explore the possible impact of globalization on the number and type of promises that political parties make, we examine the full dataset, including promises made in the election programs of parties that did not hold executive power after the election.Footnote 3
The Dependent Variable: The Fulfillment of Campaign Promises
Our main dependent variable is the fulfillment of campaign promises by political parties in government. A crucial question concerns the appropriate “level of analysis” at which we measure the variables and conduct the analyses. Here, we treat each election program (also called manifestos or platforms) as the unit of analysis and focus on the proportion of promises made in each program that were at least partially fulfilled as the operationalization of the dependent variable. There is a strong argument for treating election programs as the main unit of analysis as we do here. Because economic globalization varies across countries and years, all parties competing in the same election are exposed to the same level of economic globalization.
There are also arguments for treating individual promises as the unit of analysis, and that is the approach we used in a previous study on which the following analyses build (Schneider and Thomson Reference Schneider2024). An argument for treating individual campaign promises as the unit of analysis is that other factors that explain promise keeping (and breaking) have different values for promises found in the same election platform, and we should control for these alternative explanations too. Against this, treating individual promises as the units of analysis may artificially inflate the number of observations and therefore the statistical power, making it possible to “find” an effect of globalization that may in fact not exist. Treating election platforms as the units of analysis is a more conservative research design decision. Fortunately, we find that the results of the program-level and promise-level analyses are largely similar, which further increases our confidence in the findings we present here.
The decision to focus on election programs as the main source for gathering information on parties’ campaign promises is also worth justifying. While election programs may not encompass the entire range of parties’ electoral appeals, they are the most authoritative statements of parties’ positions. These documents are used in a wide range of comparative research on parties and are the main source for researchers and citizens to understand what parties promised during election campaigns (Naurin, Soroka, and Markwat Reference Naurin, Soroka and Markwat2019; Thomson et al. Reference Thomson, Marsh, Farrell and McElroy2017). The comparative politics literature also demonstrates that the fulfillment (or breaking) of promises contained in election programs has significant impacts on voters’ retrospective sanctioning of governing parties (Matthieß Reference Matthieß2020). Manifesto data have also been used to evaluate party policy positions and to relate those positions with tangible outcomes; for instance, to study how party polarization relates to citizen polarization (Moral and Best Reference Moral and Best2022), how declining turnout leads to manifesto adaptation (Ezrow and Krause Reference Ezrow and Krause2023), or how positions expressed in national manifestos toward the EU affect EU-level negotiations (Mariano and Schneider Reference Mariano and Schneider2022). The fact that manifesto positions, and the breaking or keeping of pledges made in manifestos, affect policy and electoral outcomes is a clear indication that they matter.
The following analyses are based on the narrow definition of campaign promises proposed by CPP researchers. A campaign promise is “a statement committing a party to one specific action or outcome that can be clearly determined to have occurred or not” (Royed, Naurin, and Thomson Reference Naurin, Royed and Thomson2019: 24). Moreover, the narrow definition of campaign promises holds that the “criteria used to judge the fulfilment of pledges are in principle provided by the writers of election programmes, not by the researcher” (Thomson Reference Thomson2001: 180). The advantage of this narrow definition is that it enables us to compare rates of promise keeping and breaking across countries and time periods with comparable measures of the key concepts of campaign promises. Some researchers in the CPP prefer a somewhat broader definition and measure of campaign promises, one that includes commitments that might be fulfilled in a range of different ways without specifying which way the party intends to take. The broader definition requires even more judgment by researchers when assessing fulfillment. This broader definition of campaign promises may be appropriate in some contexts and for some research purposes, but it does not suit the kind of broad comparative analyses we conduct here. Instead, we want to know that the data we examine from different countries and time periods – which were subject to different degrees of economic globalization – are as comparable as possible. This is the case when applying the CPP’s narrow definition. The CPP builds on a long tradition of research on specific campaign promises that typically focused on single-country case studies (Barrett Reference Barrett1960; Pomper Reference Pomper1968). The main differences between the CPP and these previous studies are that the CPP studies are comparative across countries and specify definitions of campaign promises and promise fulfillment more explicitly.
CPP researchers gathered evidence to assess fulfillment, categorizing promises as unfulfilled, partially fulfilled, or fully fulfilled. A campaign promise is considered partially fulfilled if some action is taken in the direction of the promise that falls short of complete fulfillment, such as reducing a tax rate from 25 to 23 percent when a cut to 20 percent was promised. The evidence gathered to assess fulfillment depends on the substance of what was promised, including changes to legislation, budget allocations, or certain socioeconomic outcomes. Fulfillment is assessed within the lifetime of the government that took office after the election campaign in which the promise was made. When a new election takes place, the mandate for the previous government has ended, and new promises are made.
The data collection procedure involves human coding of parties’ election programs to identify statements that qualify as campaign promises. Then, researchers must investigate whether the promises were fulfilled by consulting various sources of information relevant to whatever was promised. This is a labor-intensive process involving detailed qualitative work and the exercise of judgments by country specialists who are familiar with the parties, their election programs, parties’ promises, and relevant government actions and outcomes. CPP researchers have reported that their coding decisions are reliable. In the most comprehensive reliability test reported to date, an international group of nine researchers independently coded parts of a Canadian Conservative Party manifesto, a document that contained ninety-nine pledges identified by at least one coder. The average paired reliability was 0.74, which was calculated as x/n, where x was the number of statements both coders identified as a pledge and n was the number of statements at least one coder identified as a pledge (Royed, Naurin, and Thomson Reference Naurin, Royed and Thomson2019). Somewhat higher levels of reliability, in the eighty percentiles, have been reported in separate country studies. Intercoder reliability of fulfillment is generally higher, the most definitive test reporting an average 93 percent agreement between each pair of seven independent coders (Royed, Naurin, and Thomson Reference Naurin, Royed and Thomson2019). We are therefore satisfied that the data we examine on campaign promises are sufficiently comparable and reliable and currently the best available data for our purposes.
Figure 4.1 summarizes the quantitative evidence on pledge fulfillment that we examine at an aggregate level, comparing countries with each other. Following the practice of previous research, we compare the percentages of pledges that were either partially or fully fulfilled (as distinct from not fulfilled). This approach is appropriate given that the possibility of a pledge being partially fulfilled arguably depends partly on the way in which the promise itself is formulated.
Comparing the fulfillment of campaign promises across countries
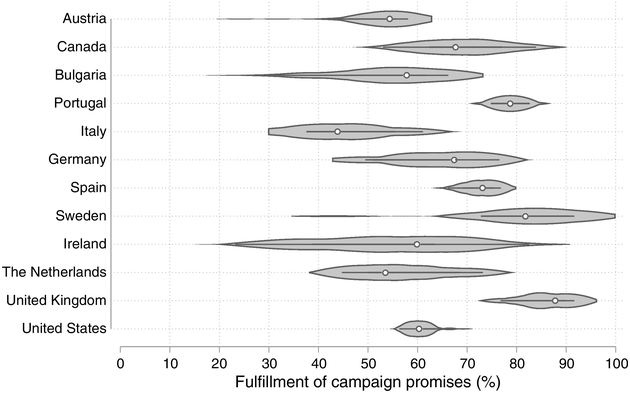
The figure depicts the aggregate performance of governments in terms of promise fulfillment across twelve countries. This broad cross-national comparison reveals some of the main findings that have featured prominently in previous comparative analyses. First, parties make many testable promises during election campaigns and fulfill what many observers consider to be substantial proportions of those promises. Of the promises made by parties that went on to hold executive power after elections, 61 percent were classified as at least partially fulfilled by researchers. The fact that governing parties fulfilled a clear majority of pledges at least partially and in many contexts fulfilled substantially higher percentages of promises, contrasts with the conventional wisdom that political parties are habitual promise breakers.
Governing parties differ significantly from each other in the extent to which they fulfill their campaign promises. The cross-country comparisons show higher rates of promise fulfillment for governing parties in countries where single-party governments are the norm, and lower rates where coalitions and other forms of power sharing are common. The United Kingdom’s single-party majority governments exhibit comparatively high levels of pledge fulfillment, as do the mostly single-party governments of Sweden and Portugal. Parties that formed single-party governments in the United Kingdom fulfilled 86 percent of their promises at least partially. Lower levels of pledge fulfillment are found in coalition governments, such as those found in the Netherlands, Germany, and Austria. Dutch parties that entered governing coalitions fulfilled 57 percent of their promises partially or fully.
Figure 4.2 breaks down the information about the fulfillment of campaign promises by party manifesto. The figure shows that there is no clear trend over time. It does not look like parties are becoming less able to keep their campaign promises in more recent years. At first sight, this seems contrary to our main expectation. We know that globalization has increased over time. If globalization is exerting a negative effect on promise keeping, we might expect to see more broken promises in more recent years. This would, however, be a vast oversimplification. We know from previous research on promise fulfillment that many other factors matter too, including the existence of power-sharing arrangements, whether the party holds the chief executive post in coalition governments, parties’ previous government experience, the general state of the economy, and characteristics of the promises themselves. Therefore, a proper analysis of our theoretical expectations requires that we consider these other explanations of promise keeping and breaking.
The fulfillment of election promises in election programs
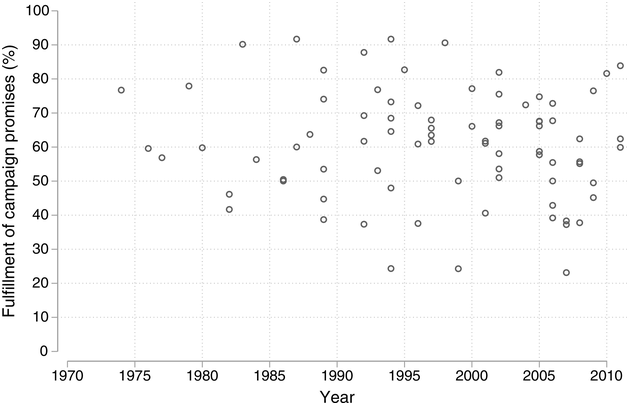
The main dependent variable in the following analyses is the fulfillment of campaign promises:
Principal Explanatory Variable and Control Variables
The data include cases where parties and governments were exposed to very different levels of globalization, which is our key explanatory variable. We use the authoritative Konjunkturforschungsstelle (KOF) Economic Globalization Index, which is an annual weighted aggregation of information on de facto and de jure trade and financial globalization. The index captures the extent to which a country is integrated into the international economy, incorporating data on trade in goods and services, trade regulations, tariffs and agreements, foreign direct investment, investment restrictions, and capital account openness. This multidimensional structure allows the KOF Index to capture both structural exposure to global flows and formal institutional commitments that may constrain national policymaking:
Globalization is the extent to which a country is integrated into the international economy, including information on trade in goods and services, trade regulations, tariffs and agreements, foreign direct investment, investment restrictions, and capital account openness. Data are from Dreher (Reference Dreher2006).
This index has been validated and widely used in research on the political consequences of globalization, including its effects on democratic governance, public policy, and electoral accountability. It is especially well suited for our purposes, given the book’s theoretical focus on how economic integration creates constraints that undermine promissory representation. While any composite Index necessarily involves trade-offs – such as decisions about weighting, measurement thresholds, and country comparability – the KOF index is the most appropriate for our cross-national analyses due to its consistent methodology, long time series, and comprehensive coverage.Footnote 4
Many studies have used the KOF Index to examine the relationship between globalization and economic growth. For example, Quinn, Schindler, and Toyoda (Reference Quinn, Schindler and Toyoda2011) show that de jure globalization has a stronger positive impact on growth compared with de facto globalization, as policy frameworks create sustainable conditions for economic expansion. Their research emphasizes the role of financial openness in driving growth through institutional mechanisms. The KOF Index has also been applied to explore the effect of globalization on income inequality (Potrafke Reference Potrafke2015). By linking trade liberalization and financial openness to widening wealth gaps, these studies illustrate the socioeconomic trade-offs that come with globalization.
Closely related to the broader interests of our book, researchers have used the KOF Index to assess the relationship between globalization and democratic governance. For example, Milner and Kubota (Reference Milner and Kubota2005) use the KOF Index to examine how globalization affects political institutions and the transition to democracy. They find that increased economic integration is associated with democratization, particularly in developing countries. However, the positive effects of globalization on democratization are more pronounced when globalization is accompanied by strong political institutions that safeguard democratic norms. Milner and Judkins (Reference Milner and Judkins2004) demonstrate that higher levels of economic globalization are associated with more constraints on democratic institutions, as global economic actors often favor policies that limit state sovereignty. Their analysis shows how global market integration influences the autonomy of democratic governments to set policies that align with voter preferences. Potrafke (Reference Potrafke2015) reviews a significant number of studies using the KOF Index to examine how globalization influences democratic governance. He finds that globalization can constrain governments’ policymaking autonomy, particularly in terms of fiscal and regulatory decisions. These constraints often undermine the ability of democratic institutions to fully respond to voters’ preferences, leading to a weakening of democratic responsiveness in highly globalized countries. Additionally, Hafner-Burton and Schneider (Reference Hafner-Burton and Schneider2023) explore how economic globalization has paradoxically provided tools and resources to aspiring autocrats, enabling democratic backsliding. The authors argue that while international integration was expected to strengthen democratic institutions, it has instead been leveraged by antipluralist forces within governments to weaken accountability mechanisms and consolidate executive power. By offering a comprehensive and multidimensional measure, the KOF Economic Globalization Index has become a critical tool in understanding how globalization shapes national policies, governance, and socioeconomic outcomes.
Figure 4.3 graphs average economic globalization across these countries between 1970 and 2020 and shows that economic globalization has steadily increased. Although the average level of globalization across these countries has plateaued since the mid 2000s (even with a slight decline in the most recent period), global economic integration is still at a historical high. This clearly shows that current commentary on deglobalization must be seen in perspective. There have certainly been noteworthy instances of decoupling of certain countries with respect to some sectors, but this does not detract from the historically high levels of international integration that we currently observe. Moreover, the constraints of globalization on national governments in established democracies are not confined to a narrow range of sectoral links with certain countries, such as Western countries’ dependence on China for certain materials or products, a dependence that many Western governments are attempting to reduce. Rather, the arguments set out in the previous chapters refer to the constraining effects of the entirety of international economic integration, which remains at a high level.
Historical trends in economic globalization
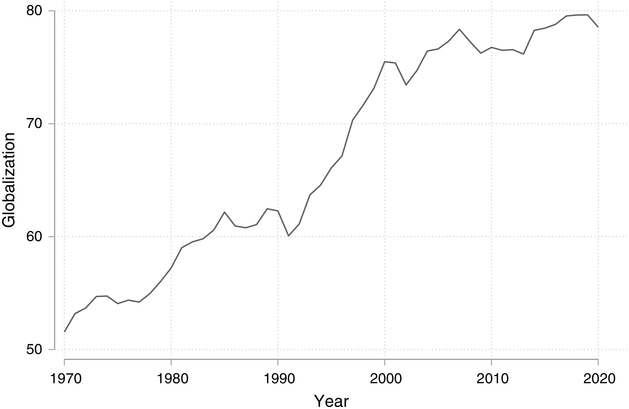
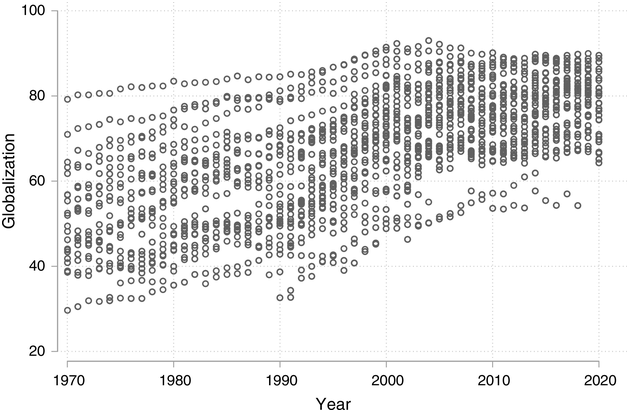
Figure 4.4 further shows that there is great variation in the extent to which these countries are integrated in the global economy, even in the most recent decades of relatively high levels of average economic integration. Although the average level of economic globalization has increased over time, there are and always have been large differences among countries in this respect. Within the group of established Western democracies examined in Figures 4.3 and 4.4, the cases have values on the KOF scale of economic openness ranging from 40 to 91, with a mean of 73.63 and a standard deviation of 11.69. This includes contexts relatively insulated from globalization, such as the United States in the 1970s and 1980s, as well as contexts that are highly exposed, such as Ireland in the late 1990s and 2000s. In subsequent analyses, we standardize the KOF Index to a mean of 0 and a standard deviation of 1 to simplify the interpretation of the coefficients.
Economic globalization across countries
The overall measure of countries’ exposure to economic globalization is included in our main test of the general argument that globalization has a negative effect on promise keeping. We also make the most of the available quantitative indicators that refer to the specific globalization constraints, while noting that these are only part of our investigation of their effects. Quantitative analyses are best suited to establishing the extent to which there is evidence for such general propositions. When it comes to testing and illustrating more detailed mechanisms, such as the effect of different globalization constraints, purely quantitative analyses are more limited. The case study presented in Chapter 5 is the most appropriate way of illustrating the three mechanisms in action, and we therefore reserve our assessment of the mechanisms until we have reviewed both the quantitative and qualitative analyses together.
The separate de jure and de facto components of the economic globalization index capture most closely the mechanisms related to legal constraints and market actors, respectively, and therefore may shed some light on the prevalence of these constraints. These component measures are defined as follows:
De Jure Globalization is the extent of a country’s economic globalization using information on de jure trade and financial globalization, including trade regulations, the prevalence of nontariff trade barriers, compliance costs of importing and exporting, income from taxes on international trade as percentage of revenue (inverted), unweighted mean of tariff rates, and the number of bilateral and multilateral free trade agreements, the prevalence of foreign ownership and regulations to international capital flows, the Chinn–Ito index of capital account openness, and the number of bilateral investment agreements and treaties with investment provisions. Data are from Dreher (Reference Dreher2006).
De Facto Globalization is the extent of a country’s economic globalization, using information on de facto trade and financial globalization, including exports and imports of goods (percentage of gross domestic product [GDP]), exports and imports of services (percentage of GDP), the average of the Herfindahl–Hirschman market concentration index for exports and imports of goods (inverted), the sum of stocks of assets and liabilities of foreign direct investments (percentage of GDP), the sum of stocks of assets and liabilities of international equity portfolio investments (percentage of GDP), the sum of inward and outward stocks of international portfolio debt securities and international bank loans and deposits (percentage of GDP), foreign exchange (excluding gold), Special Drawing Rights holdings and reserve position in the International Monetary Fund (percentage of GDP), and the sum of capital and labor income to foreign nationals and from abroad (percentage of GDP). Data are from Dreher (Reference Dreher2006).
Including separate measures for de jure and de facto globalization allows us to provide additional evidence of the underlying mechanisms. De jure globalization is most closely associated with the constraint of laws and regulations. De facto globalization is most closely associated with the constraint of market actors, as these actors become prominent when actual flows of trade and finance increase. The effects associated with these different measures allow us to explore whether some constraints have a stronger impact on promise breaking.
Aside from legal constraints and market actors, the third globalization constraint that we expect to affect pledge fulfillment negatively is economic uncertainty. This is also a challenging effect to assess in two respects. First, we noted that uncertainty may not exert an independent effect on promise breaking over and above the other globalization constraints. In other words, economic globalization may lead to uncertainty, which in turn leads to promise breaking. If uncertainty is indeed an intervening variable, it is not appropriate simply to include it as another explanatory variable in a regression with a long list of other relevant variables, in what methodologists disparagingly call kitchen-sink regressions. Instead, we must specify a separate model that excludes the explanatory variables that supposedly affect economic uncertainty, in this case our measures of globalization.
The second challenge associated with analyzing the effect of economic uncertainty is measurement. As we define it, uncertainty is the presence of unforeseeable and significant changes in conditions that are largely outside the control of national policymakers and that negatively affect the feasibility and desirability of policy options. As these changes are unforeseeable, they may become apparent only after they emerge, in other words as relevant actors become aware of them. Measuring such concepts is a challenge to say the least. It is with these caveats in mind that we introduce the best available quantitative measure of economic uncertainty, while noting that we pay particular attention to the uncertainty constraint in the case study analysis in Chapter 5, as a qualitative approach may be more appropriate to detect such a mechanism.
The World Uncertainty Index (Ahir, Bloom, and Furceri Reference Ahir, Bloom and Furceri2022) provides measures of the degree of political and economic uncertainty in each country in each year. The index is based on the standardized frequency of words “uncertainty,” “uncertain,” and “uncertainties” in the Economist Intelligence Unit’s quarterly country reports. This measurement approach has the advantage that it is based on standardized reports by country specialists focusing on economic and political developments in each country. Ahir et al. provide a set of validation tests of the uncertainty index, which demonstrate that the index is significantly associated with a range of plausible outcomes including stock market volatility, disagreement among economic forecasters, and lower GDP growth. The face validity of the measure is indicated by the fact that it spikes around events such as the Gulf War, the Euro debt crisis, Brexit, and the COVID pandemic. This new measure of uncertainty has been used by international financial institutions, world governments, and scholars.
Control Variables
Previous studies of the fulfillment of election pledges have identified several important variables that could influence the fulfillment of campaign promises apart from a country’s integration into the global economy, and we control for these alternative explanations here:
Varieties of Capitalism indicates whether the country has a liberal, coordinated, or mixed market economy. Liberal market economies (LMEs) are said to have a comparative advantage in radical innovation, and this is sustained by deregulated labor markets, modestly sized welfare states and relatively low levels of taxation. In coordinated market economies (CMEs), comparative advantage lies in specific skills and high-quality production, which are sustained by institutionalized cooperation between private and governmental stakeholders, highly regulated labor markets, higher taxes, and generous welfare states. Of the twelve countries included in the dataset, Canada, the United Kingdom, the United States, and Ireland have been described as LMEs. Austria, Germany, the Netherlands, and Sweden have been identified as CMEs. The remaining countries in our sample – Bulgaria, Italy, Portugal, and Spain – have been described as mixed systems, in that their institutional and policy arrangements are less coherent. While analysts debate the extent to which several of these countries fit the categories described by the Varieties of Capitalism framework, the countries included provide a range of different contexts in which to examine the effects of internationalization on election pledges. Data are from Hall and Soskice (Reference Hall and Soskice2001).
Executive–Legislative Relations captures whether the country is a parliamentary, presidential, or semipresidential system. Data are from the Comparative Pledges Project.
Federal is a binary variable that takes the value 1 if the country is a federal system and 0 if not. Data are from the Comparative Pledges Project.
Executive Power-Sharing captures whether a single party minority, a single party majority, a coalition majority, or a coalition minority controls the government executive. Data are from the Comparative Pledges Project.
Chief Executive is a binary variable that takes the value 1 if the party holds the chief executive position and 0 if not. Data are from country specialists in the CPP and, where necessary, supplemented with data from the European Journal of Political Research (EJPR) Data Yearbooks.
Ministry indicates, at the pledge level, whether (1) or not (0) the party that made the pledge controlled the relevant ministry. Since we are aggregating the data by election program, the variable refers to the proportion of pledges in the election platform that relate to the ministries held by the party that made the pledges. Data are from country specialists in the Comparative Pledges Project and, where necessary, supplemented with data from the EJPR Data Yearbooks.
Left–Right Position measures partisan ideology on the left–right axis from the Comparative Manifesto Project. We use scores from the so-called Right–Left Scale, which are also derived from parties’ election manifestos or platforms. Data are from Volkens et al. (Reference Volkens, Krause, Lehmann, Matthieß, Merz, Tegel and Wessels2019).
Incumbency captures whether the party is an incumbent party, opposition party with experience, or opposition party without experience. Data are from country specialists in the Comparative Pledges Project and supplemented with data from the EJPR Data Yearbooks.
Economic Growth measures the average economic growth rate of the country over the lifetime of the government. Data are from the World Bank Development Indicators, compiled by the Princeton Niehaus Center for Globalization and Governance World Economics and Politics Dataverse.
Government Duration captures the duration of the government in months. Data are from country specialists in the Comparative Pledges Project and supplemented with data from the EJPR Data Yearbooks.
Agreement on Pledge, at the pledge level, is a binary variable that takes a value of 1 if a pledge was similar to a pledge made by another party and 0 if not. Since we are aggregating the data by election platform, the variable refers to the proportion of pledges in the election program that were similar to pledges made by another party. Data are from the Comparative Pledges Project.
Preelection Agreement is a binary variable that takes value 1 if an interparty coalition agreement existed before the election, and 0 if not. Data from country specialists in the Comparative Pledges Project, supplemented with data from the EJPR Data Yearbooks.
We present descriptive statistics for all variables in the online Supplementary Material. We standardized all continuous control variables to a mean of 0 and a standard deviation of 1 to ease interpretation.
Globalization Undermines Promise Keeping
Since the dependent variable varies between 0 and 1, statistical analysis assuming a normal error structure can produce biased and incorrect estimates. We estimate beta regression models with a logit link function, which use an error structure appropriate for our data (Papke and Wooldridge Reference Papke and Wooldridge1996). All estimations include standard errors that are clustered at the political party level, country fixed effects, and a time trend.
Figure 4.5 summarizes the key findings from two models. The first model includes the overall measure of economic globalization, while the second model includes the separate de jure globalization and de facto measures. Both models control for the explanatory variables that have been examined in previous studies of promise fulfillment. The explanatory variables are arrayed along the vertical axis, with the reference value omitted. The marginal effects are plotted on the horizontal axis. The estimated coefficients are denoted by a dark-gray circle, and their 95 percent confidence intervals are marked by bars of the same color. The dashed vertical line represents a coefficient of 0 or no effect. Full tabular results are presented in the online Supplementary Material.
Globalization and the fulfillment of campaign promises
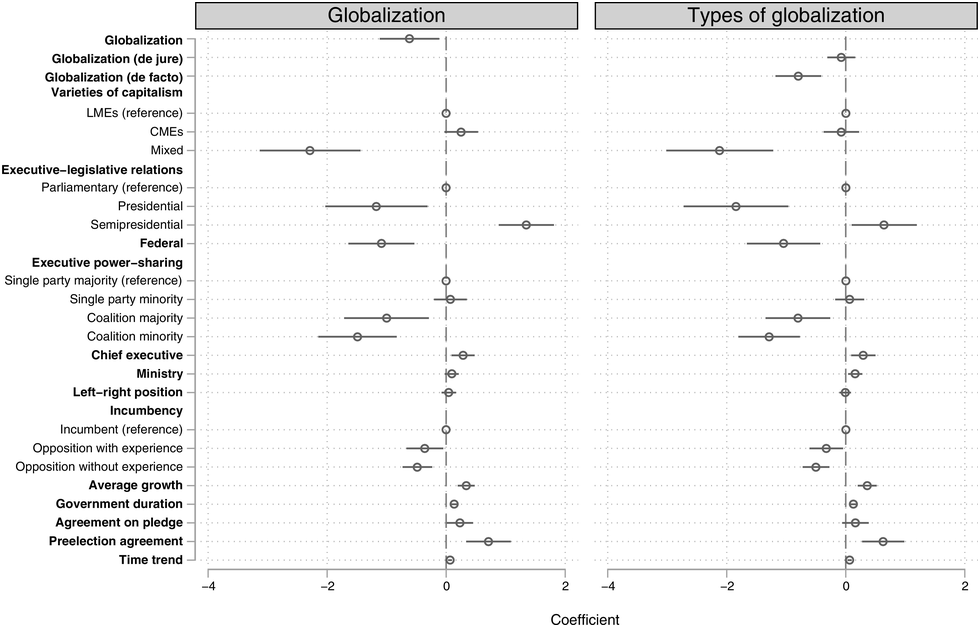
Figure 4.5 Long description
Two dot and whisker plots with similar x-axis display coefficients from negative 4 to 2 with a dashed line at x = 0 and y-axis displaying 29 variables. The variables from top to bottom are labeled globalization, globalization de jure, globalization de facto, varieties of capitalism, L M Es reference, C M Es, mixed, executive legislative relations, parliamentary reference, presidential, semipresidential, federal, executive power sharing, single party majority reference, single party minority, coalition majority, coalition minority, chief executive, ministry, left right position, incumbency, incumbent reference, opposition with experience, opposition without experience, average growth, government duration, agreement on pledge, pre-election agreement, and time trend.
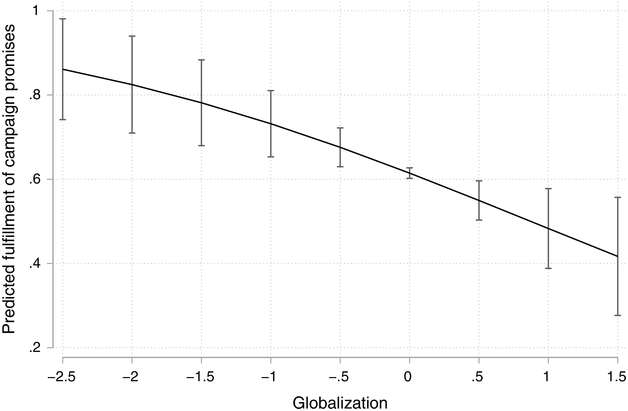
Globalization has a strong and robust negative association with the likelihood of promise fulfillment. The coefficient associated with Globalization is negative and highly significant. A 1 standard deviation increase in the level of Globalization is associated with a decrease of 38 percent in the odds that a campaign promise is fulfilled. Figure 4.6 illustrates the large size of the effect. At relatively low levels of Globalization, corresponding to 2 standard deviations below the average, the probability of fulfillment is 0.81. By contrast, at relatively high levels of Globalization corresponding to 1 standard deviation above the average, the probability of fulfillment is 0.50. This key finding on the negative effect of Globalization does not depend on the inclusion of the relatively internationalized cases with values around 1.5 standard deviations above the average. The coefficient associated with Globalization is almost identical when excluding these cases.
Predicted probabilities for the effect of globalization on promise fulfillment
Notwithstanding the limitations of the quantitative analyses in detecting relationships associated with specific mechanisms, we find quantitative evidence for two of the three mechanisms on international legal commitments and international market actors. The KOF Economic Globalization Index consists of de jure and de facto components, with the former focusing on rules and the latter focusing on actual flows. Crucially for our purposes, these measures are not so highly correlated that they raise concerns about multicollinearity (r=0.31, n=81).
In a model with both de jure and de facto components (right-hand graph in Figure 4.5), the coefficients associated with each of these measures is negative, but only the coefficient on de facto globalization is significant at conventional levels. We noted earlier that a previous analysis of the impact of globalization on promise fulfillment looked at promises as the unit of analysis, rather than election platforms, as we do here (Schneider and Thomson Reference Schneider2024). In that promise-level analysis, de jure globalization was statistically significant, though also somewhat weaker than de facto globalization. We can therefore be reasonably confident that de jure globalization has a constraining effect on promise keeping, but weaker than that of de facto globalization. These findings are consistent with the argument that globalization constrains the fulfillment of campaign promises through the influence of economic actors. Given the somewhat mixed findings in relation to de jure globalization, this may suggest that globalization’s negative effect on promise keeping works mainly, though not exclusively, through the empowerment of market actors.
We do not find significant quantitative evidence that globalization affects promise breaking through uncertainty. In an analysis reported in the online Supplementary Material, we estimated a model including a measure of economic uncertainty, the World Uncertainty Index mentioned previously (Ahir, Bloom, and Furceri Reference Ahir, Bloom and Furceri2022). This model excludes the globalization measures, as we expect globalization to increase uncertainty, which in turn affects promise nonfulfillment. The results show no evidence that uncertainty affects promise keeping. This nonfinding, in combination with the marked effect of uncertainty in the case study presented in the next chapter, suggests that more refined measures are required to detect this mechanism quantitatively.
Right-Wing Parties Are Less Affected by Globalization Constraints
So far, the results suggest that governing parties in countries deeply integrated into the global economy are less able to keep their promises. We hypothesized that this negative effect may be less of a constraint on center-right parties. This is because these parties’ policy preferences are often more aligned with the constraints of globalization, particularly prevailing international commitments and the preferences of market actors (Schleiter et al. Reference Schleiter, Böhmelt, Ezrow and Lehrer2021; Ward, Ezrow, and Dorussen Reference Ward, Ezrow and Dorussen2011).
We test this hypothesis with an interaction term between party ideology and globalization. To measure parties’ ideological positions, we rely on the widely used left–right positions from the Manifesto Project (Volkens et al. Reference Volkens, Krause, Lehmann, Matthieß, Merz, Tegel and Wessels2019), which are also derived from parties’ election programs. This measure of parties’ left–right positions is based on the Manifesto Project’s established thematic coding scheme, into which each sentence or quasi-sentence of the manifesto is allocated to a thematic category. The left–right score of each manifesto is based on the proportion of text it devotes to themes considered right-wing themes minus the proportion of text it devotes to themes considered left-wing themes. One of the advantages of the Manifesto Project’s measures is that they provide estimates of parties’ ideological positions at the same time points as our observations of election pledges. Moreover, it is the only detailed measure of parties’ ideological positions that tracks parties’ ideologies over the same period as the Comparative Pledges Project data on election pledges.
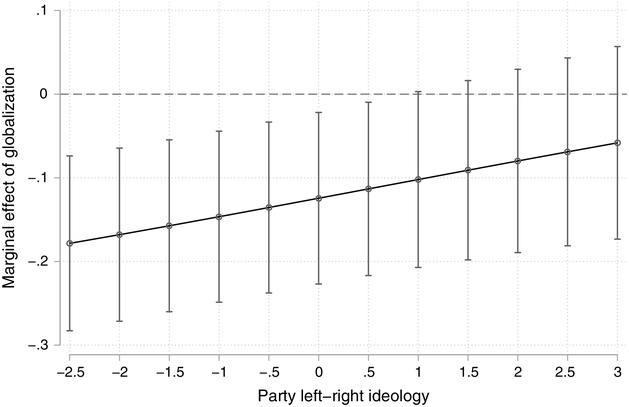
An interaction term between Globalization and Party Left–Right Ideology allows us to examine whether the effect of Globalization depends on the ideological positions of the parties that made the promise. We present the results graphically to ease interpretation.Footnote 5 Figure 4.7 shows that for all left-wing parties, Globalization has a significant negative effect on promise fulfillment. The coefficient associated with Globalization becomes insignificant for parties with Party Left–Right Ideology scores greater than a standard deviation above the mean, which are relatively right wing, but not only “extreme right-wing” parties and account for just over half of our observations; a total of forty-four of the eighty-one manifestos were made by such parties. The parties concerned are, for example, the US Republicans in 1984 and 1988; the UK Conservatives in 1983, 1987, and 1992; the German Christian Democratic Union/Christian Social Union in 2005, and the Conservative Party of Canada in 2011. The findings suggest that the fulfillment of these parties’ campaign promises is not significantly affected by their country’s exposure to international markets. We must, however, nuance this finding by foreshadowing that the next chapter’s case study provides evidence of a center-right party’s promise being unfulfilled due to the constraints of globalization. While center-right parties appear less constrained in keeping their promises than left-wing parties, they too encounter globalization’s constraints when they attempt to fulfill some of their campaign promises.
Effect of globalization on promise fulfillment for different party ideologies
Parties Do Not Avoid Costs by Making Fewer or Different Promises
The expected negative impact of globalization on the fulfillment of campaign promises is troubling not only from the perspective of promissory representation but also from the perspective of political parties themselves. The extent to which governing parties fulfill their campaign promises is a benchmark against which voters assess whether their preferred policies, which partly guided them in their vote choice, were implemented. Voters pay attention to promise fulfillment and punish governments for failing to keep their promises (Matthieß Reference Matthieß2020; Naurin and Oscarsson Reference Naurin and Oscarsson2017; Naurin, Soroka, and Markwat Reference Naurin, Soroka and Markwat2019). Governing parties may break some promises for good reasons, but consistent promise breaking undermines parties’ reputations, hurts their reelection prospects, and undermines public confidence in democracy (Stokes Reference Stokes2001). In Chapter 6, we show that these negative electoral consequences of promise breaking are even more pronounced when governments are more exposed to economic globalization.
We now examine the possibility that parties try to protect themselves from the negative consequences of breaking promises by making fewer promises or promises that are more easily fulfilled. If they did so, this would mitigate any observable effect of globalization on promise fulfillment. To the extent that this happens, the negative effects of globalization on fulfillment, which we observed in the previous analyses, are conservative estimates of the true size of the effect.
We find that levels of international economic integration have no effect on the number of promises that parties make and only a small effect on the types of pledges that parties make. Parties’ left–right ideological positions are a far more important predictor of the types of pledges that parties make. We examined the 178 election programs from eleven countries on which we have comparable data on the frequency of promises made by each party in each manifesto. Unlike the previous analyses, in which we looked only at election programs of parties that went on to hold executive office after the elections, here we include the programs of parties that did not, which accounts for the larger number of observations in these analyses. We estimated a negative binomial model with the count of campaign promises in each manifesto as the dependent variable and Globalization as one of the explanatory variables. Figure 4.8 presents the predicted number of promises that political parties make at different levels of Globalization.Footnote 6
Predicted effect of globalization on the number of campaign promises
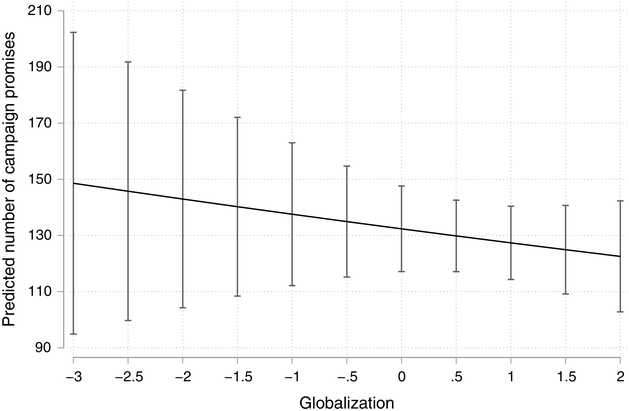
The coefficient associated with the effect of Globalization on the number of promises made is not significant (p=.42), which is also the case for the other explanatory variables included in the model. These nonfindings accord with previous analysis of the frequency of promise making, which conclude that parties make comparable numbers of campaign promises, whether they be left-wing or right-wing parties, incumbents or challengers, or in systems where single-party governments or coalitions are the norm (Naurin, Royed, and Thomson Reference Naurin, Royed and Thomson2019).
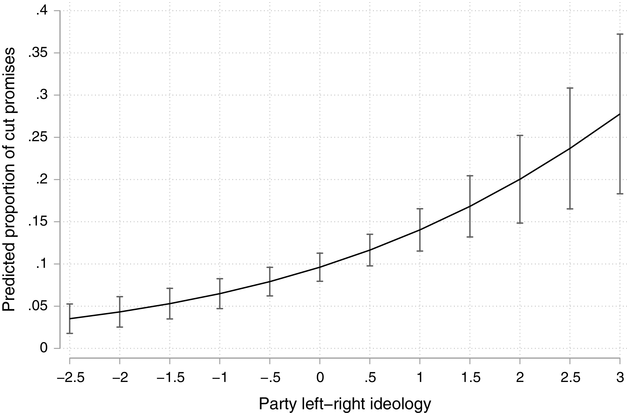
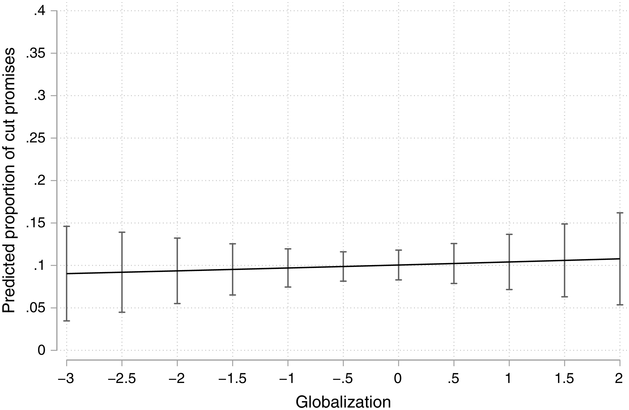
Although we do not find an effect of globalization on the overall numbers of campaign promises, Globalization is weakly related to the types of pledges that parties make. The strength of this relationship is conditional and quite modest in comparison to the relationship between parties’ ideological positions and the types of promises they make. We first estimate a general linear model with the proportion of “cut” promises in each manifesto as the dependent variable and Globalization as one of the explanatory variables. This type of promises includes promises to cut the size of government programs or to cut taxes. They stand for smaller government, and as such are typically associated with parties that are on the right of the left–right dimension. The coefficient associated with Globalization is not significant (p=0.77). By contrast, Partisan Left–Right Ideology has a strong and highly significant association with the proportion of promises to cut programs or taxes that parties make. Figure 4.9 depicts these relationships using predicted values. The expected proportion of promises that involve cuts to government programs or taxes is the same, around 0.10, regardless of the level of Globalization (bottom graph). By contrast, parties further to the right make far higher proportions of promises to cut programs or taxes than do parties to the left (Figure 4.9 top graph).
Left–right ideology, globalization, and promises to cut taxes and programs
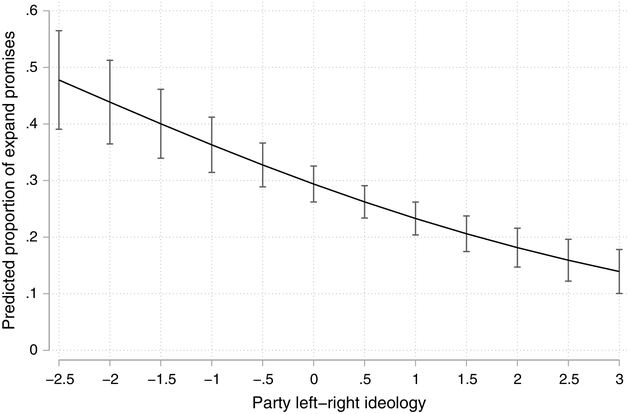
As Figure 4.10 (bottom graph) shows, Globalization is positively, albeit modestly, associated with the proportion of parties’ promises that are expansionary. These are promises to expand government programs, either by committing more public funds to specific programs or by expanding the scale of government programs by changes in rules. For instance, expanding the eligibility criteria for citizens to access public healthcare programs or welfare programs, even if they did not involve a specific promise to spend more money, would be coded as expansionary pledges. Expansionary pledges also include promises to raise taxes. Promises to raise taxes are relatively rare, but they are sometimes made by leftist parties in relation to the need for the rich and corporations to pay their fair share. Again, parties’ ideological positions have a far greater impact than globalization on the proportion of expansionary pledges they make. We estimated a general linear model with the proportion of “expansionary” promises in each manifesto as the dependent variable and Globalization as one of the explanatory variables. The coefficient associated with Globalization is positive and significant (p=0.00). As countries are more exposed to international markets, parties tend to make relatively more expansionary promises.
Left–right ideology, globalization, and promises to expand taxes and programs
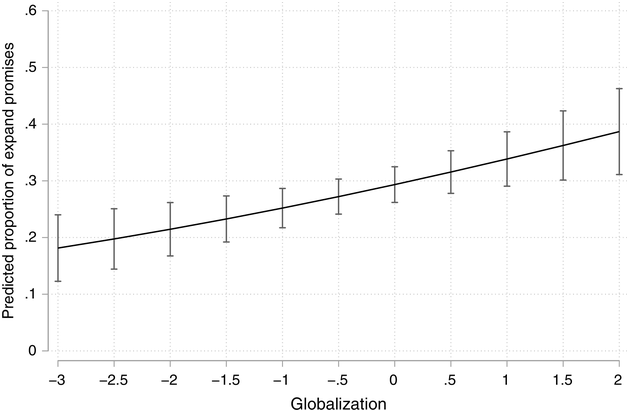
This positive association between globalization and the proportion of promises that are expansionary is consistent with the great expectations argument, which we discussed in Chapter 3. Globalization increases economic risks for citizens, who in turn expect that their governments should do more to protect them from these risks. The positive effect of globalization on expansionary campaign promises suggests that governing parties feel pressure to provide additional safeguards to their citizens. We discuss the effects of globalization on promise making in Part III of this book, and our findings there are consistent with the results in this analysis.
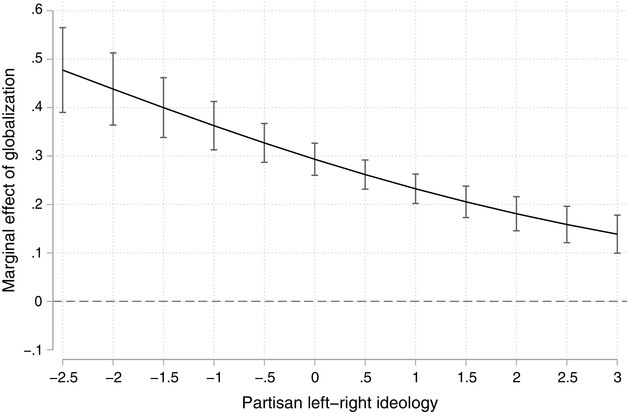
It is very noteworthy that the positive effect of economic globalization on the proportion of expansionary pledges is not driven entirely by center-left parties, as one might expect. Using a model that includes an interaction between Globalization and Partisan Left–Right Ideology, we find that even if left parties react more strongly to globalization than right parties, there is a positive and significant association between globalization and the number of expansionary promises across the entire political spectrum. Figure 4.11 presents the conditional effects.Footnote 7 This indicates that rightist parties face pressure to adopt policies that are traditionally associated with centrist and leftist parties, a topic that we will come back to in Part III of this book.
Globalization positively affects the numbers of expansionary pledges across the political spectrum
Overall, the evidence indicates that when party leaders are drafting their election programs, the constraints of globalization play a relatively minor role in determining the numbers of promises they make, primarily because of the need to formulate policy appeals that win votes and secure the support of key party factions and supporters. The findings also provide evidence that right-wing parties generally propose policies that are more in line with the preferences of market actors, which makes globalization less constraining for right-wing parties. At the same time, both left- and right-wing parties have strong incentives to make promises that increase welfare protections for their citizens if their country is more deeply integrated into the global economy.
Discussion
This chapter examines how globalization challenges the ability of governing parties to fulfill their campaign promises. As discussed in Chapter 2, promissory representation highlights a key aspect of democratic governance: parties make commitments during campaigns and are then judged by voters on whether they keep these promises while in power. Globalization complicates this process by imposing significant constraints that limit governments’ flexibility, particularly for left-leaning parties whose platforms often conflict with global market interests. These findings underscore that left-wing parties are more likely to break promises in highly globalized environments, where they encounter greater pressure to adapt their policies to market expectations. Despite these constraints, parties continue to make comparable numbers of campaign promises. This is likely because offering minimal promises would fail to attract voters and would lead to unrest among party activists and factions.
Globalization exerts its negative influence on promise keeping through three main channels. First, international legal commitments, such as trade agreements, often restrict governments from pursuing domestic policies that clash with these obligations. Second, market actors like multinational corporations and financial institutions pressure governments to adopt policies that favor economic openness, deregulation, and competitiveness. Lastly, economic uncertainty stemming from the volatility of global markets can significantly alter governments’ fiscal capacities, making it difficult to follow through on campaign promises.
Although our distinction between de facto and de jure globalization provides a rough test of some of our mechanisms, the main limitation of large-n quantitative analysis is its inability to shed light on which underlying mechanism drives the negative relationship between globalization and the fulfillment of campaign promises. The next chapter takes on this task. We complement our large-n observational study with the study of a typical case to explore whether the underlying mechanisms are indeed at work.
Globalization is detrimental to the ability of governing parties to fulfill their campaign promises. We argue that the constraints of globalization – international legal commitments, the empowerment of market actors, and economic uncertainty – impede promise keeping. This chapter presents a qualitative case study to probe the mechanisms associated with these constraints. We examine why the United Kingdom’s Conservative Party was unable to fulfill one of its central campaign promises of 2010, to reduce net migration to below 100,000 during the 2010–2015 governing period when the party held executive office.
The net-migration promise made by the Conservative Party in 2010 was one of the most prominent promises made by party leader David Cameron during the election campaign. He promised to reduce net migration to below 100,000 by the end of the government’s term in office. This promise became the cornerstone of the party’s broader commitment to control immigration, an issue that was increasingly politicized among the British electorate. Concerns over the perceived strain that rising immigration levels were placing on public services, as well as job competition, made this pledge highly significant to voters, particularly after the 2008 financial crisis. The promise was largely driven by rising public pressure to curb migration, influenced by the growth of right-wing, anti-immigration sentiment, especially from the UK Independence Party (UKIP). UKIP framed migration as a key issue, and Cameron’s Conservatives sought to neutralize this political threat by promising strict migration controls. The promised policy targeted both non-European Union (EU) migration and, indirectly, EU migration, despite the United Kingdom’s commitments under the European Union’s policy of free movement of people, which made it difficult to reduce migration from other EU countries. The government soon encountered multiple obstacles to fulfilling this promise. By 2015, despite tightening immigration policies for non-EU nationals, net migration had risen to over 330,000, far exceeding the promised cap of 100,000. The failure to keep this promise became a focal point of criticism of the Conservative government, and the issue of migration remained central to political debate in the United Kingdom, contributing to the momentum for the 2016 Brexit referendum, where controlling immigration was one of the most prominent arguments in favor of leaving the EU.
We use these events as a typical case study with which to explore the mechanisms linking globalization to broken campaign promises. As Gerring (Reference Gerring, Box-Steffensmeier, Brady and Collier2008) explains, typical cases are not selected to adjudicate between rival explanations but rather to investigate the plausibility of a theorized relationship by examining the underlying theoretical mechanisms that link cause and outcome in a context where both the cause and outcome are clearly present. In our framework, we hypothesize that intense economic globalization constrains national governments’ ability to fulfill campaign promises. The promise to reduce net migration to below 100,000 offers a paradigmatic example of this dynamic. The United Kingdom was one of the most globalized countries in the world at the time, with exceptionally deep integration into international trade, financial markets, and the institutional framework of the EU. It was also a clear case of a broken promise: the promise was repeated across multiple election cycles, consistently salient to voters, and ultimately abandoned in the face of rising migration and political pressure.
What makes this typical case especially useful is the combination of factors at play. First, immigration policy was a highly salient issue, not only central to the Conservative Party’s agenda, but also a point of intense public interest. Research shows that governments are generally more likely to fulfill promises on salient issues (Böhmelt and Ezrow Reference Böhmelt and Ezrow2021), yet the Conservative Party failed in delivering on this promise. Figure 5.1 shows that although net migration fell somewhat after the 2010 election, the government failed to bring it even close to the promised level, and the numbers rose again after 2012. This failure is noteworthy given that public pressure to keep the promise was intense. Because the United Kingdom was highly exposed to globalization and broke its promise, we would expect to observe the mechanisms underlying our argument.
International migration to the United Kingdom.
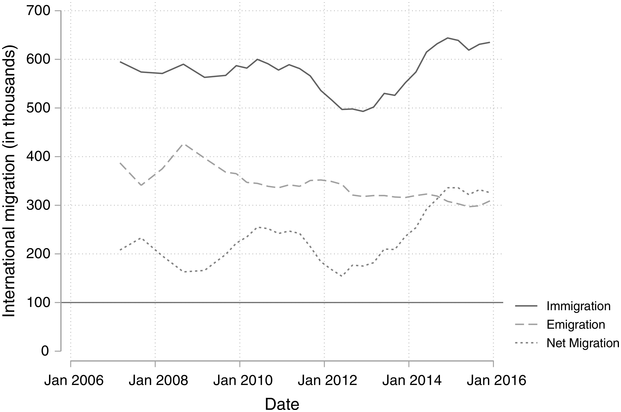
While this design strengthens our analytic leverage, it also entails important limitations. As a single-country case study, it does not allow for causal generalization or claims about external validity. Its value lies instead in its illustrative power: It offers a concrete setting in which to observe how economic globalization can constrain promise keeping, particularly on electorally salient issues such as immigration. By tracing the political processes through which a government that was highly exposed to globalization failed to fulfill a major campaign promise, the case provides a window into the causal mechanisms that undermine promissory representation in open economies. This approach is a valuable part of our multimethod research design. As Seawright (Reference Seawright2016) emphasizes, the combination of large-n statistical analysis and within-case process tracing allows researchers to test general patterns while also unpacking the dynamics that produce them. The case complements our cross-national findings by showing how global economic entanglements interact with domestic political pressures in ways that limit governments’ ability to deliver on their electoral commitments.
We rely on a range of secondary sources (including academic studies and newspaper articles), primary archival materials (such as election manifestos, consultation reports, and government communications), and interviews with political, administrative, and economic elites who were involved in the debates. In selecting the interviewees, we strove to maintain a balance across political ideologies, views on immigration, and background in terms of public and private sectors. The interviewees include:
Interview 1 (March 29, 2021; online interview): Rt. Hon. Sir Vince Cable, Former Secretary of the Department of Business, Innovation, and Skills. Member of the Liberal Democratic Party.
Interview 2 (June 29, 2021; online interview): Dr. Nick Hillman, Former Special Advisor to Baron David Willets at the Ministry of Universities and Sciences and Director of the Higher Education Policy Institute.
Interview 3 (June 23, 2021; phone interview): Professor Sir David Metcalf, Former Chair of the Migration Advisory Committee and Emeritus Professor of the London School of Economics.
Interview 4 (June 28, 2021; online interview): Ian Robinson, Former Assistant Director responsible for Economic Migration Policy at the UK Home Office, Partner at Fragomen LLP.
Interview 5 (July 7, 2021; online interview): Jill Rutter, Institute for Government, British Government civil servant until 2011.
Interview 6 (July 14, 2021; online interview): Jonathan Portes: Former Chief Economist in the UK Cabinet Office and Director of the National Institute of Economic and Social Research.
Interview 7 (August 2, 2021; online interview): Rt. Hon. Damian Green: Former Immigration Minister, member of the Conservative Party.
All interviews were loosely structured interviews based on common guiding questions. The interviews were conducted remotely via video conference or telephone call and lasted between thirty and sixty minutes.Footnote 1
The broad range of primary and secondary material we reviewed for the case study supports our main arguments. Despite public pressure, the government’s efforts to keep the promise were constrained by international legal commitments and market-driven labor demands, illustrating the mechanisms by which globalization affects promise fulfillment. The inability of the governing Conservative Party to reduce net migration, despite significant political capital invested in the issue, therefore aligns with our theoretical framework. This makes the case not only representative but also demonstrative of how globalization presents challenges for governments, confirming the broader patterns explored in this study.
The main factors in relation to the net-migration promise align with the mechanisms outlined in the theory. The promise itself was formulated in response to shifting voter expectations driven by perceived economic and cultural risks of increased immigration, as well as to party competition and ideological positioning. We will analyze the effect of globalization on promise making more extensively in Part III of the book, but we foreshadow those analyses by noting that this case illustrates how globalization changes voters’ expectations regarding government policies. In this case, UKIP was able to politicize immigration as an economic and cultural cost borne by British citizens, which increased pressure on the Conservative Party to promise to curb migration. This pressure was heightened by the threat of Conservative voters and politicians abandoning the Conservative Party in favor of UKIP.
The breaking of the pledge was driven by a combination of factors relating to global market movements, international commitments that conflicted with the promise, and effective lobbying by national and international market actors. Economic uncertainty, EU membership, and lobbying efforts by various market actors, both within and outside the United Kingdom, hampered the ability of the government to reduce migration to a point that would have fulfilled its campaign promise.
The Genesis of the Migration Promise
The Conservative Party pledged to cut net migration in response to public concerns regarding increasing levels of migration in a challenging economic context. Before the 2010 election, the Conservative Party led by David Cameron was the main opposition party challenging the incumbent Labour Party led by Prime Minister Gordon Brown. At the time of the 2010 election, the country was reeling from the global financial crisis, and unemployment had risen to over two million for the first time since the 1990s. These economic conditions fueled anti-immigration sentiments among large parts of the population who believed that many of the economic problems were caused by immigration. These views were perpetuated by an increase in net migration. One study found that while fewer people were leaving the country (60 percent decline) in the 12 months to June 2010, more overseas students were entering the country (35 percent increase), leading to a sharp rise in net immigration (Owen and Travis Reference Owen and Travis2010).
By 2010, immigration had become one of the most pressing political issues in the United Kingdom, with a clear majority of British citizens expressing concern over the increasing number of immigrants. A 2011 Ipsos MORI survey found that 64 percent of respondents believed that Britain had too many immigrants, reflecting a growing sense of anxiety among the public (Blinder and Richards Reference Blinder and Richards2020). Groups like Migration Watch UK, a prominent anti-immigration lobby, channeled these concerns, arguing that unchecked immigration was placing a significant strain on public services, housing, and the overall quality of life in the United Kingdom. They criticized the government for losing control over national borders, which had allowed immigration levels to rise unsustainably.
The intense public opposition to immigration affected all major political parties in the run-up to the 2010 election. UKIP capitalized on this sentiment, positioning itself as the party that would tackle immigration head-on. UKIP pledged to impose an immediate five-year freeze on immigration, framing this as a solution to what they termed “uncontrolled mass immigration” (Carey and Geddes Reference Carey and Geddes2010: 860). This promise resonated with a significant portion of the electorate, allowing UKIP to gain considerable public support. UKIP won second place in the 2009 European Parliament elections, and its transformation into a multi-issue party strengthened its appeal at the national level (Ford and Goodwin Reference Ford and Goodwin2014). UKIP’s message resonated with many voters who generally voted for the Conservatives, and it gained most votes in Conservative-held constituencies. Immigration quickly became a central issue during the 2010 election campaign, with the topic featuring prominently in all three of the leaders’ debates.
Faced with the UKIP challenge and mounting public pressure, both major parties were forced to propose policies aimed at tightening immigration controls. This political dynamic set the stage for the Conservative Party’s promise to reduce net migration. With UKIP gaining ground on the Conservative Party, and public opinion in favor of reducing migration, David Cameron committed the party to reducing immigration. On January 10, 2010, just months ahead of the general election, he made the now infamous promise in a BBC interview, stating that if he won the election, he would limit net immigration to “tens of thousands” each year (BBC News 2010).
The promise had been prepared carefully. It was developed by the Shadow Minister of Immigration Damian Green based on a pamphlet he had written on economic migration with David Davies, another prominent Conservative politician. It was agreed upon by a small group of party elites, including the shadow Home Office team and the leadership of the Conservative Party. The 2010 Conservative Party election manifesto made the 100,000 net migration target official party policy (Conservative Party 2010). According to our interviewees, the promise was not merely aspirational; or as Cameron put it himself: “no ifs, no buts” (Travis Reference Travis2015). Our interviewees who participated in the formulation of the promise shared the view that there was a sincere belief within the party leadership that the target was achievable when it was formulated.
According to many observers and our interviewees, the rationale behind Cameron’s move was to respond to public concerns about immigration and to neutralize migration as an issue during the campaign (Bale, Hampshire, and Partos Reference Bale, Hampshire and Partos2011). And indeed, during the campaign, the Conservative Party won significant political ground on the basis of their promise on immigration, the only issue on which the party scored significantly better than the Labour Party (Elliott Reference Elliott2010). According to a YouGov survey, at 25.2 percent the Conservatives were far ahead of both Labour (6.3 percent) and the Liberal Democrats (1.8 percent) on respondents’ judgment of the best party to handle immigration. Immediately after announcing the promise in early 2010, Cameron’s personal favorability ratings increased substantially (Dahlgreen Reference Dahlgreen2015).
The Road to Failure
The Conservative Party won the 2010 election and subsequently led a coalition government with the Liberal Democrats. Under the leadership of Home Secretary Theresa May, the UK Home Office introduced one of the harshest immigration policies in British history. The government implemented a cap on skilled labor migration from outside the European Union, which was promised in the Conservative’s 2010 manifesto. It also introduced a new minimum income threshold for people with spouses from overseas, which was arguably consistent with its 2010 manifesto statement to “limit … access only to those who will bring the most value to the British economy,” a statement that conveys intent but does not specify the action that would be taken. The government also cracked down on “bogus” colleges and “foreign criminals” (Trilling Reference Trilling2020). In addition, the Hostile Environment Policy, as it was called, included administrative and legislative steps to make it as difficult as possible for noncitizens to stay in the United Kingdom (Hill Reference Hill2017; Trilling Reference Trilling2020).
Yet, net migration remained stubbornly above 100,000 and even increased to 336,000 just before the 2015 election (up from 246,000 in 2010) according to the UK Office of National Statistics. Despite this failure to meet their target, the Conservative Party reiterated the same promise during the 2015 election campaign. When Theresa May assumed leadership, the pledge was repeated once more in the 2017 election. It was only in 2019 that the party abandoned the net migration target, replacing it with a new promise to implement an Australian-style points-based immigration system.
Our analysis indicates three main reasons why the Conservatives were unable to fulfill the promise. One obvious, though perhaps surprisingly not the most important obstacle to fulfilling the promise was the United Kingdom’s membership in the EU. The United Kingdom was committed to freedom of labor movement across Europe as part of the European Single Market. To accede to the EU in 2007, Bulgaria and Romania had agreed to limited movement of labor during a transition period (Schneider Reference Schneider2009). When this transition period came to an end in 2013, there were substantial increases in migration from both countries to the United Kingdom. The European Single Market constrained the government’s ability to fulfill its promise. As Theresa May said after it became clear that the government had failed to keep its promise: it was “unlikely” the target of getting net migration below 100,000 would be met, because EU migration had “blown us off course” (BBC News 2014).
However, the effect of legal commitments associated with EU membership should not be overstated. Migrants from EU member countries accounted for less than one-third of long-term migrants to the United Kingdom. In 2010, of the 281,000 immigrants, 196,000 (70 percent) were from outside the EU. Even if the government had eliminated all immigration from the EU, it would not have achieved its target of 100,000 (Office of National Statistics). Rather than focusing on EU citizens, the government attempted to cut immigration from non-EU countries, including the immigration of skilled individuals who were highly sought after by UK businesses and other organizations in the private and public sectors. There was also an attempt to cut numbers of overseas students, who brought both economic benefits partly through college tuition fees and their contributions to the United Kingdom’s scientific community.
The government’s inability to affect or even anticipate emigration was another important constraint on its capacity to fulfill the promise, one that was subject to considerable uncertainty. A decline in British emigration after 2010 contributed significantly to the failure to fulfill the promise. The fall in emigration was partly the result of the increased costs of living abroad due to a weak pound, with the government having little control over currency movements due to the United Kingdom’s integration into global financial markets (Owen and Travis Reference Owen and Travis2010). In a consultation report from 2010, the Migration Advisory Committee (MAC), an independent government advisory committee, warned the government that uncertainties about emigration numbers as well as EU rules might limit the feasibility of achieving the net migration target (Migration Advisory Committee 2010). In addition, many Britons returned to the United Kingdom during this period from crisis-hit Spain and Dubai, which further contributed to increased net migration (Travis Reference Travis2010a).
It also did not help that the promise was opposed by a broad range of national and international actors from the private and public sectors. Following a call for responses on these issues, the Migration Advisory Committee received over 400 responses from domestic and international actors including the Scottish Government, the Government of Ireland, the Embassy of Japan, various trade federations, banking associations, law firms, law associations, the health and social services sectors (including hospitals, medical services, and nursing homes), private companies, the British Chamber of Commerce, the oil industry, universities, research institutes, the Royal Bank of Canada, the Greater London Authority, the Department of Health, the Department of Education, the Department of Work and Pensions, and the Migration Policy Institute. The opposition expressed to the cap was as forceful as it was unanimous. Of the responses quoted in the report, only one response from a member of the public argued in favor of the cap on migration (Migration Advisory Committee 2010).
Private and public sector employers warned that the introduction of a cap would lead to major skill shortages. The lobbying efforts came from a variety of stakeholders, including politicians from all parties, business groups, law firms, car manufacturers, pharmaceutical companies, and the National Health Service (NHS). The NHS relied on recruiting skilled and relatively low-paid care workers from abroad. Gerwyn Davies from the Chartered Institute of Personnel Development expressed his concerns with a stark warning to the government:
The reality for employers is that training workers to plug the UK skills gap is a lengthy task. … The abrupt introduction of a radical cap would therefore leave many employers with a bigger skills problem and tempt employers with global operations to offshore jobs, where they can find the skills.
Sectors with international operations raised concerns about the significant adverse economic effects of restricting immigration. In a joint response to the Migration Advisory Committee consultation, the Association of Foreign Banks (AFB) and British Bankers’ Association (BBA) threatened that:
If the ability of migrants to enter the UK under Tier 2 is significantly reduced, AFB and BBA members will create jobs overseas that otherwise would have been created in the UK. As a result, the teams supporting those roles will also be located overseas.
Similar forecasts about business offshoring came from other sectors, including the oil and gas sector as well as international law firms (Migration Advisory Committee 2010). Sarah Mulley, Associate Director at the Institute of Public Policy Research, summarized the implications of the Migration Advisory Committee’s report succinctly:
The … analysis shows clearly how difficult it will be for the government to fulfill its promise to cut immigration substantially. The government now faces an unpalatable choice between introducing a policy which it knows will be damaging to the economy and public services, or failing to fulfill a key promise to the electorate.
Further pressure came from overseas. A major concern was that restrictive immigration measures would make it difficult to secure trade cooperation, and several interviewees noted the effect of the policies on relations with India. The policies threatened to derail negotiations between Britain and India to promote trade between the two countries in 2010. The UK government wanted the Indian government to allow British banks, legal and insurance firms, and small manufacturers to operate in India. In return, India asked for mutual recognition of qualifications so that its lawyers and bankers could operate in the United Kingdom. The Indian government was concerned that the cap on immigration would make this difficult and was dismayed by what they called racially prejudiced policies toward Indians. The United Kingdom had much to lose as total bilateral trade between the United Kingdom and India was worth £11.5 billion, and UK exports to India totaled £4.7 billion in 2009 (Waugh Reference Waugh2010). Our interviews confirmed that the pressure worked; after a high-level meeting between the UK and Indian governments, the United Kingdom shelved planned restrictions on intracompany transfers, which were opposed by Indian firms.
Similarly, the Embassy of Japan indicated that restrictive immigration policies:
would effectively force Japanese companies operating in the UK to reduce their future investment and to withdraw from this country. This will result in a huge number of job cuts for British workers employed in these companies.
The pressure exerted by these actors was intense and expressed through a range of channels. It was expressed publicly (through the media, including the notoriously vociferous British tabloid newspapers) as well as behind closed doors (through lobbying the Department of Business, Innovation and Skills, the Home Office, or the prime minister through the Business Advisory Group). Although the pressure did not convince the governing Conservative Party to abandon the promise altogether, it did not pursue many of the measures it had originally intended to, and many compromises were made. For example, the Home Office agreed not to restrict intracompany transfers, which made up a significant share of immigration. It also made significant concessions on foreign students and family reunification policies, for instance, in relation to minimum income requirements for immigrants to bring additional family members. As one of the interviewees notes “if there hadn’t been resistance, from lobby groups, from me and my colleagues, they [anti-immigration measures] would have gotten much worse.”
Alternative Explanations
The main alternatives to our view that globalization constraints led to this broken promise are less convincing. One alternative and somewhat cynical interpretation of the events described is that the Conservative Party’s net-migration promise was mainly symbolic, that the party did not have any serious intention of fulfilling the promise, and that it did so knowing that there are no significant consequences of breaking campaign promises. The evidence from this case and from comparative research does not support this view. Although the formulation of the promise was a response to political circumstances, it was made after extensive deliberation among party elites. According to those close to the Home Office and David Cameron, there was a sense that the promise was achievable. One interviewee noted that the target seemed not too far off given that net migration had been below 100,000 just a few years earlier. Moreover, the evidence indicates that the government made significant attempts to fulfill the promise. It imposed a cap on non-EU migration, introduced new income requirements for family reunification, implemented tougher standards for education providers that brought in overseas students, and generally created a hostile environment for migrants, all of which were criticized heavily as draconian. The fact that these policies did not achieve the promised level of net migration does not imply that the promise was made without any intention of keeping it.
Furthermore, the consequences from breaking this promise have been significant. According to one interviewee close to the party elites, the net-migration promise became an “albatross around the government’s neck.” The breaking of the promise fueled the rise of UKIP, whose leader criticized Cameron for failing to limit migration to the United Kingdom. With the looming electoral threat of UKIP, internal divisions widened within the Conservative Party and many Conservatives left the party to join UKIP. These divisions were among the factors contributing to yet another fateful promise by the Conservative Party. In its 2015 manifesto, the Conservative Party promised to hold a referendum on the United Kingdom’s membership of the European Union (Dorey and Garnett Reference Dorey and Garnett2016). In the end, the nonfulfillment of the migration promise cost Prime Minister David Cameron his political career at least indirectly, as he stepped down as prime minister after the leave campaign won the Brexit referendum in 2016.
Another alternative interpretation of the case study might be that the promise was broken mainly because of coalition politics, rather than international constraints. Indeed, the Conservative Party’s junior coalition partner, the Liberal Democrats, was much more supportive of immigration and opposed including the promise in the coalition agreement (BBC News 2014). However, the influence of the Liberal Democrats does not appear to have been decisive. Immigration was one of the policy areas in which the Liberal Democrats were unable to exert any significant influence over the Conservative-led government (Partos and Bale Reference Partos and Bale2015). Not one of the policies outlined in the Conservative Party’s manifesto in that area was dropped from the government’s agenda; all that was added was the inclusion of a Liberal Democrat promise to end the detention of children in asylum cases, a promise that even many “mainstream” Conservatives supported or could tolerate. All accounts of the coalition formation process suggest that immigration was a nonnegotiable “redline” for the Conservatives and that the Liberal Democrats were made aware of this from the outset (Bale, Hampshire, and Partos Reference Bale, Hampshire and Partos2011). In his interview with us, Sir Vince Cable himself described the Liberal Democrat’s influence as negligible:
We were preventing them from reaching their target. But of course, the real reason wasn’t our obstruction. I mean, that would have helped, but it was because of when there were gaps in the labor market, there were no restrictions on people coming in from the EU, and there was nothing the government could do to affect them. But having set a target, it made it abundantly clear to the British public what the problem was: the European Union.
One of our interviewees pointed out that the forceful opposition by Sir Vince Cable may even have been counterproductive in that it reduced the willingness of the Home Office to negotiate with the Department of Business.
A final and decisive argument against the coalition politics interpretation of the case study is that the Conservative Party was unable to fulfill the migration promise even after the coalition ended in 2015, after which it continued governing as a single-party government. This indicates that the presence of the Liberal Democrats in government does not explain the failure to fulfill the promise in the 2010–2015 period. This aligns with broader findings in the literature. Although Thomson et al. (Reference Thomson, Marsh, Farrell and McElroy2017) find that coalition governments are on average less likely to fulfill campaign promises, senior coalition partners that control the prime ministership, as well as coalition partners that hold the ministerial portfolios relevant to their promises, are in relatively strong positions when it comes to promise keeping. These governing parties generally fulfill promises at similar rates to parties in single-party governments.
Discussion
Globalization has significantly constrained the ability of governing parties to fulfill their campaign promises, and this chapter examines the mechanisms through which these constraints operate in a typical case study focused on the UK Conservative Party’s pledge to cut net migration. The case study highlights how the three major globalization constraints – international legal commitments, the empowerment of market actors, and economic uncertainty – led to the breaking of this prominent campaign promise. At the same time, the fourth constraint of globalization, citizens’ rising expectations that their governments protect them from globalization risks, set the scene for the making of the promise in the first place. By examining a typical case study, this chapter explores the mechanisms in greater depth than we are able to in the previous chapter’s quantitative analysis.
The headline finding from this chapter is that globalization created significant barriers that made fulfilling a high-profile promise nearly impossible. Despite the strong public support for the Conservative Party’s net-migration promise, the party was unable to fulfill it, as we would expect given that the United Kingdom was one of the most globally integrated economies in the world. International legal commitments, particularly those tied to EU membership and the free movement of labor within the EU, limited the government’s ability to implement strict immigration policies. As a member of the EU, the United Kingdom was bound by agreements that allowed for the free movement of EU citizens, which severely restricted the UK government’s control over immigration numbers.
Market actors also exerted considerable influence, lobbying for more open immigration policies to secure a steady supply of labor for industries that relied on foreign workers from both inside and outside the EU. This dynamic was especially evident in sectors like healthcare, agriculture, and technology, where the demand for migrant labor was high. Multinational corporations and economic elites resisted any restrictive policies that would negatively affect their operations. The lobbying from these actors compounded the government’s inability to meet its migration promise, as reducing immigration risked causing an economic downturn and potential labor shortages, undermining the United Kingdom’s position in a globalized economy.
Finally, economic uncertainty played a critical role. Fluctuations in the global economy, coupled with the financial instability following the 2008 economic crisis, made it difficult for the government to predict future economic conditions, particularly around migration patterns. For example, the number of British emigrants leaving the United Kingdom fell after 2010 due to the weakened pound and deteriorating economic conditions abroad, which increased net migration beyond the government’s control. These unexpected economic shifts complicated the governing party’s ability to meet the net migration target it had promised.
From the perspective of promissory representation, the failure to fulfill campaign promises is problematic for political parties, because they expect that voters will punish them at the next election. In the next chapter, we provide observational and experimental evidence that such retrospective punishment does indeed take place. We will also explore whether voters consider the constraints of globalization when they punish parties for breaking promises. The evidence clearly shows that voters do not let politicians “off the hook” because they are constrained by globalization. On the contrary, it appears that promise keeping and breaking has become an even more important benchmark for voters against which to assess politicians’ performance. As we will show in Part IV of the book, this presents a serious dilemma for political parties and affects their strategies when formulating their electoral appeals and campaign promises.
According to promissory representation, governing parties’ performance in terms of keeping and breaking campaign promises has electoral consequences: Voters reward or punish governing parties for keeping or breaking their campaign promises. This retrospective sanctioning provides the crucial impetus for office-seeking parties to keep their promises, therefore contributing to high-quality democratic representation. This chapter examines the electoral consequences of promise breaking in the context of economic globalization. Demonstrating that promise breaking has electoral consequences even in the context of globalization is crucial to our argument. If it were the case that parties did not have to worry about negative electoral consequences of breaking promises, they may not feel compelled to adapt their electoral appeals to the constraints of globalization.
This chapter revisits a key finding from previous research on voters’ responses to governing parties’ performance in terms of promise keeping, which we discuss extensively in Chapter 2 (e.g., Cruz et al. Reference Cruz, Keefer, Labonne and Trebbi2024; Matthieß Reference Matthieß2020; Naurin and Oscarsson Reference Naurin and Oscarsson2017; Naurin, Soroka, and Markwat Reference Naurin, Soroka and Markwat2019; Thomson Reference Thomson2011).Footnote 1 That previous research provides consistent evidence that promise making and keeping plays an important part in voters’ electoral choices. While most voters may not have deep knowledge of the detailed policy proposals made by political parties, they are able to assess accurately whether key campaign promises are fulfilled or broken. Surveys in several countries (including Ireland, Sweden, Portugal, Canada, and the United Kingdom) have shown that voters can identify whether specific promises were kept, such as promises to reduce class sizes or increase police numbers. Furthermore, electoral support for governing parties is tied to their ability to keep campaign promises. Conversely, breaking promises undermines voter trust and support, especially on highly salient issues like immigration or health care, often leading to electoral punishment. These findings are noteworthy, particularly given the fact that voter reactions to promise keeping are complex and influenced by individual preferences and political ideology.
We move beyond previous research on the electoral punishment for promise breaking by examining this topic in the context of economic globalization. In the next section we argue that this punishment is particularly severe in the context of globalization. The subsequent sections then examine this argument with different research approaches. First, we use evidence from a large-n quantitative analysis of the performance of governing parties with respect to promise keeping and the conditions under which this is linked to changes in their electoral support. We then turn to a preregistered survey experiment that we fielded in the United States. Whereas the cross-national analysis has high external validity by capturing broad patterns across diverse contexts, the survey experiment has high internal validity by allowing us to identify causal relationships under controlled conditions. The design of the experiment removes concerns that the observational results might be driven by other factors, such as partisanship. It also provides an opportunity to test the conditions under which promise breaking is particularly costly for political parties. Finally, we explore citizens’ perspectives on promise breaking in a more qualitative way, by hearing directly from voters who experienced an iconic case of promise breaking under international economic constraints: the French Socialist government of the early 1980s. Taken together, we find strong evidence that promise breaking is costly and reduces support for political parties. These costs are not reduced when globalization constraints make the promised policies less feasible. On the contrary, in many cases, governing parties are punished more severely for promise breaking when they are constrained by economic globalization.
Severe Punishment for Promise Breaking under Globalization
As globalization has weakened governing parties’ control over macroeconomic outcomes, promise keeping has become a more salient criterion for voters’ evaluations of their performance. In a landmark study, Kayser (Reference Kayser2007) explores how increasing economic openness has weakened the relationship between economic performance and electoral outcomes. He argues that globalization has diminished the ability of voters to hold governments accountable for economic conditions because external factors, such as global trade flows and international financial markets, have a greater impact on national economies. As a result, the traditional connection between domestic economic performance and voting behavior – where voters reward incumbents for economic prosperity and punish them for economic decline – has weakened in open economies.
Hellwig (Reference Hellwig2015) offers similar results in his study on the effect of globalization on democratic accountability. He argues that globalization contracts the “policy space” governments have, complicating the traditional model of retrospective voting, where voters assess incumbents based on economic performance. His empirical analysis demonstrates that as economic conditions are more strongly influenced by global factors, voters often struggle to determine whether negative economic conditions are the result of government policy failures or external forces. This confusion leads to a reduction in the electoral consequences for governments that fail to deliver economic prosperity, particularly in countries deeply embedded in the global economy. Similarly, Hellwig and Samuels (Reference Hellwig and Samuels2007) suggest that as globalization shifts responsibility for economic conditions from national governments to global forces, voters may become confused about who to blame for poor economic performance. When it is unclear whether economic hardship stems from domestic mismanagement or external global pressures, incumbents face fewer electoral consequences for negative economic outcomes.
It is because voters are less able to use general economic performance to inform their vote choices in more globalized contexts that they put more emphasis on the ability of governing parties to keep the promises they made. While voters acknowledge globalization constraints, they also expect their representatives to have the knowledge and foresight to make promises that consider international constraints. Voters increasingly value governing competence when casting their votes, and the ability to make feasible campaign promises and fulfill those promises is a strong indicator of competence. Conversely, governing parties that fail to keep their promises are perceived as incompetent. This emphasis on governing competence is also found in Katz and Mair’s (Reference Katz and Mair1995) cartel party thesis, which we discuss in Chapter 2. The cartel party thesis argues that as parties become more integrated into the institutions of the state and less ideologically polarized, they increasingly seek to differentiate themselves in terms of governing competence rather than offering starkly alternative policies. An important part of signaling such governing competence consists of proposing specific policy measures that can be carried out.
Campaign promises often focus on policy instruments (rather than policy outcomes), such as passing new legislation, instituting tax reforms, or increasing funding for public services, which are in principle within the formal control of governing parties. In contrast, the outcomes these policy instruments are intended to achieve, including broad macroeconomic outcomes, may be more affected by global dynamics than by what any one national government does. It is precisely this distinction that makes voters less forgiving of governing parties’ promise breaking than of poor macroeconomic outcomes. While voters may understand why economic conditions prevent achieving full employment or high rates of growth, they are less forgiving if the government fails to pass the job-creation initiatives it promised. The distinction between inputs (policy actions) and outputs (economic results) means that voters expect their leaders to at least deliver on the policy changes they campaigned on, even if achieving the broader goals remains difficult in a globalized context.
Failing to deliver on specific campaign promises reflects poorly on three aspects of governing competence: anticipation of future constraints, control over the political process, and integrity. The ability to anticipate well means that parties should be able to craft policy proposals that can be implemented given the future constraints that knowledgeable policymakers should be able to foresee. In a globalized world, where economic interdependencies and international challenges are complex, competent leaders must demonstrate expertise and strategic foresight. Globalization is not a new phenomenon; politicians are aware of its challenges, and voters expect leaders to anticipate how global markets, international agreements, and geopolitical factors will affect domestic policy. They expect leaders to understand the nuances of international negotiations, trade agreements, and economic policies. When promises are broken due to the constraints of globalization, it signals a lack of competence or control. The ability to anticipate is even more important for policymakers in a globalized world, where the stakes are often higher, and the consequences of poor anticipation – whether in terms of broken promises or ineffective policy – can be severe. Failure to manage global economic shifts might result in mass job losses, stagnation, or welfare cuts. Voters may care more about broken promises in a globalized context because failing to deliver reveals a lack of anticipatory skills on the part of the governing politicians.
The ability to control and manage the national political process is another key aspect of governing competence. This refers to the ability to garner sufficient support for their proposed policies within the executive and legislative branches and within the wider political system. It includes the ability to overcome bureaucratic resistance to new initiatives and to form coalitions of legislators. It also includes the ability to overcome opposition within the wider policy communities affected by some campaign promises. Managing the political process also includes the ability to formulate policy proposals that incorporate credible policy expertise. Failure to fulfill key campaign promises may indicate incompetence, either in terms of the lack of ability to maneuver adeptly through the political process or in terms of the ability to formulate sensible policies that withstand the scrutiny of policy experts.
Parties’ governing competence also involves integrity, which is manifest in the trust that citizens have in them. Governing parties that habitually break their campaign promises are perceived as untrustworthy by citizens. In response to a broken promise, citizens may believe that the government either misrepresented what it could achieve or failed to take the necessary steps to deliver on its promises. This is particularly critical in a political environment where public trust in political institutions is already fragile, and broken promises can deepen voters’ disillusionment. Thus, while globalization may complicate a government’s ability to achieve certain economic outcomes, voters are likely to hold leaders more accountable for their failure to implement promised policies, as this is seen as an issue of integrity.
In sum, although globalization may reduce the extent to which governing parties are held to account for general economic performance, it increases the importance of promise keeping because voters expect leaders to act with foresight, managerial control, and integrity. Broken promises, especially in a globalized world where stakes are high, suggest weak governing capacity on several dimensions, making voters more likely to care about promise breaking in this context.
Consequently, we expect that (1) voters punish political parties that hold executive office when these parties break their campaign promises, and (2) this punishment is stronger when countries are more deeply integrated into the global economy.
Why Scapegoating Globalization Does Not Work
The counterargument to our theoretical expectations, particularly the second one, is that governing politicians may be able to deploy a tactic of scapegoating effectively. In other words, they may be able to explain to the public that they were unable to do what they promised due to the constraints of globalization and that voters may give them a pass as a result. The evidence for effective scapegoating is that politicians can under certain circumstances attribute blame for negative outcomes or unpopular policies to external forces to shield themselves from voter backlash. For instance, Chaudoin, Milner, and Pang (Reference Chaudoin, Milner and Pang2015) argue that politicians often scapegoat international organizations to justify policies that may be necessary but unpopular, such as trade liberalization or economic austerity. Vreeland (Reference Vreeland1999) provides evidence that governments use the International Monetary Fund (IMF) as a scapegoat, in the hope that the implementation of unpopular IMF programs become less costly politically. The European Union (EU) is particularly ripe for strategies of blame shifting and scapegoating (Heinkelmann-Wild et al. Reference Heinkelmann-Wild, Rittberger, Zangl and Kriegmair2025; Schlipphak and Treib Reference Schlipphak and Treib2017). Blame shifting often occurs in policy areas such as immigration, economic reform, and regulatory compliance, where national governments argue that their hands are tied by international agreements. Hobolt and Tilley (Reference Hobolt and Tilley2014) also provide evidence that blame shifting can affect voters’ perceptions. In the European context, they show that when national governments blame the EU for unpopular policies, citizens tend to punish the EU in elections rather than their own governments. This dynamic was particularly evident during the Eurozone crisis, where many citizens blamed the EU for imposing austerity measures that caused economic hardship.
Scapegoating is, however, unlikely to work effectively as a tactic for avoiding electoral punishment for promise breaking. The evidence for effective scapegoating refers mainly to policies that were not the subject of specific campaign promises but to general policies. The act of promise making is of great theoretical and practical significance in modern democracies. It is therefore one thing for party leaders to say that global forces compelled them to take some unpopular policy measures, but another thing for them to say that global forces are a valid excuse for breaking the campaign promises that brought them to power.
Moreover, the little evidence we have on the use of scapegoating to mitigate punishment for promise breaking suggests that it does not work (or works only under a narrow set of conditions). Bonilla (Reference Bonilla2022) uses experimental analysis to explore how different explanations for failing to deliver on campaign promises influence voters’ perceptions. Her findings indicate that the penalty for breaking a promise cannot be avoided easily. Excuses have some ameliorating effect, but none of the excuses improve people’s opinions of candidates substantially. Candidates who follow through on their promises are generally far more popular.
Comparative Analysis
We begin with a comparative analysis of the electoral consequences of breaking promises and find – in line with previous research – that breaking promises is electorally costly. In addition, we show that promise breaking is particularly consequential in countries that are integrated into the global economy. Our analysis is based on a sample of political parties in executive power across sixty-nine elections in fourteen countries between 1977 and 2015. The sample includes parties that held executive office in Austria, Bulgaria, Canada, France, Germany, Ireland, Italy, the Netherlands, New Zealand, Portugal, Spain, Sweden, the United Kingdom, and the United States. The data on promise keeping was collated by Matthieß (Reference Matthieß2020), drawing on studies from the Comparative Pledges Project, which we discuss in Chapter 4.
The Dependent Variable: Changes in Political Parties’ Vote Share
Our argument connects governing parties’ inability to fulfill the promises they made during election campaigns to voters’ decisions to punish those parties in the election following the government period in which those parties broke their promises. We expect voters to punish political parties for breaking their campaign promises by withholding their support during elections. Governing parties should suffer a greater loss in their overall vote share when they break higher proportions of their promises. Focusing on vote shares is an established practice in the economic voting literature (Alesina, Roubini, and Cohen Reference Alesina, Roubini and Cohen1997; Duch and Stevenson Reference Duch and Stevenson2008, Reference Duch and Stevenson2010; Kayser Reference Kayser2007; Lewis-Beck and Stegmaier Reference Lewis-Beck and Stegmaier2000; Powell and Whitten Reference Powell and Whitten1993). It is also the approach used in the one study of the effect of promise breaking on electoral outcomes at the aggregate level, which we replicate and extend (Matthieß Reference Matthieß2020).
Our main dependent variable is Change in Vote Share, which is measured as the change in the absolute vote share of each incumbent political party from the previous election to the current election. Data are from the Manifesto Project (Volkens et al. Reference Volkens, Krause, Lehmann, Matthieß, Merz, Tegel and Wessels2019). A party’s vote share is measured as the proportion of votes won in an election. Our variable ranges from −0.34 to 0.15, with a mean of −0.046. This means that governing parties, on average, lose about 4.6 percent of their vote share from one election to the next. The fact that governing parties tend to lose votes after their governing period has been referred to as the “cost of ruling” (Paldam Reference Paldam1986).
Principal Explanatory Variables
Our main explanatory variable is the proportion of campaign promises of each governing party that remain unfulfilled at the end of their term in executive office:
Broken Campaign Promises are the proportion of campaign promises that a political party in government has broken in the government period prior to the election in question. The variable ranges from 0 to 1. Data are from Thomson et al. (Reference Thomson, Royed, Naurin, Artés, Costello and Ennser‐Jedenastik2017), supplemented by data collated by Matthieß (Reference Matthieß2020).
In addition to the main effect, we contend that economic globalization has affected the electoral consequences of promise breaking. We expect that promise breaking becomes a more important factor in voters’ electoral decisions when countries are more integrated into the global economy. As in Chapter 4, we use the Konjunkturforschungsstelle Economic Globalization Index:
Globalization is the extent to which a country is integrated into the international economy, including information on trade in goods and services, trade regulations, tariffs and agreements, foreign direct investment, investment restrictions, and capital account openness. Data are from Dreher (Reference Dreher2006).
Control Variables
Previous research on promise keeping has identified several important variables that could influence the change in governing parties’ vote share in addition to their ability to fulfill their campaign promises. We follow Matthieß (Reference Matthieß2020) in the choice of our main control variables:
Previous Vote Share measures the absolute vote share of the incumbent political party in the previous election. Data are from the Manifesto Project. Parties with larger absolute vote shares experience larger changes (most likely declines) in their vote shares than parties with smaller absolute vote shares.
Ideological Distance (Median) measures the distance of the political party from the ideological median. The distance is calculated by the difference between a party’s left–right score and the median position of all political parties in each country. The variable is standardized so that it ranges from 0 (the political party is located at the median position) to 1 (furthest away from the median position). Data are from Volkens et al. (Reference Volkens, Krause, Lehmann, Matthieß, Merz, Tegel and Wessels2019). We calculate the median position of all political parties in the country based on their vote shares.
EMI (log) is measured as the log of the Economic Misery Index (EMI), which is calculated as the sum of the unemployment and the inflation rate.Footnote 2
We present descriptive statistics for all variables in the online Supplementary Material. To ease interpretation, we standardize Previous Vote Share and EMI (log) to a mean of 0 and a standard deviation of 1.
Promise Breaking Is Electorally Costly …
To test our main argument, we use an ordinary least squares estimator and cluster the standard errors by country. We start with the main effect regarding the association between promise breaking and change in vote share. To analyze whether the effect is conditional on the level of economic integration, we introduce an interaction between Unfulfilled Campaign Promises and Globalization.
We present the coefficients from the model graphically in Figure 6.1.Footnote 3 The explanatory variables are arrayed along the vertical axis, with the reference value omitted. The marginal effects are plotted on the horizontal axis. The estimated coefficients are denoted by a dark-gray circle, and their 95 percent confidence intervals are marked by bars of the same color. The dashed vertical line represents a coefficient of 0, corresponding to no effect.
Unfulfilled promises and change in vote share
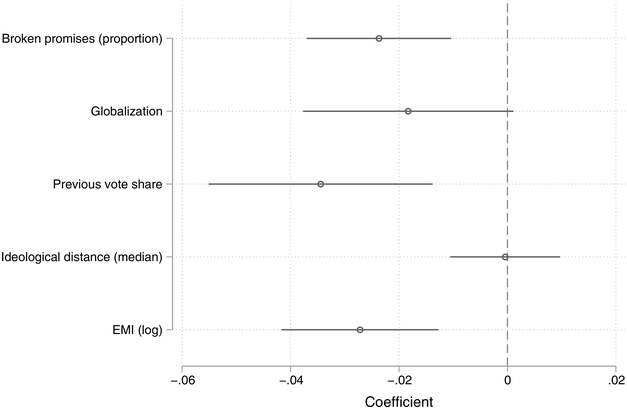
Broken Promises (Proportion) has a strong and robust negative association with Change in Vote Share. A 1 standard deviation increase in the proportion of broken campaign promises decreases a governing party’s vote share by over two percentage points. Figure 6.2 depicts predicted values for the effect of unfulfilled campaign promises on political parties’ change in vote share. Governing parties that fulfill all their promises do not experience significant changes in their vote share between elections. We might have expected a positive effect when governing parties keep all, or almost all their promises, as voters might reward political parties for keeping their promises. The prediction of no change in vote share may indeed be seen as a reward, given that on average political parties in government lose about 4.6 percent of their vote share between two elections. However, this really means the absence of a punishment rather than the presence of a reward. As governing parties fail to keep more promises, the sanctioning effect emerges. Governing parties that fail to keep about 40 percent of their promises can expect a 5 percent decline in their vote share; parties that break all their promises are expected to experience a whopping 15 percent decline in their vote shares, all else equal.
Predicted values for the effect of broken promises on change in vote share
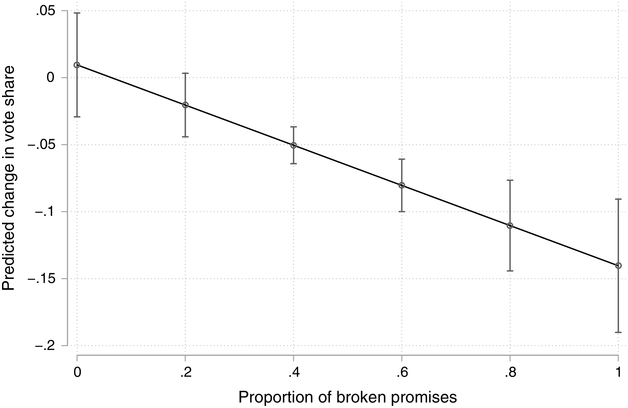
The findings for the control variables are in the expected direction and in line with findings in existing research. Governing parties that received higher absolute vote shares lose proportionally more votes at the next election. Similarly, in line with the economic voting literature, more economic misery leads to a greater loss in governing parties’ vote shares at subsequent elections. Notwithstanding governing parties’ weaker control over economic outcomes under globalization, they are still punished for governing amid poor economic conditions. We do not find any effect of parties’ ideological positioning on vote share.
… Especially When Countries Are Highly Exposed to Globalization
The results so far indicate that promise breaking is costly. Further analysis reveals that it is particularly costly when countries are deeply integrated into the global economy. We introduce an interaction between our standardized measure of Globalization and the Broken Promises measures, which we present in graphical form. Figure 6.3 shows the effect of Broken Promises on Change in Vote Share for different levels of a country’s integration into the global economy, with the full model presented in the online Supplementary Material.
Marginal effect of broken promises on change in vote share for different levels of globalization
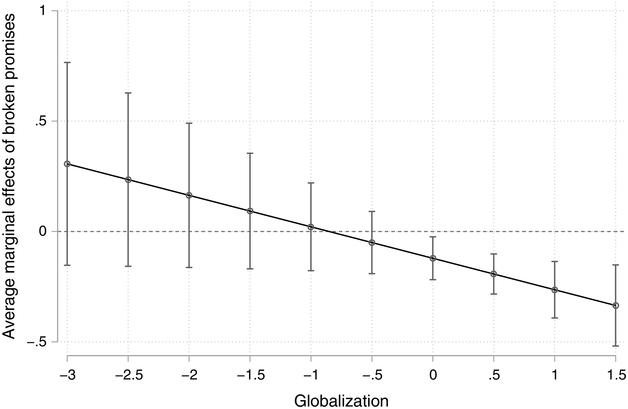
As expected, the sanctioning effect is more pronounced when countries are deeply integrated into the global economy. It is significant only for countries at higher levels of integration. This finding shows that globalization has not let governing parties “off the hook” for promise breaking. On the contrary, it is particularly since the onset of globalization that promise keeping has become a more important feature of voters’ assessment of governing parties’ performance. The negative effect of broken promises is significant for values of Globalization that are at or above the mean of integration across countries. In line with findings by Hellwig (Reference Hellwig2015), to the extent that voters find it difficult to use the economy as a benchmark for assessing performance, they rely more heavily on other factors including noneconomic policy performance and the ability of governing parties to keep their campaign promises.
Survey Experiment
To further analyze the political consequences of promise breaking, we use an original preregistered survey experiment that we fielded online in the United States with YouGov in the summer of 2024.Footnote 4 Respondents were recruited by YouGov, an international survey firm. YouGov uses a combination of quotas to closely match the US population of adults of 18 years or older by age, gender, education, race, 2020 presidential vote, and region, based on the last census. The sample includes 4,277 respondents after removing respondents who failed the attention checks. The sample is well balanced across various important characteristics.Footnote 5 In this chapter, we focus on a sample of 1,407 respondents who receive a version of the questionnaire in which a fictive politician makes a clear promise and then either breaks or keeps that promise. We examine other parts of the sample in Chapter 10.
Focusing on the United States allows us to prioritize internal validity through a controlled experimental design that directly tests the micro-level mechanisms linking promise breaking and electoral punishment. While this necessarily entails a trade-off in terms of external validity, our aim in this part of the chapter is not to generalize across all democracies but to isolate causal effects in a theoretically rich and substantively important setting. The United States is well suited for this purpose: As the world’s oldest democracy and one that is exposed to globalization, it offers a critical context in which the tensions between campaign promises and international economic constraints are highly salient. In addition, it allows us to build directly on a prior experimental study (Simas, Milita, and Ryan Reference Simas, Milita and Ryan2021), extending its framework to explicitly incorporate the role of globalization in shaping voters’ responses.
Institutional differences – particularly the fact that US parties are generally less coordinated than those in parliamentary systems – may limit the generalizability of findings to other contexts. Nonetheless, the strength of this approach lies in its ability to uncover whether and how voters respond to different types of promise violations when globalization is invoked as a background condition. Moreover, this experiment does not stand alone. It complements the large-n cross-national study of elections and promise keeping that we also conduct in this chapter. Together, these analyses combine the inferential leverage of experimental design with the broader scope of comparative data, advancing our understanding of how globalization shapes democratic accountability across different institutional and national contexts. It also complements experimental studies of promise breaking in other country contexts (Bonilla Reference Bonilla2022, Reference Bonilla2025; Naurin and Oscarsson Reference Naurin and Oscarsson2017; Naurin, Soroka, and Markwat Reference Naurin, Soroka and Markwat2019). Future work could expand this approach to additional cases to assess how our findings carry across different settings, but this chapter offers a crucial first step in uncovering the causal logic behind voters’ responses to promise breaking in a globalized environment.
We use the survey experiment to test whether promise breaking is costly, and the conditions under which those costs are strongest. Our main theoretical interest lies in whether sanctioning is significant even in the face of globalization shocks that may “excuse” the breaking of a promise. To do so, we provide some respondents with information on globalization shocks in the form of unexpected events related to the international economy that may make it more difficult for politicians to keep a particular promise. The survey allows us to compare respondents’ approval of politicians who break (or keep) their promises with and without globalization shocks. Our theoretical argument implies, and the evidence supports, that globalization shocks do not lower the political costs of breaking promises in the form of politicians’ approval ratings. In further analyses, we also explore whether the sanctioning effect is stronger for voters who care more about promise keeping, which it indeed is.
We first collect information on respondents’ party identification and their position on providing tax incentives for large companies in their state. We use corporate tax incentives as the policy focus for several reasons. First, it is an electorally salient issue that routinely features in state and national campaigns, making it familiar and meaningful to respondents. Second, it is an area where globalization-related pressures – such as international tax competition and capital mobility – create clear, comprehensible constraints that make the logic of promise breaking readily interpretable to survey participants. Third, it provides a plausible and realistic test case for our theory: it is policy-relevant without being so emotionally charged that affective polarization overwhelms evaluative judgment. This makes it particularly well suited for isolating the effects of promise breaking, especially under globalization constraints, without conflating those effects with strong prior beliefs or identity-driven reactions.
For party identification we ask respondents:
In politics today, do you consider yourself a Republican, a Democrat, an independent or something else?
Figure 6.4 presents descriptive statistics. Our sample contains an almost even number of Republicans and Democrats with a lower number of Independents.
Political affiliation
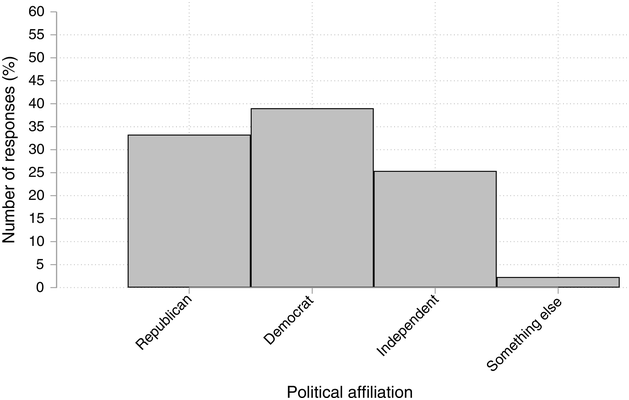
For respondents’ preferences on tax policies, we ask:
We are interested in your opinion about tax incentives or tax breaks for large companies. Some argue that tax incentives for large companies are good because they encourage companies to stay in the state, contributing to economic growth and job creation. Others argue that tax incentives are bad because they often fail to produce jobs and they reduce government revenues for policies to stimulate economic growth, create jobs, and provide public services including education. State legislatures consider tax incentives for large companies on a regular basis. In general, are you in favor or against tax incentives for large companies in your state?
Possible responses were strongly in favor, somewhat in favor, neither in favor nor against, somewhat against, strongly against.
Figure 6.5 presents descriptive statistics. Almost two thirds of respondents in our sample are somewhat or strongly in favor of tax incentives (62.7 percent), but there is variation in favor and against tax incentives across the sample.
Support for tax incentives
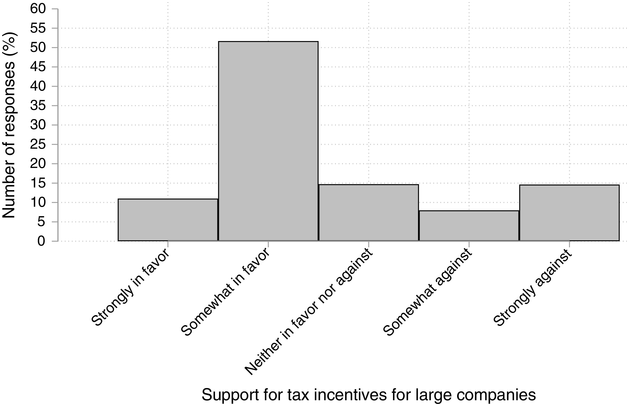
Figure 6.5 Long description
A histogram where the x-axis shows varying levels of support for tax incentives, namely strongly in favor, somewhat in favor, neither in favor nor against, somewhat against, and strongly against, while the y-axis shows number of responses from 0 to 60%. An obvious majority are somewhat in favor at more than 50%.
Based on this information, we present the respondents with a hypothetical political candidate (Gary Clark) who is running for state elections and makes statements about corporate tax policies:Footnote 6 Each respondent was assigned with a candidate of their own preferred political party (Republican/Democrat) and with statements that align with their preferred corporate tax policies.Footnote 7 For example, Democrats who oppose tax breaks receive a Democrat candidate who opposes tax breaks, and Republicans who oppose tax breaks receive a Republican who opposes tax breaks. These two design choices allow us to isolate the direct effect of promise breaking by holding constant factors such as partisanship and policy agreement. While prior research shows that voters are less likely to punish parties for breaking promises they favor or from parties they identify with, our objective here is not to test the moderating role of those factors. Instead, we aim to estimate the baseline electoral penalty for promise breaking in a controlled setting. Future research could usefully explore how this penalty varies by voters’ ideological alignment or partisan attachment. The results are the same if we estimate the models by Democratic and Republican respondents separately. Respondents who oppose tax incentives receive the following clear promise, in which Gary Clark pledges to end tax breaks:
We need to make sure that large companies pay their fair share in our state, so that we can invest in policies that promote economic growth and give hard-working Americans the chance to join or maintain their place in the middle class. I will fight to end tax breaks for large companies in our state.
Respondents who support tax incentives receive the following clear promise, in which Gary Clark proposes to expand tax incentives:
We must promote economic growth, create new jobs, and give hard-working Americans the chance to join or maintain their place in the middle class. I will fight to expand tax incentives for large companies in our state, so they stay and grow, and contribute to this goal.
We then inform the respondents that Gary Clark won a seat in the state legislature and that the state legislature must vote on a bill that will introduce new large tax incentives for large companies.Footnote 8
Our second treatment involves a globalization condition for half of our respondents (the control group does not get any treatment and serves as our sample for testing our first hypothesis). The globalization condition introduces a globalization shock that makes the policy that Gary Clark favored (and the respondent preferred) less feasible. Half of the respondents who oppose tax incentives are treated with the following information (the other half receives no information):
Between the election campaign and the vote, large companies began moving their operations to foreign countries that offered new tax incentives. This threatened to increase unemployment and the state’s ability to fund public services because of falling tax revenues. This was a big part of the debate on the bill introducing new large tax incentives for large companies. Some people who were previously against tax incentives for large companies now argued in favor of them in this new situation.
Half of the respondents who favor tax incentives are treated with this alternative information (the other half receives no information):
Between the election campaign and the vote, the global economy and our main overseas markets took a significant downturn. This threatened to increase unemployment and the state’s ability to fund public services because of falling tax revenues. This was a big part of the debate on the bill introducing new large tax incentives for large companies. Some people who were previously in favor of tax incentives for large companies now argued against them in this new situation.
It is important to note that we do not use this treatment to test our broader theoretical expectation that voters place greater emphasis on promise keeping in more globalized contexts. We cannot directly test this hypothesis in the experiment as all respondents are exposed to the same treatment and we lack variation in levels of globalization. Instead, the goal of this treatment is narrower: to assess whether politicians can avoid electoral punishment by providing a plausible, externally imposed justification – here, a credible constraint stemming from economic globalization – for breaking their promise.
Our third treatment is Gary Clark’s vote on the bill. We randomize respondents such that half of the respondents are informed that Gary Clark voted in favor of the bill, and half of the respondents are informed that Gary Clark voted against the bill. This means that across the possible positions in favor or against tax incentives, individuals are randomly confronted with a situation where Gary Clark breaks his promise and a situation where Gary Clark keeps his promise.
After we provide respondents with Gary Clark’s vote, we ask them to evaluate him on his “likeability.” Respondents rate Gary Clark on a scale from 0 to 10 where 0 is “dislike a great deal” and 10 is “like a great deal.” We follow Simas et al. (Reference Simas, Milita and Ryan2021) and choose to measure likeability rather than asking directly whether respondents would vote for the candidate because likeability is a widely used proxy in political psychology for overall candidate evaluation and avoids conflating respondents’ judgments with partisan or strategic considerations. Asking about vote choice can introduce noise unrelated to the treatment (e.g., respondents factoring in broader political preferences, tactical voting, or assumptions about candidate viability). In contrast, likeability captures an immediate evaluative reaction to the candidate’s behavior – in this case, promise keeping or breaking – which is especially useful for isolating the perceived integrity or appeal of the candidate independent of party or ideology.
We also ask respondents whether the following phrases describe Gary Clark:
1. Someone who represents his constituents well.
2. A politician who is open minded.
3. A person who lacks integrity.
4. A politician who keeps his campaign promises.
5. A politician who adapts well to changing circumstances.
6. A politician who is competent.
Breaking Promises Causes Voters to Punish Politicians …
To test the empirical implications of our argument, we use parsimonious difference-between-means tests. We start with a test of our main expectation that promise breaking is generally costly to politicians. Figure 6.6 presents the findings of a difference-between-means test for the likeability of politicians who keep their promises compared with politicians who break their promises both in the absence of information about an unhelpful globalization shock (top graph) and in the presence of objective information about an unhelpful globalization shock (bottom graph).Footnote 9
Main experimental results.
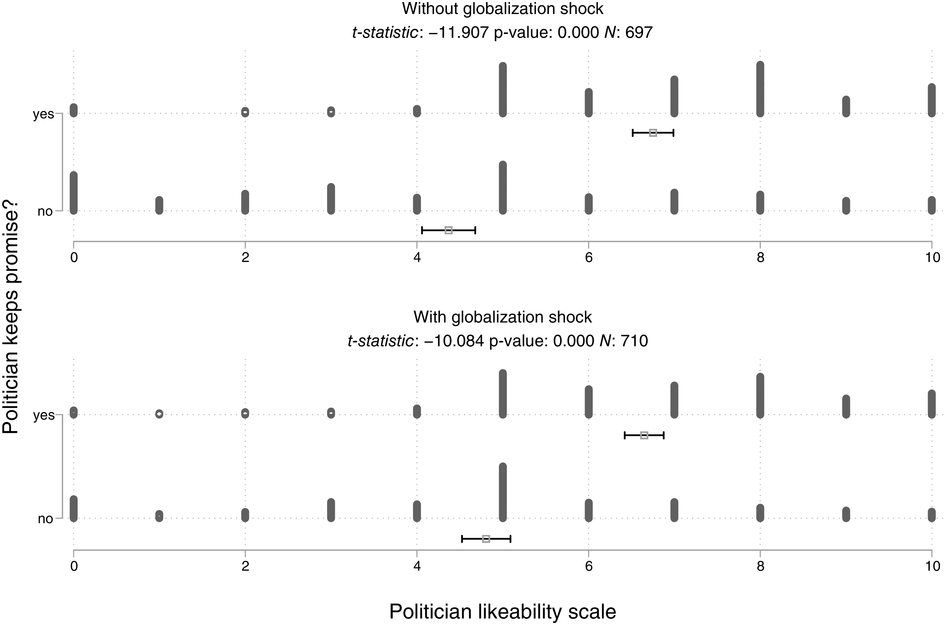
Figure 6.6 Long description
Two horizontal bar graphs comparing general response distribution where the x-axis outlines the politician likeability scale from 0 to 10 and the y-axis represents the frequency within each rated sample, in this case labeled yes and no regarding whether the politician keeps his promise. The top graph is without globalization shock and has 697 observations, a t-statistic of negative 11.907, and a p-value of 0.000. The bottom graph is with globalization shock and has 710 observations, a t-statistic of negative 10.084, and a p-value of 0.000. The mean for each sample is represented by a light gray square with black bar confidence intervals. Both graphs show very similar results.
The findings in Figure 6.6 provide strong support for our expectation that promise breaking is costly for politicians, with or without globalization shock. Respondents who are treated with a politician who breaks his promise tend to rate that politician significantly lower on the likeability scale than respondents who are treated with a politician who keeps his promise (p<0.001). The effect is substantially large. On a scale from 0 to 10 (where 0 implies that respondents do not like the politician at all, and 10 that the respondents like the politician very much), a politician’s likeability decreases from 6.75 to 4.37 if he breaks his campaign promise when no globalization shock occurs (Figure 6.6, top graph, p<0.001). This first finding reinforces the results of our observational study and those of previous studies.
Table 6.1 shows that these results are robust to different outcomes.Footnote 10 Respondents who are informed that Gary Clark voted against their preference on tax policies are significantly less likely to believe that Gary Clark represents his people well, is open-minded, has integrity, is good at keeping promises, and is competent than respondents who are treated with a Gary Clark who fulfills his promise.
| Broken | Fulfilled | Diff | p-value | |
|---|---|---|---|---|
| Represents people well | 4.72 | 6.73 | 2.01 | 0.00 |
| Open minded | 5.21 | 6.22 | 1.02 | 0.00 |
| Lacks integrity | 5.70 | 3.55 | −2.15 | 0.00 |
| Good at keeping promises | 3.98 | 7.04 | 3.06 | 0.00 |
| Adapts well to changing circumstances | 5.30 | 6.14 | 0.84 | 0.00 |
| Competent | 5.13 | 6.80 | 1.66 | 0.00 |
Note: The table presents the results of difference-between-means tests, comparing the treatment group where the politician keeps his promise to the treatment group where the politician breaks his promise. All items asked respondents to rate the politician on a 0–10 scale.
… Even When Adverse Globalization Shocks Occur
We also find that respondents consider information about a globalization shock that makes the preferred policy less feasible, but they still hold their politicians accountable. As shown in the bottom graph of Figure 6.6, respondents rate politicians who break promises significantly lower than those who keep their promises, even when an unhelpful globalization shock occurs. Like the scenario without globalization shock, the penalty for breaking promises is substantial with the politician’s likeability dropping from 6.65 to 4.81 on a scale from 0 to 10 (p<0.001).
The findings support our argument that blaming globalization does not allow politicians to evade the political costs of breaking promises, even if presented to voters in the form of objective information rather than an excuse made by a promise-breaking politician. However, Figure 6.6 does provide some indication that the globalization shock might ameliorate the political costs slightly.
In additional exploratory analysis, which we did not preregister, we compare the means for Politician Likeability in situations where the politician breaks the promise and no globalization shock occurs in situations where the politician breaks his promise, but a globalization shock does occur. The results presented in Figure 6.7 indeed show that the information reduces the punishment effect significantly (p<0.042) but the effect is substantively very small. Politicians who break their promises but can reference a negative globalization shock receive an average likeability score of 4.81. If they cannot justify their failure to deliver on their promises by referencing a globalization shock their likeability declines to 4.37. These effects are in line with previous findings on blame avoidance (Bonilla Reference Bonilla2022). While the difference is small in substantive terms, we might expect the difference would be even smaller when politicians cannot rely on the objective information of a globalization shock. Overall, these findings support our argument that politicians cannot evade sanctioning by referencing negative globalization shocks that constrain their ability to deliver on their promises.
Globalization shock’s limited benefit
Figure 6.7 Long description
The x-axis shows the politician likeability scale from 0 to 10 and the y-axis distinguishes between with and without globalization shock, specified by yes and no labels. The mean for each sample is represented by a light gray square with black bar confidence intervals. The plot has 690 observations, a t-statistic of negative 2.039, and a p-value of 0.042.
… And When Promise Keeping Is More Important to Voters
Finally, we explore whether the punishment for promise breaking is particularly strong when respondents care a lot about promise keeping. Before the experimental treatments were applied, we ask respondents whether politicians can be right to break their campaign promises when circumstances change between the election campaign and their time in office. Figure 6.8 presents a histogram of the responses. Almost two thirds of respondents (64 percent) do not believe that politicians can be right to break promises if circumstances change after an election. This again reinforces the prominence of promise keeping in the minds of citizens, which is consistent with the theory of promissory representation.
Importance of promise keeping and retrospective sanctioning
Figure 6.8 Long description
A histogram where the x-axis shows varying agreement with the idea that politicians can be right to break promises, namely strongly agree, somewhat agree, neither agree nor oppose, somewhat oppose, and strongly oppose, and the y-axis shows the number of responses from 0 to 35%. An obvious minority strongly agree at less than 10%.
Figure 6.9 compares respondents who believe that politicians should generally keep their promises even when circumstances change (top row) with respondents who believe politicians can be right to break promises when circumstances change (bottom row).Footnote 11 We indeed find that promise-breaking politicians are liked significantly less by respondents who believe that politicians should generally keep their promises even when circumstances change. When politicians break their promises, respondents who do not consider promise keeping important still rate them relatively favorably, giving an average likeability score of 5.46. The likeability declines to 4.68 for respondents who believe that promise keeping is important. The effect is statistically significant (p<0.001).
Respondents’ beliefs about promise keeping and retrospective sanctioning
Figure 6.9 Long description
The x-axis shows the likeability scale from 0 to 10 and the y-axis distinguishes between respondent sentiment regarding broken promises, labeled yes if politicians can be right in doing so and no if they can't. The mean for each sample is represented by a light gray square with black bar confidence intervals. The plot has 690 observations, a t-statistic of 4.493, and a p-value of 0.000.
Citizen Perspectives
The previous sections reveal important patterns in democratic accountability. However, these approaches necessarily abstract away from the rich, contextual, and personal ways in which voters experience political betrayal. To further explore the enduring consequences of breaking campaign promises, this section shifts our analytical lens from aggregate patterns and causal effects to individual-level experiences, examining how French citizens who voted for the Socialist Party candidate François Mitterrand in 1981 made sense of the broken campaign promises that followed his election. Through semistructured interviews with eighteen French citizens who supported François Mitterrand in 1981, we examine the complex emotional terrain that lies between the moment when promises are broken and the electoral sanctions that may follow years later. This approach allows us to understand not just that voters punish promise breaking, but how they interpret, rationalize, and emotionally process these experiences of broken campaign promises. The analyses in this section move beyond overt punishment by citizens to demonstrate that memories of broken promises can linger for many decades and have lasting effects on citizens’ views on politics.Footnote 12
The French governing Socialist Party’s dramatic policy reversal in 1983 is an exemplary case of promise breaking under the constraints of economic globalization (Hellwig Reference Hellwig2015). François Mitterrand won the 1981 presidential election to become the first Socialist president of the Fifth Republic. The Socialist Party’s election manifesto was called the 110 Propositions for France, and it contained a range of radical leftist policies including increasing welfare payments, nationalizing banks and key industries, and introducing large job creation programs (Lacombe Reference Lacombe, Gueniffey and Lorrain2018). As the new government began to implement many of these measures, their fiscal and inflationary consequences soon became apparent. These pressures were difficult for the government to reconcile with the constraints of France’s membership of the European Monetary System (EMS) according to which the value of the French Franc was supposed to remain within a narrow range of other EMS currencies. Some of Mitterrand’s advisors called for France to exit the constraints of the EMS and further devalue its currency, but these calls were resisted by a coalition supportive of the European project (Burlaud Reference Burlaud2017). Those in favor of remaining in the EMS argued that exiting it would only worsen the country’s economic woes. France’s dependency on oil imports meant that currency devaluation would have led to even higher import prices. A short period of intragovernment debate was resolved in March 1983, when the government decided to remain in the EMS and implement a series of austerity measures including tax increases and spending cuts. This case “offers the clearest illustration of the triumph of international constraints over national sovereignty. In 1983, just two years after securing election on a pledge to undertake a ‘rupture with capitalism’ and to lift state intervention to new heights … Mitterrand reversed course” (Levy Reference Levy1999: 19).
The negative electoral consequences of this U-turn have been documented extensively. There was an immediate sharp drop in Socialist Party membership as members became disillusioned by the party’s inability to influence government policies (Burlaud Reference Burlaud2017). The Socialist Party experienced a dramatic loss in electoral support between the 1981 presidential elections and the 1984 European elections when it lost almost 5 million votes (Levy and Machin Reference Levy and Machin1986). The Socialist Party also fared poorly in the 1986 national legislative elections. Furthermore, many analysts contend that the governing Socialist Party’s broken promises constituted a turning point that fundamentally reshaped French politics. Notably, the French radical-right in the form of the National Front gained popularity around that time. Hargreaves (Reference Hargreaves2012) infers a direct causal link between these developments, noting that it was soon after the Socialist government’s austerity turn of 1983, that a significant portion of the electorate began supporting the National Front, which railed against traditional parties and attempted to refocus the political debate around ethnic differences. In another fundamental shift since the early 1980s, French voters became increasingly skeptical that their national governments could influence economic policies and outcomes, shifting their attention to noneconomic issues (Hellwig Reference Hellwig2015). In short, in line with the analyses presented earlier in this chapter and elsewhere in this book, the French government’s broken promises had a range of clearly quantifiable negative consequences.
The interviews reveal that citizens’ reactions to broken promises are far more layered than simple vote switching or abstention. Most respondents expressed disappointment and disillusionment, yet these emotions coexisted with enduring partisan attachments and a pragmatic understanding of the economic and international constraints that limited government action. Rather than abandoning their political preferences, many reconciled their expectations with perceived realities, maintaining loyalty even as trust eroded. These qualitative findings complement the earlier evidence of electoral punishment, by revealing how disappointment – even disillusionment – can coexist within the same individuals.
Accessing Memories
Semistructured interviews with individual citizens are a well-established method for understanding electoral behavior and citizens’ political reasoning. This method is used in a distinguished tradition in political science research, though its application to retrospective studies of electoral memory presents unique opportunities and challenges.
In-depth interviews with citizens featured prominently in the pioneering work of Paul Lazarsfeld and his colleagues. In their landmark study The People’s Choice (1944), Paul Lazarsfeld, Bernard Berelson, and Hazel Gaudet conducted what is widely recognized as the first systematic panel study of voting behavior during the 1940 presidential election in Erie County, Ohio. Their approach demonstrated the value of combining quantitative surveys with qualitative follow-up interviews to understand vote switching and political reasoning. When respondents changed their vote intentions, they were interviewed in detail about their reasoning, providing insights into the micro-processes of political decision-making that surveys alone could not capture. Through this approach, the researchers captured in vivid and visceral detail how citizens’ votes were influenced by their social environment. For instance, one woman recounted how “[t]he lady where I work wanted me to vote. She took me to the polls and they all voted Republican so I did too” (Lazarsfeld et al. Reference Lazarsfeld, Berelson and Gaudet1944, 157). Similarly, the influential American Voter study by Campbell, Converse, Miller, and Stokes (Reference Campbell, Converse, Miller and Stokes1960) employed extensive face-to-face interviews with voters across multiple presidential elections to reveal the reasoning processes underlying vote choice, particularly through open-ended questions about political attitudes and the factors influencing electoral decisions.
More recent scholarship has demonstrated the value of intensive qualitative research with modestly sized samples of citizens in specific contexts. Katherine Cramer’s The Politics of Resentment (2016) represents a significant contemporary application of semistructured interviews and participant observation in electoral research. Cramer conducted extensive fieldwork across twenty-seven Wisconsin communities, spending time with groups from 2007 to 2012. This involved sustained engagement with citizens in their natural settings, revealing how rural consciousness shaped electoral preferences and political reasoning in ways that large-scale surveys had missed.
The study of citizens’ understanding of campaign promises has particularly benefited from qualitative interviewing methods. Elin Naurin’s book Election Promises, Party Behaviour and Voter Perceptions (2011) employed seventeen in-depth interviews with Swedish citizens to understand why public perceptions of promise keeping diverged so dramatically from scholarly findings. Through careful probing, Naurin discovered that citizens often define promise fulfillment in terms of outcomes they personally experience, while scholars focus on governmental actions. Her interviews revealed that “people emphasize the outcome of politics when they evaluate election promises,” with citizens expecting to see tangible improvements in their daily lives rather than merely policy changes (Naurin Reference Naurin2011: 134). This finding could have emerged only through open-ended conversation that allowed respondents to explain their reasoning in their own terms.
Semistructured interviews are particularly well suited for exploring the emotional and interpretive dimensions of political experience because they allow researchers to probe beyond surface-level responses to understand the reasoning, emotions, and narratives that citizens use to make sense of political events. Unlike structured surveys, which constrain respondents to predetermined categories, semistructured interviews permit the discovery of unexpected themes and perspectives that might not have occurred to researchers in advance. This methodological flexibility is crucial when studying emotional responses to promise breaking, where citizens may employ complex psychological strategies to reconcile their initial support with subsequent disappointment.
Studying citizens’ memories of political events from over four decades ago presents both unique methodological challenges and distinctive research opportunities that make semistructured interviews particularly useful. Research into historical political episodes must depend fundamentally on citizens’ retrospective accounts and the meaning they attach to past events. The challenge of memory decay and reconstruction is well documented in psychological research, yet this apparent limitation becomes a methodological strength when the research question centers on how citizens make sense of political disappointment and promise breaking over time. Citizens’ memories of France in the early 1980s are not simply data to be verified against historical records; they are themselves the primary phenomenon of interest. How citizens remember, interpret, and narrate their experience of broken promises reveals the long-term political consequences of electoral disappointment in ways that contemporaneous data cannot capture. Through careful questioning, interviewers can explore not only what citizens remember about specific events, such as the 1983 austerity turn and specific broken promises, but also how they have come to understand those events considering subsequent political developments. This layered understanding of political memory – encompassing both immediate recollections and evolved interpretations – provides insights into the durability of electoral effects that no other method can achieve. Moreover, the passage of time creates an opportunity for citizens to reflect on political events with a perspective unavailable to contemporary observers. Citizens interviewed today about the Mitterrand presidency can draw connections between 1980s promise breaking and broader patterns in French politics, offering insights into how electoral disappointment shapes long-term political attitudes and party loyalty. This temporal distance allows for a kind of political reflection and analysis that citizens engaged in the immediate aftermath of events may not have been able to articulate.
Respondents were recruited through snowball sampling, a nonprobability sampling method widely used in political science research for accessing specific populations (Tansey Reference Tansey2007). This approach is particularly appropriate when studying populations defined by shared historical experiences, as in this case where the target group consists of individuals who voted in specific French elections over four decades ago. Snowball sampling has been validated in political science research for studying hard-to-reach populations and those with shared characteristics (Heckathorn Reference Heckathorn2011). The sampling process began with two initial contacts known to Emma Suissa, the research assistant who conducted the semistructured interviews. Emma Suissa is a native French speaker and political science undergraduate student at the time of writing. From these initial “seed” contacts, the sample expanded through referrals to eventually include eighteen respondents. This sample size aligns with established practices in qualitative political research, where samples of twelve to twenty-five respondents are typical for in-depth interview studies (Mosley Reference Mosley2013).
The final sample of eighteen respondents achieved substantial demographic variation while maintaining focus on the target population of citizens who voted for Mitterrand in the second round of the 1981 presidential election. The sample included nine women and nine men, with ages ranging from 70 to 88 (mean age 79 years). This age distribution reflects the requirement that participants be old enough to have voted in the 1981 elections. The sample incorporated both working-class and middle-class respondents, including individuals from working-class backgrounds who had achieved middle-class status during their careers. Occupationally, the sample encompassed a diverse range including manual workers (e.g., a carpenter), white-collar professionals (e.g., executive assistants, librarians, archivists), and business managers, reflecting the broader socioeconomic diversity of the French electorate during this period. The eighteen interviewees included two married couples who were interviewed together, though each couple was interviewed separately. This had the advantage that it allowed the couples to reminisce together, which stimulated the memory process. However, because they were interviewed together, these interviewees cannot be considered independent observations and in both cases each husband-and-wife couple expressed the same views and themes. While the respondents represent a diverse range of people, they are clearly not a random sample of French citizens. The purpose of this study is not to make statistical generalizations to the population but rather to explore the meaning of citizens’ long-term emotional responses to broken promises.
The semistructured interview protocol was designed to explore citizens’ emotional responses to promise breaking, their memories of key political events, and the behavioral consequences for their subsequent voting decisions. The French text of the protocol used in the interviews and the English translation can be found in the online Supplementary Material. The protocol was structured around core thematic areas that directly address our central research concern: understanding how citizens experienced and responded to the French Socialist Party’s dramatic policy reversals following the 1981 elections. The interview guide incorporated prompts about major events of the early 1980s to assist respondents in recalling the specific context of the period. The protocol avoided leading questions about promise breaking, instead allowing themes to emerge naturally from respondents’ own narratives about their political experiences during this period. Questions were designed to elicit responses regarding key dimensions: retrospective evaluations of the 1981 campaign promises, perceptions of the government’s performance during the 1981–1986 period, and the influence of these perceptions on subsequent attitudes and voting behavior. This structure enables analysis of both the immediate emotional responses to promise breaking and its longer-term attitudinal and behavioral consequences, addressing a key gap in existing research on promissory representation.
All interviews were conducted by research assistant, Emma Suissa, in the period July to September 2025. The use of a native speaker was essential for capturing the nuanced emotional content of respondents’ recollections and ensuring that subtle aspects of political discourse and memory were not lost in translation. This approach follows established best practices in cross-cultural political research, where linguistic and cultural familiarity can significantly enhance data quality. The interviews were conducted in an informal, conversational style designed to encourage open reflection and storytelling about political experiences. All interviews were digitally recorded with explicit informed consent from participants. The recordings were subsequently transcribed verbatim to preserve the exact language used by respondents, which is crucial for analyzing emotional content and political discourse.
The analysis of interview transcripts followed a thematic analysis approach designed to identify patterns in how citizens experienced and responded to promise breaking (Braun and Clarke Reference Braun and Clarke2006). Thematic analysis was selected as the primary analytical method because of its flexibility in handling the complex emotional and cognitive content of political narratives while maintaining systematic rigor in identifying patterns across cases. This analysis followed the process established by Braun and Clarke (Reference Braun and Clarke2006): familiarization with the data, generation of initial codes, searching for themes, reviewing and refining themes, defining and naming themes, and producing the final list of themes. The themes covered personal narratives concerning political attitudes and emotional responses to political events. An initial list of themes was generated by large language model (LLM) analysis, which represents an emerging practice in qualitative research, where LLMs can assist in identifying patterns and themes while providing a point of reference for human analysis. The LLM analysis was conducted using Anthropic’s Claude 3.5 Sonnet, and the specific prompt used is provided in the online Supplementary Material. The LLM analysis does not replace human judgment but provides an additional analytical perspective that could highlight themes or patterns that might be overlooked by a single human coder. We then compared and integrated the themes generated with the help of the LLM with a list of themes we generated independently. After formulating the final list of themes, each transcript was tagged with the themes it contained to enable comparison across respondents and identification of both common patterns and significant variations (Guest, MacQueen, and Namey Reference Guest, MacQueen and Namey2012). Throughout the analysis, particular attention was paid to selecting representative quotations that exemplify key themes while preserving respondent anonymity.
Mapping Emotional and Cognitive Responses
The semistructured interviews with eighteen French citizens who voted for François Mitterrand in 1981 reveal a complex and nuanced pattern of responses to the Socialist government’s dramatic policy reversals following the 1983 austerity turn.Footnote 13 Rather than a uniform reaction of electoral punishment, our thematic analysis uncovers six distinct but often overlapping dimensions of citizens’ emotional and cognitive processing of broken campaign promises. These themes illuminate the various ways in which voters navigate the tension between democratic expectations, performance, and economic constraints. Table 6.2 summarizes the themes, which we discuss and illustrate one by one.
| Theme | Number of interviewees (out of 18) |
|---|---|
| Theme 1: Disappointment in Mitterrand and/or the Socialist Party Government of the 1980s | 11 |
| Theme 2: Disillusionment and loss of trust in political parties | 12 |
| Theme 3: Memories of better times | 18 |
| Theme 4: Economic constraints and realism | 14 |
| Theme 5: Persistent Socialist identity | 17 |
| Theme 6: Migration to far-left or far-right parties | 2 |
Note: Frequency of themes extracted from interviews with eighteen French citizens.
Theme 1: Disappointment in Mitterrand and the Socialist Party Government
The first theme captures the immediate emotional responses of citizens who experienced direct disappointment with Mitterrand’s failure to fulfill his campaign promises. This theme was present in the transcripts of interviews with eleven of the eighteen interviewees, indicating that most of them felt some degree of personal letdown with the Socialist government’s performance during the 1980s. However, this disappointment was distinct from broader systemic disillusionment with politics as this theme focuses specifically on Mitterrand and his government’s policy reversals rather than democratic institutions more generally.
Marie-Claire exemplifies the intensity of this disappointment, repeatedly emphasizing her emotional response:
Tout ce que je retiens de Mitterrand, c’est qu’il n’a pas tenu … Ah oui, déçu, déçu, déçu. (All I remember about Mitterrand is that he didn’t keep [his promises] … Oh yes, disappointed, disappointed, disappointed).
The repetition in her language conveys not merely cognitive dissatisfaction but genuine emotional pain at the experience of broken trust. Similarly, Philippe expressed feeling both “Déçu, déçu. Déçu et trahi, bien sûr” (“Disappointed, disappointed. Disappointed and betrayed, of course”), using the stronger term “betrayed” to indicate that his disappointment carried moral dimensions beyond simple policy disagreement.
Henri’s disappointment focused on specific policy reversals, particularly the abandonment of nationalization promises:
Il n’a pas tenu ses promesses. C’était quoi les promesses? Il devait nationaliser … Et quoi d’autre? Oui, c’est plus une politique de rigueur (He didn’t keep his promises. What were the promises? He was supposed to nationalize … And what else? Yes, it became more of an austerity policy).
This quote illustrates how disappointment often stemmed from citizens’ clear recollection of specific commitments that were subsequently abandoned.
Notably, not all respondents experienced this theme despite supporting Mitterrand in 1981. Some respondents demonstrated a more pragmatic attitude toward promise keeping, suggesting that individual personality and expectations shaped the emotional impact of policy reversals. The prevalence of this theme nonetheless indicates that most citizens who invested hope in Mitterrand’s Socialist vision experienced genuine disappointment when that vision was abandoned for austerity measures.
Theme 2: Disillusionment and Loss of Trust in Political Parties
Building beyond specific disappointment with Mitterrand, the second theme encompasses broader systemic disillusionment with political parties and democratic representation itself. This theme appeared in the transcripts of twelve of the eighteen respondents, indicating that the 1983 policy reversals often catalyzed more fundamental skepticism about the capacity of any political party to deliver on campaign promises.
Bernard captured this systematic skepticism:
On ne peut pas avoir confiance totalement aux promesses de nos formations politiques. Parce que tant qu’il soit eu, on change de proposition (We can’t have complete confidence in the promises of our political formations. Because as soon as they’re elected, they change their proposals).
This quote reveals how the specific experience of Socialist broken promises generalized into a broader skepticism about the reliability of campaign commitments across the political spectrum.
Henri’s analysis extended this disillusionment to understanding its broader electoral consequences:
Il a bluffé un peu les Français … Il y en a beaucoup qui ont été vraiment déçus et qui n’ont plus voté socialiste après (He kind of bluffed the French … Many were really disappointed and never voted Socialist again).
This observation suggests that Theme 2 represents not just individual attitude change but a collective erosion of trust that had lasting consequences for French electoral politics. Meanwhile, Monique’s disillusionment focused specifically on the Socialist Party’s contemporary condition:
Le parti socialiste, il m’a tellement déçu … Il n’y a plus de vrais socialistes (The Socialist Party has disappointed me so much … There are no real Socialists left).
Her language suggests that the 1983 experience fundamentally altered her understanding of what the Socialist Party represented, creating a sense that authentic left-wing politics had been permanently compromised.
The significance of this theme lies in its institutional implications. Unlike Theme 1’s focus on specific personalities or governments, Theme 2 represents a more profound challenge to democratic representation itself. Citizens experiencing this disillusionment may continue to participate in electoral processes while maintaining systematic skepticism about politicians’ capacity to deliver on their commitments, a pattern that could undermine the foundation of democratic accountability.
Theme 3: Memories of Better Times
Despite disappointment and disillusionment, all eighteen respondents had positive recollections of the early 1980s period, making this the most universal theme in our analysis. These memories encompassed both the political excitement surrounding Mitterrand’s 1981 victory and personal or family economic security during the early years of his presidency. The universality of this theme suggests that even citizens who became highly critical of Mitterrand’s later performance retained fond memories of the hope and prosperity that characterized the initial period.
The political dimension of these memories often focused on the historic significance of Mitterrand’s election. Jacqueline and Marcel vividly recalled the celebration:
Enfin ça a été vraiment une explosion de joie … On était tous très heureux … on a bu champagne… c’était un jour de gloire … je me rappelle vraiment cette image quand il a défilé sur les Champs-Élysées (It truly was an explosion of joy … We were all very happy … we drank champagne … it was a day of glory … I really remember that image when he paraded on the Champs-Élysées).
This quote captures the euphoric atmosphere surrounding the first Socialist presidency of the Fifth Republic and suggests that these memories remained emotionally significant despite subsequent disappointments. Marie-Claire’s recollection emphasized the community dimension of the celebration:
Et puis Mitterrand, on a fait une fête. … On habitait un immeuble et plein de gens de l’immeuble sont venus (And then when Mitterrand won, we threw a party. We lived in an apartment building and lots of neighbors came).
These memories reveal how Mitterrand’s victory created moments of social solidarity and shared political identity that transcended individual voting behavior.
The economic dimension of these memories focused on personal and family prosperity. Colette fondly recalled:
On vivait bien. On avait un bon salaire. C’était la belle vie (We lived well. We had a good salary. It was the good life).
Henri similarly remembered:
La situation économique, pour nous, elle était bonne. Il y avait de l’emploi. Il n’y avait pas de problèmes (The economic situation, for us, was good. There were jobs. There were no problems).
The persistence of these positive memories despite subsequent disappointment suggests their importance in maintaining citizens’ connection to democratic politics. These recollections may serve as a psychological resource that enables citizens to maintain hope for political change even when experiencing systematic disillusionment with political parties. The universality of Theme 3 indicates that the early 1980s represented a genuinely positive period in these citizens’ political lives, creating a benchmark against which subsequent political experiences were measured.
Theme 4: Economic Constraints and Realism
A substantial majority of respondents (fourteen of eighteen) demonstrated understanding of the economic constraints that limited the Socialist government’s ability to fulfill its campaign promises. This theme reveals that citizens’ disappointment with broken promises was often tempered by realistic appreciation of the international and domestic economic pressures that forced policy reversals. The prevalence of this theme challenges simplistic ideas of electoral punishment by showing that many voters developed sophisticated understanding of how economic globalization constrains national government autonomy.
Michel expressed perhaps the most articulated version of this understanding:
On sait bien que les promesses, ça n’engage que ceux qui les reçoivent, pas ceux qui les donnent. Donc non, … il y avait le principe de réalité qui s’appliquait déjà. Et puis en 88, bon, c’était … En Angleterre, il y avait Thatcher. Enfin c’était un peu le tournant neoliberal (We know well that promises bind only those who receive them, not those who give them. So no, … the principle of reality was already at work. And then in ‘88, well, in England there was Thatcher. It was somewhat the neoliberal turn).
His reference to the “principle of reality” and Thatcher’s neoliberal policies demonstrates sophisticated understanding of how international economic trends constrained French policy options.
Jacqueline and Marcel similarly recognized the role of economic pressures in forcing policy adjustments:
Peut-être se sont-ils rendus compte, au bout de 2 ans, que les raisons économiques ont fait qu’ils ont modifié un peu leur programme … tourné un peu la barre à droite (Maybe they realized, after two years, that economic reasons forced them to adjust their program … to steer a bit to the right).
Their language suggests empathy for the government’s difficult position rather than simple condemnation of broken promises.
Monique demonstrated understanding of how globalization specifically constrained socialist policies:
Il y a le début de la mondialisation et du coup ils privatisent … alors que Mitterrand avait promis de nationaliser (Globalization was beginning and so they privatized … whereas Mitterrand had promised to nationalize).
This quote reveals awareness that domestic policy promises could be undermined by international economic forces beyond national government control.
Brigitte explicitly linked policy reversals to European constraints:
En 1983, sous la pression de l’Europe, … il est obligé de faire une politique de rigueur (In 1983, under pressure from Europe, … he was compelled to implement an austerity policy).
Her use of “obligé” (compelled) suggests understanding that the government faced external compulsion rather than free choice in abandoning its socialist program.
The prevalence of this theme indicates that these French citizens developed sophisticated understanding of economic globalization’s impact on national politics. Rather than simply punishing governments for broken promises, many of them recognized the constraints facing elected officials. This understanding may help explain the persistence of democratic legitimacy despite widespread promise breaking, as citizens distinguish between governments that betray their commitments willfully and those that face genuine external constraints.
Theme 5: Persistent Socialist Identity
Despite experiencing disappointment and developing broader disillusionment with politics, almost all respondents (seventeen of eighteen) maintained persistent left-wing or Socialist identities that continued to influence their voting behavior. This near-universal prevalence makes Theme 5 the second-most common pattern in our analysis, suggesting that political identity demonstrates remarkable resilience in the face of broken promises and policy failures.
Many respondents expressed their persistent identity through continued Socialist voting despite their criticisms. Monique exemplified this pattern:
Je votais toujours socialiste, bien sûr (I always voted Socialist, of course).
The casual certainty in her language (“bien sûr”) suggests that continued Socialist voting remained natural and obvious despite her expressed disappointments with the party.
Michel expressed a strong version of persistent identity:
Interviewer: “Vous avez toujours été à gauche?” Respondent: “Oui, j’ai toujours voté à gauche, sauf aux municipales. Mais sinon, j’ai toujours voté à gauche, oui. Oui, je suis viscéralement de gauche” (Interviewer: “Have you always been on the left?” Respondent: “Yes, I have always voted left, except in municipal elections. But otherwise, I have always voted left, yes. Yes, I am viscerally on the left”).
His use of “viscéralement” (viscerally) suggests that his left-wing identity operated at a deep emotional and physical level that transcended rational political calculations.
Marie-Claire’s identity manifested partially through rejection of right-wing alternatives:
Toujours à gauche. À gauche, socialiste. Toujours. … De ma vie, je ne voterai jamais Le Pen. Jamais (Always on the left. Left, Socialist. Always. … In my life, I will never vote Le Pen. Never).
Her emphatic rejection of the far-right demonstrates how persistent Socialist identity could be maintained through negative positioning against unacceptable alternatives.
Jacqueline and Marcel articulated their persistent identity through consistent voting behavior across multiple elections:
À chaque fois qu’on devait voter, à chaque fois, on a voté de gauche … On a revoté Mitterrand … On a voté Hollande … on est restés fidèles à nos idées premières (Every time we had to vote, we voted left … We voted for Mitterrand again … We voted for Hollande … we remained true to our original convictions).
Their language emphasizes fidelity to original political convictions despite changing political circumstances.
The near universality of Theme 5 reveals the deep rootedness of political identity among this group of Socialist voters. Even respondents who expressed strong disappointment or systematic disillusionment typically continued to identify with left-wing politics and vote for Socialist candidates. This persistence suggests that political identity serves as a psychological anchor that enables citizens to maintain democratic engagement even when experiencing repeated disappointments with political performance.
Theme 6: Migration to Far-Left or Far-Right Parties
In sharp contrast to the near-universal persistence of Socialist identity, only two respondents migrated toward far-left or far-right parties following their disappointment with Socialist broken promises. This low prevalence suggests that while broken promises may create conditions for political extremism, most citizens who experience disappointment with mainstream parties do not abandon democratic center-left politics entirely.
The two cases of migration followed different patterns. Colette migrated toward the far-right. Her shift from Socialist to Rassemblement National (formerly Front National) represents the type of electoral migration that analysts have linked to working-class disillusionment with mainstream left parties. By contrast, Bernard migrated toward the far-left, switching to Communist voting:
Interviewer: “Comment avez-vous voté aux élections législatives de 86?” Respondent: “Je pense que j’ai voté communiste” (Interviewer: “How did you vote in the 1986 legislative elections?” Respondent: “I think I voted Communist”).
His migration represents a different pattern, maintaining left-wing identity while seeking more radical alternatives to disappointing Socialist performance.
The rarity of Theme 6 has significant implications for understanding democratic stability under conditions of promise breaking. While broken promises clearly create potential for political extremism, the overwhelming majority of disappointed voters remained within the democratic mainstream. This pattern suggests that other factors, such as persistent political identity (Theme 5) and understanding of economic constraints (Theme 4), may serve as protective factors against extremist migration.
Overlapping Themes and Patterns
The complexity of citizens’ responses to broken promises becomes most apparent when examining theme overlap. Respondents averaged 4.1 themes each, with none expressing fewer than three themes and one respondent expressing all six themes simultaneously. This high degree of overlap indicates that voters’ responses to promise breaking involve multiple psychological processes that operate simultaneously, sometimes in tension with each other.
The most common pattern involved citizens who experienced both disappointment (Theme 1) and persistent Socialist identity (Theme 5), a combination present in 10 of the 11 respondents who felt disappointed. This pattern suggests that disappointment with specific political leaders or policies does not necessarily undermine deeper partisan attachments. Citizens can maintain loyalty to political movements while criticizing their representatives – a distinction that may be crucial for understanding democratic resilience.
Another frequent combination involved understanding economic constraints (Theme 4) alongside either disappointment or disillusionment. Of the fourteen respondents who expressed either disappointment or disillusionment, ten expressed an understanding of economic constraints. This pattern appeared in respondents who developed sophisticated appreciation of globalization’s impact on national politics while simultaneously feeling frustrated by governments’ inability to deliver on promises.
The universality of positive memories (Theme 3) combined with high rates of disappointment and disillusionment is perhaps the most psychologically complex pattern. Citizens retained fond recollections of the early 1980s while simultaneously developing critical perspectives on Mitterrand’s later performance and broader skepticism about political parties. This combination may serve a protective psychological function, enabling citizens to maintain hope for political change by preserving memories of when democratic politics delivered meaningful improvements to their lives.
The demographic composition of our interviewees, mostly middle-class citizens with a mean age of 79 years, provides important context for interpreting these thematic patterns. These respondents came of age during the postwar economic boom and experienced the 1981 election as adults with established political identities and economic security. Their responses to broken promises may therefore reflect generational characteristics that distinguish them from younger cohorts who lack similar experiences of political hope and economic prosperity. The predominance of middle-class respondents (fifteen of eighteen) may help explain the high prevalence of understanding economic constraints (Theme 4) and persistent Socialist identity (Theme 5). Middle-class citizens often possess educational and professional backgrounds that facilitate sophisticated political analysis, enabling them to appreciate complex economic relationships between globalization and domestic policy constraints. Their economic security may also have provided psychological resources for maintaining political engagement despite disappointment and disillusionment. There were no noteworthy differences between men and women in our sample regarding the themes they exhibited.
The advanced age of our respondents raises important questions about generational differences in response to broken promises. Citizens who experienced the hope and prosperity of the early 1980s as adults may possess emotional and cognitive resources for managing political disappointment that younger citizens lack. The universality of positive memories (Theme 3) in our sample may reflect this cohort’s unique historical experience of witnessing significant positive change through democratic politics.
Contemporary French citizens who have experienced primarily promise breaking and economic constraint throughout their adult political lives may develop different patterns of response to democratic disappointment. Younger cohorts as well as less prosperous citizens may be more susceptible to systematic disillusionment (Theme 2) and extremist migration (Theme 6) because they lack compensating experiences of successful democratic performance. This generational hypothesis suggests that the protective factors evident in our analysis – positive memories, understanding of constraints, and persistent identity – may be less available to citizens whose political socialization occurred entirely during periods of economic globalization and governmental constraint.
These thematic patterns illuminate the remarkable complexity of citizens’ responses to broken campaign promises, revealing that democratic accountability operates through multiple psychological mechanisms that often work simultaneously and sometimes in different directions. Rather than the simple disappointment followed by electoral punishment, French citizens’ responses to Socialist promise breaking involved processes of emotional processing, cognitive adaptation, and identity maintenance that appear to have preserved democratic engagement on the part of most interviewees. The prevalence of understanding economic constraints alongside persistent political identity suggests that citizens can develop sophisticated appreciation of globalization’s impact on democratic representation without abandoning democratic participation entirely – a finding with significant implications for understanding democratic resilience in an era of constrained governmental autonomy.
Discussion
The findings presented in this chapter show that retrospective sanctions for promise breaking take place even or especially when countries are deeply integrated into the global economy. In line with previous work, our research shows that voters’ support for governing parties is closely tied to those parties’ record of keeping their campaign promises. Moving beyond previous studies, this chapter demonstrates that globalization creates conditions in which voters place even more emphasis on promise keeping. In a globalized world, voters expect their leaders to demonstrate foresight by crafting realistic promises that consider international constraints, mastering the political process for driving through their proposals and demonstrating the integrity to keep promises reliably. When leaders fail to fulfill their campaign promises, voters are unforgiving, because they view it as a marker of incompetence, which is particularly salient in the context of globalization. Furthermore, the qualitative analyses revealed that promise breaking is associated with disillusionment among citizens, even when those citizens understand the complexity of international economic constraints and maintain partisan loyalties. In this respect, the quantitative analyses do not fully capture the negative electoral consequences of promise breaking.
The finding that voters dislike promise breakers and are willing to punish them at the ballot box even in the context of economic globalization presents a significant dilemma for political parties. Globalization makes it more likely that parties break promises and at the same time increases the severity of electoral punishment for doing so. This forces parties to adapt, often in ways that have serious implications for promissory representation. Parties cannot solve this dilemma by making fewer or even no promises (see the findings in Chapter 4) or by using blame-shifting strategies as indicated by this chapter’s findings. Instead, they adapt partly by making more ambiguous electoral appeals, which make it more difficult for voters to discern whether they indeed broke their promises after the election as a more effective strategy of blame avoidance. Chapters 9 and 10 of this book turn to this strategy of vagueness, which has serious negative consequences for democratic representation.
Before turning to parties’ responses to voters’ retrospective sanctioning, the following chapters analyze how political parties adapt to economic integration by adjusting the contents of their electoral appeals. Chapter 7 examines how globalization influences the types of policy issues that parties choose to emphasize as an important part of their ideological positioning. As countries become more deeply integrated into the global economy, they face pressure to adapt their electoral appeals, particularly in areas related to economic governance and market regulation. This has led parties to shift their positions along the traditional left–right economic spectrum, with many mainstream parties moderating or recalibrating their positions to meet voters’ evolving expectations. In parallel, as set out in Chapter 8, we also observe an increased use of populist appeals, especially by center-right parties, as they seek to address voters’ anxieties about sovereignty, inequality, and globalization’s dislocations without fully abandoning their traditional economic stances.
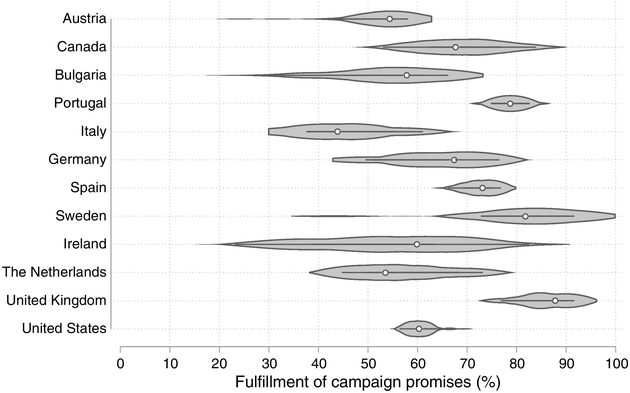
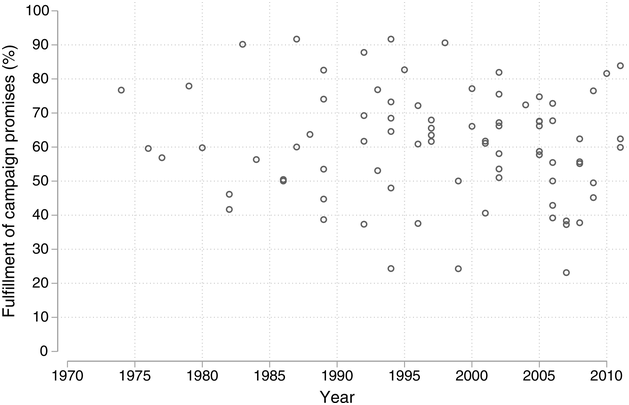
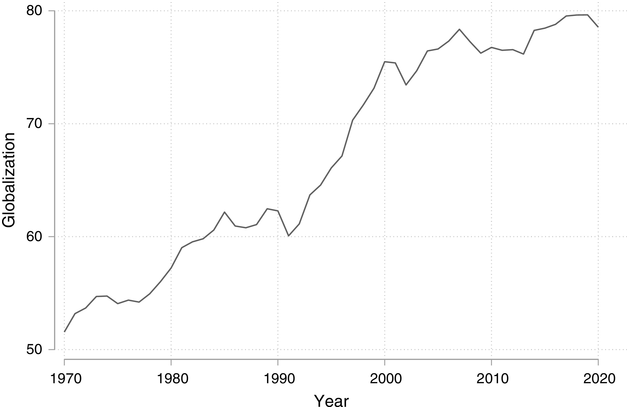
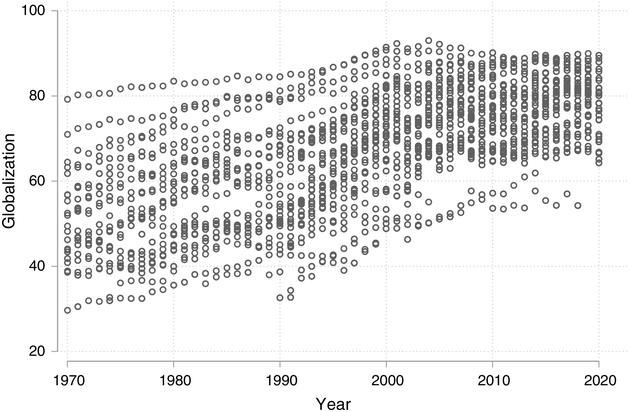
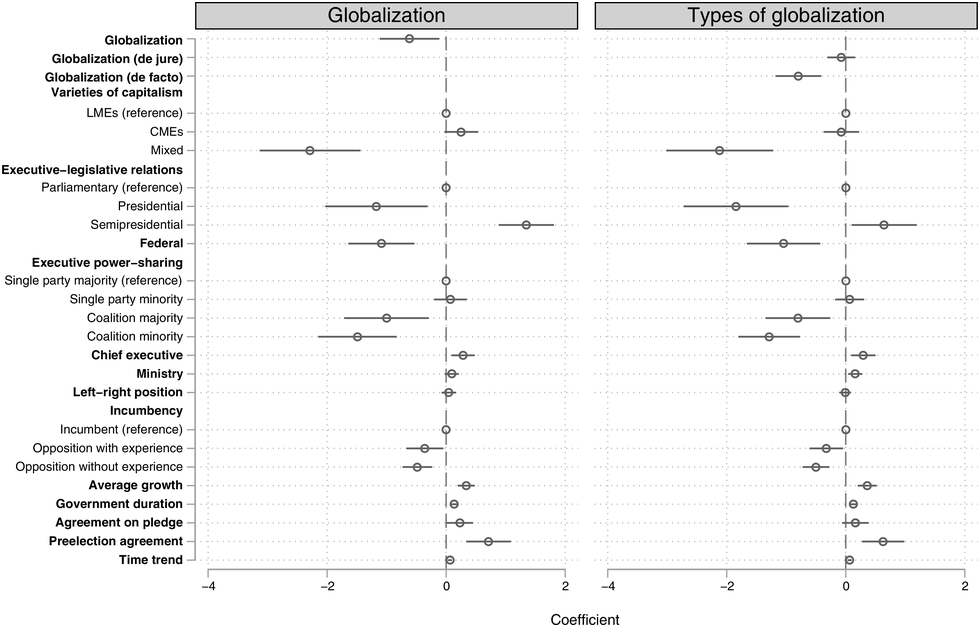
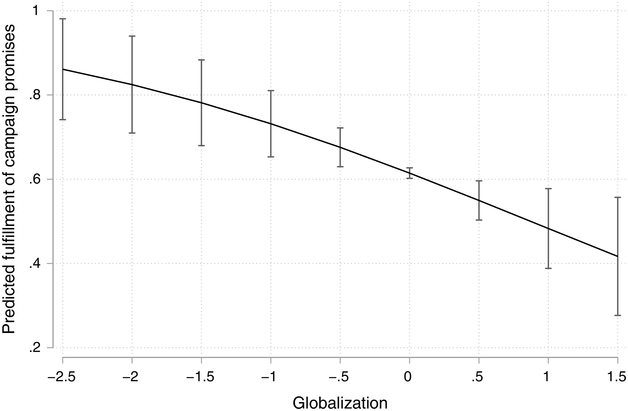
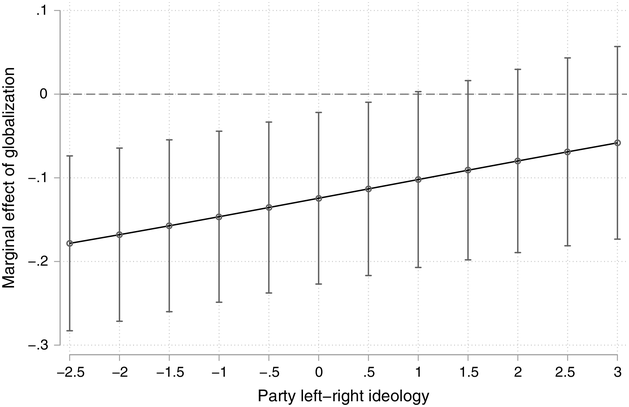
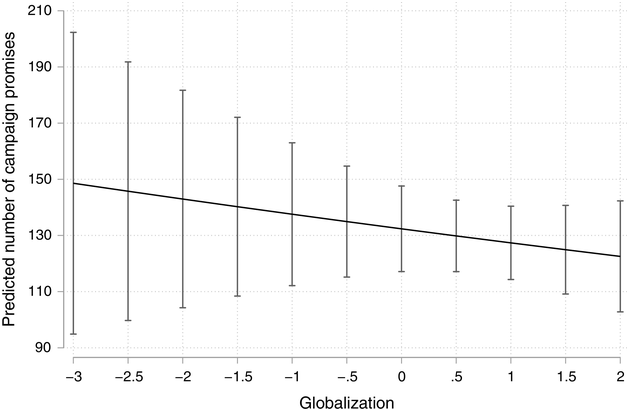
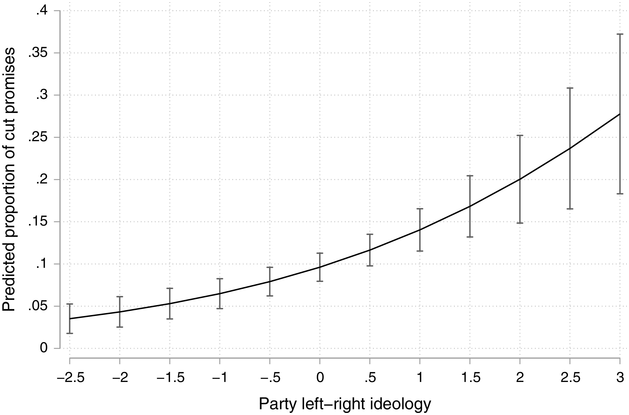
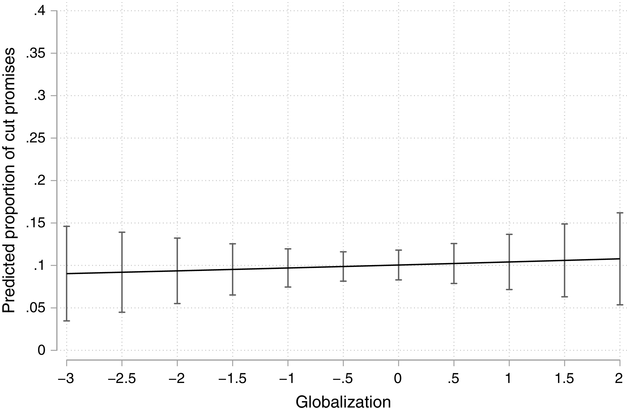
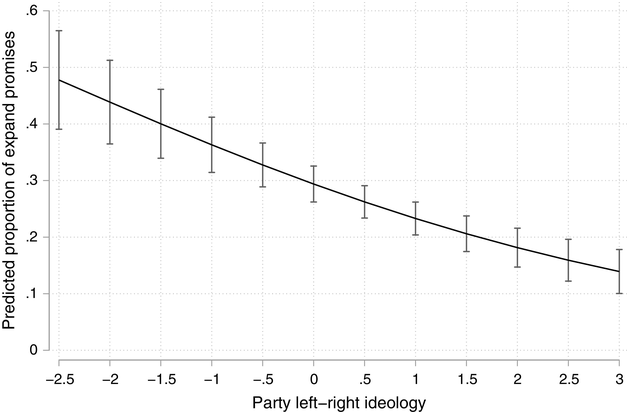
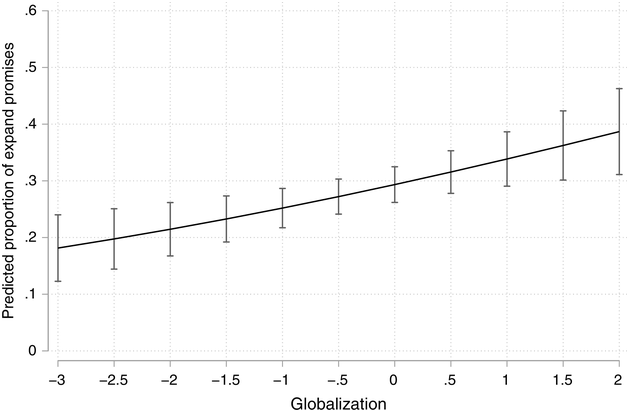
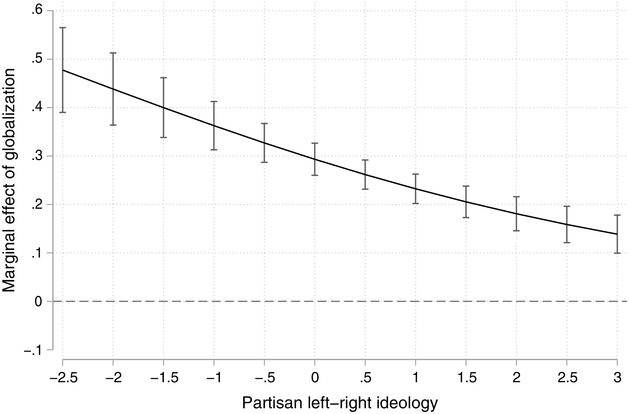
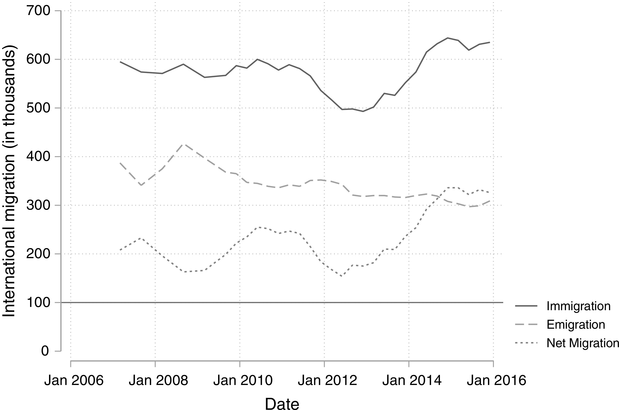
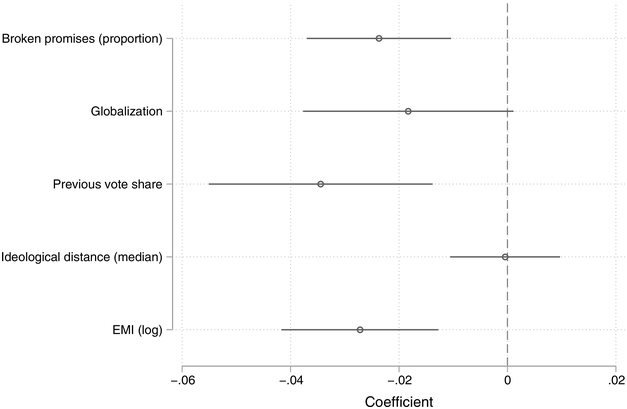
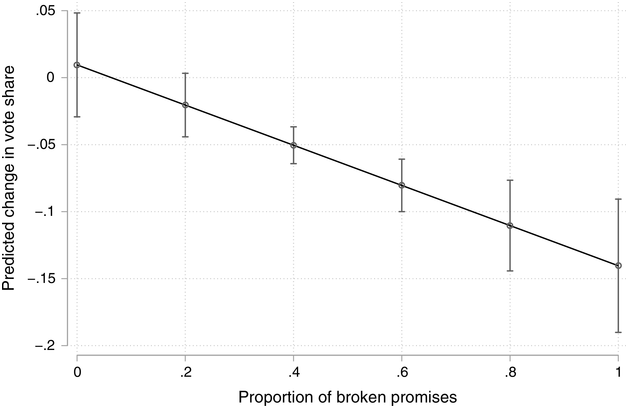
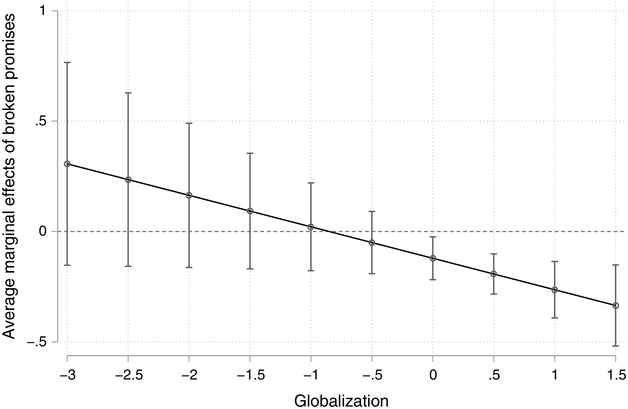
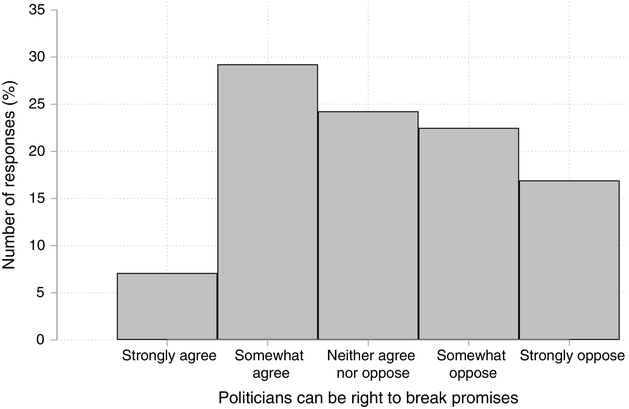
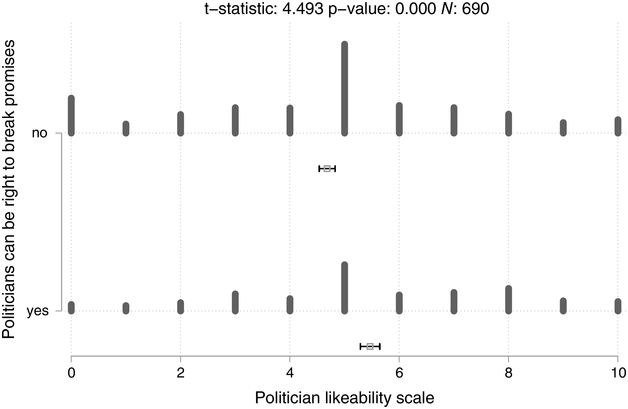

 Open access