

1. INTRODUCTION
Glacier mass balance reflects short- and long-term climatic fluctuation on broader spatial scales (Oerlemans, Reference Oerlemans1994; Haeberli and others, Reference Haeberli, Hoelzle, Paul and Zemp2007; Masiokas and others, Reference Masiokas2015), which clearly indicates the mass budget on the glacier surface. Due to the lagged response of glacier extent to climate change (Oerlemans, Reference Oerlemans2005; Marzeion and others, Reference Marzeion, Cogley, Richter and Parkes2014), the interaction between the glacier and atmospheric conditions is not instantly revealed, whereas mass-balance response is direct and undelayed (Huss and others, Reference Huss, Bauder, Funk and Hock2008; Zemp and others, Reference Zemp, Hoelzle and Haeberli2009). Affected by atmospheric warming, worldwide glaciers have persistently retreated over recent decades (Stocker, Reference Stocker2007). The ongoing glacier mass loss affects human societies by changing the seasonal water cycle, increasing natural hazards and causing sea-level rise (Marzeion and others, Reference Marzeion, Cogley, Richter and Parkes2014).
Known as the ‘water tower of Central Asia’, the Tien Shan are heavily glaciated, with a glacier extent of 13 566.6 km2 (RGI 5.0; RGI Consortium, 2015). Glacier meltwater in summer is the vital source for the local river system in the densely populated, arid and semi-arid lowland in Xinjiang/China, Turkmenistan, Uzbekistan, Kazakhstan and Kyrgyzstan (Hagg and others, Reference Hagg, Braun, Weber and Becht2006). Hence a sound knowledge of glacier status under the impact of climate warming is of great interest for regional economic development and political stability, as it provides more reliable information for water allocation and future projections of water availability (Sorg and others, Reference Sorg, Bolch, Stoffel, Solomina and Beniston2012; Barandun and others, Reference Barandun2015; Farinotti and others, Reference Farinotti2015). Glacier status in the Tien Shan was quasi-stable from the late 1950s to early 1970s (Liu and Liu, Reference Liu and Liu2016); retreat has accelerated, driven by climatic warming, since the 1970s (Cao, Reference Cao1998; Narama and others, Reference Narama, Kaab, Duishonakunov and Abdrakhmatov2010), which has caused widespread academic concern and been addressed in many scientific papers. Glacier mass balance in the Tien Shan has been monitored on several glaciers since the 1950s, in most cases by the former Union of Soviet Socialist Republics (USSR). However, monitoring work was broken off with the disintegration of the USSR in the early 1990s. The labour-intensive and time-consuming nature of in situ mass-balance measurements makes their continuity hard to maintain. Thus direct information on glacier mass balance in the Tien Shan is scarce since 2000. Only Urumqi Glacier No.1 (eastern Tien Shan, China) and TS.Tuyuksu Glacier (northern Tien Shan, Kyrgyzstan) have been monitored and provide long-term mass-balance series, which have been annually submitted to the World Glacier Monitoring Service (WGMS). Glacier mass-balance variation and its response to climatic change have been reported for Urumqi Glacier No.1 (Zhang and others, Reference Zhang, Li, Wang and Wang2014) and comparison between glaciological and geodetic mass balance was conducted for Urumqi Glacier No.1 and Tuyuksu Glacier (Hagg and others, Reference Hagg, Braun, Uvarov and Makarevich2004; Wang and others, Reference Wang, Li, Li, Wang and Yao2014). Over the past decade, the mass-balance change of the entire Tien Shan has been constrained by large-scale satellite measurements (e.g. ICESat, GRACE, satellite stereo-imagery) and glaciological modelling integrated with in situ mass balances (Farinotti and others, Reference Farinotti2015; Pieczonka and Bolch, Reference Pieczonka and Bolch2015; Yi and others, Reference Yi, Wang, Chang and Sun2016; Brun and others, Reference Brun, Berthier, Wagnon, Kaab and Treichler2017). However, the potential bias of the results is still large, due to the sparsity of in situ mass-balance observation and the limitations of remote-sensing data (e.g. sparse spatial sampling, low spatial resolution).
Considering the scarcity of direct mass-balance information, climatic warming and increasing water stress, research interest has been attracted to re-establishing historical mass-balance measurements and reconstructing the mass-balance series in Central Asia (Barandun and others, Reference Barandun2015). Based on in situ mass balance and meteorological data, mass balance for Glacier No.354 and Batysh Sook Glacier in the inner Tien Shan, with short-term mass-balance measurements, has been reconstructed using a distributed accumulation and temperature-index melt model (Kronenberg and others, Reference Kronenberg2016; Kenzhebaev and others, Reference Kenzhebaev2017). Haxilegen Glacier No.51 has been measured by the TianShan Glaciological Station, Northwest institute of Eco-environment and Resources, Chinese Academy of Science (CAS), since 1999. This is one of the best-observed glaciers in the eastern Tien Shan, for its glacier mass balance, terminus, thickness, area and surface velocity. However, the observation was interrupted in some years due to regional political reasons and personnel transfers. In order to re-establish mass-balance measurement, 16 metal stakes were drilled into the ice with a Heucke steam drill, an automatic weather station (AWS) was installed at the glacier terminus and the terminus position was recorded by handheld GPS in August 2017.
Reconstruction and modelling of glacier mass balance are of considerable scientific and practical interest, as the precondition for assessing mass-balance sensitivity to regional climatic fluctuation and extending our knowledge of glacier evolution in the past and future. Temperature-index models (e.g. Hock, Reference Hock2003; Huss and others, Reference Huss, Bauder, Funk and Hock2008; Marzeion and others, Reference Marzeion, Cogley, Richter and Parkes2014; Azam and others, Reference Azam2014; Kronenberg and others, Reference Kronenberg2016; Kenzhebaev and others, Reference Kenzhebaev2017) and energy-balance models (Barandun and others, Reference Barandun2015; Yang and others, Reference Yang, Guo, Yao, Zhu and Wang2016) are common approaches to reconstructing the mass-balance series. Reveillet and others (Reference Reveillet, Vincent, Six and Rabatel2017) reported that the melt models (HTI model, ETI model, SEB model and ATI Model) including solar radiation did not improve the performances of glacier-wide mass-balance modelling. Even if the temperature-index model (classic degree-day model) has limitations in revealing the underlying processes, its ability to simulate the long-term glacier-wide mass balance is sufficient. Besides, the temperature-index model exhibits better performance on mid-latitude glaciers (Sicart and others, Reference Sicart, Hock and Six2008). Therefore, the temperature-index model is suitable for this study, considering the available observations and parameter requirements.
The main purposes of this study are (i) to present the annual mass balance of Haxilegen Glacier No.51 for 7 hydrological years and (ii) to reconstruct the time series of annual mass balance from 1999 to 2015. Based on mass-balance measurements and meteorological data, a temperature-index model together with an accumulation model is applied to reconstruct the annual mass balance of Haxilegen Glacier No.51 from 1999 to 2015. Seasonal mass balance for this glacier is also determined, and the model is used to assess the mass-balance sensitivity to a regional climate fluctuation. Recognizing the scarcity of direct mass-balance measurements in the eastern Tien Shan for a long time, this study supplies new mass-balance information for a glacier since 1999, aiming at providing a basis for further research on mass-balance evolution in Tien Shan.
2. STUDY SITE
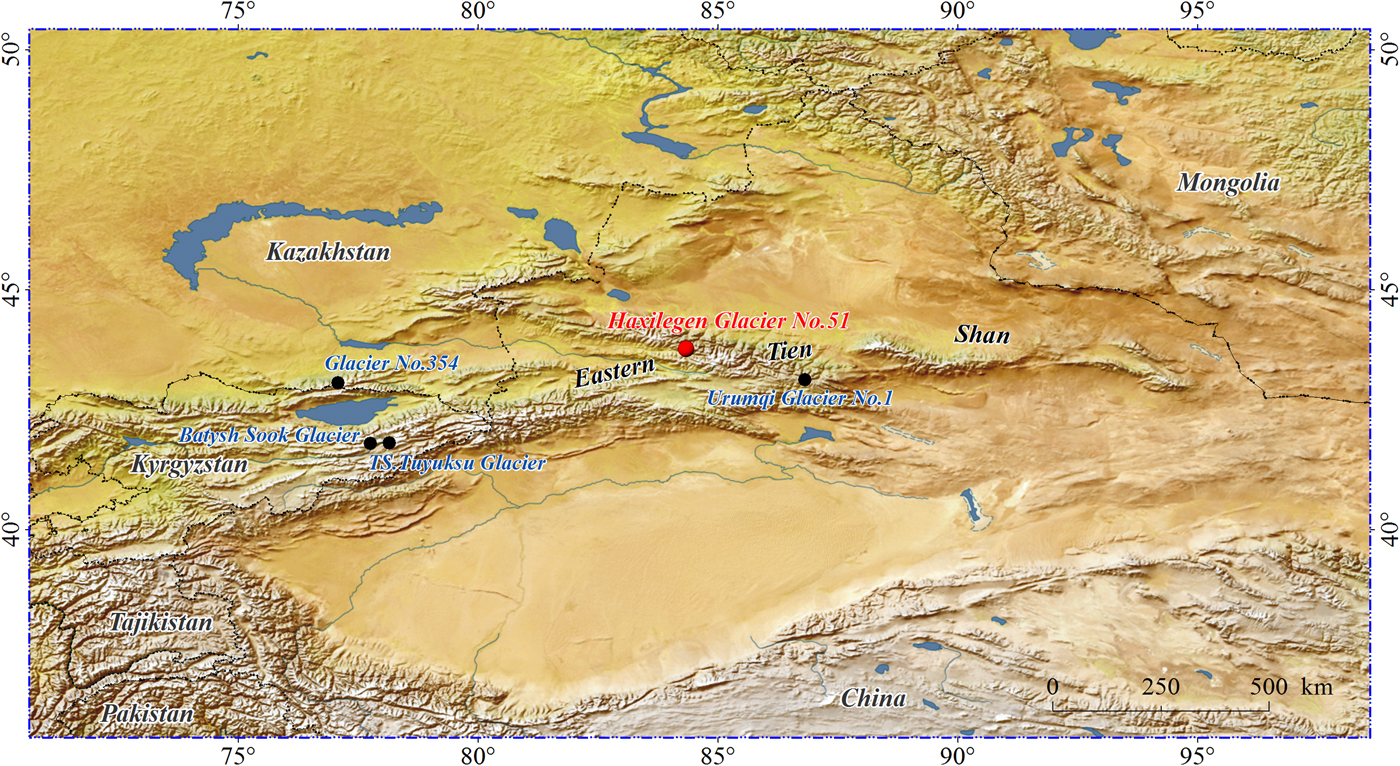
Haxilegen Glacier No.51 (43.731°N, 84.391°E) is a cirque glacier, located in the headwater region of the Kuytun river basin, Erenharbirga range, eastern Tien Shan (Fig. 1). The glacier extends from 3490 to 4000 m a.s.l., with a total length of 1.23 km and area of 1.18 km2. The area reduced by 0.16 km2 and terminus retreated 106.8 m (2.3 m a−1) from 1964 to 2010. For the period of 2000–06, its ice velocity ranged from 1.5~3.1 m a−1 (Wang and others, Reference Wang2016). The glacier has a northeast exposure for its ablation zone, and the accumulation zone is more widely covered by surface crevasses. The glacier terminus is relatively flat, with little debris cover (<1% of total area). This glacier is of summer-accumulation type, with ablation and accumulation maxima occurring simultaneously in the summer period, based on field observations. According to the Chinese concise inventory (Shi, Reference Shi2008), Haxilegen Glacier No.51 can be categorized as a subcontinental-type glacier, which is mainly influenced by westerly air masses.
Location map of Haxilegen Glacier No.51, eastern Tien Shan, China. The black dot indicates the location of four other currently monitored glaciers in Tien Shan.
3. FIELD MEASUREMENTS AND DATA
Mass-balance measurements for Haxilegen Glacier No. 51 were conducted by the glaciological method in 7 hydrological years (1999/2000, 2000/01, 2001/02, 2002/03, 2004/05, 2005/06 and 2010/11) at the beginning of September. An observation network of mass-balance measurements was established in September 1999, consisting of 18–26 metal stakes drilled into the ice with a portable steam drill (Fig. 2). Ablation is obtained by stake reading and snow accumulation is acquired by snow probing at the stake position, including snow depth and density measurements. Point values are integrated and interpolated over the entire glacier to obtain the annual mass-balance contours (m w.e.a−1), and the annual mass balance of the entire glacier is calculated based on the mass-balance maps.
Observation network on Haxilegen Glacier No.51, installed in 1999. Red dots indicate the stakes, blue hexagon shows the position of the two AWS and blue line represents the glacier boundary.
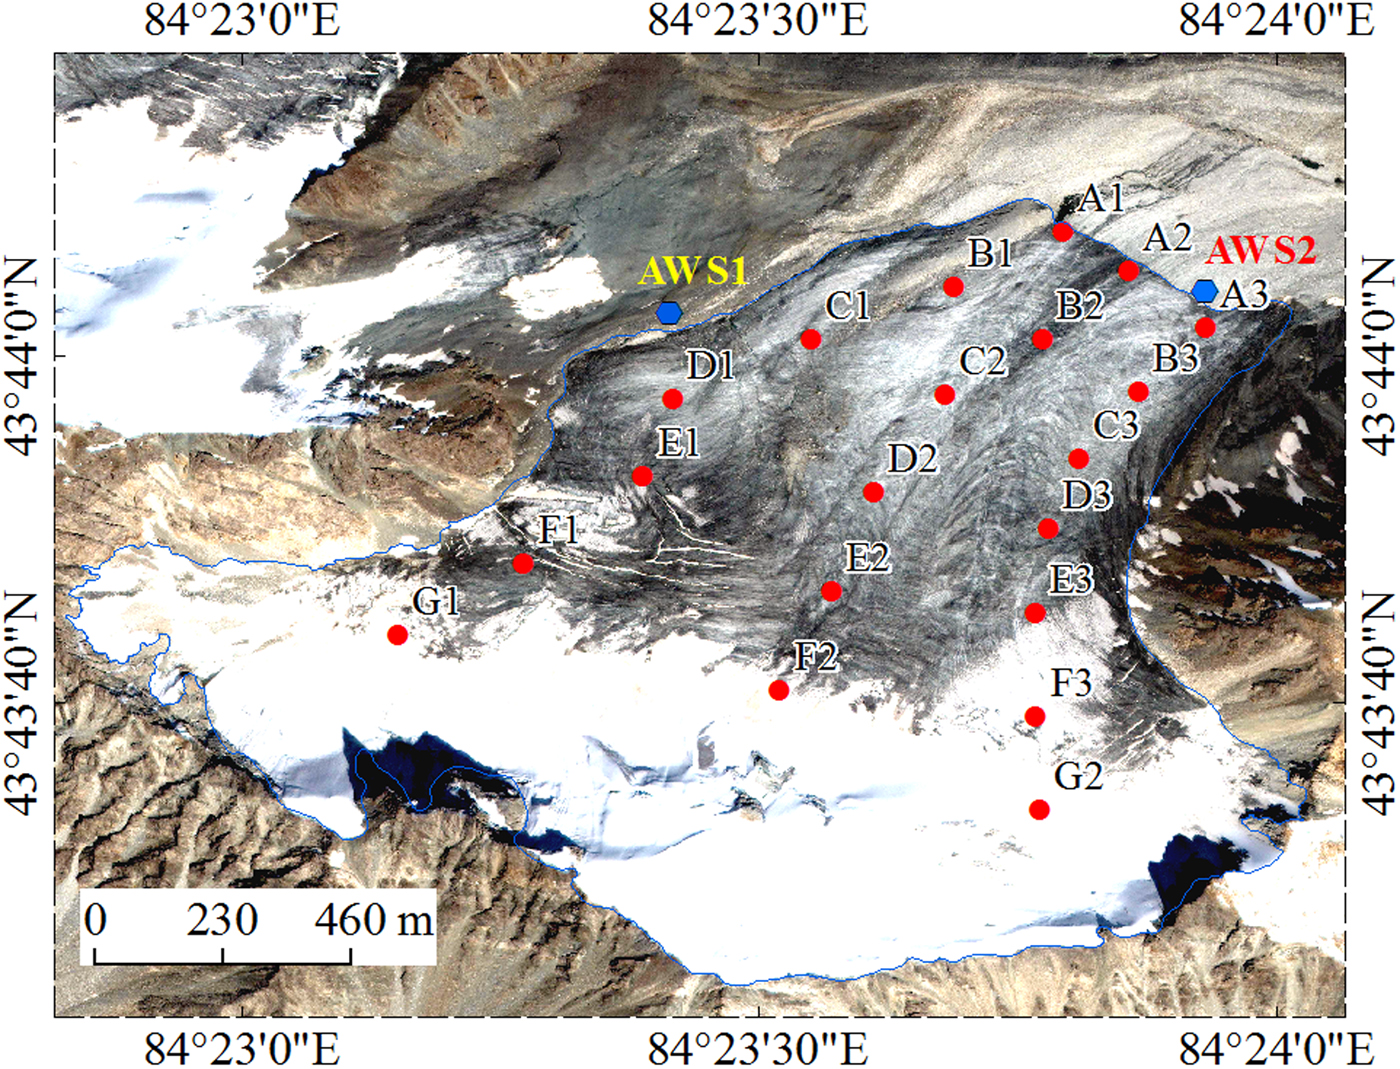
On 18 February 2004, an AWS was installed on a lateral moraine at 3545 m a.s.l. (Fig. 2). Unfortunately, the observation was interrupted on 23 August 2004. The nearest meteorological station is ~130 km from the glacier, and so may not precisely represent meteorological conditions on the glacier surface. Hence we use a daily grid dataset for surface temperature and precipitation, with a spatial resolution of 0.5° × 0.5°, released by the National Meteorological Information Center, China Meteorological Administration. Additionally, we conducted the field surveys on Haxilegen Glacier No.51 in 2017, including snow depth measurements in May, point ablation measurements and meteorological observation in August.
Glacier surface extent is delineated by visual interpretation on the orthorectified and georeferenced Landsat Thematic Mapper (TM)/Enhanced TM Plus (ETM+) and Operational Land Image/Thermal Infrared Sensor images (path 145, row 30) with low cloud coverage from 1999 to 2015 between May and September, which are acquired from the US Geological Survey (USGS, http://glovis.usgs.gov/). No suitable images are available for 2003 and 2004, for which outlines from the previous year continued to be used. Uncertainties of the glacier outline derived from remote-sensing imagery are within ±5% (Paul and others, Reference Paul2013). Altitudinal attributes of the glacier were derived from the Shuttle Radar Topography Mission DEM (SRTM V4).
4. METHODS
4.1. Model description
We employ a temperature-index model (Hock, Reference Hock2003) together with an accumulation model to calculate the annual mass balance. Ablation is related to the positive degree-day sum and accumulation is estimated from solid precipitation on the glacier surface. For a specific glacier, mass balance is the sum of ablation and accumulation.
Ablation in this model is computed by
 $$A = \left\{ {\matrix{ {\hbox{DD}\hbox{F}_{{\rm ice/snow}}T} & {:T \gt T_{\rm m}} \cr 0 & {:T \le T_{\rm m}} \cr}} \right.$$
where DDF is degree-day factor (mm d−1 °C), different for ice and snow, T is the extrapolated daily mean temperature (°C) at the glacier altitudes and T m denotes the threshold temperature (°C) for melt.
Accumulation is calculated by
 $$C = \left\{ {\matrix{ {C_{{\rm prec}}P} & {:T \le T_{\rm P}} \cr 0 & {:T \gt T_{\rm P}} \cr}} \right.$$
where P is extrapolated daily precipitation (mm) at the respective glacier altitudes and T p indicates the threshold temperature (°C) for snow/rain separation. C prec is a correction factor for adjusting the precipitation sums and gauge under-catch error (shift of the measurement location and other systematic differences).
The model depends entirely on daily temperature and precipitation as atmospheric forcing, which assumes that ablation is linearly related to temperature. Considering the glacier surface state, separate values (DDFice and DDFsnow) are adopted for snow and ice melt (Table 1). Liquid precipitation and refreezing are not considered in the model: we assumed that any meltwater and liquid precipitation instantly flows away from the glacier (Machguth and others, Reference Machguth, Haeberli and Paul2012). Accumulation at the specific altitude is estimated from solid precipitation, which is acquired through the separation of solid and liquid precipitation by a threshold temperature. Ablation and accumulation are calculated at every 50 m interval in altitudinal range using the daily temperature and precipitation from the grid dataset since 1999 for a hydrological year, which is extrapolated to the mean altitude (e.g. for the 3600–3650 m band, 3625 m a.s.l.). The model starts on 1 September and ends on 31 August of the following year from 1999 to 2015.
Model parameters used for mass-balance modelling

4.2. Parameter analysis and model calibration
The parameters used in the model are listed in Table 1. Due to the discontinuous meteorological data records, daily temperature and precipitation data from the gridpoint (43.75°N, 84.25°E) nearest to the glacier location were statistically downscaled through a multiple linear regression. The generated daily temperature and precipitation show correlations of 0.95 and 0.55 separately with the measured values from AWS1 in 2004. Thereafter the generated daily air temperature was extrapolated at the glacier surface by a temperature lapse rate (TLR) of 0.72 °C (100 m)−1 (Liu and Ding, Reference Liu and Ding1998). The generated daily precipitation was also taken as input data and if the temperature at any particular altitude is below the specified threshold (T p = 1 °C) (Johannesson and others, Reference Johannesson, Sigurdsson, Laumann and Kennett1995; Lejeune and others, Reference Lejeune2007), precipitation on the glacier surface is assumed to fall in solid form. However, precipitation distribution in alpine regions is complex and easily affected by local topography (Immerzeel and others, Reference Immerzeel, Pellicciotti and Shrestha2012). Moreover, the spatial variation of accumulation on the glacier is usually influenced by snowdrift and avalanches (Huss and others, Reference Huss, Bauder, Funk and Hock2008; Radić and others, Reference Radić2017). Thus precipitation gradient on the glacier needs to be treated with caution, and C prec is adopted for the calibration of precipitation.
Point ablation measurement for each stake on the glacier was performed in August 2017 from 3495 to 3756 m a.s.l., and the corresponding meteorological variable was recorded by AWS2 at the glacier terminus (Fig. 2). Significant snowfall events were not captured during the observation period. In view of the uncertainty for stake measurements on ice (0.15 m) (Thibert and others, Reference Thibert, Blanc, Vincent and Eckert2008), stake ablation records were carefully selected for the calculation of DDFice. DDFice for Haxilegen Glacier No.51 was obtained by linear regression between available point ablation measurements and positive degree-day sum (Fig. 3). Zhang and others (Reference Zhang, Liu and Ding2006) reported that the ratio of DDFsnow to DDFice was 0.58 in terms of the available snowmelt observation in different regions of western China. Hence DDFsnow for Haxilegen Glacier No.51 was calculated as 4.3 mm d−1 °C. Cpre was constrained based on the available snow observations, which included snow measurements in 7 hydrological years (in September) and 2017 (in May and August). Considering the large spatial variability of precipitation on the glacier surface, Cprec, for each altitudinal range, was slightly adjusted until the best agreement between measured and modelled was achieved.
Measured ablation for ice surfaces as a function of positive degree-day sum and snow depth distribution (using Inverse Distance Weighting interpolation) in May 2017.

4.3. Uncertainty analysis
The uncertainty of glaciological mass balance, determined by the contour method, is composed of the uncertainty of point ablation, accumulation measurements and the uncertainty related to the extrapolation method. We adopt the uncertainty from Kenzhebaev and others (Reference Kenzhebaev2017), who performed a ‘round-robin’ test for uncertainty assessment and found an average uncertainty of ± 0.20 m w.e.a−1.
To quantify uncertainty in modelled annual mass balance, sensitivity analysis of the parameters was performed following Azam and others (Reference Azam2014). We varied the model parameters (DDFice, DDFsnow, Cpre, TLR) within the limit bounds and the model was rerun with a set of modified parameters. DDFice and DDFsnow were adjusted within the corresponding error range calculated by Taylor (Reference Taylor1997, p. 188) (±0.14 mm d−1 °C for DDFice and ± 0.18 mm d−1 °C for DDFsnow). The values for Cpre and TLR were adjusted by ± 25% and ± 20%, respectively. Thus, new series of modelled annual mass balance was generated for the modified parameters and the highest standard deviation between new series and initial mass-balance series was taken as the uncertainty, which was calculated as ± 0.22 m w.e.a−1. Considering DDFsnow was not directly derived from the field observation, the value for DDFsnow was varied by ± 1 mm d−1 °C again. To test the effect from the unchanged glacier hypsometry, glacier elevation was adjusted to the SRTM DEM according to the highest snow depth and ablation point measurements (Kenzhebaev and others, Reference Kenzhebaev2017). But the standard deviations for both of them are lower (< ± 0.03 m w.e.a−1).
5. RESULTS
5.1. Measured mass balances for 7 hydrological years
Figure 4 shows the variation of measured mass balance for different altitudes on Haxilegen Glacier No.51 in 7 hydrological years, including stakes and snow pits. The mass loss is more pronounced for the terminus and single point mass balances increase gradually with the rise in altitude. Single point mass balances vary between −3.15 and 1.17 m w.e.a−1, and the maximum and minimum values both appear in 2002/03. The mean vertical gradient of annual mass balance between 3495 and 3740 m a.s.l. varies from 0.84 m w.e. (100 m)−1 in 2004/05 to 1.44 m w.e. (100 m)−1 in 2010/11.
Single point mass balance as a function of altitude for 7 hydrological years derived from the field survey.

Annual mass balances for 7 hydrological years were obtained based on the mass-balance maps (Fig. 5). The balances vary between −0.68 and 0.21 m w.e.a−1 (Table 2). The minimum annual mass balance is found for 2010/11 with an equilibrium-line altitude (ELA) of 3710 m w.e.a−1, whereas 2002/03 shows the maximum annual mass balance and a lower ELA of 3580 m a.s.l. (Table 2).
Annual mass-balance maps determined by the glaciological method. Shading indicates accumulation zone, and white indicates ablation zone.

Annual mass balance (B n) and ELA of Haxilegen Glacier No.51

5.2. Mass-balance reconstruction
Modelled and measured annual altitudinal mass balance are compared in Figure 6. The large differences come from the accumulation zone, above 3700 m a.s.l., where modelled accumulation is overestimated for hydrological year 1999/2000 and sharply underestimated for the hydrological year 2002/03. Temporal variation of albedo on the glacier surface exhibits a significant influence on the ablation. Frequent snowfall in summer covers the glacier surface, preventing excessive melting by changing the surface albedo in different timescales (Fujita and others, Reference Fujita, Ohta and Ageta2010). Hence, mismatches to a certain extent still exist between the measured and modelled mass balance in different altitudinal ranges. Moreover, the spatial distribution and evolution of solid precipitation are vulnerable to influence from the orographic effect (Huss and others, Reference Huss, Bauder, Funk and Hock2008). Complicated topography leads to high spatial variability of the precipitation gradient on the glacier surface, especially in the accumulation zone.
Comparison of modelled (blue circle) and measured (red pentagon) mass balance as a function of elevation for 7 hydrological years. RMSE (m w.e.a−1) for each year is also given.
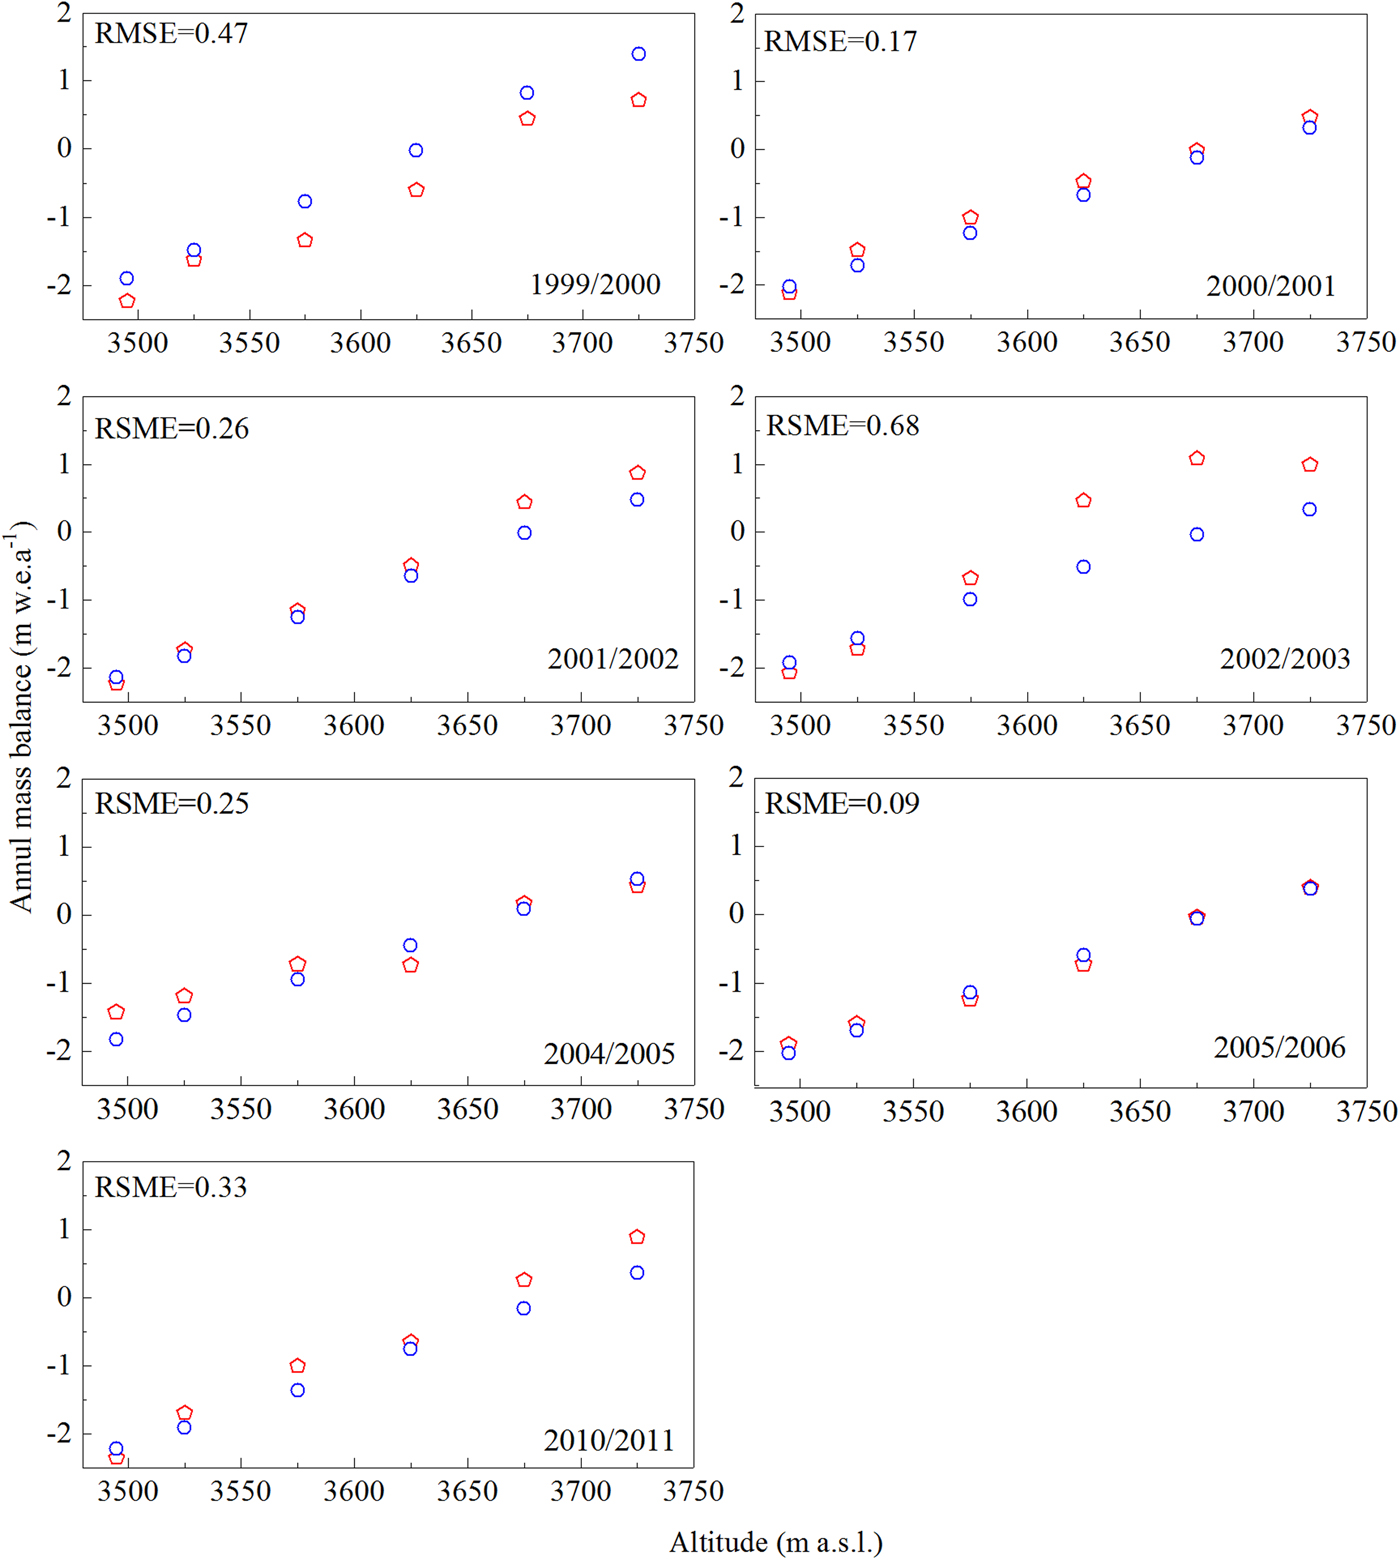
Our results indicate that modelled and measured mass balances are in good agreement, with a RMSE of 0.37 m w.e.a−1 (R 2 = 0.87, p < 0.001). The best fit is in 2005/06, with a RMSE of 0.09 m w.e.a−1 and the worst is in 2002/03, with a RMSE of 0.68 m w.e.a−1. RMSEs in the other 5 years range from 0.17 to 0.47 m w.e.a−1.
5.3. Annual and seasonal mass balance
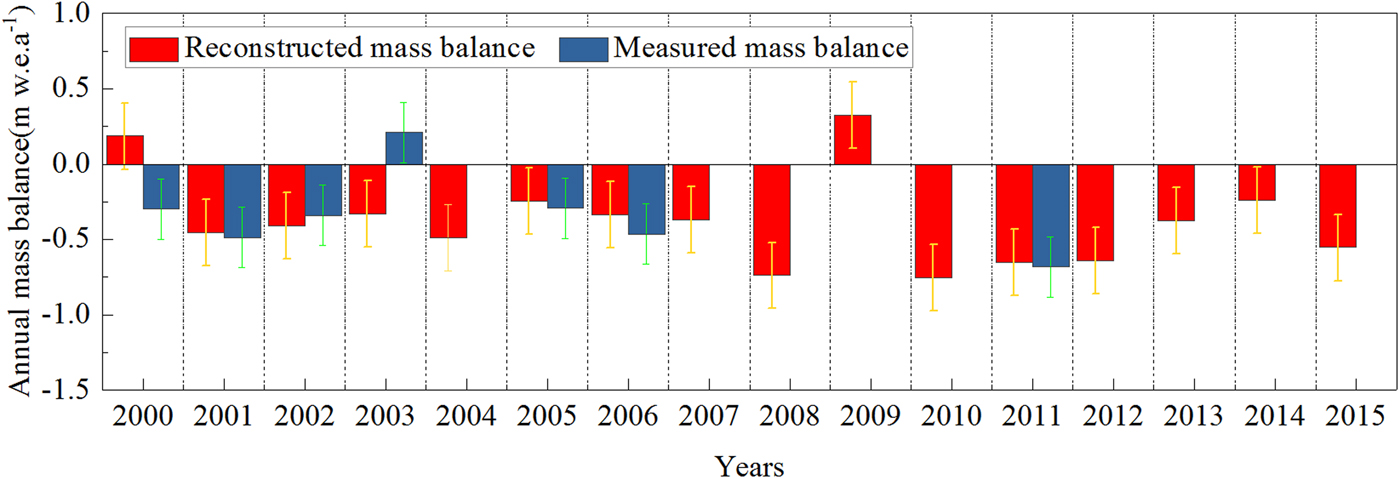
The model performance, examined in Section 5.2, proved sufficient for mass-balance simulation. We, therefore, reconstructed the annual mass balance for Haxilegen Glacier No.51 from 1999 to 2015. Together with measured annual mass balances for 7 hydrological years, modelled mass balance from 1999 to 2015 is shown in Figure 7. Annual mass balances are mainly negative, except for 1999/2000 and 2008/09. The most negative mass balance during the study period is found for 2009/10 (−0.75 m w.e.a−1), and 2008/09 shows the maximum mass balance (0.32 m w.e.a−1). Annual mass balances are positive in 1999/2000 and 2008/09, due to low temperature and abundant precipitation. The cumulative annual mass balance over the period 1999–2015 is found to be −6.06 m w.e.a−1 (−0.37 m w.e.a−1).
Comparison of modelled annual mass balances with measured annual mass balances.
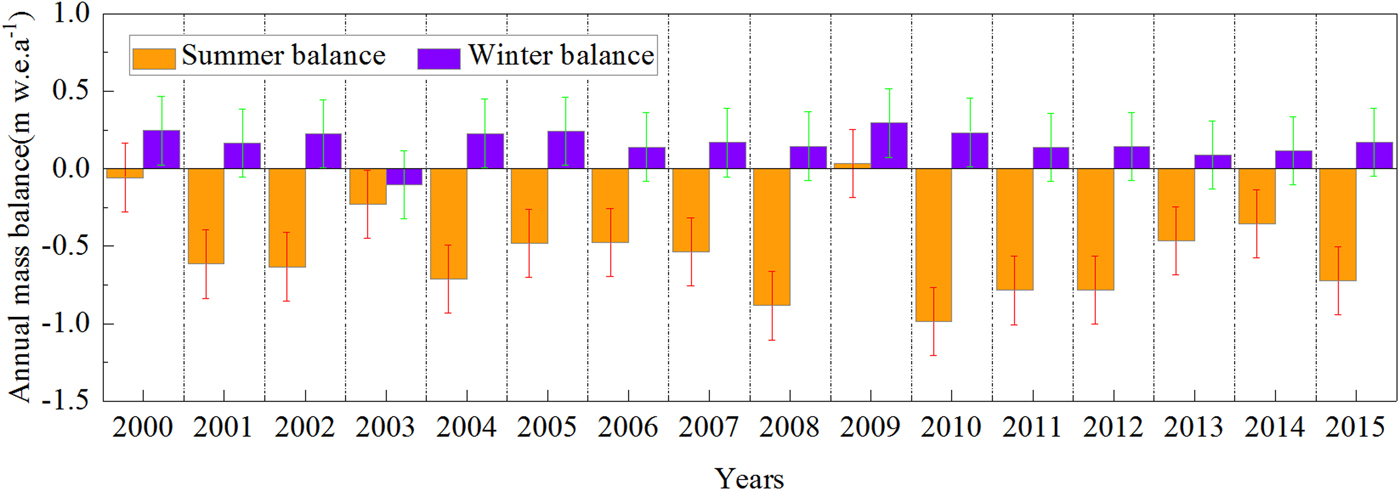
Seasonal mass balance throws light on the interaction between glacier mass balance and atmospheric forcing, which helps us to achieve an in-depth understanding of the mass-balance processes in different climatic regimes. Reconstructed summer balance (May–October) and winter balance (September–April) are shown in Figure 8. Modelled winter balances show low interannual variation, with values from −0.10 to 0.29 m w.e.a−1. Winter balances from 1999 to 2015 are negative, except for 2002/03 when there is less precipitation in the winter period and higher temperature in April. The cumulative winter balance over the 16 hydrological years is equal to 2.63 m w.e.a−1. Modelled summer balances show large interannual variability, with values between −0.98 and 0.03 m w.e.a−1. The cumulative summer balance over the 16 hydrological years is equal to −8.67 m w.e.a−1. Only in 2008/09 is there a positive summer balance, the result of lower temperature and higher precipitation. Frequent precipitation events reduce the ablation rate, along with a certain amount of snowfall deposited on the glacier surface during the summer period. Moreover, a high correlation between annual mass balance and summer balance (R = 0.95) at the 0.001 significance level was found.
Reconstructed winter balance and summer balance for Haxilegen Glacier No.51 from 1999 to 2015.
6. DISCUSSIONS
6.1. Mass-balance sensitivity to temperature and precipitation change
Assessment of glacier mass-balance sensitivity to climate change helps us to interpret the glacier/climate interaction. The mass-balance sensitivity of Haxilegen Glacier No.51 to climatic fluctuation was assessed by the model over the period 1999–2015. The averaged annual mass balance from 1999 to 2015 was recalculated by re-running the model with the same parameters, but assuming a 1°C increase in temperature or a 10% change in precipitation throughout the hydrological year.
Mass-balance sensitivity to temperature (dMB/dT) and precipitation (dMB/dP) is calculated as
 $$\displaystyle{{dMB} \over {dT}} \approx \displaystyle{{MB( + 1^\circ \hbox{C}) - MB( - 1^\circ \hbox{C})} \over 2} \approx MB( + 1^\circ C) - MB(0^\circ \hbox{C})$$
 $$\displaystyle{{dMB} \over {dP}} \approx \displaystyle{{MB(P + 10\% ) - MB(P - 10\% )} \over 2} \approx MB(P + 10\% ) - MB(P)$$
The calculated mass-balance sensitivity to temperature is −0.52 m w.e.a−1 °C −1, which corresponds to the highest sensitivity in High Asia, investigated by Rasmussen (Reference Rasmussen2013) using US National Centers for Environmental Prediction/US National Center for Atmospheric Research (NCEP/NCAR) reanalysis data. The same sensitivity test was also conducted for precipitation assuming a 10% increase. Calculated mass-balance sensitivity to precipitation is 0.08 m w.e.a−1 for a 10% change. Precipitation amount in the model was adjusted several times and the other parameters were kept unchanged, until the increased melting due to a 1 °C rise could be compensated by the adjusted precipitation. The result shows that a 65% increase in precipitation could offset the increased mass loss due to a 1 °C rise. Our results yield higher values than the results of previous studies (Braithwaite and other, Reference Braithwaite, Zhang and Raper2002; Braithwaite and Raper, Reference Braithwaite and Raper2007), which show a 30–40% precipitation increase to offset the increased ablation caused by a 1°C temperature rise. In other words, more precipitation is needed for this glacier to reach a balanced state under the climate warming scenarios.
In order to assess the sensitivity of the modelled seasonal mass balance, the test was also performed separately in the summer and winter periods. Calculated winter balance sensitivity to a 1°C temperature rise is −0.04 m w.e.a−1 °C −1 and to precipitation is 0.02 m w.e.a−1 for a 10% change, while the sensitivity of summer balance to temperature rise and precipitation change (−0.51 m w.e.a−1 °C −1 and 0.05 m w.e.a−1 respectively) is relatively higher, indicating that temperature during the melt season (May–August) and annual precipitation are the major contributors to mass-balance fluctuation.
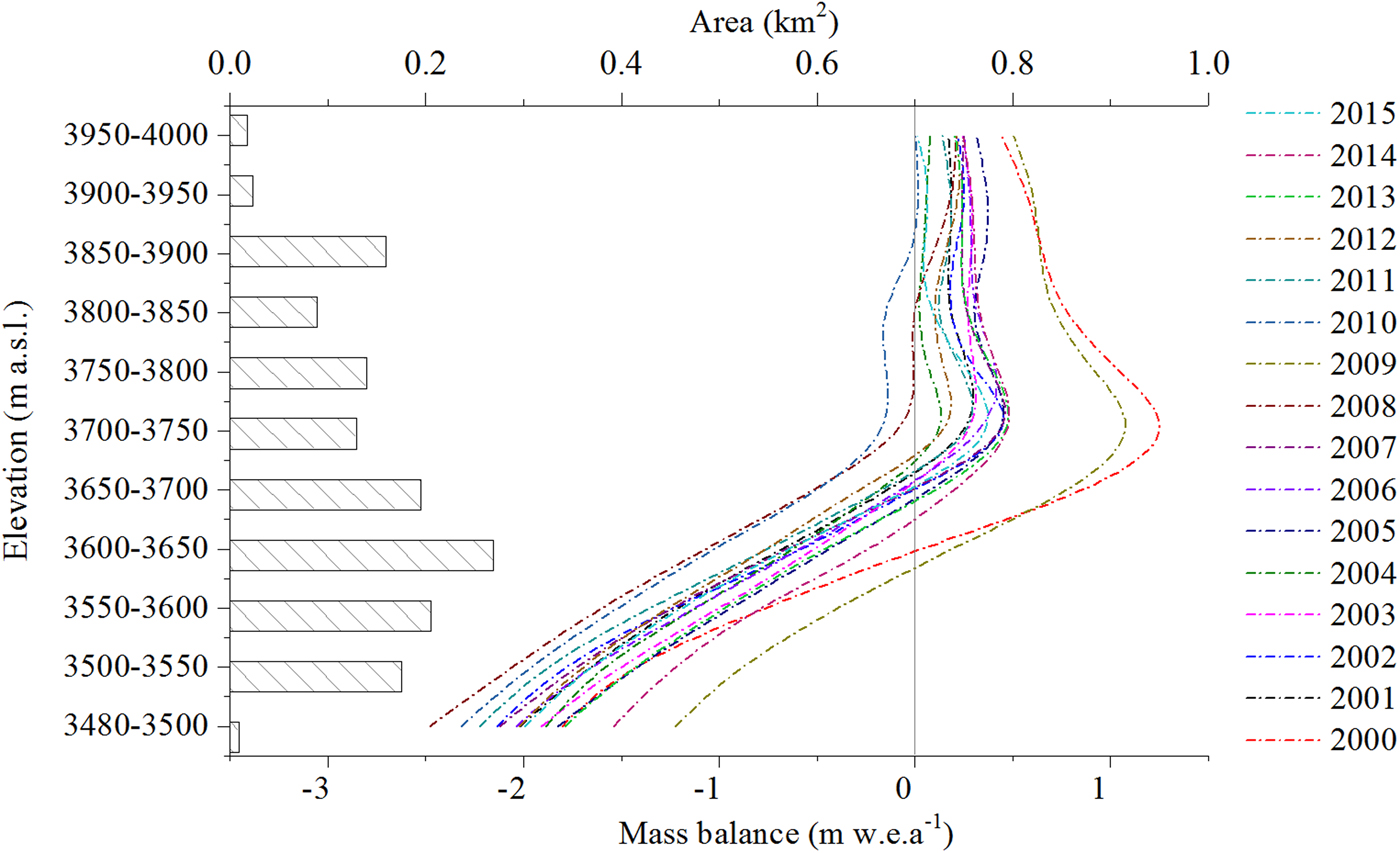
The average mass-balance gradient for Haxilegen Glacier No.51 is calculated as 0.43 m w.e. (100 m)−1 from 1999 to 2015. The maximum mass-balance gradient is found for 2007/08 (0.53 m w.e. (100 m)−1), whereas 2008/09 shows the minimum value, 0.34 m w.e. (100 m)−1. The mass-balance gradient for Haxilegen Glacier No.51 increases in the ablation zone and decreases in the accumulation zone, which is typical for summer accumulation-type glaciers. Modelled mass-balance sensitivity to temperature decreases with elevation from −0.81 m w.e.a−1 °C at 3495 m a.s.l. to −0.25 m w.e.a−1 °C at 4000 m a.s.l., which suggests that ablation is highly sensitive to temperature fluctuation. Modelled mass-balance sensitivity to precipitation for different altitudes varies from 0.01 to 0.13 m w.e.a−1 for a 10% change, increasing between 3495 and 3750 m a.s.l. and decreasing between 3750 and 4000 m a.s.l..
6.2. Mass-balance variations in the Tien Shan
Farinotti and others (Reference Farinotti2015) reported an average glacier mass loss rate of −0.54 ± 0.28 m w.e.a−1 in the Tien Shan from 1961 to 2012 based on GRACE data, ICESat data and glaciological modelling. For the Borohoro region (sub-region of the eastern Tien Shan), a model-derived mass change rate of −0.32 ± 0.30 m w.e.a−1 between 1960 and 2012 and an ICESat-derived mass loss rate of −0.63 ± 0.50 m w.e.a−1 for 2003–09 were estimated by Farinotti and others (Reference Farinotti2015). For glaciers of the entire Tien Shan, a geodetic mass balance of −0.49 ± 0.08 m w.e.a−1 during the period 2003–09 was determined by Gardner and others (Reference Gardner2013) using ICESat data. Brun and others (Reference Brun, Berthier, Wagnon, Kaab and Treichler2017) computed a mass budget of −0.28 ± 0.2 m w.e.a−1 for the Tien Shan and an average mass loss rate of −0.40 ± 0.20 w.e.a−1 for the eastern Tien Shan using ASTER optical satellite stereo-imagery from 2000 to 2016. Comparing our results with the above-mentioned studies, we confirm that Haxilegen Glacier No.51 has experienced mass loss over the decades. Furthermore, a stable state for this glacier was identified in the field investigation in 1981 (Lanzhou Institute of Glaciology and Geocryology, Chinese Academy of Sciences, 1987). Between the 1980s and 2010, the investigated glacier has thinned by ~10 m (Wang and others, Reference Wang2016). We suggest that the mass loss started in the 1980s with climatic warming, which has continued over the past 35 years and accelerated since the end of the 1990s.
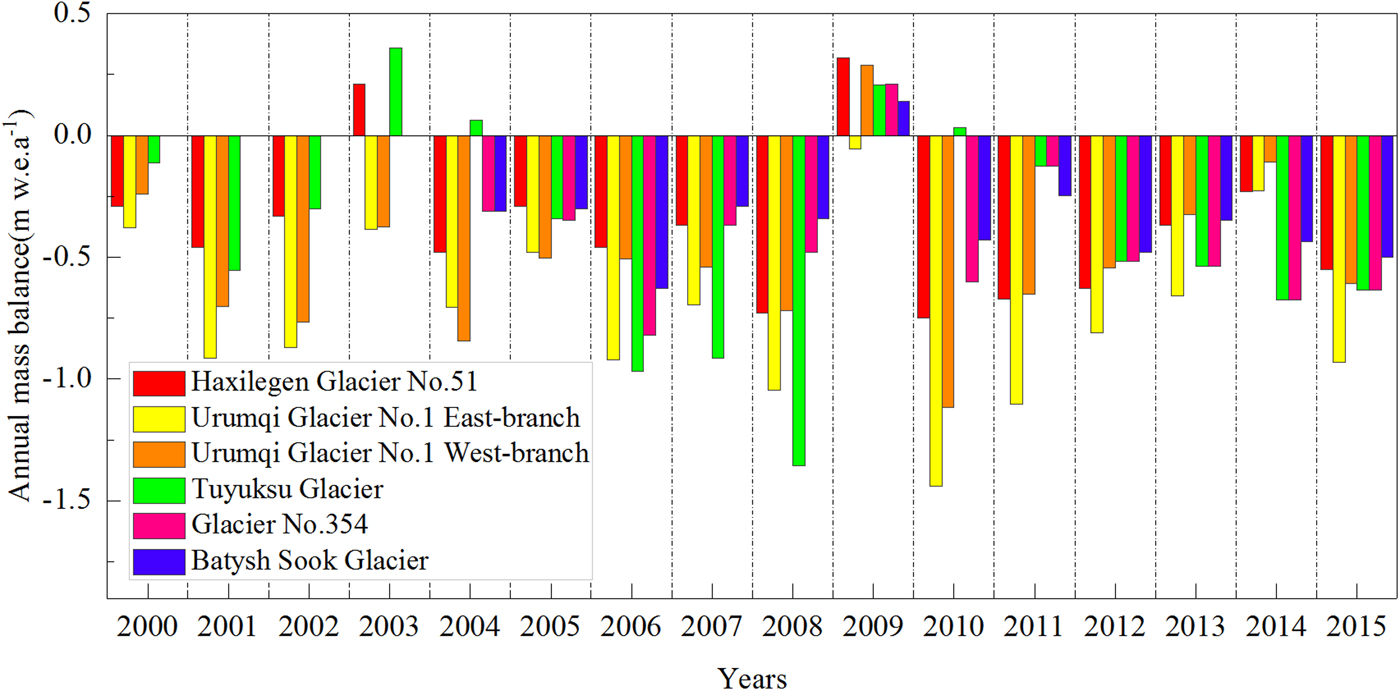
Using the available in situ mass-balance information combined with related studies on mass-balance reconstruction in the Tien Shan, annual mass balance for Haxilegen Glacier No.51 was compared with the other four monitoring glaciers (Fig. 9). Measured and modelled annual mass balance for TS.Tuyuksu Glacier (northern Tien Shan), Urumqi Glacier No.1 and Haxilegen Glacier No.51 (eastern Tien Shan), Glacier No.354 and Batysh Sook Glacier (inner Tien Shan) are shown in Figure 10. Urumqi Glacier No.1 is ~200 km west of Haxilegen Glacier No.51, which split into two branches in 1993. We identified a statistically significant relationship in annual mass balance for Urumqi Glacier No.1 and Haxilegen Glacier No.51, with correlation coefficients of 0.84 and 0.85 for its East and West branches at the 0.001 significance level. More positive values are found for TS.Tuyuksu Glacier and all glaciers show a positive or almost steady mass balance for 2008/09. The cumulative mass balances from 2003/04 to 2014/15 are: TS.Tuyuksu Glacier, −6.80 m w.e.a−1; Glacier No.354, −5.21 m w.e.a−1; Batysh Sook Glacier, −4.17 m w.e.a−1; Haxilegen Glacier No.51, −5.06 m w.e.a−1; and Urumqi Glacier No.1 East and West branches, −9.07 and −6.17 m w.e.a−1, respectively. Over the 12-year period, Urumqi Glacier No.1 (East and West branches) has the highest mass loss among the considered glaciers, whereas Batysh Sook has the lowest cumulative mass balance.
Comparison of different modelled mass-balance gradients with altitude of Haxilegen Glacier No.51 from 1999 to 2015.
Comparison of annual mass-balance values from measured (Urumqi Glacier No.1 and TS.Tuyuksu Glacier), reconstructed and measured (Haxilegen Glacier 51, Glacier No.354 and Batysh Sook) series of five monitoring glaciers in the Tien Shan. Mass-balance data source: WGMS, 2017 for measured data, Kronenberg and others (Reference Kronenberg2016) for Glacier No.354, Kenzhebaev and others (Reference Kenzhebaev2017) for Glacier Batysh Sook. Values for Haxilegen Glacier 51, Glacier No.354 and Batysh Sook Glacier refer to the corresponding observation period.
Urumqi Glacier No.1 is situated in the eastern Tien Shan with a relatively dry continental climate. Li and others (Reference Li, Ren, Li, Wang and Wang2011) proposed that accelerated melting of Urumqi Glacier No.1 since the 1980s could be attributed to air temperature rise in the ablation season, ice temperature increase and albedo reduction on the glacier surface. For Batysh Sook Glacier, the lower mass loss rate is being affected by the simple geometry, smaller size and other controlling factors (Kenzhebaev and others, Reference Kenzhebaev2017). Besides, a less negative annual mass balance was found for Haxilegen Glacier No.51 in comparison with Urumqi Glacier No.1 located nearby, especially for its East branch. The process of mass-balance evolution varies in terms of the climatic regime, aspect, size, geometry and hypsometry of the specific glacier (Dyurgerov, Reference Dyurgerov1994). As well as the regional climatic difference, the wider accumulation zone of Haxilegen Glacier No.51 favours accumulation on the glacier surface. In addition, the mass balance of a small cirque is subject to topographic effects, which enhance accumulation by snowdrifts or avalanches and reduce ablation (Kuhn, Reference Kuhn1995; Hoffman and others, Reference Hoffman, Fountain and Achuff2007).
7. CONCLUSIONS
We have determined the specific annual mass balance of Haxilegen Glacier No.51 using the glaciological method for 7 discontinuous hydrological years during the period 1999–2011. The annual mass balance was reconstructed from 1999 to 2015 based on a temperature-index model and an accumulation model. The model is driven by daily meteorological data and calibrated by annual altitudinal mass-balance measurements for 7 years with measurements. The measured and modelled altitudinal mass balances show a RMSE of 0.37 m w.e.a−1(R 2 = 0.87, p < 0.001). We find an accumulated mass balance of −6.06 ± 0.88 m w.e.a−1 over the period of 16 hydrological years, with an average annual value of −0.37 ± 0.22 m w.e.a−1. Fluctuation of winter mass balance is relatively stable, but summer balance shows large interannual variability.
The calculated mass-balance sensitivity to temperature is −0.51 m w.e.a−1 °C −1 and to precipitation is 0.08 m w.e.a−1 for a 10% increase. The sensitivity of summer balance to temperature and precipitation is higher than that of the winter balance, which indicates that temperature during the melting season (May–August) and annual precipitation are the major contributors to mass-balance fluctuation. This study provides the fundamental information for mass budget estimates in the eastern Tien Shan and is a basis for projecting future glacier evolution and water availability. Further studies including geodetic mass-balance measurements and energy-balance studies at the glacier surface would help to calibrate the modelled results and increase our understanding of the contribution of different energy fluxes in the processes governing the mass balance.
ACKNOWLEDGEMENTS
We greatly appreciate the field survey group (Fanglong Wang, Feng Liu and Jian Chen) of Tianshan Glaciological Station for the fieldwork on Haxilegen Glacier No.51. We also thank Graham Cogley (chief editor), Pritchard Hamish (scientific editor), and two anonymous reviewers for their comments on the manuscript. This work was jointly supported by the National Natural Science Foundation of China (41471058; 91425303); Innovative Research Group Project in National Natural Science Foundation of China (41721091); Environmental Change of Pan-Three Pole Region and Construction of Green Silk-Road Belt (XDA2006020103); Major Research Project of Heihe Basin in National Natural Science Foundation of China (91025012); Innovative Research Group Project (Y511E51001), and “Light of West China” Program for Talent Introduction of Chinese Academy of Sciences (Y629961001). Finally, we also thank USGS for the Landsat images, WGMS for the mass balance data compilation and China Meteorological Administration for meteorological data used in this study.


 Open access