


More than a century after Galton (Reference Galton1875) published his seminal monograph on ‘nature and nurture’, the twin study remains instrumental in the field of behavior genetics. Researchers have utilized the twin method to disentangle and quantify the genetic and environmental influences on myriad traits, from intelligence to eating disorders. Studies of morphological characteristics in humans have similarly revealed new insights into sources of phenotypic variation based on the twin study. However, much of this work has focused on size-related features of morphology and overlooked components of shape variation when the latter may also be of scientific interest. In part, this reflects the conceptual difficulties in quantitatively assessing an abstract notion such as shape. With a maturing of multivariate statistical methodologies, a ‘revolution’ in biological shape analysis occurred in the late 1980s, supplanting traditional morphometrics and the typically linear distance measurements used to represent shape (Adams et al., Reference Adams, Rohlf and Slice2004; Rohlf & Slice, Reference Rohlf and Slice1990) The emergence of geometric morphometrics (GMM) provided a statistical framework that enables spatial relationships among regions within an anatomical structure to be retained and thus a more complete quantification and characterization of shape variation in biological forms. The discipline of GMM is founded upon methods that can be broadly classified as landmark-based (e.g., Procrustes analysis), outline-based (e.g., elliptic Fourier analysis [EFA]), and a composite semi-landmark-based technique.
Very few twin studies in the literature have evaluated genetic hypotheses concerning shape-related aspects of human traits, with only a handful of these applying GMM approaches. Recently, Dryden et al. (Reference Dryden, Oxborrow and Dickson2008) examined the familial relationships of spine shape in a cohort of adolescent twins and their siblings. They identified a ‘spinal line’ (in sagittal profile) for each subject using photogrammetric techniques, and employed Procrustes analysis to describe shape variation. Of the primary modes of variation elicited following a principal components analysis (PCA), only the second principal component (PC) displayed a significant intra-pair correlation, and one that was greater in monozygotic (MZ) compared with dizygotic (DZ) twins. This PC appeared to describe a possible lordosis (S-shape) of the spine and was postulated to represent an inherited risk factor for the development of idiopathic scoliosis. Using a different morphometric approach, Vanco and colleagues (Reference Vanco, Kasai, Sergi, Richards and Townsend1995) investigated genetic and environmental influences on facial profile of subjects recruited from the South Australian Twin Study. Correlations of coefficients derived from EFA were consistently higher in MZ compared with DZ pairs for facial dimensions, including facial convexity, height, and depth. However, differences in nose and lip morphology appeared to be governed largely by environmental factors.
While the preceding studies have examined intra-pair trait similarities based on zygosity, formal analyses of heritability were limited and sample sizes generally small. Considerable opportunity therefore exists to parameterize shape variation in twin subjects for heritability and quantitative genetic analyses. Compared to traditional morphometrics, any morphological phenotype may be analyzed within the GMM framework to yield geometry-preserving and information-rich data. The aim of the current work is to introduce new concepts in morphological characterization and quantification based on robust statistical techniques that may benefit and broaden the field of twin research. In order to illustrate one of the many potential applications of GMM in the analyses of twin phenotypes, we conducted an evaluation of hand shape using these methods.
Although there is a paucity of information describing variation in human hand shape, in recent years the 2D:4D ratio is one aspect of hand morphology that has garnered much interest. The length of the index finger relative to that of the ring finger has been hypothesized to be associated with prenatal androgen (e.g., testosterone) exposure (Manning et al., Reference Manning, Scutt, Wilson and Lewis-Jones1998) and a recent work has confirmed this in the experimental mouse model (Zheng & Cohn, Reference Zheng and Cohn2011). Studies have shown the 2D:4D ratio to be an effective marker of sexual dimorphism, with females tending to demonstrate similar and males exhibiting shorter second relative to fourth digits, therefore lower ratios reflecting potentially higher levels of testosterone in utero. Several studies have tried to reconcile this phenotype with behavioral and psychological traits that are recognized to differ, based on gender, but results have generally been mixed. Given the earlier example relating to the analysis of facial shape in twins, work by Fink and colleagues (Reference Fink, Grammer, Mitteroecker, Gunz, Schaefer, Bookstein and Manning2005) investigating the relationship between the 2D:4D ratio and facial shape using GMM methods is of particular interest. The Procrustes analysis of facial morphology and subsequent regression of shape variables on the 2D:4D ratio demonstrated that ‘masculine’ facial characteristics (i.e., strong jaw and browline, prominent chin, and broad cheekbones) were associated with a low digit ratio and more ‘feminine’ characteristics (i.e., small nose, delicate bone structure, and high cheekbones) with a high ratio. This study remains novel in the approach it employed to visualize facial shape variation related to prenatal sex steroids via such a proxy. It begs the question of whether a more detailed analysis of variation in hand morphology using GMM-based methods may provide further insight into gender-based phenotypic differences.
Methods
Review of Fundamental GMM Concepts
A comprehensive review of the field of GMM, individual techniques, and their mathematical basis can be found elsewhere (Sanfilippo et al., Reference Sanfilippo, Cardini, Hewitt, Crowston and Mackey2009; Viscosi & Cardini, Reference Viscosi and Cardini2011; Zelditch et al., Reference Zelditch, Swiderski, Sheets and Fink2004). However, for the unfamiliar reader, some of the fundamental concepts in GMM are explained here. Landmarks represent specific positions on biological forms that hold some developmental, functional, structural, or evolutionary significance (bridge of the nose, tip of the fin, venation of the insect wing). In contrast, semi-landmarks (Zelditch et al., Reference Zelditch, Swiderski, Sheets and Fink2004) describe points located along a curve, in which position is defined using extrinsic criteria (e.g., equally spaced points). Although semi-landmarks are not homologous across specimens, the outline curve or contour under examination should be. Whether a biological shape is defined by landmarks, semi-landmarks, or a combination of both, the Procrustes analysis optimally superimposes the representative configuration of points by removing the effects of translation, rotation, and scale.
In Greek mythology, Procrustes was an outlaw whose iron bed had the unique property of exactly matching in length the individual laying on it. He would enforce conformity of the individual by stretching or shortening (usually by severing the legs or head) his victims so that everyone was converted to an identical length. In the GMM context, the application of this unit principle to landmark data produces a new set of ‘shape’ coordinates that only contain information about the geometric shape of the configurations. The complex statistical theory underpinning GMM represents a Procrustes-superimposed specimen as a point in a curved but mathematically abstract ‘shape space’. To enable standard multivariate statistical techniques (e.g., PCA) to be employed in evaluating shape variation and covariation, configurations are subsequently projected on a Euclidean tangent space with linear distances then used to approximate distances in the curved shape space. The Procrustes distance provides a quantitative measure of the magnitude of shape differences between two or more configurations.
Study Design and Data Acquisition
Hand shape data were obtained from participants recruited as part of the Western Australian Pregnancy Cohort (Raine) Study, a longitudinal prospective study established in Perth, Western Australia in 1989. Prenatal information (e.g., diet, exercise, work, and health) and ultrasound imaging were acquired at regular intervals during the pregnancies of 2,900 women enrolled until 1991. Subsequently, periodic follow-ups of their children were conducted and various clinical and general health (e.g., childhood milestones, height, weight, behavior, and illnesses) data recorded.
Photocopies of the palmar aspects of both hands of 117 participants (59 females, 58 males) were selected from the larger cohort of subjects with hand data available. At the time of acquisition, participants were requested to remove all rings and place each hand on the photocopier glass platen without instruction regarding finger position. Of the resulting 234 images, 222 were retained for landmark digitization, with 12 excluded because the complete outline of the hand could not be visualized (e.g., image too dark, poor contrast, and incomplete capture of the entire hand and fingers). To ensure all specimens were analyzed in the same shape space, images of right hands were mirrored (laterally reversed) to match the orientation for that of left hands. From each image, the x, y coordinates of 32 landmarks and five semi-landmarks were recorded using tpsDig (see Figure 1; Rohlf, Reference Rohlf2008a). The custom GMM software used in this study (tpsDig, tpsRelw and MorphoJ) are freely available from the SUNY Stony Brook Morphometrics website (http://life.bio.sunysb.edu/morph/).
Digitization of landmarks on the surface of the hand. Note: A photocopy of a participant's hand is shown (left) with red markers representing point digitized in tpsDig (the lengths of the index and ring fingers [mm] are also shown). The outline of the hand (right) was reconstructed in MorphoJ from the x, y coordinate information generated by tpsDig. Landmarks are shown in red and semi-landmarks in green.
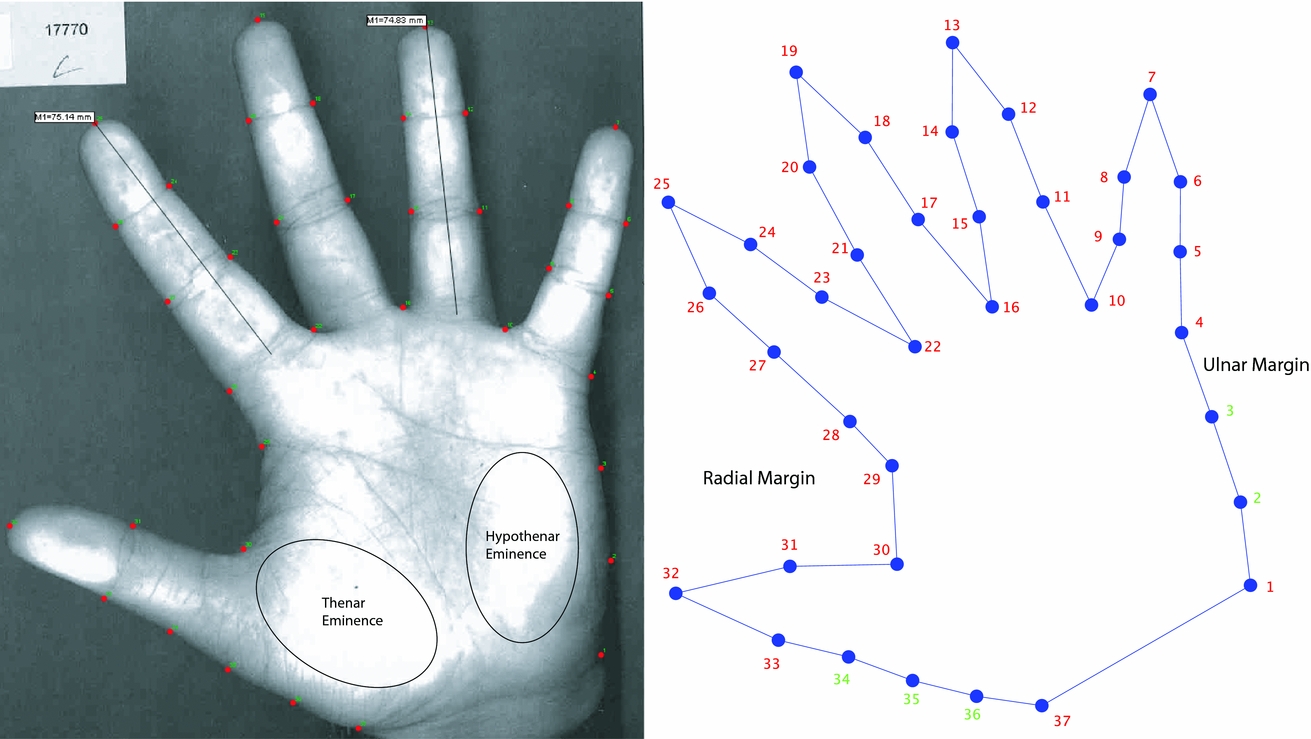
Table 1 details the points selected on the surface anatomy of the hand to represent biological correspondence between specimens in this analysis. Semi-landmarks 2, 3, 34, 35, and 36 were defined by digitizing a curve marking the outline and then resampling the curve to produce equidistant points (e.g., for semi-landmarks 2 and 3 a curve was drawn along the palm margin from landmarks 1 to 4 and the curve then resampled to create three equal length segments). Each image was scaled by using the ‘Measure’ tool in tpsDig: A horizontal line was drawn across the width of the photocopied image, and the pixel number was divided by 210 mm (A4 width) to obtain a scale factor in millimeters. Ultimately this step was not necessary as the 2D:4D ratio is a dimensionless quantity; however, it was undertaken to enable comparison of the index and ring finger lengths. To determine the finger length, the ‘Measure’ tool was used to draw a line from the digital palmar crease to the tip of the respective finger. After digitization of all specimens, the resulting TPS file was imported into tpsRelw (Rohlf, Reference Rohlf2008b) and a sliding semi-landmark analysis (minimum bending energy criterion) was conducted. Following the Procrustes superimposition, a TPS data file comprising the ‘aligned specimens’ was exported from tpsRelw and then imported into custom MorphoJ (Klingenberg, Reference Klingenberg2011) for further morphometric and statistical analyses. Among these, PCA of the dataset shape coordinates is typically performed to facilitate quantification and visualization of the shape variation present in the structure under examination.
Landmarks and Semi-Landmarks Selected on the Surface of the Hand

Results
Following PCA of the Procrustes-aligned hand shape configurations, the proportion of the total shape variation accounted for by each PC was determined from the resultant eigenvalues and is displayed graphically in Figure 2. Over one-third of the variance (38.1%) in the hand shape variables was explained by the first PC and 81.1% by the first six PCs. The remaining 64 PCs were ignored as they contributed little to the overall variation and their respective shape features proved increasingly difficult to interpret in a biological sense.
Proportion of the total hand shape variance explained by each PC. Note: Only the first 25 of 70 PCs are shown as the remainder account for negligible variation.

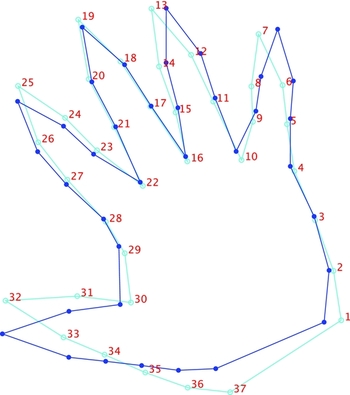
Figure 3 describes the shape changes associated with the first six PCs and illustrates both the mean shape (light blue outline) and the shape for the hand with a score ± 2 SD from the mean for that PC. The primary shape characteristic of the dataset as represented by the first PC may be interpreted as differences in spread of the fingers and thumb between specimens. An individual with a negative score on the first PC has kept their fingers and thumb in a relative state of adduction during image acquisition, while a positive score correlates with increasing abduction of the digits. In the latter case the hand appears relatively smaller; however, it is important to emphasize that this effect is artefactual without biological significance. Hands imaged in a greater state of finger abduction represent landmark configurations that have a larger distance to their centroid (geometric center) and are thus scaled down further during Procrustes superimposition, giving an illusory sense of change in size. Similarly, the second PC describes differences in spread of the digits and accounts for 18.8% of the shape variation in the data. Although in contrast to the first PC, the second mode represents ‘incongruous’ variation whereby the fingers and thumb oppose in their direction of movement. A negative score on this PC corresponds to an adducted thumb and abducted fingers and a positive score to an abducted thumb and adducted fingers. Patterns of ordination in the data were evaluated by inspecting scatterplots of the scores of respective PC pairs (e.g., PC 1 vs. PC 2, PC 3 vs. PC 4). The shapes of two individual configurations are displayed in each scatterplot to assist in visual interpretation of the shape features correlating with each PC. The scores for each hand on the first two PCs are plotted in Figure 4(a) and demonstrate a relatively uniform scatter of points, with no indication of clustering in the data. When stratified by sex, data point distributions remain homogenous across groups as indicated by the overlap of respective 95% confidence ellipses.
Visualization of shape variation on the first 10 PCs relative to the mean configuration (light blue outline) of hand shape. Note: The dark blue outline represents the mean shape ± 2 SD from the mean for that PC.

Plots of the first six dimensions of a PCA of hand shape for females (red points) and males (blue points). (a) PC 1 vs. PC 2, (b) PC 3 vs. PC 4, (c) PC 5 vs. PC 6. Note: Examples are shown as outlines to illustrate shape variations (size variation removed). The light blue outline represents the mean shape and the dark blue outline the hand shape for that individual. Confidence ellipses are color coded by sex and represent the region within which 95% of observations fall.
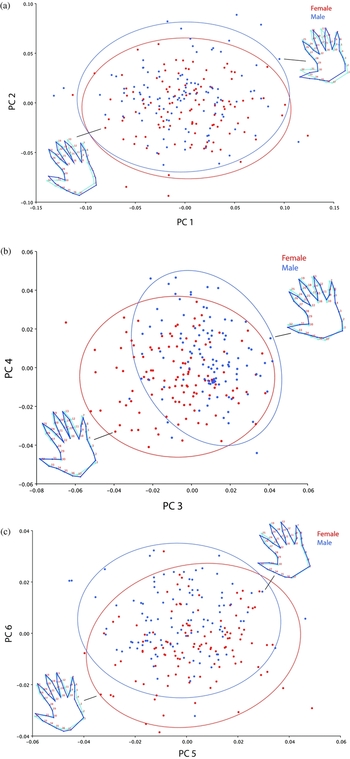
The shape feature associated with the third PC accounts for 8.0% of variation in the data and is difficult to interpret in a biological capacity. Aside from subtle deviation in the position of the thumb and middle finger, the primary change in shape appears to occur in the region of the palm near the wrist crease. Individuals with a negative score on the third PC display a shortened ulnar margin of the palm and a lengthened radial margin of the thumb compared with the converse trend for a positive score. If this represents true biological variation and not digitization error (see Discussion), the thenar and hypothenar eminences are anatomical regions of the palm likely to be implicated. The thenar and hypothenar eminences are the fleshy masses on the palm that constitute groups of muscles controlling the thumb and small fingers respectively (Figure 1). Notably, the thenar muscles are important for the complex movements required of the thumb. Thus, in terms of the shape characteristic associated with the third PC, larger thenar/smaller hypothenar and smaller thenar/larger hypothenar eminences may correlate with negative and positive scores respectively. The fourth PC appears to describe the extent of finger (sans thumb) abduction/adduction and accounts for 6.7% of the shape variance in the dataset. The scatterplot for these two PCs (Figure 4(b)) reveals an interesting finding regarding the distribution of points by sex. In contrast to that for the first two PCs, the confidence ellipses for males and females are disparate with differences predominantly arising from variation along the horizontal axis (PC 3). Females tend to manifest a negative score on the third PC compared to males with a positive score. The characteristics of hand shape described by the fifth (5.7%) and sixth (3.7%) PCs seem to be related to handbreadth in each case. For the sixth PC, individuals with negative and positive scores on this axis demonstrate narrower and broader hands respectively. The scatterplot for these two shape dimensions suggests that differences between sexes are largely driven by the sixth PC, with females tending to have a negative score and males a positive score on this PC (Figure 4(c)).
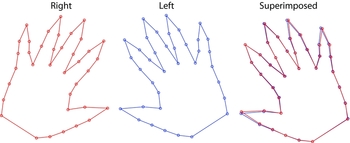
Variations in morphological symmetry between right and left hands were investigated using Procrustes ANOVA (Table 2). Differences among individuals were significant and accounted for the greatest proportion of variance in both centroid size (73.4%) and shape (79.5%). The main effect of interest – directional asymmetry (i.e., the ‘side’ term) – explained only a very small fraction of the overall shape variation and was not statistically significant for centroid size. Separate Procrustes fits of right and left hand configurations enable the magnitude of the shape component of directional asymmetry to be visualized (Figure 5). In real terms this effect is related to differences in mean finger position across sides and does not appear to be associated with other shape characteristics of the hand observed thus far.
Morphological Variation in Hand Shape Quantified by Hierarchical ANOVA

SS: sums of squares; MS: mean squares; df: degrees of freedom. F: statistics and parametric p values are provided for each effect. The % variance explained was calculated by dividing the SS for that effect by the total SS for all three effects, and multiplying by 100.
Mean configurations from separate right and left Procrustes analyses. Note: The right and left images are presented in their natural orientation. The superimposed image was constructed by laterally reversing (mirroring) the right configuration and overlaying the left, thus permitting easier visualization of actual differences.
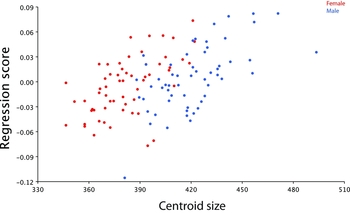
A study of allometric variation in hand morphology was conducted by multivariate regression of all shape variables on centroid size (centroid size is an important metric in GMM studies because it has the property of being mathematically independent of shape). Shape configurations were first averaged across right and left sides to produce a mean configuration for each individual. The regression scatterplot reveals an association between centroid size and shape that proved statistically significant by permutation testing (n = 10,000, p < .0001; Figure 6). In addition, relatively strong segregation of the data points was observed when classified by sex. The proportion of shape variation explained by centroid size was moderate (8.8%) and the associated shape change is depicted in Figure 7. The regression visualization is unsurprising and directly related to the shape variation described by the first PC (Figure 3) and discussed earlier; as centroid size increases so does the degree of finger abduction.
Regression scatterplot for hand shape on centroid size (mm).
Allometric variation in hand shape. Note: The change from the light blue to the dark blue outline shows the shape change for an increase in the value of centroid size by its range (i.e., by subtracting the value of the smallest configuration from the largest).
Average index and ring finger lengths (mm) were calculated for both males and females from the rescaled distances measured in tpsDig. Males had shorter index compared to ring fingers (2D: 74.37 [SD ± 3.90], 4D: 76.79 [SD ± 3.88]), although longer index relative to females with similar 2D and 4D finger lengths (2D: 70.57 [SD ± 3.95], 4D: 70.89 [SD ± 4.26]). Differences in the 2D:4D ratio were examined across sex with a t-test and males were found to have a lower mean ratio than females (males: 0.968 — 95% CI 0.962–0.974, females: 0.996 — 95% CI 0.990–1.001, p < .0001). Sex differences in centroid size (mm) were also evaluated by a t-test, and females observed to have significantly smaller hands than their male counterparts using this geometric size measure (males: 420.5 — 95% CI 416.2–424.8, females: 381.6 — 95% CI 378.0–385.1, p < .0001). This finding is consistent with the sex-based clustering noted in the regression scatterplot.
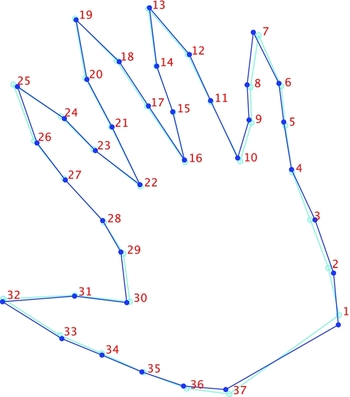
We subsequently used linear discriminant analysis (LDA) to test for sex differences in hand shape (averaged across sides) and by extension determine the efficacy of its morphometric characteristics as a marker of sexual dimorphism. Discriminant functions were computed utilizing a leave-one-out cross-validation approach to avoid inflated classification rates. A permutation test for mean differences in male–female hand shape was highly significant (p < .0001); the original Procrustes distance was not exceeded in 10,000 rounds of randomly allocating observations to the two groups. The Procrustes distance between males and females was relatively small (0.025), and as a result the corresponding shape change was modest (Figure 8). The difference between shapes is displayed as a change from the mean female hand shape (light blue) to the mean male hand shape (dark blue). Aside from marginal variation in finger position, there are two aspects of shape difference appreciated easily. The first relates to the variation observed along the third PC (thenar/hypothenar variation), and the second relates to that along the sixth PC (differences in hand breadth), the latter a feature more likely to be grounded in biology. Thus, males were found to have slightly wider hands and potentially larger palms proximally on the ulnar side. In addition, while the effect is subtle, the male index finger is shorter than that for females, which corresponds to the reduced 2D:4D ratio noted for the former group.
Differences in hand shape between females (light blue outline) and males (dark blue outline).
Cross-validated classification rates calculated from the LDA of shape differences are presented in Table 3. The higher the classification rate, the better the method at allocating each hand to its true sex status. Using a fully multivariate approach in quantifying shape information, hands were correctly classified as of males 71.9% of the time in contrast to 81.4% for females. Given the widespread utility of the 2D:4D ratio in studies of sexual dimorphism, LDA was also performed using these data to enable comparison to the Procrustes technique. Correct assignment rates for males were similar to that derived from the full shape approach (68.4%); however, fewer females were accurately specified (69.5%). The effectiveness of hand centroid size was also investigated in a similar manner. Of all the markers evaluated, centroid size was proved to be the most powerful marker in discriminating between sexes. While classification rates for females were the same as for shape (81.4%), a greater proportion of males were correctly assigned (80.7%) compared to rates for either shape or the 2D:4D ratio.
Classification Rates Derived From Discriminant Functions for Markers of Hand Morphology
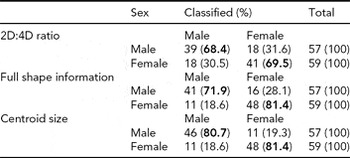
Numbers in bold indicate the proportion of correct classifications.
Discussion
In this study we explored alternative facets of hand morphology to the conventional 2D:4D ratio that may be useful in differentiating between the sexes. Discriminant analysis has shown that a Procrustes-based metric using the full shape information of the hand was more effective than the 2D:4D ratio in separating males and females. However, centroid size was superior to both of these markers with the highest rate of correct classifications for males and as effective as shape for females.
While there are a plethora of studies in the literature that have considered the 2D:4D ratio in various contexts, there are comparatively few data available regarding general anthropometric characteristics of the hand. Although hand dimensions were not quantified in the current study,Footnote 1 the results suggest that males tend to have slightly broader hands; however, length appears similar between sexes. In contrast to this latter finding, two recent publications evaluating hand preference (Kulaksiz & Gözil, Reference Kulaksiz and Gözil2002) and ballplayer grip strength (Barut et al., Reference Barut, Demirel and Kiran2008) on anthropometric measurements reported larger overall length and width hand dimensions in males relative to females. The authors also calculated the ‘shape index’, defined as hand width × 100/hand length, to ascribe a measure of shape to the hand (the average shape index in humans is ~0.44 and is typically larger in males than in females). Buffa et al. (Reference Buffa, Marini, Cabras, Scalas and Floris2007) examined patterns of hand variation in a Sardinian sample using a similar approach to the current study whereby a PCA was performed on a series of (linear) shape variables. They found evidence of sex differences based on hand morphology, with men tending to have greater overall dimensions and length of the thumb relative to other fingers compared to women.
We have intentionally been cautious in discussing the component of shape change across sex relating to the third PC and are reluctant to endorse this as true variation. Indeed, if the effect has a biological basis, it is difficult to hypothesize why. To speculate, one could consider a biomechanical theory; might the smaller hands of females require a relatively larger thenar muscle arrangement to move the thumb? Certainly, the thenar muscles are affected in several pathological conditions, most notably carpal tunnel syndrome (CTS; Kaymak et al., Reference Kaymak, Inanici, Ozçakar, Cetin, Akinci and Hasçelik2008) Hand weakness is well recognized in sufferers of CTS and is frequently reported before the late-stage onset of thenar atrophy. In any case, to evaluate whether this effect is in fact genuine, more work needs to be done taking into account the study limitations that we will discuss shortly, and improving the methodology to avoid potential sources of error.
The centroid size of the hand configuration was found to be similar across right and left sides but different between the sexes, with females demonstrating smaller hands by this measure. Unfortunately, it is not possible to directly compare centroid size with commonly used indicators of size such as area and volume, making interpretation difficult. In addition, centroid size is dependent on how a landmark configuration is defined; if we had used fewer landmarks to designate the hand, the value would decrease. During digitization, centroid size is normally in pixels. However, if a scale factor is applied, it is subsequently defined in those units (in the case of this study, measurements were rescaled in millimeters). Accordingly, the average hand centroid size for females in this analysis was 382 mm compared with 421 mm for males. Using a more familiar frame of reference, in a study of the relationship between hand and body surface area, Lee et al. (Reference Lee, Choi and Kim2007) observed that on average females had smaller hands than their male counterparts (females: 392 cm2, males: 448 cm2). Interestingly, hand surface area as a percentage of total body surface area was not found to be different between the groups (females: 2.4%, males: 2.5%).
The 2D:4D ratio was first proposed as a non-invasive biomarker of prenatal androgen effects in 1998 (Manning et al., Reference Manning, Scutt, Wilson and Lewis-Jones1998). Using the search term ‘2D:4D[all]’, a Pubmed query retrieved 262 articles, an indication of how extensively the ratio has been applied in research questions concerning sexual dimorphism, in a relatively short period of time. However, researchers are now beginning to investigate new measures in an attempt to improve predictive power and yield more informative data. Loehlin et al. (Reference Loehlin, Medland and Martin2009) recently evaluated the utility of ‘relative finger length’, a ratio of each individual finger length to the sum of all four fingers (excluding thumb). They found that the relative length of the index finger was the most effective measure and marginally superior to the 2D:4D ratio in discriminating between the sexes, and advocate that in future studies the lengths of all fingers should be considered. The results of our analysis also demonstrate the greater potential of alternative markers of hand morphology as both hand shape and centroid size were better predictors of sex than the conventional 2D:4D ratio. Given its univariate simplicity, the improved sensitivity of centroid size over shape for detecting males favors the use of this measure. In considering alternative methods, a trade-off exists between improving discriminatory power and optimizing time spent on data acquisition. Certainly, in Procrustes analysis, the digitization of many landmarks on many specimens can take considerable time, although as automated segmentation algorithms continue to improve, computers may soon obviate much of this manual task. The additional benefit inherent in using a GMM approach for the analysis of hand morphology is the more complete characterization of shape variation present, something that is not possible by simply taking a ratio of finger lengths. For these reasons, in future work researchers might consider a combination of methods. Shape variation of the hand could be quantified using a Procrustes approach and then together with centroid size applied in analyses of sex determination. If desired, the 2D:4D ratio (or any other ratio of finger length) is easily obtained, as minimal extra time and effort is required at the time of digitization to measure these dimensions.
The primary purpose of this work was to illustrate potential new applications for GMM in the field of twin research. As such, the current study is preliminary and has several shortcomings that require discussion. We believe, the main limitation in this analysis concerns the non-standardization of finger position during image acquisition. The primary modes of shape variation in the dataset (i.e., the first and second PCs) relate to the degree of finger spread and therefore obfuscate the weaker signals associated with variation in the ‘fixed’ component of morphology (i.e., digit/palm width, length, and so on). This is further evidenced by the results of allometric regression; the effect of increasing digit abduction with centroid size predominates and it is difficult to elicit any other pattern of allometric variation. In further work, standardization of digit position could be achieved by using pegs secured on a surface against which the participant maintains a steady state of firm pressure with his/her fingers. The other significant limitation of this study pertains to the quality of images available for digitization. As these were photocopies, there was considerable variability in the brightness and contrast of the images. As the wrist (by virtue of its recessed anatomy in palm down placement) was often in shadow, it was often difficult to adequately visualize the wrist crease for landmark placement. Consequently, the shape variation observed along the third PC might in fact have minimal biological relevance and instead be a function of digitization error. High quality digital photography of the hand using standardized camera settings and focal distance, and optimum illumination would largely negate this issue in future studies.
In conclusion, our study has shown that the characterization of hand morphology using a new approach based on GMM methods is superior to the 2D:4D ratio as a marker of sexual dimorphism. In addition, we have endeavored to address a broader aim in this work: to introduce techniques from a relatively new and disparate discipline to the field of twin research. Ideally this will enable a more thorough dissection of morphological variation in a range of human physical traits compared to the traditional linear measures of shape.
Acknowledgments
Core funding for the Raine Study is provided by The University of Western Australia (UWA), The Telethon Institute for Child Health Research, Raine Medical Research Foundation, UWA Faculty of Medicine, Dentistry and Health Sciences, the Women's and Infant's Research Foundation, and Curtin University. This work was also supported financially by the Ophthalmic Research Institute of Australia and the Australian National Health and Medical Research Council (NHMRC 1021105). Paul G. Sanfilippo is the recipient of an NHMRC postgraduate scholarship. Centre for Eye Research Australia receives operational infrastructure support from the Victorian Government. The authors acknowledge the Raine Study participants, Raine Study Management for access to cohort information, and the Raine Study Team who were involved in recruitment and cohort review.



