


Introduction
The horrors of war can leave a lasting mark on the human mind. This is true even for military personnel, despite being trained to operate under the most extreme circumstances. Although posttraumatic stress disorder (PTSD) is the most well-known combat-related mental illness, symptoms of fatigue, depression, and anxiety are also often present (Reijnen, Rademaker, Vermetten, & Geuze, Reference Reijnen, Rademaker, Vermetten and Geuze2015). In recent years, however, the neuroscientific community has started to move beyond the investigation of heterogeneous psychiatric constructs such as PTSD and major depression, in favor of (endo)phenotypes that are trans-diagnostic in nature (Insel et al., Reference Insel, Cuthbert, Garvey, Heinssen, Pine, Quinn and Wang2010). One such complaint that is frequently reported in the aftermath of military deployment is impulsive aggression (Heesink, Rademaker, Vermetten, Geuze, & Kleber, Reference Heesink, Rademaker, Vermetten, Geuze and Kleber2015). Individuals who suffer from impulsive aggression intermittently display outbursts of rage that are grossly out of proportion to the precipitating event, and are strongly driven by emotion (e.g. anger, fear) (Coccaro, Reference Coccaro2011). Evidence suggests that symptoms of aggression and anxiety-related phenomena commonly co-occur, and that they may share the same underlying mechanisms (Carré, Fisher, Manuck, & Hariri, Reference Carré, Fisher, Manuck and Hariri2012; Dugré, Dumais, Dellazizzo, & Potvin, Reference Dugré, Dumais, Dellazizzo and Potvinn.d.; Galbraith et al., Reference Galbraith, Carliner, Keyes, McLaughlin, McCloskey and Heimberg2018; Keyes, McLaughlin, Vo, Galbraith, & Heimberg, Reference Keyes, McLaughlin, Vo, Galbraith and Heimberg2016). The consequences of such potentially violent and/or destructive acts represent a major concern for the military, mental health care organizations, and society as a whole (Krug, Mercy, Dahlberg, & Zwi, Reference Krug, Mercy, Dahlberg and Zwi2002). It is therefore imperative that we gain a better understanding of the (neural) mechanisms that govern such behaviors.
Impulsive or reactive aggression is believed to be – at its core – a form of defective emotion regulation (Miles et al., Reference Miles, Sharp, Tharp, Stanford, Stanley, Thompson and Kent2017; Miles, Menefee, Wanner, Tharp, & Kent, Reference Miles, Menefee, Wanner, Tharp and Kent2016). This notion seems to be consistent with research into the neural basis of impulsive aggression, which has implicated several brain areas known to be involved in the regulation of emotion in a broader sense, including the amygdala, orbitofrontal cortex (OFC), anterior cingulate cortex (ACC), and dorsolateral prefrontal cortex (DLPFC) (Coccaro, Sripada, Yanowitch, & Phan, Reference Coccaro, Sripada, Yanowitch and Phan2011; Davidson, Putnam, & Larson, Reference Davidson, Putnam and Larson2000; Phillips, Ladouceur, & Drevets, Reference Phillips, Ladouceur and Drevets2008; Siever, Reference Siever2008). For instance, Coccaro et al. reported that the amygdala of patients with impulsive aggression problems was hyper-responsive to the presentation of angry (but not fearful) facial stimuli, as compared to the amygdala of non-aggressive healthy controls; they also noted a concurrent decrease in functional connectivity between the amygdala and OFC (Coccaro, McCloskey, Fitzgerald, & Phan, Reference Coccaro, McCloskey, Fitzgerald and Phan2007; replicated in a larger sample in McCloskey et al., Reference McCloskey, Phan, Angstadt, Fettich, Keedy and Coccaro2016). In another study, da Cunha-Bang, Fisher, Hjordt, Holst, and Knudsen (Reference da Cunha-Bang, Fisher, Hjordt, Holst and Knudsen2018) observed a heightened amygdala response to fearful (but not angry) facial stimuli in violent offenders with impulsive aggression, relative to non-incarcerated and non-aggressive controls. In a recent study by Tonnaer, Siep, van Zutphen, Arntz, and Cima (Reference Tonnaer, Siep, van Zutphen, Arntz and Cima2017), a significant decrease in the activation of the DLPFC was observed in impulsively aggressive violent offenders that were asked to actively regulate their emotion while listening to an anger-provoking script; relative to non-offender and non-aggressive controls. In line with this latter result, our own group recently demonstrated a decrease in resting-state functional connectivity between the basolateral amygdala and DLPFC in combat veterans with versus without impulsive aggression problems (Varkevisser, Gladwin, Heesink, van Honk, & Geuze, Reference Varkevisser, Gladwin, Heesink, van Honk and Geuze2017). We also observed a significant group difference in the coupling of the dorsal ACC and amygdala in the same set of combat veterans when presented with negative emotional (non-facial) pictures (Heesink et al., Reference Heesink, Gladwin, Vink, van Honk, Kleber and Geuze2018). Together these findings point to a central role of heightened amygdala responsiveness to emotional stimuli, along with diminished regulatory prefrontal control by regions such as the OFC, ACC, and DLPFC in the neurobiology of impulsive aggression.
While the above-described functional imaging work has made great strides, over the last decade or so, in unraveling the (dys)functional neural circuits that may underlie impulsive aggression, far less progress has been made, or at least more ambiguous results have been obtained, by studies that have aimed to explore its neuroanatomical underpinnings. In point of fact, only four studies have been published thus far that formally examined the structural brain correlates of impulsive aggression – i.e. separate from its more cold-blooded and proactive counterpart, instrumental aggression. Notably, two of these publications were in fact concerned with the same dataset of epileptic patients with versus without co-morbid impulsive aggression problems. In those two inquiries, van Elst et al. reported a significant reduction in left frontal grey matter volume in the impulsive aggression group, relative to the non-aggressive (epileptic) controls, whereas no significant group effect was recorded in total amygdala volume (van Elst, Woermann, Lemieux, Thompson, & Trimble, Reference van Elst, Woermann, Lemieux, Thompson and Trimble2000; Woermann et al., Reference Woermann, van Elst, Koepp, Free, Thompson, Trimble and Duncan2000). In a more recent study, Coccaro, Lee, McCloskey, Csernansky, and Wang (Reference Coccaro, Lee, McCloskey, Csernansky and Wang2015) recorded significant alterations in the shape (but not size) of both the (whole) amygdala and hippocampus of patients with impulsive aggression problems, when compared to non-aggressive healthy controls. Finally, Yang, Joshi, Jahanshad, Thompson, and Baker (Reference Yang, Joshi, Jahanshad, Thompson and Baker2017) recorded a significant positive correlation between impulsive aggression scores, measured with the Reactive and Proactive Aggression Questionnaire (RPQ), and grey matter volume of the OFC, as well as between impulsive aggression scores on the RPQ and cortical thickness of the DLPFC, in a community-derived sample of adolescent twins. In sum, this small body of research seems to be in keeping with the aforementioned functional imaging work on impulsive aggression, insofar as that it tends to implicate the same cortical-limbic regions of the brain as typically described by currently prevailing neural circuit models on emotion regulation in a more general sense, i.e. under non-pathological circumstances.
In all other relevant structural magnetic resonance imaging (MRI) works published thus far, the vital distinction between the impulsive and instrumental forms of aggression was not made. Hoptman et al. (Reference Hoptman, Volavka, Weiss, Czobor, Szeszko, Gerig and Bilder2005) found a significant positive association between general aggression, measured with the Total Aggression Severity (TAS) scale, and grey matter volume of the left OFC, in a sample of treatment-resistant schizophrenic and schizoaffective patients. In contrast, Antonucci et al. (Reference Antonucci, Gansler, Tan, Bhadelia, Patz and Fulwiler2006) recorded no significant association between left or right OFC grey matter volume and general aggression, measured with the Lifetime History of Aggression (LHA) and Buss-Perry Aggression Questionnaires (BPAQ), in a sample of non-psychotic psychiatric patients; instead, the authors noted a significant positive correlation between scores on the LHA and the ratio of right-to-left OFC gray matter volume. In a meta-analysis of the structural MR literature on borderline personality disorder (BPD), a form of Axis II psychiatric dysfunction often marked by outbursts of impulsive aggression, Nunes et al. (Reference Nunes, Wenzel, Borges, Porto, Caminha and de Oliveira2009) reported significant reductions in grey matter volume of both the hippocampus and amygdala. Results from community-derived studies further indicate a positive association between general aggression psychometrics and grey matter volume of the OFC, with some (but not all) indicating a reduction in amygdala or hippocampus volume, and mixed results having been obtained in regards to volumetric measures of the ACC (Besteher et al., Reference Besteher, Squarcina, Spalthoff, Bellani, Gaser, Brambilla and Nenadić2017; Bobes et al., Reference Bobes, Ostrosky, Diaz, Romero, Borja, Santos and Valdés-Sosa2013; Coccaro et al., Reference Coccaro, Cremers, Fanning, Nosal, Lee, Keedy and Jacobson2018; Matthies et al., Reference Matthies, Rüsch, Weber, Lieb, Philipsen, Tuescher and van Elst2012; Yang et al., Reference Yang, Joshi, Jahanshad, Thompson and Baker2017). Taken together, the available structural MR research suggests that impulsive aggression may be marked by an increase in the volume of the OFC, with some evidence of greater cortical thickness of the DLPFC; the possible involvement of the ACC currently remains to be ascertained. Furthermore, inconsistent findings have been recorded in regards to potential volume alterations of the amygdala and/or hippocampus in impulsive aggression.
In this article, we further explore the neuroanatomical correlates of combat-related impulsive aggression, expanding on the existing literature in a number of important ways: First, to our knowledge, no previous study has ever examined the structural brain correlates of impulsive aggression in a veteran sample, this in spite of the high prevalence of such symptoms in this population (Reijnen et al., Reference Reijnen, Rademaker, Vermetten and Geuze2015). Furthermore, we complemented the above-described body of research by conducting not only subcortical volumetry, but also surface-based cortical thickness analysis – an integral approach adopted by only a few other earlier studies (e.g. see Besteher et al., Reference Besteher, Squarcina, Spalthoff, Bellani, Gaser, Brambilla and Nenadić2017). To achieve this goal, we subjected the anatomical MRI data of combat veterans with and without impulsive aggression problems to the automated segmentation and parcellation methods of FreeSurfer v. 6.0 (http://surfer.nmr.mgh.harvard.edu/). Based on the available literature, we hypothesized that alterations in cortical thickness would be present in the OFC, ACC, and/or DLPFC of the combat veterans with impulsive aggression, as compared to the non-aggressive combat controls. We also conducted exploratory (i.e. whole-brain) analysis of cortical thickness. Our second aim was to determine whether volumetric alterations would be present in the amygdala and/or hippocampus of the combat veterans with versus without impulsive aggression. To answer this question, we utilized a recently developed segmentation algorithm that enabled us to measure the volumes of not only the amygdala and hippocampus as a whole – as previous studies have done – but also that of their constituent subdivisions (Iglesias et al., Reference Iglesias, Augustinack, Nguyen, Player, Player, Wright and van Leemput2015; Saygin et al., Reference Saygin, Kliemann, Iglesias, van der Kouwe, Boyd, Reuter and Augustinack2017). Evidence suggests that these subdivisions may play different functional roles in the context of emotion regulation. For instance, the basolateral nucleus (BLA) of the amygdala is believed to facilitate emotional learning by integrating inputs from sensory cortices and subcortical brain areas, whereas the centromedial nucleus (CeM) is thought to serve more as the main output unit of the amygdala (Davis & Whalen, Reference Davis and Whalen2001; Maren & Holmes, Reference Maren and Holmes2016; Phelps & LeDoux, Reference Phelps and LeDoux2005). In addition, a strong case has been established for functional specialization along the long axis of the hippocampus, with an anterior segment that processes large-scale episodic information, and a posterior zone that favors more fine-grained autobiographical content (Poppenk, Evensmoen, Moscovitch, & Nadel, Reference Poppenk, Evensmoen, Moscovitch and Nadel2013; Strange, Witter, Lein, & Moser, Reference Strange, Witter, Lein and Moser2014). Hence, for the present purposes, sub-volume measurements were extracted from the participants' MR data for the basolateral and centromedial nuclei of the amygdala, along with the anterior (head), intermediate (body), and posterior (tail) segments of the hippocampus. Finally, based on the above established relationship between aggression and anxiety-related symptoms (Carré et al., Reference Carré, Fisher, Manuck and Hariri2012; Dugré et al., Reference Dugré, Dumais, Dellazizzo and Potvinn.d.; Galbraith et al., Reference Galbraith, Carliner, Keyes, McLaughlin, McCloskey and Heimberg2018; Keyes et al., Reference Keyes, McLaughlin, Vo, Galbraith and Heimberg2016), the interplay between the extracted brain measures (volume or thickness) and levels of anxiety were also explored.
Methods
Participants
Structural MR images were acquired for a sample of 29 male veterans with impulsive aggression problems, recruited from four outpatient clinics of the Military Mental Healthcare Organization in the Netherlands, and 30 non-aggressive combat controls, recruited through advertisements or participation in prior research at our department. Candidates were considered eligible for participation if the following pre-conditions were met: (i) a history of military deployment with a minimum of 4 months, and (ii) an age between 18 and 50 years. Veterans with a history of neurological disease, claustrophobia, or a pacemaker or any other metallic implant were excluded from participation. Problems with impulsive aggression were ascertained via the research diagnostic criteria for the intermittent explosive disorder (IED), as described by Coccaro (Reference Coccaro2011). A positive indication of IED was the main requirement for inclusion in the impulsive aggression group. The main criterion for inclusion in the combat control group was the absence of any anger- and aggression-related complaints, with the added requirement of no other current DSM-IV Axis-I diagnosis. All candidates gave written informed consent prior to their participation. The BPAQ was administered to further quantify the levels of Physical and Verbal Aggression, and Hostility (Buss & Perry, Reference Buss and Perry1992). The State-Trait Anger Expression Inventory (STAXI-2) was administered to quantify the levels of State and Trait Anger (Spielberger, Reference Spielberger1999). The Anxious Arousal (AA) and Anhedonic Depression (AD) subscales of the Mood and Anxiety Symptom Questionnaire (MASQ) were used to quantify the levels of anxiety and depression, respectively (de Beurs, den Hollander-Gijsman, Helmich, & Zitman, Reference de Beurs, den Hollander-Gijsman, Helmich and Zitman2007). The Re-experiencing, Avoidance, and Hyperarousal subscales of the PTSD Symptom Scale (PSS) were administered to measure the levels of PTSD symptomatology (Carlier, Lamberts, Van Uchelen, & Gersons, Reference Carlier, Lamberts, Van Uchelen and Gersons1998).
MRI acquisition
All participants underwent high-resolution 3D sensitivity encoded (SENSE) T1-weighted MR imaging on a 3 Tesla Philips Achieva scanner (Phillips Medical Systems, Best, the Netherlands): TR = 10 ms, TE = 4.6 ms, flip angle 8°, 200 slices sagittal orientation, FOV = 240 × 240 × 160, matrix = 304 × 299.
Cortical thickness analyses
Cortical thickness measurements were obtained from structural MR images via the automated surface reconstruction pipeline of FreeSurfer v. 6.0 (http://surfer.nmr.mgh.harvard.edu/, RRID:SCR_001847). The in-depth technical details of this procedure have been described elsewhere (Fischl et al., Reference Fischl, Salat, Busa, Albert, Dieterich, Haselgrove and Dale2002; Fischl & Dale, Reference Fischl and Dale2000; Fischl et al., Reference Fischl, Salat, van der Kouwe, Makris, Ségonne, Quinn and Dale2004a). In brief, each participant's T1-weighted anatomical image underwent the following processing steps: (1) correction of small head motions (Reuter, Rosas, & Fischl, Reference Reuter, Rosas and Fischl2010), (2) correction of signal intensity non-uniformities due to magnetic field inhomogeneities (intensity normalization) (Sled, Zijdenbos, & Evans, Reference Sled, Zijdenbos and Evans1998), (3) removal of non-brain tissue (skull-stripping) (Ségonne et al., Reference Ségonne, Dale, Busa, Glessner, Salat, Hahn and Fischl2004), (4) affine registration to the Talairach atlas, (5) segmentation of the subcortical white matter and deep gray matter structures (Fischl et al., Reference Fischl, Salat, Busa, Albert, Dieterich, Haselgrove and Dale2002; Fischl et al., Reference Fischl, Salat, van der Kouwe, Makris, Ségonne, Quinn and Dale2004a), (6) tessellation of the grey-to-white and grey-to-cerebrospinal fluid (CSF) surface boundaries, (7) automated correction of topology defects (Fischl, Liu, & Dale, Reference Fischl, Liu and Dale2001; Ségonne, Pacheco, & Fischl, Reference Ségonne, Pacheco and Fischl2007), (8) surface deformation for optimal placement of the grey-to-white and grey-to-CSF boundaries (Dale, Fischl, & Sereno, Reference Dale, Fischl and Sereno1999; Dale & Sereno, Reference Dale and Sereno1993; Fischl & Dale, Reference Fischl and Dale2000), (9) 2D smoothing with a circular symmetric Gaussian kernel (full width at half maximum: 10 mm), (10) surface inflation and registration to a spherical atlas for inter-subject matching of cortical folding patterns (Fischl, Sereno, Tootell, & Dale, Reference Fischl, Sereno, Tootell and Dale1999), and (11) parcellation of the cortical mantle into the 34 brain areas of the Desikan–Killiany atlas (Desikan et al., Reference Desikan, Ségonne, Fischl, Quinn, Dickerson, Blacker and Killiany2006; Fischl et al., Reference Fischl, van der Kouwe, Destrieux, Halgren, Ségonne, Salat and Dale2004b). Cortical thickness maps were extracted from the participants' surface mesh representations by calculating the shortest possible distance from the grey-to-white matter boundary to the outer cortical envelope at each vertex (Fischl & Dale, Reference Fischl and Dale2000). All surface models were visually inspected for inaccuracy and manually edited when required.
Subcortical volumetric analyses
Volumetric measurements of the subdivisions of the amygdala and hippocampus were derived from the participants' T1 structural images via a new automated segmentation module in FreeSurfer v. 6.0 (Iglesias et al., Reference Iglesias, Augustinack, Nguyen, Player, Player, Wright and van Leemput2015; Saygin et al., Reference Saygin, Kliemann, Iglesias, van der Kouwe, Boyd, Reuter and Augustinack2017). In brief, the method utilizes a probabilistic atlas built from ultra-high resolution (100–200 μm) T2*-weighted images (field strength: 7 Tesla) of postmortem brains, in conjunction with a Bayesian-inference-based algorithm, to automatically segment the amygdala and hippocampus into their constituent subregions (see Iglesias et al., Reference Iglesias, Augustinack, Nguyen, Player, Player, Wright and van Leemput2015 and Saygin et al., Reference Saygin, Kliemann, Iglesias, van der Kouwe, Boyd, Reuter and Augustinack2017 for further details). For the present purposes, the following annotations were derived from the segmentation pipeline: the lateral-, basal-, accessory basal-, medial-, and central nuclei of the amygdala, along with the head, body, and tail of the hippocampus. Volumes of the whole amygdalar and hippocampal bodies were additionally extracted from the data. The ENIGMA protocol was used for quality assurance of the data (www.enigma.ini.usc.edu).
Regions-of-interest definition
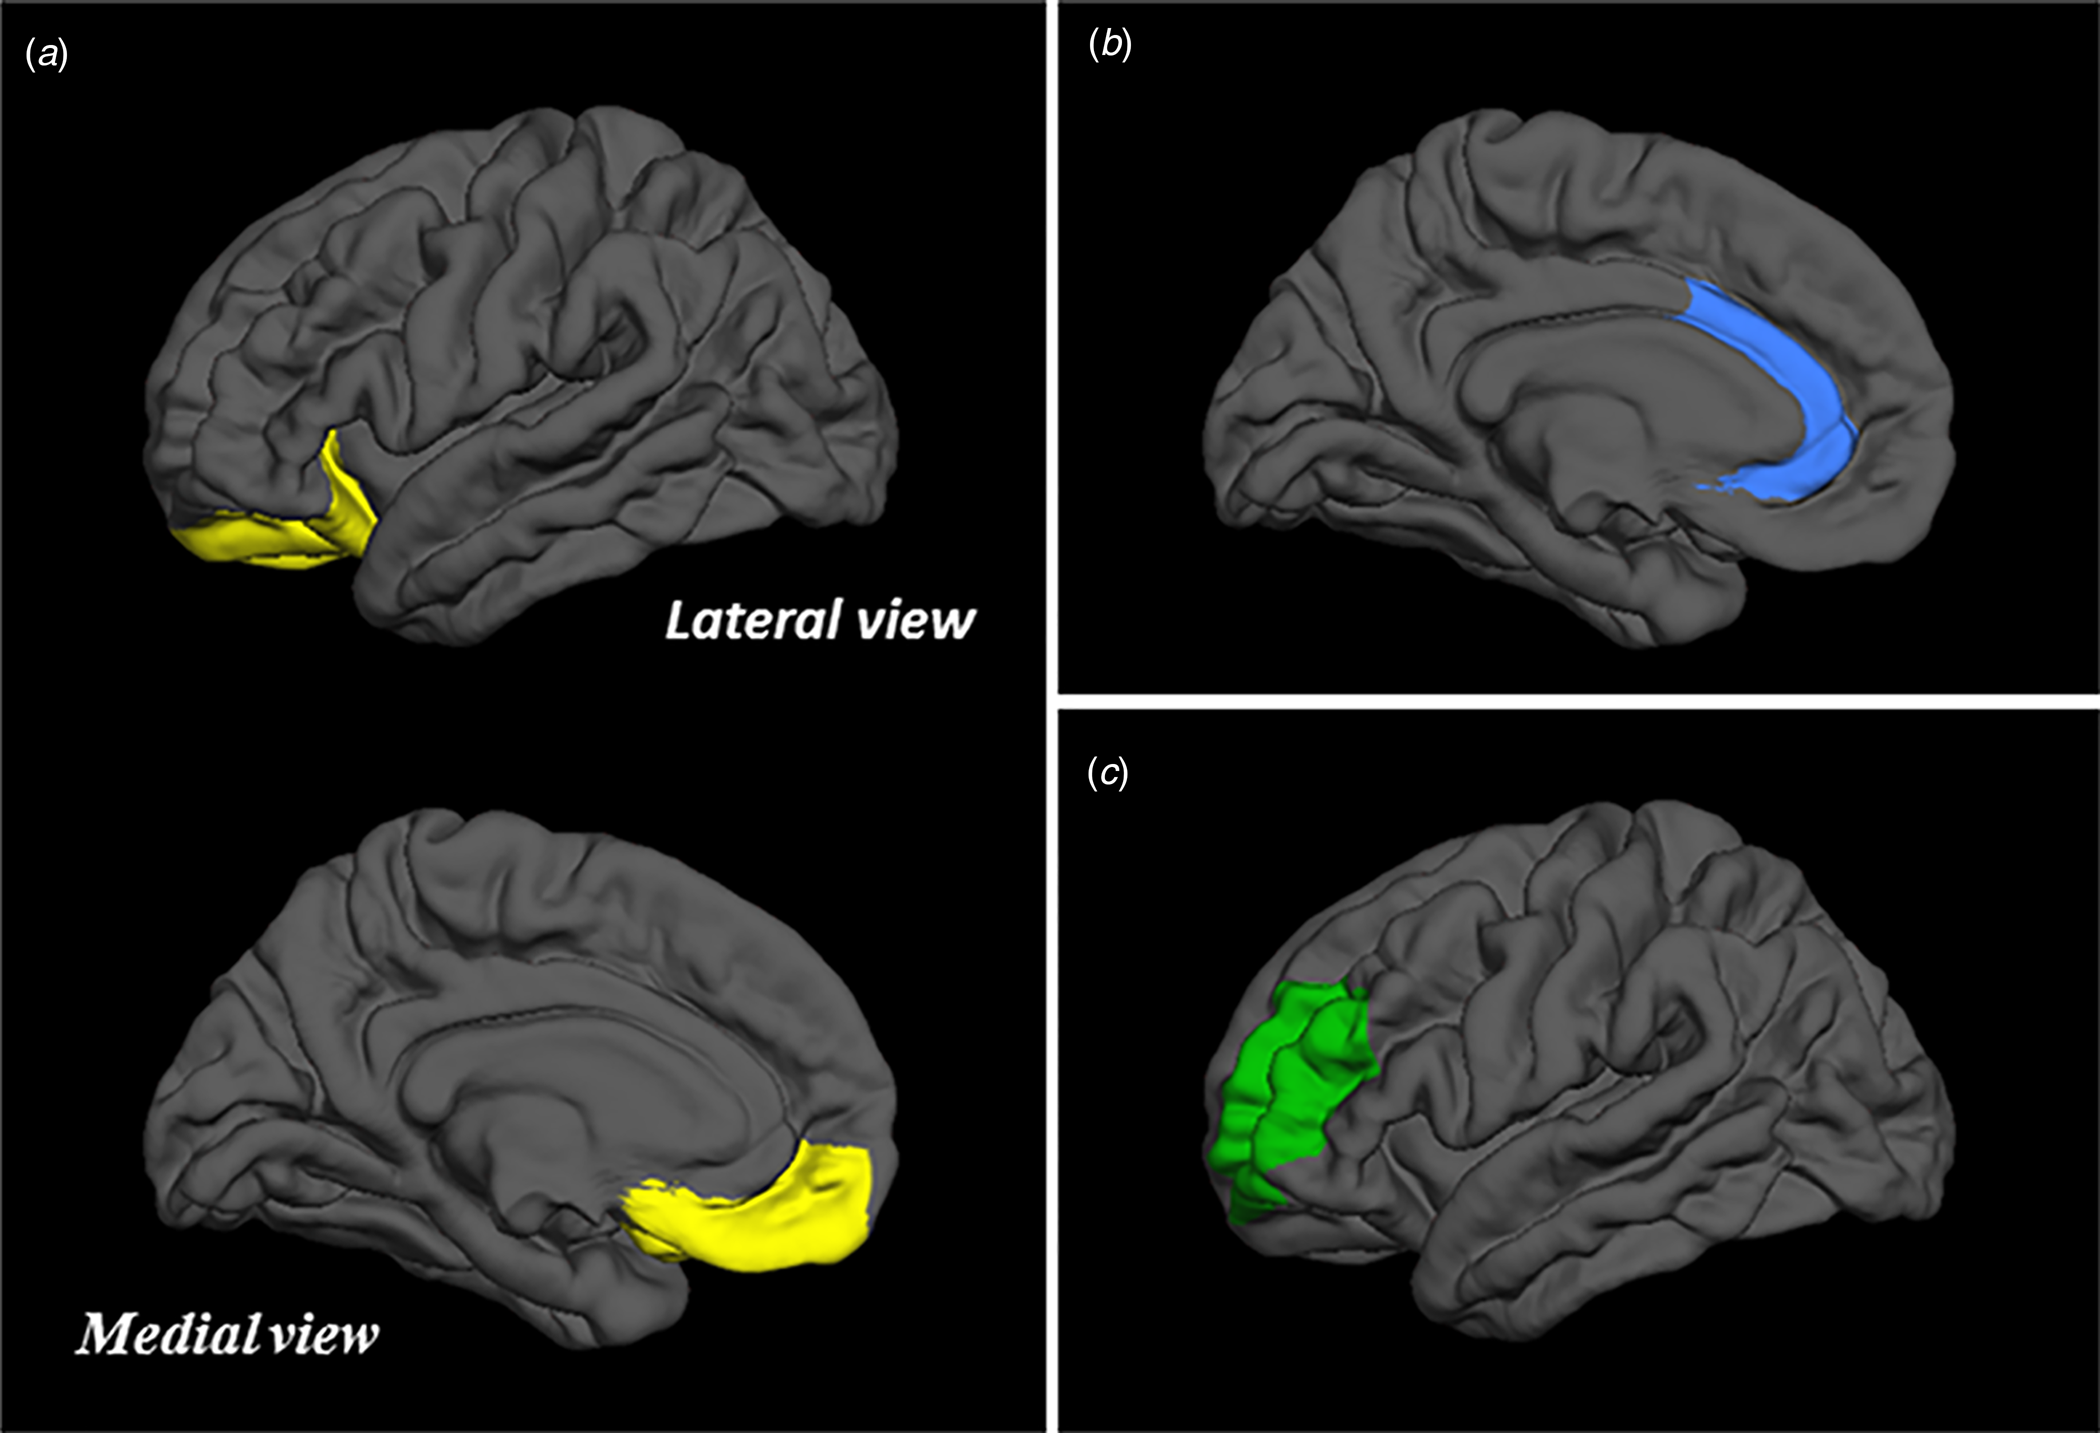
Hypothesis-driven cortical thickness analyses were restricted to the (bilateral) OFC, ACC, and DLPFC as regions-of-interest (ROIs). The OFC was defined as an ROI by conjoining the vertices of the medial and lateral orbitofrontal labels, generated via the above-mentioned cortical parcellation pipeline in FreeSurfer v. 6.0 (Desikan et al., Reference Desikan, Ségonne, Fischl, Quinn, Dickerson, Blacker and Killiany2006; Fischl et al., Reference Fischl, van der Kouwe, Destrieux, Halgren, Ségonne, Salat and Dale2004b), and calculating the mean thickness over this area (in mm) per hemisphere (see Fig. 1a). Likewise, the left and right ACC were defined as a priori ROIs by combining the vertices of the rostral and caudal anterior cingulate labels and then computing the average thickness within the two areas (see Fig. 1b). The DLPFC ROI was created by conjoining the vertices of the rostral and caudal middle frontal areas, separate for each hemisphere, and calculating the mean thickness; a coronal cut was applied at Talairach coordinate y = 26 to ensure that any non-prefrontal vertices would be excised from the labels (see Fig. 1c) (Rajkowska & Goldman-Rakic, Reference Rajkowska and Goldman-Rakic1995). Confirmatory volumetric analyses were confined to the basolateral and centromedial subdivisions of the amygdala, as well as the head, body, and tail of the hippocampus. The BLA was defined as an ROI by summing the volumes (in mm3) of the lateral-, basal-, and accessory basal subnuclei of the amygdala, obtained via the segmentation procedure described above (Saygin et al., Reference Saygin, Kliemann, Iglesias, van der Kouwe, Boyd, Reuter and Augustinack2017), separately for each hemisphere (see Fig. 2). The left and right CeM were defined as a priori ROIs by combining the volumes of the medial and central subnuclei of the amygdala of each hemisphere. The head, body, tail, and total volumes of the left and right hippocampi were directly extracted from the segmentation pipeline (see Fig. 2) (Iglesias et al., Reference Iglesias, Augustinack, Nguyen, Player, Player, Wright and van Leemput2015).
Visualization of the OFC (a), ACC (b), and DLPFC (c) regions-of-interest.
Visualization of the basolateral (orange) and centromedial (pink) subdivisions of the amygdala (confirmatory ROIs), along with the head (dark blue), body (medium blue), and tail (light blue) of the hippocampus (exploratory ROIs).

Statistical analysis
The significance of group differences in anger (STAXI-2) and aggression (BPAQ), as well as anxiety (MASQ-AA), depression (MASQ-AD), and PTSD (PSS) scores was tested via independent samples t tests.
The subject-level mean thickness measurements of the OFC, ACC, and DLPFC were entered as outcome variables in general linear models (GLM) that assessed the magnitude and significance of group as the main regressor (dummy-coded: combat control = 0, impulsive aggression = 1), with age as a covariate of no interest. Age was included as a nuisance variable in these analyses due to its established role in cortical thinning in the general population (Salat et al., Reference Salat, Buckner, Snyder, Greve, Desikan, Busa and Fischl2004). A multivariate analysis of variance was used to determine whether the interaction term group × age should be included in the models; if a significant omnibus effect of group × age was detected at the multivariate level, the interaction term was added to each of the individual GLMs. Similarly, the volumetric measurements of the amygdalar and hippocampal ROIs were entered as outcome variables in general linear models that tested the magnitude and significance of group as the main regressor, alongside age and intracranial volume (ICV) as covariates of no interest (Sanfilipo, Benedict, Zivadinov, & Bakshi, Reference Sanfilipo, Benedict, Zivadinov and Bakshi2004). Age was again included as a nuisance variable in these models because of its association with both global and regional grey matter reductions in healthy volunteers (Good et al., Reference Good, Johnsrude, Ashburner, Henson, Friston and Frackowiak2001). ICV was added as an additional nuisance variable in order to account for possible scaling of amygdalar or hippocampal (sub)volume with general head size (Luders, Steinmetz, & Jancke, Reference Luders, Steinmetz and Jancke2002). The above-mentioned multivariate approach was again utilized to determine whether the interaction terms group × age and group × ICV should be added to the individual GLMs. False discovery rate (FDR) correction (<0.05) was applied to account for the number of group comparisons (Benjamini & Hochberg, Reference Benjamini and Hochberg1995); one general linear model was fitted per ROI, separately for each hemisphere (10 ROIs × 2 hemispheres). The unstandardized general linear model coefficients were extracted for quantification of the magnitude of group differences, along with the corresponding confidence intervals (CIs) as a measure of uncertainty of the effect size estimates (Calin-Jageman et al., Reference Calin-Jageman, Mellor, Ball, Bernard, Wandell and Picciotto2018; Nakagawa & Cuthill, Reference Nakagawa and Cuthill2007). All above-described statistical analyses were conducted in SPSS v. 25.
Partial correlations that controlled for the effect of age and ICV (for subcortical ROIs) were computed in order to explore within-group relations between the extracted brain measures (volume or thickness) of the ROIs and scores on the BPAQ (Physical and Verbal Aggression, Hostility), STAXI (State and Trait Anger), MASQ (Anhedonic Depression and Anxious Arousal), and PSS (Re-Experiencing, Avoidance, and Hyperarousal), using a bootstrap procedure with 2000 bootstraps and default settings in SPSS v. 25. In light of the exploratory purpose of these analyses, both FDR-corrected and uncorrected results will be reported.
Exploratory (whole-brain) group analyses of cortical thickness were conducted via vertex-wise cluster analysis in FreeSurfer v. 6.0 (Hagler, Saygin, & Sereno, Reference Hagler, Saygin and Sereno2006). Specifically, for each vertex of the reconstructed surface envelope, a general linear model was fitted that aimed to explain the inter-subject variance in cortical thickness at that locus, as a linear combination of group as the main regressor, alongside age as nuisance variable; a vertex-wise significance threshold of p < 0.005 (two-tailed) was adopted at this stage. A Monte-Carlo permutation-based cluster analysis was performed in order to correct for the number of conducted tests (cluster-wise threshold: p < 0.05, number of iterations: 10 000). Also, the cluster-wise p values were adjusted for two hemispheres via Bonferroni correction.
All above-described ROI and whole-brain analyses were repeated with anxiety levels, measured with the MASQ-AA, and group × anxiety as additional predictors. The rationale for these re-analyses was to examine the interplay between impulsive aggression problems and levels of anxiety. FDR correction was again employed to account for the number of comparisons (10 ROIs × 2 hemispheres).
Ethical standards
The authors assert that all procedures contributing to this work comply with the ethical standards of the relevant national and institutional committees on human experimentation and with the Helsinki Declaration of 1975, as revised in 2008.
Results
A summary of group demographic and psychometric statistics is presented in Table 1. A moderate but non-significant difference in the number of years since the last deployment was observed in the impulsive aggression group, relative to the non-aggressive combat controls [Cohen's d = 0.53, t(57) = 2.05, p = 0.06 corrected]. Moreover, small and non-significant group effects were recorded for both the total number of deployments [Cohen's d = −0.25, t(57) = −0.95, p = 0.37 corrected], and the total duration of deployments, measured in months [Cohen's d = −0.25, t(57) = −0.93, p = 0.66 corrected]. As expected, the impulsive aggression group scored considerably and significantly higher on both the State [Cohen's d = 1.12, t(57) = 4.29, p < 0.01 corrected] and Trait Anger [Cohen's d = 2.09, t(57) = 8.02, p < 0.01 corrected] subscales of the STAXI-2, as well as the Hostility [Cohen's d = 2.26, t(57) = 8.68, p < 0.01 corrected], Physical Aggression [Cohen's d = 1.88, t(57) = 7.23, p < 0.01 corrected], and Verbal Aggression [Cohen's d = 1.46, t(57) = 5.60, p < 0.01 corrected] subscales of the BPAQ, relative to the combat control group. In addition, the impulsive aggression group scored considerably and significantly higher on both the Anxious Arousal [Cohen's d = 1.52, t(57) = 5.83, p < 0.01 corrected] and Anhedonic Depression [Cohen's d = 2.30, t(57) = 8.28, p < 0.01 corrected] subscales of the MASQ, as well as on the Re-experiencing [Cohen's d = 1.17, t(57) = 4.50, p < 0.01 corrected], Avoidance [Cohen's d = 1.97, t(57) = 7.57, p < 0.01 corrected], and Hyperarousal [Cohen's d = 2.62, t(57) = 10.07, p < 0.01 corrected] subscales of the PSS.
Statistical output of the group demographic and psychometric comparisons (contrast: impulsive aggression > combat control)

BPAQ, Buss-Perry Aggression Questionnaire; STAXI-2, State-Trait Anger Expression Inventory; MASQ, Mood and Anxiety Symptom Scale; PSS, PTSD Symptom Scale.
Note that the D statistic represents the mean difference between the impulsive aggression versus combat control group, whereas Cohen's d represents the standardized version of this effect size estimate. Also note that p values are presented both corrected (via FDR) and uncorrected for the number of comparisons.
Seventeen of the 29 veterans (58.6%) in the impulsive aggression group had a diagnosis for one or more co-morbid psychiatric disorders at the time of assessment, as determined with the Mini-International Neuropsychiatric Interview (MINI) (Sheehan et al., Reference Sheehan, Lecrubier, Sheehan, Amorim, Janavs, Weiller and Dunbar1998). The diagnoses included major depression (n = 11, 37.9%), dysthymia (n = 3, 10.3%), hypomania (n = 1, 3.4%), panic disorder (n = 2, 6.9%), agoraphobia (n = 9, 31%), social anxiety disorder (n = 2, 6.9%), specific phobia (n = 2, 6.9%), generalized anxiety disorder (n = 2, 6.9%), PTSD (n = 6, 20.7%), alcohol abuse or dependence (n = 1, 3.4%), and drug abuse or dependence (n = 1, 3.4%). None of the 30 veterans in the combat control group had a psychiatric disorder at the time of assessment. In addition, 20 of the 29 veterans (69.0%) in the impulsive aggression group had a diagnosis for one or more co-morbid cluster B personality disorders at the time of assessment, as determined with the Structured Clinical Interview for DSM-IV Axis II Personality Disorders (SCID-II) (First, Gibbon, Spitzer, Williams, & Benjamin, Reference First, Gibbon, Spitzer, Williams and Benjamin1997; cut-off scores derived from Ekselius, Lindström, von Knorring, Bodlund, & Kullgren, Reference Ekselius, Lindström, von Knorring, Bodlund and Kullgren1994). These included BPD (n = 12, 41.4%), antisocial personality disorder (APD; n = 8, 27.6%), and narcissistic personality disorder (n = 6, 20.7%). Only one participant in the combat control group met a diagnosis for a cluster B personality disorder, namely APD.
Cortical thickness: confirmatory ROI analyses
Group mean thickness values and corresponding standard deviations for the cortical ROIs are presented in online Supplementary Table S1. The interaction term group × age was not significant at a multivariate level and was therefore omitted from the individual GLMs. The results of the general linear model analyses with group as the main predictor, age as nuisance variable, and cortical thickness of the left or right DLPFC, OFC, or ACC as outcome variable are presented in Table 2. No nominally significant main effects of group were recorded for any of the cortical ROIs. (Note: the relationship between age and cortical thickness seemed to be slightly larger for the ROI measurements of the right versus the left hemisphere.) These results indicate that there were no group differences in cortical thickness for any of the tested ROIs.
General linear model statistics for the main effects of group, with age as nuisance variable, and the thickness of each of the cortical regions-of-interest as the outcome variable
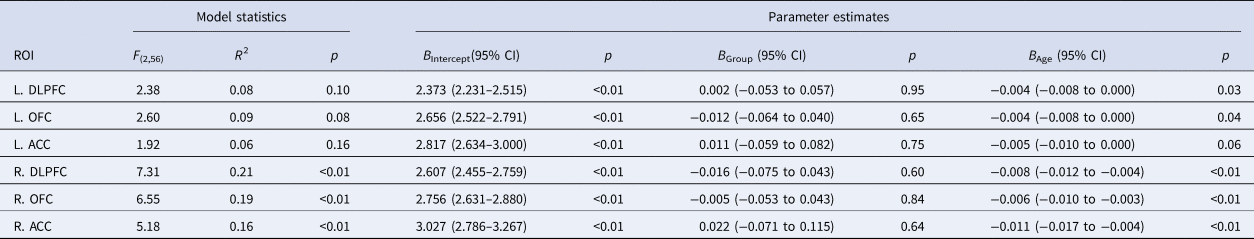
L, left; R, right; DLPFC, dorsolateral prefrontal cortex; OFC, orbitofrontal cortex; ACC, anterior cingulate cortex.
Note that the B-values represent the unstandardized GLM coefficients of the predictors, and that the (corresponding) p values are uncorrected for the number of comparisons.
Cortical thickness: exploratory whole-brain analyses
Exploratory whole-brain analysis of cortical thickness indicated no significant clusters of vertex-wise group differences in either the left or right hemisphere, when controlling for the effects of age.
Subcortical volumetry: confirmatory ROI analyses
Group mean volume measurements and corresponding standard deviations for the subcortical ROIs are presented in online Supplementary Table S1. The interaction terms group × age and group × ICV were not significant at a multivariate level and were therefore omitted from the individual GLMs. The results of the general linear model analyses with group as the main regressor, alongside age and ICV as covariates of no interest, and volume of the left or right hippocampus or amygdala (sub)volumes as dependent variables, are presented in Table 3. No nominally significant main effects of group were recorded for any of the subcortical ROIs. These results indicate that there were no group differences in grey matter volume for any of the amygdalar or hippocampal (sub)regions-of-interest.
General linear model statistics for the main effects of group, with age and ICV as nuisance variables, and the volume of each of the subcortical regions-of-interest as the outcome variable
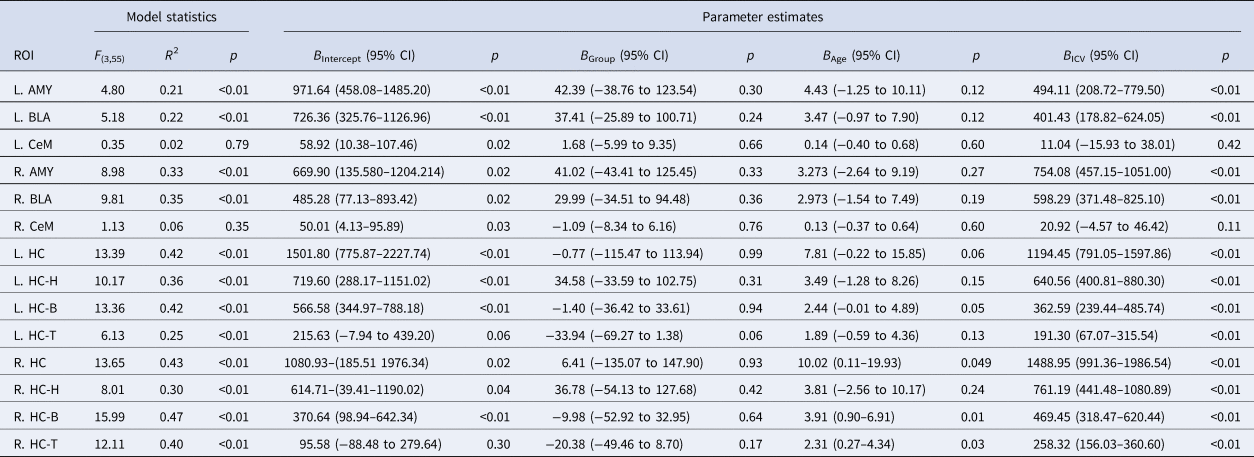
L, left; R, right; AMY, (whole) amygdala; BLA, basolateral amygdala; CeM, centromedial amygdala; HC, hippocampus (H, head; B, body; T, tail).
Note that the B-values represent the unstandardized GLM coefficients of the predictors, and that the (corresponding) p values are uncorrected for the number of comparisons. ICV was rescaled from mm3 to m3 to facilitate interpretation of the effect size estimates.
Partial correlation analyses
No significant partial correlations between the extracted MR measurements (volume or thickness) and any of the psychometric instruments were observed. Out of the total of 200 correlations that were computed (20 ROIs × 10 psychometric instruments), eight significant correlations were recorded (4%), which is less than the 5% expected based on chance, at an α-level of 0.05. Online Supplementary Tables S2–S5 present the individual correlation coefficients along with their corresponding p values.
Anxiety effects
A nominally significant effect of group × anxiety was observed only for the left OFC [B = 0.02, 95% CI (0–0.04), p = 0.04 uncorrected] and right ACC [B = 0.05, 95% CI (0.01–0.08), p = 0.02 uncorrected] (see online Supplementary Table S6). Both effects were rendered non-significant after FDR correction (10 ROIs × 2 hemispheres). Whole-brain analysis of cortical thickness revealed a significant effect of group × anxiety in a cluster corresponding to the left lingual gyrus (vertex-wise p threshold <0.005; peak coordinate: x = −10.5, y = −83.3, z = −8.3; cluster size = 307.40 mm2; cluster-wise p value = 0.04). Further inspection of this interaction effect indicated that a positive association between anxiety scores and thickness of the left lingual gyrus was present in the impulsive aggression group, while a negative association could be observed in the non-aggressive combat control group (see online Supplementary Fig. S7).
Discussion
The main objective of the current study was to examine the neuroanatomical correlates of impulsive aggression in combat veterans. To this end, we collected T1-weighted structural MR images of 29 male veterans with impulsive aggression problems, as well as 30 non-aggressive combat controls. Cortical thickness of the OFC, DLPFC, and ACC was extracted from the MR data by using the automated surface reconstruction pipeline of FreeSurfer v. 6.0 (http://surfer.nmr.mgh.harvard.edu/). (Sub)volume measurements of the amygdala and hippocampus were additionally extracted via recently developed segmentation software (Iglesias et al., Reference Iglesias, Augustinack, Nguyen, Player, Player, Wright and van Leemput2015; Saygin et al., Reference Saygin, Kliemann, Iglesias, van der Kouwe, Boyd, Reuter and Augustinack2017). Contrary to our expectations, we did not record any significant group differences in cortical thickness of the left or right OFC, ACC, and/or DLPFC, after adjusting for the nuisance effect of age. Exploratory whole-brain analysis of cortical thickness with group as main regressor and age as a covariate of no interest also yielded no significant result. Furthermore, we did not record any significant group differences in (sub)volumes of the amygdala or hippocampus, after correcting for both age and ICV. None of the partial correlations of the extracted MR measurements with any of the included psychometric instruments was statistically significant after FDR correction. Additional whole-brain analysis of cortical thickness did reveal a significant interaction between impulsive aggression status and anxiety scores in the left lingual gyrus.
The current findings consistently showed no significant effect of group for any of the extracted MR measurements, suggesting that – at least in the current sample – problems with impulsive aggression are not directly associated with any obvious alterations in brain anatomy. These results are largely in line with the four previous works published on the subject-matter thus far. For instance, van Elst et al. (Reference van Elst, Woermann, Lemieux, Thompson and Trimble2000) recorded no significant alterations in the total volume of the amygdala when epileptic patients with co-morbid impulsive aggression problems were compared to those without (n = 25 per group). Coccaro et al. (Reference Coccaro, Lee, McCloskey, Csernansky and Wang2015) observed no significant group differences in grey matter volume of the amygdala or hippocampus when patients with impulsive aggression (n = 67) were compared to non-aggressive healthy controls (n = 73); the authors did record significant alterations in the shape metrics of the two ROIs. The only other study that examined cortical grey matter recorded lower volume of the left frontal lobe in the same (above-mentioned) set of epileptic patients with versus without impulsive aggression (n = 24 per group) (Woermann et al., Reference Woermann, van Elst, Koepp, Free, Thompson, Trimble and Duncan2000). Recently, Yang et al. (Reference Yang, Joshi, Jahanshad, Thompson and Baker2017) reported significant positive correlations between cortical grey matter – i.e. volume of the OFC and thickness of the DLPFC – and scores on the impulsive aggression subscale of the RPQ in a community-derived sample of adolescent twins (N = 106). Taken together, and in keeping with the current findings, the two previous works that examined subcortical volumes (Coccaro et al., Reference Coccaro, Lee, McCloskey, Csernansky and Wang2015; van Elst et al., Reference van Elst, Woermann, Lemieux, Thompson and Trimble2000) did not observe any effects of impulsive aggression. The only study that examined cortical grey matter recorded a reduction in the volume of the left frontal lobe (Woermann et al., Reference Woermann, van Elst, Koepp, Free, Thompson, Trimble and Duncan2000), a finding that could not be replicated here. Potential explanations for this discrepancy in findings include the present study's focus on cortical thickness, rather than cortical volumetry, as well as the absence of a co-morbid neurological condition (e.g. epilepsy) in the current sample. Finally, the only other study that utilized a correlational approach recorded increased cortical grey matter in the OFC (volume) and DLPFC (thickness) (Yang et al., Reference Yang, Joshi, Jahanshad, Thompson and Baker2017), findings that could not be replicated here. The use of a non-clinical adolescent study sample, as opposed to the clinical sample of veterans included here, offers a potential explanation for this discrepancy in results.
The prevailing model on impulsive aggression has often implicated the same cortical-limbic circuit as typically described for the (dys)regulation of emotion in a broader sense (e.g. see Phillips et al., Reference Phillips, Ladouceur and Drevets2008 for a review). Core elements of this (dys)functional machinery include the amygdala, which may be hyper-responsive to the presentation of emotional stimuli, e.g. angry or fearful faces (da Cunha-Bang et al., Reference da Cunha-Bang, Fisher, Hjordt, Holst and Knudsen2018; McCloskey et al., Reference McCloskey, Phan, Angstadt, Fettich, Keedy and Coccaro2016), and prefrontal regions such as the OFC and DLPFC, which may exert diminished top-down control (Coccaro et al., Reference Coccaro, McCloskey, Fitzgerald and Phan2007; Varkevisser et al., Reference Varkevisser, Gladwin, Heesink, van Honk and Geuze2017). The results of the current inquiry suggest that these functional abnormalities may not be accompanied by any obvious alterations in brain structure – at least not insofar as volumetry of the amygdala and hippocampus, or thickness of the cortical mantle is concerned.
As mentioned in the introduction, evidence suggests that symptoms of impulsive aggression and anxiety commonly co-occur and may share the same underlying (neural) mechanisms (Carré et al., Reference Carré, Fisher, Manuck and Hariri2012; Dugré et al., Reference Dugré, Dumais, Dellazizzo and Potvinn.d.; Galbraith et al., Reference Galbraith, Carliner, Keyes, McLaughlin, McCloskey and Heimberg2018; Keyes et al., Reference Keyes, McLaughlin, Vo, Galbraith and Heimberg2016). In line with this notion, we observed significantly and considerably higher scores on the MASQ-AA (measure of anxiety) in the impulsive aggression group, relative to the non-aggressive combat controls (Cohen's d = 1.52, p < 0.01). Moreover, additional whole-brain analysis of cortical thickness, exploring the role of anxiety symptoms in impulsive aggression, yielded a significant group × anxiety effect in a cluster corresponding to the left lingual gyrus. While a negative association between anxiety scores and cortical thickness of the left lingual gyrus was observed in the combat control group, a positive relation between these two variables was recorded in the impulsive aggression group. The lingual gyrus is a tongue-shaped structure that lies on the inferior aspect of the medial occipital lobe (Flores, Reference Flores2002). It is believed to play a key role in the visual identification of emotional expressions of human faces (Kitada, Johnsrude, Kochiyama, & Lederman, Reference Kitada, Johnsrude, Kochiyama and Lederman2010). In a recent inquiry by our group, a significant difference in resting-state connectivity was observed between the left CeM and left lingual gyrus in the same sample of combat veterans with versus without impulsive aggression as described here; co-activation of the two brain regions was recorded in the impulsive aggression group, while negative connectivity was found in the non-aggressive combat control group (Varkevisser et al., Reference Varkevisser, Gladwin, Heesink, van Honk and Geuze2017). Together these findings suggest that heightened responsiveness to emotional stimuli may be specific to those veterans who – in addition to suffering from impulsive aggression – also score high on measures of anxiety-related traits. We note, however, that the range of MASQ-AA scores in the combat control group was rather narrow (0–7), with 17 out of 30 participants scoring zero, while the range in the aggression was much wider (0–41), with only one participant scoring zero, making this result less straightforward to interpret.
The present work was subject to the following limitations: First, in a neuroscientific landscape increasingly (but justifiably) shifting toward ‘big data’ initiatives (e.g. see Sejnowski, Churchland, and Movshon, Reference Sejnowski, Churchland and Movshon2014), the current inquiry may have been concerned with a relatively small sample size. While this does not detract from the potential utility of our investigation, it may nonetheless have restricted our ability to detect a significant main effect of group at some of the ROIs, and may have led to rather low precision rate estimates (i.e. wide CIs) (Nakagawa & Cuthill, Reference Nakagawa and Cuthill2007). Second, since we did not formally quantify the extent of head motion during image acquisition, we cannot fully exclude the possibility that movement-related artifacts, e.g. those related to impulsive aggression status, may have influenced the current findings. Similarly, since we did not perform any quantification of (mild) traumatic brain injury (TBI) in our sample, we cannot fully exclude the possibility that a lifetime history of TBI confounded the results. We stress, however, that none of the veterans was physically injured during deployment. Fourth, a subset of the participants in the impulsive aggression group had a co-morbid diagnosis for one or more psychiatric and/or personality disorders – most notably major depression and BPD. While we do not consider this to be a limitation per se, since our aim was to study impulsive aggression from a trans-diagnostic point of view, following the Research Domain Criteria (RDoc) initiative (Insel et al., Reference Insel, Cuthbert, Garvey, Heinssen, Pine, Quinn and Wang2010), Axis I and II co-morbidity rates should nevertheless be taken into account when interpreting these results. Fifth, since the work described here was based on a male-only sample of combat veterans, the current findings may not be fully generalizable to a female population of veterans with impulsive aggression problems. Consistent with this notion, Connor, Steingard, Anderson, and Melloni (Reference Connor, Steingard, Anderson and Melloni2003) previously recorded sex differences in the etiology of impulsive aggression; hyperactivity and impulsive behavior seemed to play a prominent role in men, whereas reactive aggression in women was marked more by early-life trauma and low verbal IQ. Lastly, the findings reported in Table 2 indicate that the effect of age on the thickness of the included cortical ROIs may have been slightly larger in the right versus the left hemisphere. To our knowledge, no mention of such an interaction effect between age and hemisphere has ever been made in the cortical thickness literature. The potential relevance of this unexpected observation should be explored in future studies.
In conclusion, this study marks the first to have examined subcortical volumetry and cortical thickness in combat veterans with and without impulsive aggression problems, and is the only structural MRI work to date to have examined the major subdivisions of the amygdala and hippocampus. Group analyses indicated no significant alterations in the extracted cortical or subcortical brain metrics, and no significant correlations with the psychometric data were observed. We hope that the results obtained here will help inform future imaging work on impulsive aggression, and propose that an analysis of amygdala and/or hippocampus sub-volume shape provides for an interesting avenue for (such) further research (cf., Coccaro et al., Reference Coccaro, Lee, McCloskey, Csernansky and Wang2015).
Supplementary material
The supplementary material for this article can be found at https://doi.org/10.1017/S0033291720000033.
Acknowledgements
We thank Peter Zuithoff for his help with the statistical analysis of the data.
Conflict of interest
None.
Funding
This research was financially supported by the Dutch Ministry of Defence.


 Open access