

INTRODUCTION
Acute infectious gastrointestinal illnesses in humans are usually mild diseases, although they can be severe, even fatal, or lead to long-term sequelae. They occur frequently and thus represent a significant burden for society [Reference Roy, Scallan and Beach1–Reference Sargeant, Majowicz and Snelgrove4]. Their aetiology includes viruses, bacteria and parasites that are transmitted primarily through the faecal–oral route. Many of these diseases are zoonotic in origin, from a wide range of reservoirs including livestock, pets, and wildlife (mammals, birds, reptiles). As a result, their epidemiology is complex, with people being exposed in numerous circumstances and through several transmission routes (foodborne, waterborne, contact with animals and their environment, contact with sick people or shedders).
Epidemiological case-control studies have highlighted potential risk factors associated with increased risk of disease. These risk factors can be specific (one food type), especially when searching for the source of an outbreak, or quite broad (representing a pathway of exposure). For example, two recent outbreak investigations of salmonellosis linked 33 cases in Canada and 272 cases in the USA to the consumption of head cheese [Reference Taylor5] and imported black and red pepper [Reference Gieraltowski6], respectively. Moreover, a population-based research study conducted in 2004 in the USA on 1316 campylobacteriosis cases identified a spectrum of risk factors [Reference Batz7], including owning a pet puppy, drinking untreated water, and eating chicken prepared at a restaurant, etc. [Reference Friedman8].
Outside of case-control investigations, the exposure of individuals to a variety of risks (foods, behaviours, environments) is rarely measured. However, this exposure information is essential for microbial exposure assessments, either qualitative or quantitative, for attribution analyses [Reference Batz7, Reference Pires9, 10], and ultimately to rank risks and prioritize prevention and control measures.
Exposure assessment models are based on the proportion of people in the population that are exposed (occurrence) and the number of times they are exposed (frequency) over a given period of time, combined with the dose (i.e. the concentration of the pathogen in the source). In the case of Campylobacter infections, for example, exposure assessment has also been used to perform attribution [Reference Evers11]. In this study, exposure has been described for various commodities and routes of transmission for a given pathogen and then ranked to most effectively target prevention and control measures. In other studies, the exposure assessment is targeted to one food commodity and forms a component of a larger quantitative risk assessment model, estimating the number of human cases attributable to the considered commodity or route of transmission [12–Reference Nauta, Jacobs-Reitsma and Havelaar14]. The more precise the distributions of exposure to pathogens are measured, the narrower the output of the risk modelling and the clearer the interpretation and decisions based on this output.
In Canada, there is a lack of exposure information for the general or healthy population that could be used to develop these types of exposure assessments for various enteric diseases. This study was designed to measure the occurrence of exposures (associated with enteric pathogen risks previously documented) in a sample of healthy individuals, i.e. people that did not have vomiting or diarrhoea in the past 3–14 days, in a Canadian community corresponding to a C-EnterNet (Canada's integrated enteric disease surveillance system) sentinel site. The objective of the study was to consider different recall periods to reflect different disease incubation windows, to investigate the impact of population-related characteristics (age, gender) and disease-related characteristics (seasonality and incubation period) on the exposure frequencies.
MATERIALS AND METHODS
Study design, population and time-frame
The study was based on a cross-sectional telephone survey on known exposures for common gastrointestinal illnesses. Each month, about 100 respondents were enrolled over a 12-month period (August 2009 to July 2010), to account for expected seasonality in some exposures. Respondents were randomly assigned to one of three recall periods (3 days, 7 days, 14 days), to cover the range of incubation periods of gastrointestinal diseases caused by viruses, bacteria and parasites, and were asked about their exposures in the past 3, 7 or 14 days.
The study population was the Region of Waterloo (ROW), Ontario, Canada. This area is a sentinel site for the Canadian integrated enteric pathogen surveillance programme (C-EnterNet) where all reportable gastrointestinal disease cases are comprehensively followed-up by the local public health authority for potential exposures. It is comprised of three cities (Cambridge, Kitchener, Waterloo) and four townships (North Dumfries, Wellesley, Wilmot, Woolwich). In 2010, the estimated population was 527031 residents (Population and Household Estimates, Regional Municipality of Waterloo, October 2011).
The survey was approved by the Public Health Agency of Canada Research Ethics Board (REB-2008-0040) and the University of Waterloo Office of Research Ethics (ORE no. 15764).
Participant selection
The sampling frame was based on a geographically stratified, general phone population random sampling program purchased from ASDE Survey Sampler. Households were selected from the list of telephone numbers through multi-stage random sampling and then the individual in the household with the next birthday was selected to perform the interview (provided they were eligible and consented). Participants were selected proportional to the population and age distributions in ROW based on age-specific population estimates for 2006 (ROWPH, 2007).
Individuals were eligible for inclusion if they resided at a residence with a listed telephone number in ROW, spoke English and did not have diarrhoea or vomiting in the recall period prior to the interview. Trained interviewers conducted calls Monday to Friday from 09:00 to 21:00 hours. Up to three attempts on different days and at different times of the day were made to reach each household selected and up to five attempts were made to contact the specific individual selected from the household. Interviews of children aged <18 years required parental agreement; the respondent could be a proxy or the child itself.
Questionnaire
The survey questionnaire was adapted from the enhanced sporadic enteric disease case questionnaire that had been previously developed and used for the systematic follow-up of reported cases of gastrointestinal illness in ROW (http://www.phac-aspc.gc.ca/c-enternet/publications-eng.php). The survey included questions on demographics (age, gender, occupation) and questions to measure the frequency of exposure to potential sources of enteric pathogens including water (drinking and recreational water), food supply (type of shop for usual food and meat purchases, origin of the food coming from outside the home), high-risk foods (unpasteurized products, spoiled and undercooked food), environment (country property, animals, gardening, outdoor activities), travel, and social events (barbecuing, social gathering). The same questions were asked for each recall period group.
Variables
Some variables were re-categorized prior to analysis. The age of respondents was divided into six age groups: 0–<5, 5–<15, 15–<30, 30–<45, 45–<60, ⩾60 years old. Interview months were categorized into seasons: winter (December–February), spring (March–May), summer (June–August) and autumn (September–November). Occupation was categorized into agriculture/food processing, food preparation, daycare service, healthcare service and other, to distinguish high-risk occupational exposures. The animals that people were exposed to when living on or visiting a farm, a country property or a petting zoo were extracted from the text question and categorized into cattle, cat, dog, rodent, rabbit, poultry, other poultry (i.e. not chicken), horse, sheep, reptile, pig, llama and other. Some variables were merged based on similar exposure routes: recreational water (dichotomized into natural waters vs. pool), the consumption of all unpasteurized products (i.e. milk, milk products, juices, other), exposures to all food animals when living on or visiting a farm, country property or petting zoo, and contact with all pets other than cats and dogs.
Analyses
Age, gender and season were tested for their homogeneous distribution across the three recall periods, as heterogeneity will impede direct comparisons of results between recall periods. The analyses were conducted using χ 2 homogeneity tests. Age and gender distribution in the respondents were compared to their distribution in ROW using a χ 2 test of homogeneity. The age and gender structure in each population was further explored by considering the sex ratio for each age group in each population.
As fewer than 0·1% of the responses were ‘unsure’ (n = 102) or ‘refused’ (n = 1), the ‘refused’ and ‘unsure’ answers were merged with ‘no’ answers in a single category, opposed to ‘yes’ answers. For each recall period, the proportion of each exposure was computed, as well as its 95% confidence interval. To generate more precise proportions, respondents from two or three recall periods were pooled whenever possible, if the confidence intervals for each recall period overlapped for a given exposure. The proportion of each exposure and its confidence interval was computed again after appropriate pooling of recall periods. When pooling was not possible, the 14-day recall period was used. Exposure proportions for the ROW population were extrapolated from the pooled proportions by direct standardization for age and gender.
The influence of age, gender, and season on the pooled exposure proportions was tested using a logistic regression model with a two-step approach: for each exposure, univariable models were assessed to test for age, gender and season independently and the variables for which P < 0·1 in the univariable models were tested in a multivariable model without interaction. This process was conducted for exposures with a proportion ⩾10% in at least one of the recall periods.
The similarities and ordinal ranking of the proportions observed across the three recall periods were used to provide a sense of the exposure periodicity, which we defined as the interval of time (days) between two consecutive instances of the same exposure. Based on logic and considering that we had no information on how many times the exposure occurred during the recall period, we estimated that, for example, when the occurrence of an exposure is stable from the 3- to the 7-day recall period, then the probability for it to happen at least once is the same in both periods so that its periodicity is ⩽3 days. If the occurrence significantly increases from the 3- to the 7-day recall period, then the probability for it to happen at least once is higher in the 7-day period, so that its periodicity is >3 days. Thus, when the exposure proportion increased significantly from the 3- to the 7-day and again to the 14-day recall period, the exposure period was considered to be >7 days. When the exposure proportion for the 7- and 14-day recall periods were equal and greater than that of the 3-day recall period, the exposure period was considered to be between 4 and 7 days. When all exposure proportions were equal, the exposure period was considered as <3 days.
Multiple correspondence analysis (MCA) [Reference Greenacre15] was performed on the 14-day recall period data, to explore the existence of unique exposure profiles in healthy people. Four independent MCAs were run independently: the first on permanent exposures, including place of residence (i.e. living on a farm or in a country property), source of drinking water and use of in-home water treatment; the second, on place of residence, and common (i.e. not during a visit) exposure to farm animals and household pets; the third on point exposures through occasional activities or behaviours (i.e. drinking raw water, swimming in a pool, swimming in other recreational water, canoeing or hiking, gardening, attending a barbecue, attending a social event, consumption of undercooked food, consumption of unpasteurized food, visiting a farm or country property, contact with farm animals during a visit, and international travel); and the fourth on variables that describe places where food was acquired (i.e. place of general food shopping, place of meat shopping, and origin of food prepared outside the home). Age, gender and season were included in the last two analyses to assess the effects of age, gender or season on those exposures.
RESULTS
A sample size of 1200 respondents was achieved, with an overall response rate of 46·2%. Fifty-one persons were excluded because of gastrointestinal syndromes (corresponding to an estimated prevalence of 2%). The average number of call attempts made to reach the respondents was 1·4, ranging from one to four call attempts. The interview length ranged from 5 to 24 min with a mean duration of 8 min.
The interviews were not uniformly spread across the 12-month study period due to an interviewer error that occurred from September to November. The compromised interviews (n = 52) were discarded and additional interviews were conducted during the last 2 months to achieve the sample size. The number of interviews per weekday was greater on Wednesdays (27% of all respondents) and lower on Fridays (14%). Thirty-one interviewed respondents aged <15 years completed the interview on their own, rather than using an adult proxy. They were excluded from the analysis due to concern about reliability of their answers. A total number of 1169 questionnaires were used: 405 for the 3-day recall period, 378 for the 7-day recall period, and 386 for the 14-day recall period.
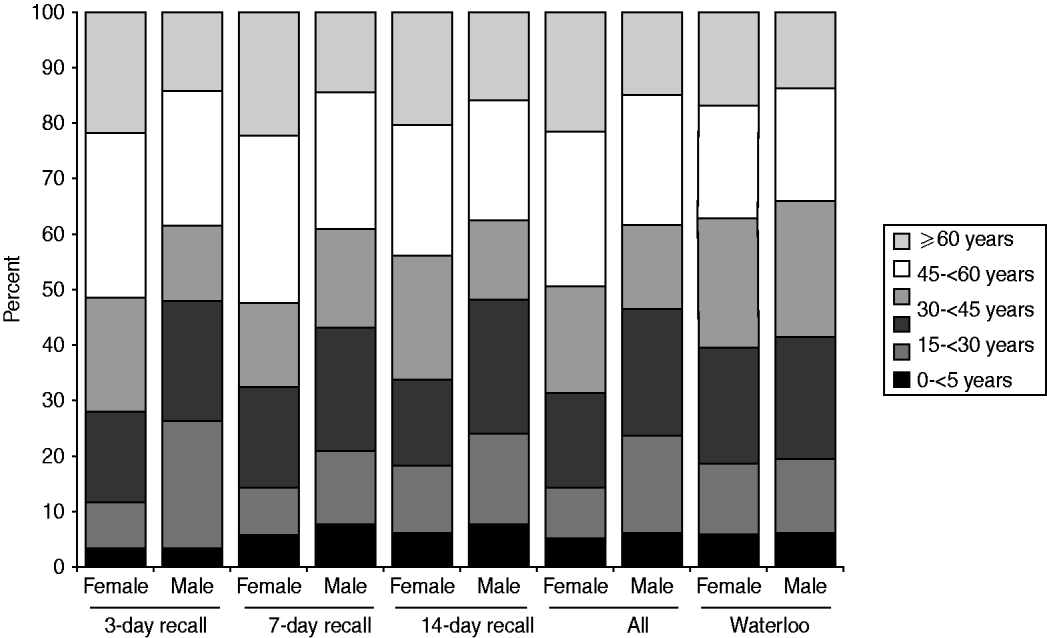
More females than males participated in the survey. The distribution of respondents by age, gender, and season was homogeneous across the three recall periods (χ 2 homogeneity tests: P values >0·05). Compared to the study population, the sampled population had relatively more females (62·4% vs. 50·1%), more people aged >44 years (45·3% vs. 35·7%) and fewer people aged between 15 and 44 years (36·8% vs. 45·5%, Fig. 1). Thus, it was necessary to standardize the results for age and gender, when inferring to the ROW population.
Relative age distribution among the sampled population (by recall period) and among the study population (the Region of Waterloo, ∼492000 inhabitants in 2006).

Table 1 summarizes the distribution of respondents to 46 potential exposures for each recall period. The proportions of most exposures were similar across the recall period groups (n = 35), thus their periodicity was estimated to be <3 days. Eight exposures had an estimated periodicity between 3 and 7 days (the 7- and 14-day recall period proportions were higher), and three exposures (shopping at farmers' market, purchasing leafy greens, consuming food from fast-food chain restaurant) had an estimated periodicity >7 days (significant increase from the 3- to the 7-day recall periods and from the 7- to the 14-day recall periods). The standardized exposure proportions for ROW show that the most common exposures are municipal water and bottled water as drinking sources (71·8% and 57·0%, respectively), the exposure to households pets in general (65·9%) and especially dogs (49·7%) and cats (35·9%), and eating food prepared outside the home (78·0%), especially from fast-food chain restaurants (56·6%) and eat-in restaurants (51·0%). High-risk occupations were rare exposures (<3%).
Observed proportion and 95% confidence intervals of various exposures by recall period in 1169 healthy individuals sampled in the Region of Waterloo (ROW), Ontario, August 2009–July 2010, and estimates for the sampled and study populations
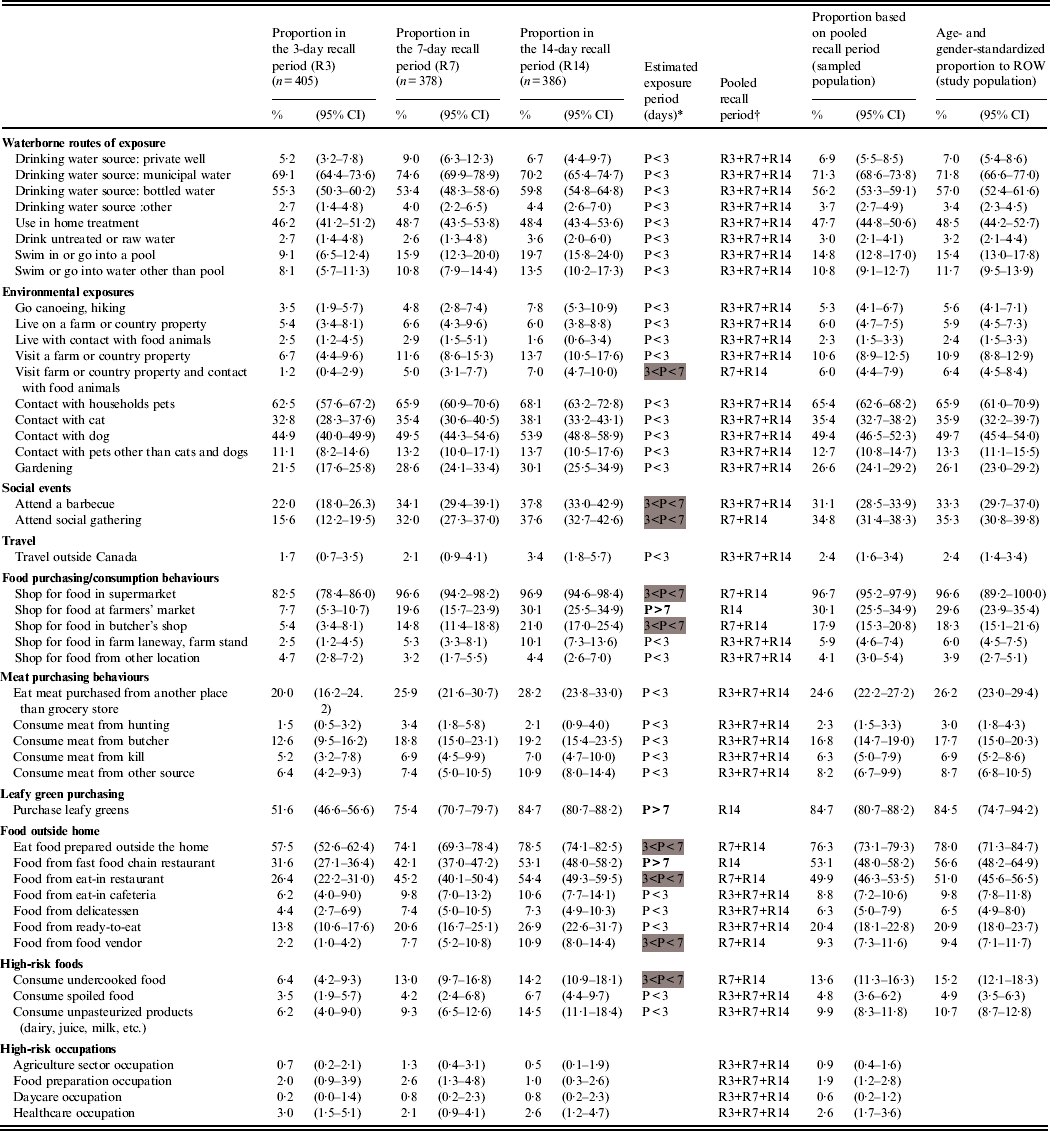
* P, Exposure period, based on the overlapping of proportion confidence intervals between the recall periods and defined by the interval of time (days) between two consecutive exposures of the same kind (<3 days if the exposure proportions are equal across all recall periods, 4–7 days if the proportions are equal across the 7- and 14-day recall periods and greater than in the 3-day recall period, over 7 days if the proportions increased with the length of the recall period).
Exposure periods between 3 and 4 days are highlighted in grey, and exposure periods >7 days are in bold font.
† R3, 3-day recall period; R7, 7-day recall period; R14, 14-day recall period.
The effect of age, gender and/or season was statistically significant for 32 exposures (Table 2). Age was significant for 23 exposures, season for 18, and gender for three exposures. Simultaneous effects of age, gender and season were significant for those who reported attending a barbecue.
Age, gender and season effects on exposures in healthy individuals sampled in the Region of Waterloo, Ontario, August 2009-July 2011
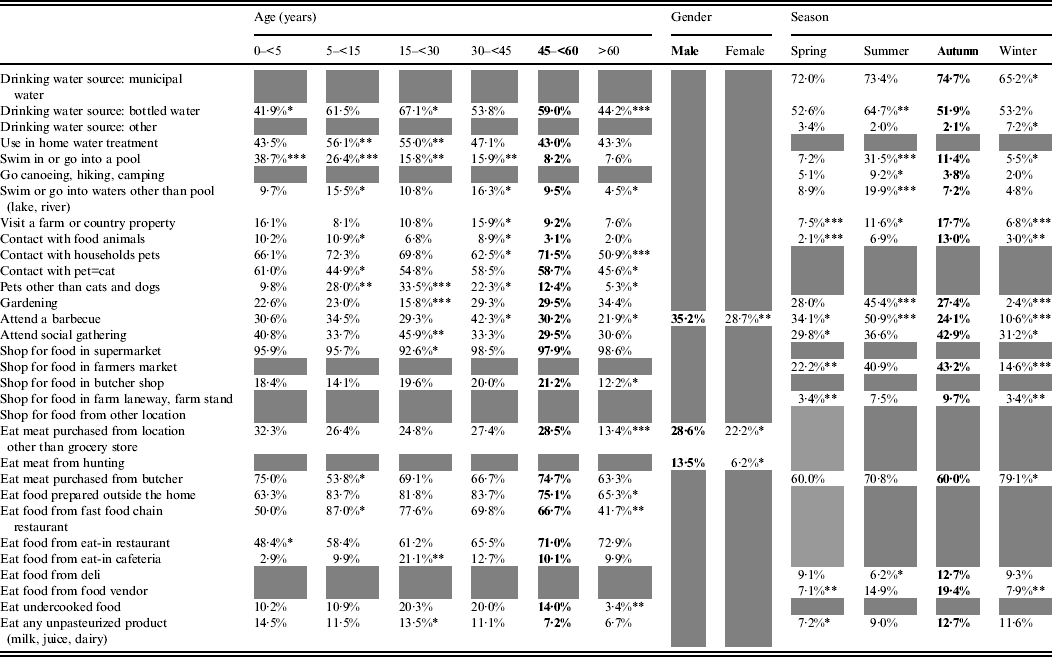
Bold font indicates the reference category.
Grey cells indicate non-statistically significant effect.
* 0·05<P < 0·01, ** 0·01<P < 0·001, *** 0·001<P.
Some exposures were associated with the summer season, such as consuming bottled water and taking part in outdoor activities (swimming, canoeing, gardening, barbecuing). Others were more common in the summer and autumn: having rural contact (visiting a farm or country property, contact with food animals, acquiring food from farmers' markets or farm stands), attending social gatherings, eating at food vendors or at a delicatessen and consuming unpasteurized products. Purchasing meat from a butcher was the only exposure significantly more frequent in the winter season.
Swimming in a pool decreased with age, whereas swimming in natural waters was most common among pre-teen children (5 to <15 years) and adults aged 30–44 years, and this was similar with the reported contact with food animals. Extreme ages (children aged <5 years and adults aged >60 years) were less exposed to bottled water and food prepared outside the home. Children aged 5 to <15 years were preferentially exposed to fast-food chain restaurants, and young adults (15 to <30 years), to unpasteurized products. Respondents aged >60 years were less frequently exposed to pets and respondents aged 5 to <30 years were more frequently exposed to non-traditional pets (neither cats nor dogs). Finally, gardening was an activity that was more common in people aged >30 years, barbecuing peaked in respondents aged 30 to <45 years and social gatherings were most common in respondents aged 15 to <30 years.
Men more frequently reported consuming meat from somewhere other than a grocery store, consuming meat from a private hunt and barbecuing.
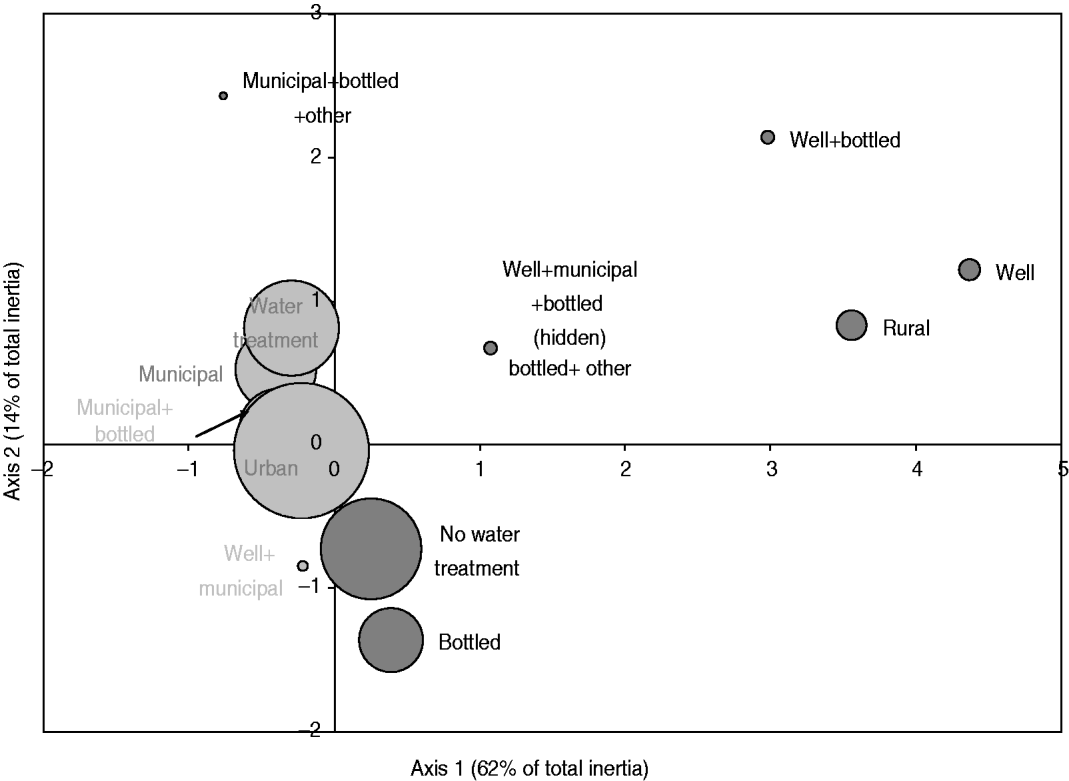
The exploratory description by MCA of long-term exposures revealed expected associations. A private well as the main source of drinking water was associated with those who reported living on a farm or a country property and drinking bottled water was associated with those who reported not having water treatment at home (Fig. 2). Living in the country was associated with exposure to food animals but not to exposure to pets. Several point exposures were strongly associated with summer and were less common in the oldest age group (⩾60 years), such as swimming (pools and natural waters), canoeing or hiking, gardening, barbecuing, visiting a farm, a petting zoo or a country property, and international travel (Fig. 3).
Map generated through the MCA of place of residence, source of drinking water and use of in-home water treatment based on 386 healthy individuals responding to their exposure over the last 14 days. Place of residence was living or not in farm or country property (rural vs. urban); the source of drinking water was a combination of well, municipal, bottled or other water; and the in-home water treatment was present or absent (water treatment vs. no water treatment). The size of the bubble is proportional to the number of respondents that fall into the category represented by the bubble. Darker bubbles outline categories contributing to any of the two axes. Bolded text indicates categories contributing to the first axis and underlined text indicates categories contributing to the second axis. Number in brackets in the axis title is the axis inertia, which is for categorical variables equivalent to variance for continuous variables. Note that several variable categories overlapped near the origin of the axes and are not labelled.

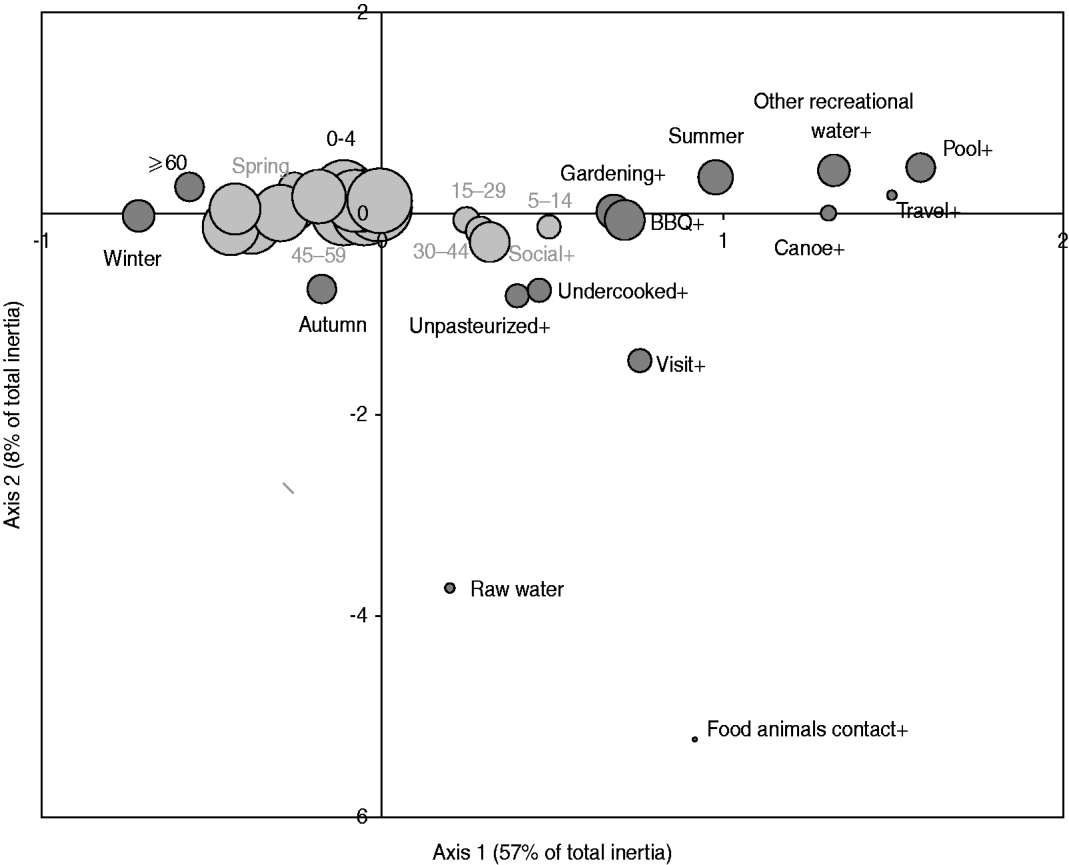
Map generated through the MCA of specific occasional activities or behaviours with age and season based on 386 healthy individuals responding to their exposure over the last 14 days. The occasional activities or behaviours included: drinking raw water (raw water vs. treated water), swimming in a pool (pool+ vs. -), swimming in other recreational water than pool (other recreational_water + vs. -), canoeing or hiking (canoe+ vs. canoe-), gardening (gardening+ vs. -), attending a barbecue (BBQ+ vs. -), consumption of undercooked food (undercooked+ vs. -), consumption of unpasteurized food (unpasteurized+ vs. -), visiting a farm, a petting zoo, a fair or a country property (visit+ vs. -), contact with food animals during such visit (food animal contact+ vs. -), and international travel (travel+ vs. -); the age groups were: 0–4, 5–14, 15–29, 30–44, 45–59, ⩾60 years; the seasons were spring, summer, autumn, winter. The size of the bubble is proportional to the number of respondents that fall into the category represented by the bubble. Darker bubbles outline categories contributing to any of the two axes. Bolded text indicates categories contributing to the first axis and underlined text indicates categories contributing to the second axis. Number in brackets in the axis title is the axis inertia, which is for categorical variables equivalent to variance for continuous variables. Note that several variable categories overlapped near the origin of the axes and are not labelled.

Variables describing food supply and consumption showed potential associations between food prepared outside the home, age and season. The youngest (0 to <5 years) and the oldest (⩾60 years) respondents were the least likely to have eaten food prepared outside the home. In addition, MCA outputs highlighted two potential clusters: (i) males aged 15 to <30 years and autumn with a possible association with consuming food purchased at a food vendor or eat-in cafeteria, and (ii) respondents aged 35 to <45 years and spring with a possible association with the consumption of ready-to-eat foods or foods purchased at a delicatessen.
DISCUSSION
This study provides estimates of the occurrence of potential exposures commonly associated with enteric infections in a sample of healthy individuals in a Canadian community. It fills an important knowledge gap related to the potential routes of exposure to enteric pathogens. The non-foodborne routes have been explored as well as the foodborne route through the perspective of its origin, in the sense of where it was purchased (e.g. directly from farm, from hunting, from restaurants), and through the consumption of a few high-risk foods (e.g. unpasteurized or undercooked food). This allows completing the existing knowledge on the exposures through specified food items [Reference Nesbitt16]. For most of these exposures, <15% of the population was exposed to that potential risk during the recall period (e.g. international travel, 2·4%). However, some of the measured exposures were quite common (e.g. eating food prepared outside the home, 78%; attending a social gathering, 35%). This information from the healthy population is important for estimating baseline exposures for risk assessments and for identifying potential sources in case-control studies or disease clusters and outbreak situations.
Our results quantify the variation of exposures across age groups and gender. For example, exposure to recreational waters was more frequent in children and young teenagers (5 to <15 years) and in adults aged 30 to <45 years, whereas the oldest respondents (⩾60) were less exposed. Gender effect was relatively uncommon across exposures. However, for household-level questions, the impact of gender should be interpreted with caution, as a household can comprise several persons of both genders that all may influence the occurrence of that exposure. Considering that incidence of gastrointestinal illness usually varies by age and gender, any comparison of these exposures with healthy controls should consider age and gender.
Our results also assess the seasonal variation for some activities that may put people at risk for contamination by enteropathogens. Some behaviours were more frequent during summer (e.g. drinking bottled water, swimming, outdoor activities, gardening, barbecuing) or less frequent during winter or spring (e.g. attending social gatherings, purchasing food at farmers' market or farm laneway). These observations reveal the impact of the climate of this region of Canada (cold and snowy winter, hot and humid summer) on behaviours and habits. The observed seasonality for some exposures, however, is difficult to explain by the climate and may be spurious (e.g. higher frequency of eating delicatessen food in autumn, lower frequency in winter of municipal water as source of drinking water). Including the seasonal pattern of potential risk factors for comparisons of cases of infectious diseases with healthy controls is important as most infectious gastrointestinal disorders show a clear seasonality in Canada and in temperate countries. There is a summer peak in bacterial disease incidence (campylobacteriosis, salmonellosis or pathogenic Escherichia coli infections) [Reference Ravel17–Reference Meldrum21] and an increased incidence in winter for viral diseases (norovirus and rotavirus infections) [Reference Hall22–Reference Atchison, Lopman and Edmunds25].
This work allowed for the study of the periodicity of exposures in healthy individuals. The periodicity, or time between exposures, can be used in exposure assessment models, to rank relative risks by individual behaviour occurrence (yes/no) and to assess the frequency (inverse of the periodicity) of exposures. To estimate the periodicity, we looked at the differences in the exposure rates obtained for three recall periods, a factor that is important in understanding both disease outcomes and behaviour profiles in the study population [Reference Keller26, Reference O'Brien27]. For a few exposures, the occurrence significantly increased with the length of recall period, allowing estimation of periodicity of the exposure. However, most of the time the exposure rates were not significantly different across the three recall period groups, meaning that the exposure was either constant (e.g. contact with pets) or that the differences between recall periods could not be detected with our sample size. For example, there was no significant difference in exposures across the three recall periods (3, 7, 14 days) for international travel (1·7%, 2·1%, 3·4%, respectively) but it is unlikely its periodicity is <3 days. In this case of a rare exposure, this could mean that the periodicity is much greater than 14 days. The lack of difference between the three recall periods for some exposures could also be attributable to recall bias, although it is unlikely for exposures such as international travel. Future studies could include groups with a longer recall period (e.g. 21 and 28 days) to help more precisely quantify the periodicity of a greater number of exposures and provide exposure information for diseases that have long incubation periods such as cryptosporidiosis or giardiasis. However, it has been shown that recall bias is likely to increase with the length of the recall period [Reference Cantwell28, Reference Coughlin29]. Another limitation to assessing periodicity relates to the absence of questions on the number of times the exposure occurred during the recall period (or if the exposure was constant). Future surveys should incorporate questions on frequency of exposures. Finally, it should be noted that for seasonal activities such as gardening and canoeing, the actual frequency of exposure might be diluted when considering an entire year to assess the exposure. It may be worth restricting the assessment of the exposure frequency of seasonal activities to the appropriate seasons.
Beyond the inherent biases due to language restriction and selection of the source population from a telephone list, there were biases due to interview error during recruitment of respondents during September–December which led to an increased number of interviews in summer (July–August). This error may have influenced the capacity to detect the impact of season on certain exposures. However, when considering the perspective of using those data in the frame of a case-control study, for which the controls would be matched with the cases on the date, additional controls are available for the summer period when most of the diseases are peaking.
The results presented herein about several exposure behaviours of healthy people are a rich source of information for the design of future research studies, for refining hypotheses related to the transmission of enteric diseases in a Canadian community, from farm-to-fork or source-to-tap and for understanding the effect of varying recall periods on exposure measurements. These results can be used for case-control studies, exposure assessment studies as well as informing attribution modelling efforts and developing quantitative microbial risk assessments. This work aligns with the One Health approach being taken in Canada.
ACKNOWLEDGEMENTS
The authors thank the staff of the National Integrated Enteric Pathogen Surveillance Program (C-EnterNet), the Centre for Food-borne, Environmental and Zoonotic Infectious Diseases (Public Health Agency of Canada) and the Region of Waterloo Public Health for providing input into the survey tool; the staff of the Survey Research Centre at the University of Waterloo for conducting interviews; and the residents of the Waterloo Region for their participation. This project was funded by the Public Health Agency of Canada.
DECLARATION OF INTEREST
None.


 Open access