
Good science has a kind of rebellion nature to it – antiauthoritarian and mischievous – without this bit of fun many of us would not be doing science
Peter was always thinking about synapses – even early on with the sleep studies.
As his former National Institutes of Health (NIH) colleague Irwin Feinberg put it, Peter’s research “took a 180-degree turn” after his move to the University of Chicago in 1974. Instead of focusing on the brains of patients with neurological deficits, he started to study the “gridwork” of healthy brains. As Peter said, “the findings in the normal population were more interesting than the abnormal population.” His landmark 1979 study published in Brain Research was unexpected [Reference Huttenlocher1]. The accepted thinking at that time was that brains actually get more connections as we learn and develop, but he found the opposite to be true. After a burst of new synapses form in the first year of life, unneeded connections are removed, or pruned. All scientific discoveries are incremental and build on the work of other scientists. But rarely, a scientific discovery can also present an entirely new way of thinking about a problem – and is truly a breakthrough. In a conversation in May 2022, Feinberg said about Peter’s work: “the idea of brain connections was not in the thinking in the 1980s. The skeptics were many.”
In 1993, a Chicago Tribune reporter, Ronald Kotulak, interviewed Peter for an article entitled “Mental workouts pump up brain power.” Kotulak wrote:
As he focused on one sample and then another, Huttenlocher was astonished by the sharply increasing number of brain-cell connections; he later compared the site to watching the slow-motion frames of an explosion. A sample from a 28-week-old fetus totaled 124 million connections between cells; the sample from a newborn, 253 million; and the sample from an 8-month-old infant – an amazing 572 million connections, findings that defied conventional scientific wisdom. “It was a strange thing to see,” he said. “The number of connections kept going up and up and up and then they started to go down.” Brain connections, he soon learned, start to fizzle toward the end of the first year of life, stabilizing at 354 million per speck of brain tissue by age 12.
Habitually self-effacing, Peter’s next comment was “I stumbled on the whole thing. It was something that nobody expected. It took quite a long time until people began to accept that this really happens.”
Kotulak followed this up with journalistic flair:
By the time he was done with his census, Huttenlocher not only stunned neuroscientists with his demonstration of how fast the brain initially develops, he also provided a glimpse of the brain’s raw power to create a powerful learning machine … . Huttenlocher’s pioneering census was the first hint of something that has evolved into accepted scientific fact today: the brain is not a static organ; it is a constantly changing mass of cell connections that are deeply affected by experience and hold the key to human intelligence.
The 1993 Chicago Tribune article was written 14 years after the publication of Peter’s 1979 paper in Brain Research. Rather than “stunning” neuroscientists, the response of much of the neuroscience community to the 1979 publication was more one of disinterest or skepticism. As Chris Walsh said in conversation in December 2021, at the time “some people thought it was a folly, although it ended up being robust and durable science.” Walsh noted that there was skepticism because the electron microscope was used to study only a “small grid of brain tissue, and the sample size was small.” People were “put off by the scale of it.” How do you say something informative about human brain development through the lens of a small speck of tissue? It was difficult to grapple with. Feinberg’s comment about the response to the discovery of synapse elimination was: “Science is truth by consensus. It takes time.”
Despite his own skepticism, when Peter first noticed the dramatic changes in synapse number in normal human brains, he knew it was important. He knew the work had to be done with “fanatical” attention to detail. In the methods section of his 1979 paper [Reference Huttenlocher1], Peter concisely described his handling of the brain tissue. The careful work of laboratory science was described in language that some readers will view with trepidation and others, like Peter, will genuinely enjoy:
Middle frontal gyrus was chosen for study, since considerable developmental data on this region of cortex in the human are available, especially as regards development of dendritic branching in cortical neurons. Cases with known neurologic disease or with severe prolonged hypoxia prior to death were excluded. Small blocks of cortex, including layers 1–3, were removed at autopsy and were fixed in 5% glutaraldehyde in phosphate buffer (0.3 M, p. 7.4). The tissue was prepared for electron microscopy by the phosphotungstic acid method of Bloom and Aghajanian, which stains synaptic profiles selectively. Thin sections (silver interference color, about 75 nm in thickness) were cut with a Sorvall MT2 microtome, and were examined in an RCA Elmoscope 4 electron microscope. Photographs were taken of layer 3 frontal cortex in a random fashion at magnification of 6800. Finished prints were 2.5 times magnifications of the negatives, for a total magnification of 17,000. Twenty to thirty 8 Å ~10 inch prints were prepared for each sample, and identifiable synaptic profiles were enumerated in each print. Only profiles with clearly identifiable presynaptic projections, synaptic cleft and dense postsynaptic band were counted. Mean synapse count per cu.mm [cubic millimetre] was calculated for each sample.
Although surprising, there was a context for these findings. Changeux and Danchin, in an opinion piece published in Nature in 1976, proposed that biochemical signals alone were not sufficient to explain the complexity of neuronal connections during development [Reference Changeux and Danchin2]. They postulated that an increase in specificity of the connections is derived from the stabilization of particular synapses and the regression of others. The authors provide a biochemical perspective for Peter’s finding that there is an explosive change in synapses in the developing human brain. It also set the stage for Changeux’s later hypothesis that early synaptic connections are random, with the persistence of the used synapses and the regression of the unused connections.
After the publication of his 1979 study and the tepid response from the neuroscience community, Peter knew more work had to be done. Was the burst in synapses in early childhood and their subsequent elimination happening in other regions of the brain? Was the timing similar to what he observed in the frontal gyrus? To do this research he needed more tissue and there were significant challenges to performing post-mortem brain studies, which continue to this day. It was difficult to get samples in the United States, and for synapse quantification the samples needed to include unfixed brain tissue. Samples were difficult or close to impossible to obtain in the United States because few autopsies were done on children or young adults who died suddenly with no apparent illness. It was around this time that Peter attended a meeting of the Society of Neuroscience, the international conference that gathers neuroscientists from around the world to present their work every year. Peter was interested in working with Hendrik Van der Loos, a neurobiologist in Lausanne. Van der Loos, a developmental neurobiologist, had recently published the first electron microscopy (EM) study to examine synapse number and density in the human cerebral cortex from the neonatal period [Reference Molliver, Kostovic and Van der Loos3]. The EM method was a much more accurate way to quantify synapse density than the traditional Golgi method. Van der Loos and colleagues showed that synapse formation started in the second trimester during neonatal development, prior to the completion of the developmental neuronal migration that occurs in the fetal brain. Peter used a similar approach to study synaptogenesis but modified it to quantify synapse number in the brain during development using the phosphotungstic acid method that selectively stained peri-synaptic proteins, making it easier to quantify synapse density.
At the Society of Neuroscience meeting shortly after the publication of his 1979 study Peter met with Van der Loos, who at that time directed the Institute of Anatomy at the University of Lausanne in Switzerland. Hendrik was an expert on the development of synapses in the neonatal cortex of mice, and immediately grasped the importance of Peter’s findings on synaptic elimination in the human brain. He was eager to help. Hendrik had access to brain samples from the autopsies of healthy children and adults, since it was common practice to perform autopsies even on healthy people who died in accidents in Switzerland. At the meeting, Peter and Hendrik forged a plan. In collaboration with Van der Loos, Peter looked at synapses during development in the human visual cortex (striate cortex). He acquired critical samples that would later allow the analysis of patterns of synaptogenesis in other regions of the brain.
Peter lived in Lausanne, Switzerland, in the summer and fall of 1982 and returned to work with Hendrik in subsequent summers. During a sabbatical in 1982, Peter and Janellen lived in the small village of Lutry in the vineyards, five kilometers from Lausanne. There was a network of trails through the vineyards near their apartment in Lutry, on the hilly slopes above Lake Geneva. The vineyards were reminiscent of the trails in the vineyards surrounding his grandparent’s home near Stuttgart. During that summer he sent me the following in a letter:
We had a very good visit to Venezia. That is, the drive there was very long, monotonous and hot. But Venice was as unusual and beautiful as last time. Carl liked it too – especially feeding bread to the hundreds of pigeons in St. Marks square and stroking the many Venetian cats. He also became quite independent and took long strolls alone. They had a large Picasso visit in Venice – quite interesting. He was certainly his best as a young man from about 1900 to 1920. But then in very old age until his death in 1971, he did some pretty good work again. On the way back we took a different route – much more interesting. Along Lago Magione and then the Simphon pass (between 6–7,000 feet high). There still was some snow at the highest point and we walked around and threw snowballs in June! We had some bad news from the states. My research grant application for NIH was “approved but not funded.” This means I will no longer have money for research, and I am quite depressed about it. That is about all of the news from Lausanne. I still love the beauty and quiet of this place. This weekend we take off again for Paris.
For many years, Peter struggled to fund his synaptogenesis work. Was this because it was ahead of its time? Was it viewed as “folly” to do these types of studies using the human brain? Or was this a gap with Peter’s skill as a research group leader? Is it because he struggled to sell his work and tell his story in a way that convinced other neuroscientists? There has long been criticism that NIH funds safe science and has less inclination for out-of-the-box thinking. Descriptive science is particularly difficult to fund, yet Peter needed the funding to do his work as time on the electron microscope was expensive. Whenever possible, Peter worked with Hendrik in Lausanne but the gap in NIH funding significantly hindered his research progress. While his career as a clinician, clinical scientist and medical trainee educator was thriving, this was a discouraging period. Nonetheless, Peter continued to publish papers on synaptic pruning during the five years after the 1979 publication. And he persisted with grant applications until he again procured NIH funding in 1985.
Over their many visits to Lausanne, Peter and Janellen became close friends with Hendrik and his family. In the acknowledgements section of his 2003 book Neural Plasticity [Reference Huttenlocher4], Peter wrote: “I would like to remember the late Hendrik Van der Loos, who stimulated my interest in developmental neurobiology and particularly my interest in neural plasticity. A key portion of my work on synaptogenesis was done during a sabbatical stay in the Institute of Anatomy [in Lausanne] …. I miss him very much.” As Janellen later wrote in an email, “Hendrick was a very attractive human and his wife was completely lovely. But it all ended so sadly.” Hendrik died unexpectedly, by suicide, in the early 1990s after the death of his son. As Hendrik’s wife wrote to Peter in November 1993 from Lausanne, Switzerland:
Dear Peter,
Thank you very much for your kind letter and for the positive words about Hendrik. We always remembered fondly our stay in Chicago and the discussion we had about families with growing children. It is sad to realize that our happy family of five now has dwindled to three, having to go on the strength of good memories.
This loss had a big impact on Peter. Hendrik had enormous influence on Peter as a colleague, and as a friend.
With Hendrik, Peter studied synaptogenesis in the visual cortex. The visual cortex allowed for the precise measurement of cortical volume and addressed a key weakness of the 1979 study. Was the reduction in synapse density due to synapse elimination or alternatively due to an increase in total cortical volume? In this case they used computer-assisted methods for the quantification of synapses and area measurements. Their findings turned out to be similar to those made earlier regarding the prefrontal cortex [Reference Huttenlocher, de Courten and Garey5]. There was an initial rapid increase in synaptic density and a subsequent decrease during later stages of development. However, the timing was different as both the burst of synapse density and subsequent synapse elimination took place earlier than in the prefrontal cortex, suggesting that not all brain regions show the same kinetics of synapse density over time. Crucially, the study showed that synaptic pruning occurs in different regions of the brain and is not limited to the prefrontal cortex.
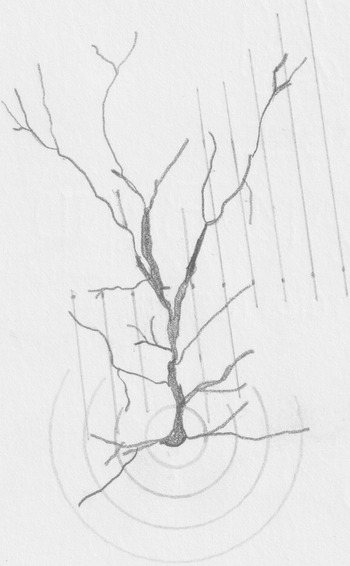
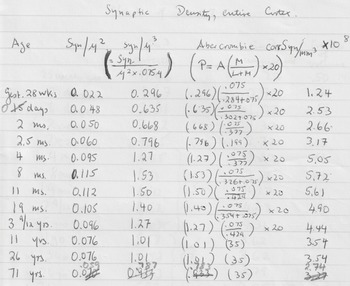
Although the gap in funding was discouraging it was not terminal. With an influx of new NIH funding in 1985, Peter at age 54 embarked upon the next phase of his research – understanding synaptogenesis in different regions of the brain. In collaboration with a research assistant, Arun Dabholkar, he performed a developmental study that showed that different regions of the brain display distinct developmental time courses [Reference Huttenlocher and Dabholkar6] (Figure 12.1). In Peter’s personal collection, he had many images of neurons, hand drawn, showing specific morphologies and cell projections (Figure 12.2), and also included were data in his personal notebook that included the quantification of synapse density as a function of age in specific brain regions (Figure 12.3). In the primary visual cortex, maximum density is reached by eight months, whereas synaptogenesis in the middle prefrontal cortex develops later, with a peak in synaptic density at between three and four years of age. The data also suggested that synapse elimination occurred later in the middle frontal gyrus: at least until the early 20s, but due to some age gaps in the sample set, likely later. This is in contrast to the visual cortex, where adult levels of synaptic density may be reached as early as four years of age. The findings in the language areas particularly piqued Peter and Arun’s interest. They found that the development of synapses in the auditory cortex, which controls hearing, preceded that in the “receptive” learning areas known as Wernicke’s area. In addition, the development of synapses in Wernicke’s area came before synaptogenesis in Broca’s area, which controls motor speech. This elegantly supported the idea that the development of synapses mirrors the functional development of hearing sounds, then language comprehension and finally the ability to talk.
Mean synaptic density in synapses/100 micron area in the auditory, calcarine and prefrontal cortex at different ages. Open circles, visual cortex (area 17), filled circles, auditory cortex: crosses, prefrontal cortex (middle frontal gyrus). From: Huttenlocher PR, Dabholkar AS. 1997. Regional differences in synaptogenesis in human cerebral cortex. J Comp Neurol 387: 167–78. doi: 10.1002/(sici)1096-9861(19971020)387:2<167::aid-cne1>3.0.co;2-z.
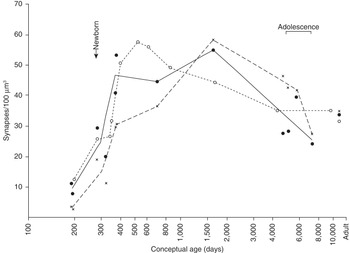

In the concluding paragraph in their 1997 publication Huttenlocher and Dabholkar highlight the kinetics of synapse elimination in different regions of the brain, which correlate with later regression in regions that control higher cognitive functions:
Onset of cortical function in the human appears to occur at different ages in different cortical regions. Functional development of prefrontal cortex appears to be more gradual and at a later age than visual cortex. … More complex “executive” functions of prefrontal cortex such as reasoning, motivation, and judgment appear to develop gradually during childhood and adolescence, perhaps continuing during the adult years. These uniquely human functions appear late during development, and their emergence may be aided by late persistence of exuberant synapses in the prefrontal cortex.
Like the studies in kittens by Hubel and Wiessel done in the 1960s, there was a window of time during which this synaptic remodeling occurred that reflected a time of significant plasticity. In humans, this “critical period” seemed to be prolonged as compared to other mammals. This window in humans is a time when learning occurs rapidly, and it makes sense that specific synaptic connections that are reinforced are sustained while others are lost. Peter’s newer work suggested that this occurs at different times in different regions of the brain, correlating with the ages at which we learn and develop different skills. For example, the timing of pruning in the auditory cortex is consistent with the ease of learning a new language or music at a younger age. Peter was well aware of this gap since he had retained a thick German accent, even after having lived in the United States for many decades. Another example is the timing of pruning in the visual cortex corresponding with the developmental window seen with the reversal of amblyopia, or “lazy eye,” by patching the strong eye and thereby forcing young children to use the weak eye.
As Irwin Feinberg noted, “science is a process of consensus-building.” After the publication of Peter’s 1979 paper there was a burst of work to address the pruning hypothesis in other animal models. Studies in primates, cats and mice all supported the idea that more connections are made early in development and that they are subsequently refined in an elegant process of selection. As discussed in Chapter 2, Shatz and colleagues showed that neural activity regulates synaptic pruning in the visual system of cats. Retinal cells in the eye send out exuberant branched projections and many of the connections are pruned away during development. However, if the retinal activity is blocked, the chaotic branches persist and are not pruned, providing direct evidence that neuronal activity regulates pruning in an elegant system that refines connections based on experience.
This work built upon years of prior neurobiology discoveries all the way back to the work of Ramón y Cajal almost a century earlier, and provided understanding for the developmental growth of neurons and their axon and dendrite projections as they reach out and touch neighboring cells. Some of these connections are sustained. Initial contacts between neurons seem to form in an organized way, but randomly. Based on activity or environmental input, specific synapses are then reinforced but, if the electrical and signaling activities do not occur in synapses, they are pruned or eliminated. It is a well-designed system: make too many and refine to select the optimal connections based on experience.
Scientific understanding of a biological phenomenon like synaptic pruning generally occurs over many decades, through a community process. Early in this process there is rarely a consensus and, often, much skepticism and disagreement. For Peter, the skeptics were difficult to handle because, more so than many scientists, he shied away from rancor, disagreement or making “waves,” even though this is part of the scientific process. To him, his data clearly showed that there were regional differences in the kinetics of synapse loss, and that these regional differences correlated with the times of most intense learning in these different regions of the brain. This finding had broad implications for the relationship between synaptic pruning and learning and memory. There was debate in the field about the work in different regions of the brain. Work from Rakic and colleagues in primates suggested that the pruning did not show regional differences in synapse loss [Reference Rakic, Bourgeois and Eckenhoff7]. Peter thought this reflected the timing of pruning – that humans, with more complex processing such as spoken language and higher cognitive functions, had a more prolonged loss of synapses that extended through adolescence and even into adulthood. Indeed, in a more recent study published by Rakic and colleagues in 2011, with more human tissue samples, this is precisely what was found [Reference Petanjek, Judas and Simic8]. Elimination of synaptic spines in human brains extended into the third decade of life, supporting the idea of an extended period of “developmental reorganization.”
Peter was excited to discuss plausible broader implications of the work focused on differential rates of synaptic pruning in different brain regions. In contrast to other animal species, the period of plasticity before synapse elimination is complete is much longer during human brain development. “There has been a great deal of emphasis lately on the importance of early learning,” Dr. Huttenlocher said in a University of Chicago publication. He continued:
That is important, but we need to realize what children are able to learn and not cram them with information they are not ready to handle. Similarly, we need to appreciate what adolescents can learn. They are able to perform higher-level thinking that is beyond most younger children. We also need to realize that because the portion of the brain controlling motivation develops last, we shouldn’t be surprised if high school students have trouble making decisions about their life’s work. It may very well be that their brains need to develop further, that their brains simply aren’t prepared to make such decisions until early adulthood.