

1. Need for measurement of concept maps
Concept maps are particularly effective in capturing and assessing learning by representing a learner’s knowledge structure (Reference Grundspenkis and StrautmaneGrundspenkis & Strautmane, 2010; Reference Patel, Summers, Kumar and EdwardsPatel et al., 2024; Reference Tergan, Keller and BurkhardTergan et al., 2006). They help educators identify misconceptions (Reference NovakNovak, 2010), evaluate conceptual understanding (Reference Watson, Pelkey, Noyes and RodgersMaria Araceli Ruiz-Primo et al., 2001; Reference Watson, Pelkey, Noyes and RodgersWatson et al., 2016), and track the evolution of knowledge over time (Reference West, Park, Pomeroy and SandovalWest et al., 2002). For example, comparing pre- and post-intervention concept maps can reveal how learning progresses and what gaps remain (Reference Kamble and TembeKamble & Tembe, 2013; Reference Patel, Summers, Kumar and EdwardsPatel et al., 2024). In engineering and design, concept maps are used for brainstorming (Reference Trochim and KaneTrochim & Kane, 2005), system understanding (Reference ChangChang, 2007; Padilla et al., Reference Padilla, Methven, Robb and Chantler2017; Reference Reichherzer and LeakeReichherzer & Leake, 2006), and design process visualization (Reference Correia, Infante-Malachias and GodoyCorreia etal., 2008; Reference Crampes, Ranwez, Villerd, Velickovski, Mooney, Emery and MilleCrampes etal., 2006). They allow for the integration of multidisciplinary knowledge and support collaboration by providing a clear and shared understanding of a system or process (Reference Arias, Eden, Fischer, Gorman and ScharffArias et al., 2000). Concept maps also play a critical role in knowledge/project management (Reference Cañas, Novak and ReiskaCañas et al., 2005; Reference GambleGamble, Paul R., 2001), preserving best practices (Reference Control, Performance and ContextsControl et al., 2008) and facilitating the transfer of information across teams and stakeholders (Reference van Bon-Martens, van de Goor, Holsappel, Kuunders, Jacobs-van der Bruggen, te Brake and Van OersLe Bras et al., 2018; Reference van Bon-Martens, van de Goor, Holsappel, Kuunders, Jacobs-van der Bruggen, te Brake and Van Oersvan Bon-Martens et al., 2014).
In engineering education, they serve as tools for promoting metacognitive reflection, helping students connect theory with practical applications and fostering deeper engagement with the material (Reference Watson, Pelkey, Noyes and RodgersBesterfield-Sacre et al., 2004; Darmofal et al., Reference Darmofal, Soderholm and Brodeur2002; Schroeder et al., Reference Schroeder, Nesbit, Anguiano and Adesope2018; Van Zele et al., Reference Van Zele, Lenaerts and Wieme2004; Reference Watson, Pelkey, Noyes and RodgersWatson et al., 2016). By analysing the concept maps, researchers can evaluate the richness and depth of the data (Reference HenryHenry, 1974), information (Reference GambleGamble, Paul R., 2001) and knowledge integration (Reference DeweyDewey, John, 1949), offering insights into both individual (Reference Tergan, Keller and BurkhardTergan et al., 2006) and team learning processes (Reference Torre, Daley, Stark-Schweitzer, Siddartha, Petkova and Ziebertde Ries et al., 2022; Lopez et al., Reference Lopez, Shavelson, Nandagopal, Szu and Penn2014; Novak, Reference Novak2010; Reference Torre, Daley, Stark-Schweitzer, Siddartha, Petkova and ZiebertTorre et al., 2007). However, earlier research has not established clear guidelines to encode computationally and measure the complexity of the maps.
The need also extends the tool to be used as a mixed-methods tool delivering both qualitative and quantitative insights as needed while another research states that concept maps were used only for qualitative analysis (Reference Kinchin, Streatfield and HayKhajeloo & Siegel, 2022; Reference Kinchin, Streatfield and HayKinchin et al., 2010). Thus, allowing one to measure micro trends pertaining to an individual participant and their journey; as well as macro trends pertaining to multiple participants and the larger trends as a cohort (Reference D’Antoni, Zipp and OlsonD’Antoni et al., 2009).
2. Establishing the concept map coding scheme
The presented concept map coding scheme was developed as part of a larger study and analysis of participants using concept maps for aligning and measuring the engineering identity of undergraduate engineering students identity (Reference Kumar and SummersKumar & Summers, 2024). Here, for consistency of terminology, coding is used for three common terms:
-
Coding (Reference Kinchin, Streatfield and HayCarley, 1993; Jackson & Trochim, Reference Jackson and Trochim2002; Reference Kinchin, Streatfield and HayKinchin et al., 2010)
-
Rating (Reference Schau, Mattern, Zeilik, Teague and WeberAllen et al., 2015; Cañas et al., Reference Cañas, Novak and Reiska2015; Reference Schau, Mattern, Zeilik, Teague and WeberSchau et al., 2001)
-
Scoring (Reference West, Park, Pomeroy and SandovalD’Antoni et al., 2009; McClure et al., Reference McClure, Sonak and Suen1999; M Araceli Ruiz-Primo, Reference Ruiz-Primo2004; Rye & Rubba, Reference Rye and Rubba2002; Van Zele et al., Reference Rye and Rubba2004; Reference West, Park, Pomeroy and SandovalWest et al., 2002).
The concept maps are also viewed as a tool to measure, understand, or investigate the mental models to understand the perceptions of its participants. By using concepts or keywords (vertices) and connections between the keywords (edges), the graphs represent the conceptualized information for the modeler. For the scope of this research, concept maps are analysed for three things:
1) Topology: In this step, complexity metrics (Reference Mathieson and SummersJ. Mathieson & Summers, 2017) are captured during the codification of the concept maps are analysed. This helps us understand the type of concept map expected and what its complexity can be attributed to.
2) Vocabulary: This step analyses all the keywords, words and sentences, the trends that emerge from these words, along with sentiment and correlation/semantic (LSA) scores.
3) Comprehensive: This step combines the two other steps and analyse the concept maps to observe larger trends that emerge in larger categories and classifications.
Coding of the concept maps into its respective sub formats must be uniform, accurate, and consistent. The coding scheme should mitigate bias of evaluators. The final coded concept map should be in a computationally interpretable form that can extract structural complexity metrics (J. L. Mathieson & Summers, Reference Mathieson and Summers2010a). Finally, for this paper, only “Topology,” is considered as it was observed to be the most complicated item demanding a systematic coding scheme.
2.1. Process
The process of coding concept maps accurately and efficiently without the risk of introducing additional complexity and variables boils down developing this robust training manual and a guidebook.
The training manual presents a step-by-step procedure to code the concept maps while the guidebook serves as a dictionary with types, scenarios, and examples encountered when coding the vertices and edges of the concept maps. Each concept map is treated like a fingerprint, that is unique to every person (Reference Moon, Johnston and MoonChang, 2007; Hamdiyati et al., Reference Hamdiyati, Sudargo, Redjeki and Fitriani2018; Reference Moon, Johnston and MoonMoon et al., 2018). Figure 1 illustrates this process and provides a quick snapshot on the entire process of using the original concept maps that capture a central idea in this case, the student’s definition of “Engineer” which is then translated to an intermediate step and then to the final computational model.
The coding process

2.2. Guidebook
The guidebook serves as a preliminary document that details the various issues and complexities while dealing with different individuals and their concept maps. As different individuals use different styles of expression, thought, opinion, writing, and diagramming, it is important to capture the different scenarios one would encounter while coding concept maps. The guidebook becomes a master key to unlock those variations and develop a consistent understanding of these diverse scenarios. Building objectivity in this work is a central goal. Hence, the guidebook is developed to ensure anyone looking at the concept maps will be able to arrive at the same conclusion and understanding of the participant’s mental model. The guidebook presented to the researchers who were coding the concept maps had four sections:
-
Summary
-
Type V-Vertex (Reference Grundspenkis and StrautmaneGrundspenkis & Strautmane, 2010; Reference Ruiz-Primo, Shavelson, Li and SchultzMaria Araceli Ruiz-Primo et al., 2001)
-
Type E-Edge (Reference Reichherzer and LeakeReichherzer & Leake, 2006)
-
Type O-Overall (Reference Watson, Pelkey, Noyes and RodgersLopez et al., 2014; Van Zele et al., Reference Van Zele, Lenaerts and Wieme2004; Reference Watson, Pelkey, Noyes and RodgersWatson et al., 2016)
Each of these types of complication explored several scenarios within the types and several cases within scenarios accordingly. These categorization of into Type, Scenario and Case allowed the research to create a needed training guidebook and manual aiding the development of a robust coding scheme that can be tested.
2.2.1. Type V-Vertex
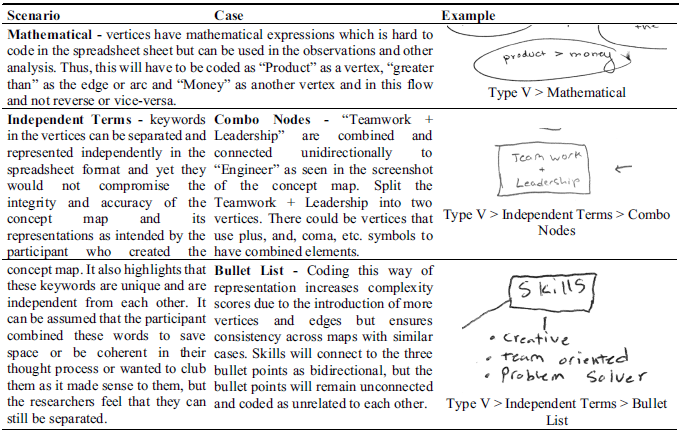
The vertices contain the concepts, typically represented as words or phrases and are considered as the data or facts presented by the participant/creator of the concept maps. These vertices must be coded appropriately to retain the essence of the concept map. If there are multiple concepts embedded in a single vertex, it is important to split the vertex to more accurately represent the complexity of the graph. This may increase or decrease the complexity metrics and its values for concept maps, but this guide is to ensure research maintains consistency in the understanding and the coding of the concept maps. This type captured three scenarios
-
Independent Terms
-
Only Nodes
-
Mathematical
While Only Nodes, and Mathematical has just one case under them, Independent Terms had four cases under it, showcasing the complexity of vertices that can be present in concept maps. These are illustrated through scenarios, cases, and examples in Table 1.
Type V-Vertex related scenarios and cases capturing complexity during coding

2.2.2. Type E-edge
The edges are represented as the connections or arcs on the concept maps that represent the flow of information emerging from one of the vertices (data or facts) and ending at another. Similar to ‘Type -V,’ this complexity type ‘Type-E’ identified three scenarios to be covered in the coding scheme. Here again the coding scheme emphasizes to categorise and capture the edges to reflect the original intent of the concept map and its creator.
-
Overlook - analysed edges and their terms, identifying cases within this scenario where certain edges can be simplified or eliminated or reduced also ensuring to stay within an allowable deviation of added or reduced complexity. This scenario captured five cases: i. Use and Discard, ii. Dead Ends, iii. Pit Stop, iv. Slink, and v. Crossover
-
Disjoin Terms - this scenario identified filler or connection words associated with arcs. While these terms were repeating, they are captured separately to preserve their uniqueness and allow for accurate replication in the coding scheme. Ensuring assumptions are eliminated to second guess the creator of the concept map. Although repetitions are impossible on vertices, it is a common occurrence in edges, as these terms often explain flow of information which can be overlapping. This scenario captured four cases: i. Multiple Repeats, ii. Divergent, iii. Convergent, and iv. Reduction
-
Directionality of Flow - this scenario examines contradictions and complexities in mapping the directionality of flow. It focuses on understanding the significance of arrow marks, or the ambiguity in determining these connections and their purpose as intended by the creator. This scenario covered four cases: i. Inconsistent, ii. Squiggles, iii. Self-Loop, and iv. I Guess So (IGS)
2.2.3. Type O-overall
‘Type O’ covers concept maps that do not fit into Type V or Type E or they have multiple types that apply to them. This type applies to checking the maps at the overall level rather than vertices or edges level. Thus, this type often applies to maps that are hybrid with two or more types. Type O includes two scenarios:
-
‘Refer The Original’ (RTO) - concept maps that are hard to read or code initially are flagged before coding for Type V or Type E. The reason behind such maps are - a writing utensil that is not appropriate for the task, or the map had illegible handwriting, or a bad scan rendering the digital copy of the concept map, unreadable. Two cases explored: i. Ghosted, and ii. Illegible.
-
‘Null Graphs’ - concept maps were regarded as a null entry, as this map would not have any data to capture or code. Two cases presented were: i. Dummy Map, and ii. Blanks.
2.3. Training manual
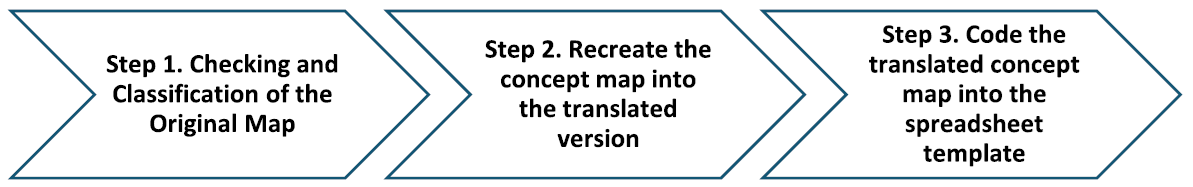
The training manual serves as a step-by-step procedure-based manual that helps the coders to code and translate the concept maps into the spreadsheet files. This is done as a three-step process as illustrated in Figure 2.
Concept maps three-step coding process

2.3.1. Step 1. Checking and classification of the original concept map
For this step we classify and rate the concept maps on the following attributes: TSC, Readability, Relevance of Information, Completeness, Complexity. This step is to create a quick access meta-data classification and verification called as ‘Summary’ for the research. Thus, providing a quick and easy classification of the concept map. The real emphasis of coding concept maps is not the summary but, on the final, spreadsheet file. This is because of the downstream activity after these steps, where the spreadsheet files are used to generate the 27-complexity metrics using MATLAB for every concept map (Reference Mathieson and SummersJ. L. Mathieson & Summers, 2010b; Reference Mathieson and SummersJ. Mathieson & Summers, 2017). The summary classification and verification is only a check and balancing step in the entire process.
2.3.2. Step 2. Recreate the concept map into the translated version
This is a step focusses on the guidebook and manual to code the vertices and edges, to enable markup on the existing concept map or to redraw the concept map into the translated system of maps which can help convert any concept map into a bi-partite graph that is needed for the analysis. There are six sub-steps which will be detailed with an example below.
2.3.3. Step 3. Code the translated concept map into the spreadsheet template
Each participant will have their own spreadsheet file to maintain the accuracy and consistency from the translated map to the computational map, that is their computational version of the original hand-drawn concept map. Hence creating copies of the file shared and renamed to its corresponding participant ID. Multiple examples are provided to researchers to explain the process, but brevity dictates this paper to present two that illustrate the three-step process. Only the first example will be detailed and while the other example is to help arrive at the required training and conclusion faster.
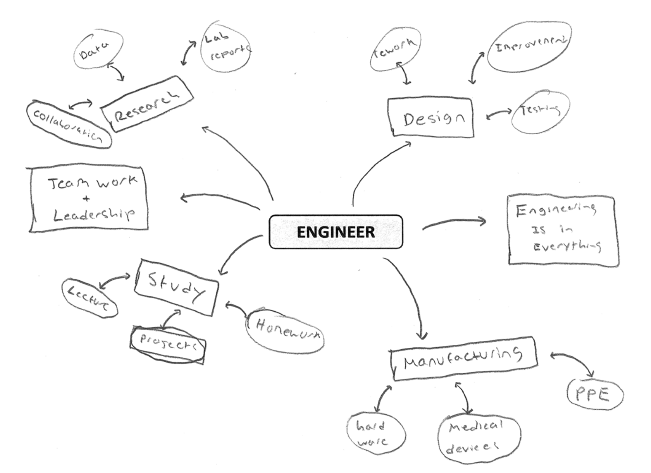
2.4. Example – NE22NA37:
Figure 3 illustrates a screenshot of the concept map used for this example to detail the coding process.
Example 1 – NE22NA37 concept map original

2.4.1. Step 1 - checking and classification
In this step we check the Code, TSC (NA, Single or Multiple), Readability, Relevance of Information, Completeness, and Complexity for the original map and code them in spreadsheet as per Table 2 . This meta level view of the concept map is used to identify the maps that might need more systematic review by multiple raters.
classification of ‘Summary’ for example 1

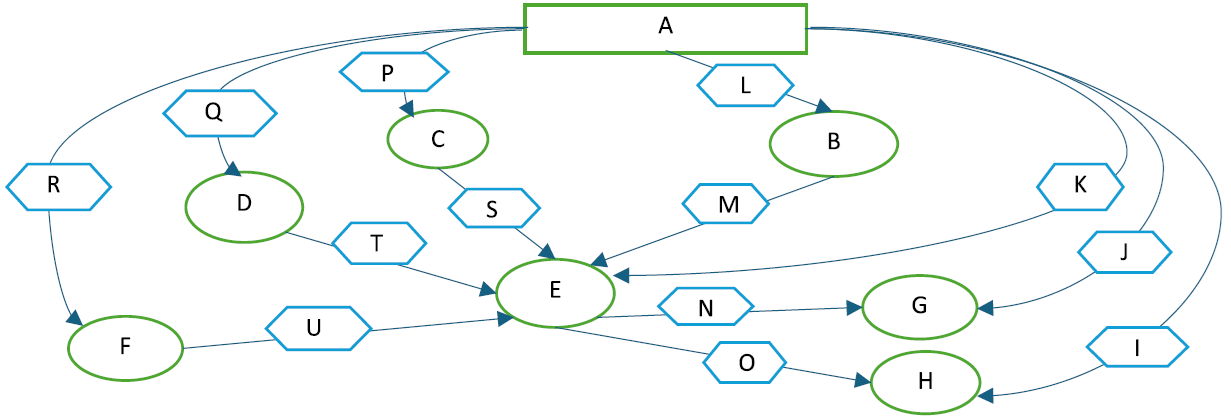
2.4.2. Step 2: Sub-Step-By-Sub-Step translation of the concept map for this example:
Combining Sub-Steps 1 to 6: Translate Vertices starting from “Engineer” and radiating outward, one level at a time: Radiate outward to the next level or layer. Labelling all the vertices from (A) to (H) in green rectangular and circular boxes, edges are named from [R1] to [Rn] as an interim to finally be named from (I) to (U) in the blue hexagons in figure below to finally be consistent as required for the spreadsheet coding. Once the coding is completed the number of vertices and edges are noted and cross-checked with the record from the summary. Next, all vertices and edges are checked on their assigned alphabets to match the spreadsheet conversion, thus leaving nothing but the alphabetical representation that is needed to convert any concept map into a bi-partite map (Figure 4). Again, for this coding, only the complexity of the concept map as defined through the graph structural complexity is explored. Other semantic coding that is out of scope may be done separate on the vocabulary that is used in the graph.
Step 2 final translated map

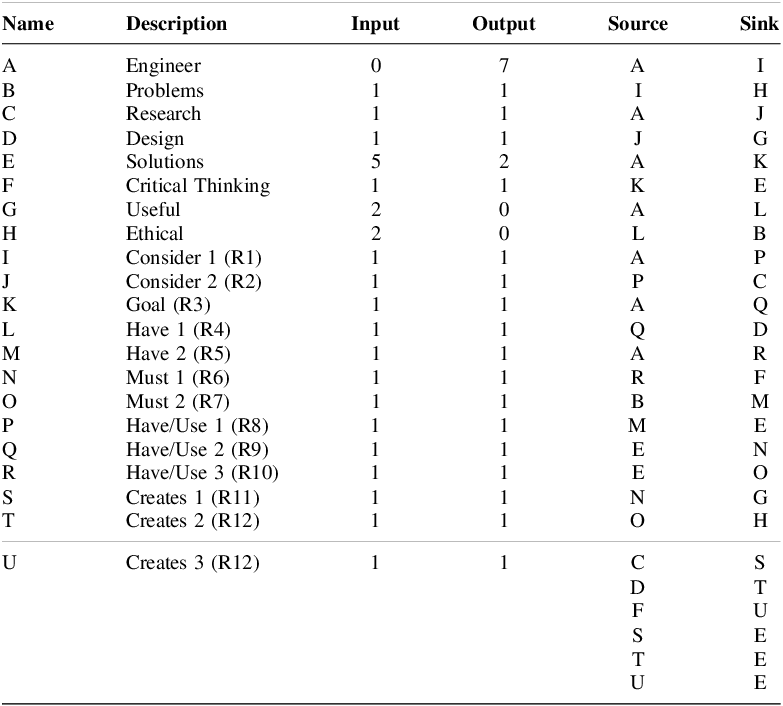
2.4.3. Step 3 - Concept Map Coded on Spreadsheet and Verification
This step shown in Table 3 highlights that all the unique identifiers assigned to the vertices and the connections/edges. As the concept maps might be directed networks, the edge direction is also captured. The input and output sections are driven by a formula that is connected to the source and sink columns. The researcher coding will meticulously input the source and sink with its newly assigned alphabet in the name column, while everything else mentioned by the participant in the original concept map goes into the description section. The input and output columns can be used to verify the coded concept maps on spreadsheet to the translated and to the original. Everything on the spreadsheet should map back to the original when reverse coded. The translated concept maps and the spreadsheet will be the same and is used during initial training only. This check shows that the original map would have an inherent complexity as observed by the coder and recorded, while the spreadsheet might slightly vary depending on the Type, Scenario and Case that the coder encountered to code the concept maps in spreadsheet that can be used by the research for further analysis.
Coding on spreadsheet for example 1

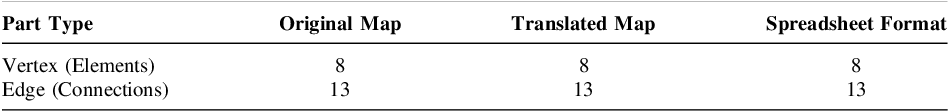
2.4.4. Verification
Table 4 shows the final format arrived after the original map from Figure 2, translated to map from Figure 3 and final spreadsheet format from Table 3. In this case since the complexity was with the “EDGES”, the coding scheme arrived at all formats having the same vertices and edges. Thus, completing the coding of the concept maps from its original hand-drawn visual form to the spreadsheet form.
Verification of vertices and edges from original to spreadsheet format for example 1

2.5. Example 2 - IA10WE93
(Figure 6 shows the original concept map for a second example which is shown in the next page.)
Step 1: Summarization of classification as step 1 shown in Table 5.
Summary classification for example 2 - IA10WE93

Step 2: Figure 5 is a snapshot of the interim translated map just before the final alphabetical translation.
Snapshot of hand-drawn translated map as part of step 2

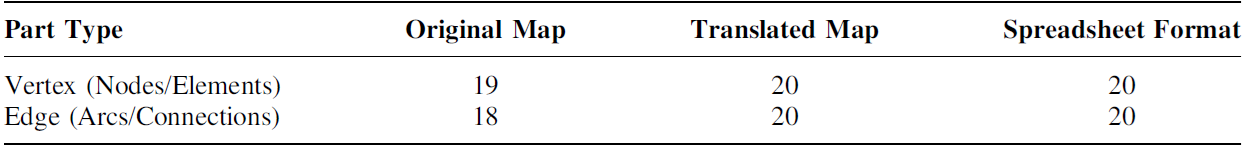
Step 3: Snippet of step 3 showing the final verification in Table 6.
Verification of vertices and edges from original, spreadsheet format

Example 2 - IA10WE93 original concept map

3. Conclusion
This paper establishes a need for a robust coding scheme that can be used to capture the various complexities emerging from hand-drawn or digital concept maps used in mixed methods research, as an augmenting or surrogate tool to provide qualitative and quantitative results. The coding scheme and the process outlined in this article can also be useful to code other flow charts and diagrams which can help store and retrieve information for further processing. The coding scheme established is a simple three step process to capture the data (vertices), information (edges) and knowledge (overall meaning and purpose) from the original concept map which represents the mental model from participants for the topic of interest. The scope of the coding scheme was also established highlighting the limitation with the ‘Summary’ aspect of concept maps which needs to be further strengthened. The emphasis was on the vertices and edges which form the basis for the structural complexity analysis.
With the coding scheme established, it is being applied to roughly 2,600 concept graphs generated as part of a study on evolution and change within subjects in terms of engineering identity. The concept graphs are expected to increase in complexity from the beginning of the semester to the end of the semester. With the generated graphs, the complexity metrics and be used to measure this change. The larger study is being conducted to collect data through surveys and concept maps to measure the engineering identity of engineering students at an R1 university in the sub-urban region of a metropolitan city in the U.S (Reference Kumar and SummersKumar & Summers, 2024). The established coding scheme is intended to be used in this case and will be tested for its accuracy and consistency through the tests for interrater reliability (IRR). The coding scheme is intended to be tested on multiple concept maps with varying complexity (types, scenarios and cases) by multiple rates at different time intervals. This method of testing will help provide a scientific case study-based validation that comes with a high confidence level as demanded by rigorous statistical methods.


 Open access