


NOMENCLATURE
- AR
aspect ratio
-
 $A_{sep}$
area of septum
-
$A_{side}$
-
side-body projected area
-
$A_{fin}$
-
fin surface area
-
$A_{sa}$
-
area of solar array
-
$a_i$
-
shape coefficient
- BR
-
buoyancy ratio
-
$C_{dv}$
-
volumetric drag coefficient
-
$C_f$
-
friction coefficient
-
$C_{D}$
-
total drag coefficient
-
$C_{d0}$
-
zero-lift drag coefficient
-
$C_p$
-
prismatic coefficient
-
$C_{L}$
-
lift coefficient
-
$C_{L\alpha}$
-
lift-curve slope
- d
-
maximum diameter of the airship
-
$d_e$
-
equivalent diameter
-
$\vec{dA}$
-
elementary area
-
$\vec{db}$
-
elementary width
- dE
-
energy generated from elementary area
-
$\vec{dl}$
-
elementary length
-
$E_{sup}$
-
total energy generated
-
$E_{req}$
-
total energy required
- g
-
acceleration due to gravity
-
$h_{alt}$
-
altitude of deployment
-
$I_k$
-
total incident solar radiation
-
$I_{day}$
-
day of operation
-
$I_0$
-
solar constant
-
$k_{mod}$
-
correction factor
- K
-
drag-due-to-lift factor
- k
-
purity of lifting gas (%)
- l
-
length of the airship
-
$l/d$
-
fineness ratio
-
$L_{total}$
-
total lift
-
$L_{buoy}$
-
buoyant lift
-
$L_{aero}$
-
aerodynamic lift
-
$L_{vectored}$
-
thrust vector
-
$X_m$
-
location of maximum diameter
-
$ m_a$
-
absolute air mass
-
$m_{energy}$
-
mass of energy system
-
$m_{env}$
-
mass of envelope
-
$m_{sep}$
-
mass of septum
-
$m_{tail}$
-
total mass of tail
-
$m_{fin}$
-
mass of fins
-
$m_{gas}$
-
mass of lifting gas
-
$m_{total}$
-
total mass of airship
-
$m_{prop}$
-
mass of propulsion unit
-
$ m_r$
-
relative air mass
-
$m_{array}$
-
mass of solar array
-
$m_{es}$
-
mass of energy storage unit
-
$m_{struct}$
-
structural mass
-
$\hat{n}_{surf}$
-
surface unit normal
-
$ \hat{n}_{sun}$
-
unit vector along sun ray
- R
-
rotation matrix
-
$N_L$
-
factor depends on number of lobes
-
$p_a$
-
ambient pressure
-
$P_{thrust}$
-
thrust power
-
$P_{total}$
-
total power required
-
$P_{pay}$
-
power needed by payload
-
$P_{sup}$
-
power supplied
- Re
-
Reynolds number
-
$\vec{r}$
-
position vector
-
$R_0$
-
radius of curvature at nose
-
$R_1$
-
radius of curvature at tail
-
$S_{plan}$
-
planform area
-
$S_{wet}$
-
wetted surface area
-
$t_{night}$
-
duration of night
-
$V_{env}$
-
volume of the airship envelope
- W
-
total weight of airship
-
$W_{hull}$
-
width of the envelope
-
$W_H$
-
heaviness
-
$W_g$
-
gross weight
-
$W_{empty}$
-
empty weight
-
$W_{energy}$
-
energy subsystem weight
-
$W_{prop}$
-
propulsion unit weight
-
$W_{misc}$
-
miscellaneous weight
-
$W_{struct}$
-
structural weight
-
$W_{pay}$
-
payload weight
-
$W_{total}$
-
total weight
-
$W_{env}$
-
envelope weight
-
$w_{prop}$
-
power density of propulsion system
-
$w_{es}$
-
energy density of battery
-
$X_s$
-
starting point of solar array
-
$X_f$
-
ending point of solar array
-
$\Delta t$
-
time interval
-
$\Delta H$
-
altitude difference (km)
-
$\Delta P$
-
total pressure difference


Greek Symbols
-
$\alpha$
-
solar elevation angle
-
$\alpha_{aoa}$
-
angle-of-attack
-
$\beta$
-
temperature coefficient
-
$\eta_a$
-
packing area efficiency
-
$\eta_{sc}$
-
solar cell conversion efficiency
-
$\eta_e$
-
electrical component efficiency
-
$\eta_g$
-
gear efficiency
-
$\eta_P$
-
propulsive efficiency
-
$\eta_{conv}$
-
energy storage conversion efficiency
-
$\eta_T$
-
temperature-dependent efficiency
-
$\eta_{ref}$
-
reference efficiency
-
$\rho_a$
-
density of ambient air
-
$\rho_{gas}$
-
density of lifting gas
-
$\rho_{fab}$
-
area density of envelope fabric
-
$\rho_{sa}$
-
areal density of solar array
-
$\theta$
-
angle between surface normal and sun ray
-
$\theta_{array}$
intended angle of solar array


1.0 INTRODUCTION
Depletion of fossil fuels and environmental concerns such as noise, pollution and global warming have supported the resurgence of airship technology as an efficient aerial platform for a wide range of applications and operations in the civil and defence sectors. There is a renewed interest in airship technology due to technological advancements in the fields of materials, energy sources, aerodynamics, propulsion technology and flight controls. Compared with Heavier-Than-Air (HTA) vehicles, airships have good hovering ability for long endurance and consume almost no energy to stay aloft, except in the presence of wind. Airships are quieter and cheaper to operate than aircraft, and their inherent operational safety make them quite suitable for security applications.
In recent years, airships have been touted as a potential platform to perform several tasks such as scientific exploration, observation and surveillance at stratospheric altitude. For high-altitude long endurance missions, a special category of stratospheric airships has emerged (HALESAs). These systems are to be deployed for months at a stretch at altitudes ranging from 15 to 20km above the Earth’s surface, where the temperature is approximately constant, wind intensity is quite low and stable(Reference Yang and Liu1,Reference Morgado, Abdollahzadeh, Silvestre and PÁscoa2,Reference Androulakakis and Judy3,Reference Smith, Lee, Fortneberry and Judy4) and the wind moves horizontally at this band of altitudes(Reference Wu, Fang, Wang, Hou, Ma, Zhang and Xu5). To achieve long endurance flight at a high altitude, these systems generally use solar energy to meet their own propulsive power requirements, as well as the power needs of the onboard mounted payloads.
Since the envelope is the largest and most important component of a HALESA, the selection of its shape is imperative in the sizing of an airship. The shape and size of the envelope play an important role in determining the aerodynamic characteristics, available buoyancy and mass of the system. Most existing studies(Reference Pande and Verstraete6,Reference Alam and Pant7,Reference Li, Liao, Liao, Du and Luo8,Reference Zhu, Li and Xu9) consider the envelope to be an axisymmetric body of revolution about a longitudinal axis, which is referred as a conventional single-lobed envelope because a body of revolution is generally considered to provide a good compromise between the conflicting requirements of aerodynamics, static lift and structure(Reference Khoury10). However, such a shape is far less efficient in terms of aerodynamic performance and is prone to very high side loads during cross-wind conditions. Further, if the solar panels are to be mounted on the envelope for power generation, the large curvature of a body of revolution becomes inefficient.
In some HALESA designs, non-ellipsoidal or non-axisymmetric single-lobed envelope shapes(Reference Dumas, Trancossi and Anzillotti11,Reference Suefuku, Hirayama, Hirakawa and Takayama12,Reference Ceruti, Voloshin and Marzocca13,Reference Cimarelli, Madonia, Angeli and Dumas14) have been proposed to address these issues, but it is difficult to maintain such shapes in an inflatable system, unless a rigid or semi-rigid configuration, which makes it heavy and unwieldy, is used.
1.1 Multi-lobed hybrid airship
Hybrid airship technologies that offer unique operational advantages over the conventional airships have emerged in the mid of
 $20^{\rm th}$
century. Among the aerial vehicles, the multi-lobed hybrid airship was found to be superior in the transportation of cargo, as shown in Fig. 1(Reference Carichner and Nicolai15). Efficiency between various modes of transport is compared on the basis of how far the different modes can transport 10,000kg of cargo with 1 gallon (
$20^{\rm th}$
century. Among the aerial vehicles, the multi-lobed hybrid airship was found to be superior in the transportation of cargo, as shown in Fig. 1(Reference Carichner and Nicolai15). Efficiency between various modes of transport is compared on the basis of how far the different modes can transport 10,000kg of cargo with 1 gallon (
 $\approx$
4.0L) of fuel.
$\approx$
4.0L) of fuel.
A comparison of the efficiency of different modes of transportation (Note: Regional hybrid and global hybrid represent lifting-body hybrid airship categorised on the basis of its payload capacity).

The multi-lobed hybrid airship is a type of non-rigid and powered airship that combines the features of Lighter-Than-Air (LTA) and Heavier-Than-Air (HTA) systems. The main advantage of the hybrid/multi-lobed airships is that up to 20–40% of the total lift comes from aerodynamics, whereas the conventional airships generate no more than 10% of their total lift from aerodynamics. The unique combination of buoyancy and varying aerodynamic lift makes the hybrid airships superior to the conventional airships and other air vehicles. The partially buoyant characteristic of the hybrid airship together with its unique shape allows it to generate a large amount of aerodynamic lift, and it can be modulated to keep the airship stable when offloading the payload.
Typically shaped bodies of revolution are joined side by side to form a multi-lobed hybrid airship configuration which provides lift from the aerodynamic design and from the lifting gas inside the hull as shown in Fig. 2. To illustrate a multi-lobed hybrid airship, a model similar to P-791 (an experimental hybrid airship developed by Lockheed Martin) was developed using Open Vehicle Sketch Pad (OpenVSP), a parametric geometry modelling tool for conceptual aircraft design(Reference Hahn16,Reference Hahn17) .
A multi-lobed hybrid airship model.

1.2 Need for the present study
Global concern for identifying the most suitable vehicle configurations for long endurance missions has spurred several studies on multi-lobed airships(Reference Zhang, Lv, Meng and Du18,Reference Manikandan and Pant19,Reference Zhang, Lv, Zhu, Du, Meng and Li20,Reference Zhang, Li, Meng, Du, Lv and Zhu21,Reference Ceruti, Gambacorta and Marzocca22) and HALESAs(Reference Yang, Xu, Zhang, Zheng and Wang23,Reference Zhang, Li, Wu and Lv24,Reference Shi, Ming and Liang25,Reference Meng, Liu, Yao and Lv26) . Brandon(Reference Buerge27) compared the performance of fuel-powered conventional airship with that of the lifting-body hybrid airship for persistence surveillance mission using empirical relations, and numerical models with several assumptions, and concluded that the conventional airship with the ellipsoidal envelope was inherently better suited for long endurance missions. Carichner and Nicolai(Reference Carichner and Nicolai28) conducted a trade study between the conventional and the hybrid configuration and concluded that the hybrid airship was superior to the conventional airship design except at a very high buoyant ratio. However, these studies were conducted on the basis of data available in the past and made assumptions for the publicly unavailable data. In these studies, the airships were designed for low-altitude applications and had a fixed geometry, and the analyses did not include the effect of varying geometrical parameters. Energy output and consumption play a significant role in the endurance of HALESAs. Hence, the effect of wind condition, airship orientation and day of operation must be considered in the methodology of sizing. These studies serve as a basis to understand the importance of selecting a suitable configuration for a required mission and help to improve the methodology applied. In the present study, however, the envelope geometry is allowed to vary, the related parameters are estimated with much fewer assumptions and the effect of the key operating parameters is considered.
This study aims to develop a methodology for sizing a solar-powered HALESA to meet the user-specified mission requirements. The methodology can be employed for sizing conventional single-lobed and tri-lobed envelopes for a HALESA. To demonstrate the efficacy of this methodology, a comparative analysis of HALESAs of both configurations of the envelope is carried out. The main objective of this study is to evaluate the relative merits and the demerits of solar-powered HALESAs having a tri-lobed lifting body envelope in comparison with the conventional ellipsoidal airship.
2.0 DEFINITION OF PROBLEM IN OPTIMISATION FRAMEWORK
Airship design is an interdisciplinary research topic that involves expertise in the areas of aerodynamics, propulsion, materials, structure, flight control, performance and weight estimation(Reference Carichner and Nicolai15). The size of an airship is usually determined on the basis of the airship’s mission requirements and the system characteristics such as the operating altitude and the mass breakdown of subsystems. The sizing an airship is a complex process because of the significant interdependencies of multiple disciplines, as shown in Fig. 3.
A framework for the sizing methodology.

In general, the MDO problems contain three important factors: design variables, cost function and constraints(Reference Kanikdale, Marathe and Pant29). This section provides details of the objective function, design variables, constraints and the optimisation algorithm used in the present study.
Weight is one of the essential elements in the sizing of an airship. The increase in weight of the airship requires greater envelope volume to balance the weight and more power to maintain the desired flight. On the other hand, the increase in airship size leads to increased drag, which further increases the power requirement, the area and the mass of the solar array, and the mass of the Energy Storage System (ESS). Hence, mass optimisation is a key aspect in this study. The total mass of the airship is to be minimised, while simultaneously satisfying the two constraints, that is, balance of weight with the lift and the availability of power and the requirement of power.
A detailed methodology for obtaining the optimal configuration and the layout of the solar array on the upper surface of the envelope of both the configurations has been obtained using a multi-disciplinary approach involving the disciplines of geometry, aerodynamics, energy, environment and structure, as shown in Fig. 4.
An MDO design process.

2.1 Design variables and key parameters
From the existing studies and the requirements of the design, the key parameters that affect the design and operation of solar-powered airship have been identified as ceiling, atmospheric properties, day of operation, operating location, purity of lifting gas, material density, energy density, power required by payload, and solar cell efficiency. Ceiling, day of operation, operating location and atmospheric properties have a strong effect on the volume of the envelope of an airship and the capacity of the payload.
The present study involves parameters from multiple disciplines, that is, envelope geometry, solar array geometry and layout, and the operating conditions. To define the geometry of the envelope of an airship with the solar panels mounted atop, we used six and five design variables for the tri-lobed airship and the conventional airship (
 $\textit{f}=0$
, for single lobe), respectively; the first two variables correspond to the envelope geometry, the next three define the geometry and the layout of the solar array and the last one corresponds to the operating altitude. In the present study, the effect of e and g (i.e. the relative distance between the lobes in the longitudinal and the vertical direction, respectively) have been ignored. The design variables have been explained geometrically in Fig. 5. The design variables and their lower and upper bounds are presented in Table 1.
$\textit{f}=0$
, for single lobe), respectively; the first two variables correspond to the envelope geometry, the next three define the geometry and the layout of the solar array and the last one corresponds to the operating altitude. In the present study, the effect of e and g (i.e. the relative distance between the lobes in the longitudinal and the vertical direction, respectively) have been ignored. The design variables have been explained geometrically in Fig. 5. The design variables and their lower and upper bounds are presented in Table 1.
Design variables and their range of values

Design variables involved in the sizing of the tri-lobed airship.

2.2 Objective function and optimiser
The aim of this design exercise is to optimise an airship with a given payload using the penalty function method. In the present study, the problem has been formulated to minimise the total mass
 $\left(m_{total}\right)$
of an airship for both the conventional and the tri-lobed airships.
$\left(m_{total}\right)$
of an airship for both the conventional and the tri-lobed airships.
Fitness function:
 \begin{equation}F(x) = m_{total} + penalty \sum_{i=1}^{r}(h_{i}^2(x)) + penalty \sum_{j=1}^{m}(g_{j}^2(x))\end{equation}
Constraint (s.t.):
 \begin{equation}\left \{\begin{array}{lcc}g_{1} \Rightarrow m_{total}\times g-(L_{buoy}+L_{aero}) \leq 0 \\[4pt] g_{2} \Rightarrow E_{req}-E_{sup} \leq 0 \\\end{array}\right.\end{equation}
The objective function with the constraints is converted into an unconstrained problem using the penalty function method and solved using the Particle Swarm Optimisation (PSO) technique, a very popular and efficient population-based stochastic approach similar to the Genetic Algorithm (GA), which solves continuous and discrete optimisation problems to find global optima by searching the entire design space(Reference Kennedy and Eberhart30,Reference Mezura-Montes and Coello31,Reference Pedersen32) . To verify the obtained solutions as the global optima from the PSO, the primary optimiser (i.e. PSO) is hybridised with the pattern search method to efficiently find the nearest local optimum. Figure 6 show the procedure of the PSO algorithm for the defined optimisation problem.
Procedure for optimisation using PSO.

In the main loop of the algorithm, the velocity (
 $V_i$
) and the position (
$V_i$
) and the position (
 $X_i$
) of the particles are updated iteratively until a stopping criterion is met. The position and velocity of each particle of swarm are updated as follows:
$X_i$
) of the particles are updated iteratively until a stopping criterion is met. The position and velocity of each particle of swarm are updated as follows:
 \begin{equation}V_{i+1}=\omega V_i+C_1\times rand( )\times \left(P_{best,i}-X_i\right)+C_2\times rand( )\times \left(G_{best,i}-X_i\right)\end{equation}
 \begin{equation}X_{i+1}=X_i+V_{i+1},\end{equation}
where
 $\omega$
is a parameter called inertia weight and
$\omega$
is a parameter called inertia weight and
 $C_1$
and
$C_1$
and
 $C_2$
are the two tuning parameters called acceleration coefficients.
$C_2$
are the two tuning parameters called acceleration coefficients.
 $P_{best}$
represents the individual particle best performance, and
$P_{best}$
represents the individual particle best performance, and
 $G_{best}$
the best performance of the swarm (group of the particles).
$G_{best}$
the best performance of the swarm (group of the particles).
3.0 DESCRIPTION OF VARIOUS MODULES
The sub-sections that follow give a brief description of each of the modules of the proposed methodology.
3.1 Envelope geometry module
The lift and drag of an airship are determined by the volume of the envelope, and therefore, the volume of an airship needs to be fixed in the primary design phase itself. The surface area of the envelope is another important parameter that has a significant effect on the weight and the friction drag of an airship.
For an unconventional airship configuration, it is difficult to determine the exact planform and the wetted surface areas of the envelope. However, it can be approximated by an equivalent shape of the ellipsoid. The planform and the wetted surface areas of the envelope are estimated analytically.
In this study, the body of the hybrid airship is designed as a tri-lobed shape with a specific camber to improve its aerodynamic performance(Reference Carichner and Nicolai15). The estimation of volume of the envelope of the tri-lobed airship configuration is a non-trivial task. Assuming each lobe to be an ellipsoid shape, the tri-lobe shape can be considered a combination of three conventional single-lobed bodies, with some overlap between them, depending on the geometrical parameters. An analytical method was developed to estimate the volume of the tri-lobed envelope.
3.1.1 Generator of envelope shape
The longitudinal section of the hull for both conventional and multi-lobed airships was derived by the method described by Gertler (1950)(Reference Gertler33,Reference Landweber and Gertler34) . Based on Gertler’s method, a shape generation algorithm known as Gertler Series 58 Shape Generator was developed. The stated algorithm was developed on the basis of a six-degree polynomial equation, as stated in Equation (5):
 \begin{equation}y^2(x) = \sum_{n=1}^{6}a_{n}x^n,\end{equation}
where x and y are the longitudinal and vertical co-ordinates of the generatrix profile of the body, respectively.
In the expanded form, Equation (5) can be written as
 \begin{equation}y^2(x) = a_{1}x+a_{2}x^2+a_{3}x^3+a_{4}x^4+a_{5}x^5+a_{6}x^6\end{equation}
The coefficients
 $a_{1}, a_{2}, a_{3},..., a_{6}$
are determined in terms of the geometrical parameters, that is,
$a_{1}, a_{2}, a_{3},..., a_{6}$
are determined in terms of the geometrical parameters, that is,
 $X_{m}$
(distance of the maximum diameter from the nose),
$X_{m}$
(distance of the maximum diameter from the nose),
 $R_{0}$
(radius of curvature at the nose),
$R_{0}$
(radius of curvature at the nose),
 $R_{1}$
(radius of curvature at the tail) and
$R_{1}$
(radius of curvature at the tail) and
 $C_{p}$
(prismatic coefficient) with the following constraints. The constraints are
$C_{p}$
(prismatic coefficient) with the following constraints. The constraints are
 $y=0$
when
$y=0$
when
 $x=1$
,
$x=1$
,
 $y=1/2$
when
$y=1/2$
when
 $x=X_m$
and
$x=X_m$
and
 $dy/dx=0$
when
$dy/dx=0$
when
 $x=X_m$
.
$x=X_m$
.
In the non-dimensional form, Equation (6) can be rewritten as
 \begin{equation}\eta^2 = a_{1}\xi+a_{2}\xi^2+a_{3}\xi^3+a_{4}\xi^4+a_{5}\xi^5+a_{6}\xi^6,\end{equation}
where
 $\eta=x/\textit{l}$
and
$\eta=x/\textit{l}$
and
 $\xi=y/d$
, in which l is the length of the hull and d is the maximum diameter.
$\xi=y/d$
, in which l is the length of the hull and d is the maximum diameter.
From the standard shapes of the airship, the shape of the envelope for the conventional airship is fixed to be the National Physics Laboratory (NPL) shape developed by the NPL(Reference Khoury10), as shown in Fig. 7.
The NPL shape has a low-drag profile and is basically a combination of two half prolate spheroids joined at the location of the maximum diameter(Reference Alam and Pant35). The maximum diameter (d) of an airship is calculated from the length using the fineness ratio (l/d), taken as 4 in this study. For the tri-lobed configuration, each of the three lobes is assumed to have the same shape as the conventional airship.
Geometrical parameters such as
 $X_{m}$
(distance of the maximum diameter from the nose),
$X_{m}$
(distance of the maximum diameter from the nose),
 $R_{0}$
(radius of curvature at the nose),
$R_{0}$
(radius of curvature at the nose),
 $R_{1}$
(radius of curvature at the tail) and
$R_{1}$
(radius of curvature at the tail) and
 $C_{p}$
(prismatic coefficient) for any standard shapes of the airship with the body-of-revolution can be obtained using Gertler’s method(Reference Alam and Pant7,Reference Alam and Pant36) . The design parameters for the NPL shape were derived from the shape generation algorithm, listed in Table 2
(Reference Alam and Pant35).
$C_{p}$
(prismatic coefficient) for any standard shapes of the airship with the body-of-revolution can be obtained using Gertler’s method(Reference Alam and Pant7,Reference Alam and Pant36) . The design parameters for the NPL shape were derived from the shape generation algorithm, listed in Table 2
(Reference Alam and Pant35).
Geometrical parameters for the standard NPL shape

An NPL geometry.

3.2 Aerodynamic module
The drag force acting on an airship has a significant effect on its performance, power required and dynamics. Hence, an accurate method is necessary for evaluating the drag. Although, it may be evaluated experimentally or using a sophisticated CFD analysis, computationally it is very expensive. For an airship, the envelope comprises the largest part of the drag. Of that, skin friction drag is the major drag component and is basically a function of the surface area. The zero-lift drag coefficient of the envelope increases with the increase in the wetted surface area for a given volume. In the initial design phase, to estimate the drag of the hull without any computationally expensive methods, a simple analytical/or empirical formula needs to be applied.
In the past, several studies focussed on understanding the effect of geometry over the drag force and derived the empirical relations based on experimental data to calculate the friction drag of various bodies of revolution. Young(Reference Young37) developed a method to estimate the total and the skin friction drags of the bodies of revolution at zero incidence based on the approach used to calculate the profile drag of aerofoils using the thickness ratio (d/l), which is the reciprocal of the fineness ratio (l/d), and also investigated the effect of Reynolds number (Re) on the drag coefficient. The interesting findings of Young’s study are that the ratio of form drag to total drag is approximately 0.4 d/l (where d is the length of the maximum diameter of the body of revolution), given the volume and transition point position the fineness ratio for which the drag is at least about 5:1, and given the frontal area and transition point position the fineness ratio for which the drag is at least about 3:1.
Hoerner(Reference Hoerner38) derived an empirical relation based on experimental data and the theory to estimate the volumetric drag coefficient of streamlined bodies using the fineness ratio (l/d) and the Reynolds number in a turbulent flow at zero angle-of-attack. Several studies(Reference Nicolosi, Della Vecchia, Ciliberti and Cusati39,Reference Kruger, Huyssen, Smith and Meyer40,Reference Jalasabri, Romli and Harmin41) have demonstrated the impact of the fineness ratio on the aerodynamic characteristics of the vehicle body.
In the conceptual design phase of a conventional airship, the studies used Hoerner’s empirical formula to estimate the zero-lift drag coefficient of its envelope. However, this empirical relation is insensitive to capture the effect of profile contour(Reference Alam and Pant42). The zero-lift drag coefficient of the airship envelope is typically estimated employing Hoerner’s equation expressed as
 \begin{equation}C_{dv}=C_f\bigg(4(l/d)^{0.3}+6(d/l)^{1.2}+24(d/l)^{2.7}\bigg)\end{equation}
For the friction coefficient (
 $C_f$
), Hoerner suggested the formula presented in Equation (9), which is only dependent on the Reynolds number.
$C_f$
), Hoerner suggested the formula presented in Equation (9), which is only dependent on the Reynolds number.
 \begin{equation}C_f=\frac{0.045}{\mathrm{Re}^{1/6}}\end{equation}
Combining Equations (8) and (9),
 $C_{dv}$
can be rewritten as
$C_{dv}$
can be rewritten as
 \begin{equation}C_{dv}=\frac{0.18(l/d)^{0.3}+0.27(l/d)^{-1.2}+1.08(l/d)^{-2.7}}{\mathrm{Re}^{1/6}}\end{equation}
To enhance the accuracy of Hoerner’s formula, which is insensitive to the change in shape of the envelope, Alam and Pant(Reference Alam and Pant42) modified the empirical relation to capture the variation in the drag more accurately by introducing a modification factor
 $k_{mod}$
that results in Equation (11):
$k_{mod}$
that results in Equation (11):
 \begin{equation}C_{dv}=\frac{0.18(l/d)^{0.3}+0.27(l/d)^{-1.2}+1.08(l/d)^{-2.7}}{(k_{mod}\mathrm{Re})^{1/6}},\end{equation}
where
 $k_{mod}$
is taken as 1.97 and limited to the two-dimensional body of revolution for stratospheric applications. The value of
$k_{mod}$
is taken as 1.97 and limited to the two-dimensional body of revolution for stratospheric applications. The value of
 $k_{mod}$
was derived on the basis of the CFD data obtained from various shapes of the envelope for a typical Reynolds number of
$k_{mod}$
was derived on the basis of the CFD data obtained from various shapes of the envelope for a typical Reynolds number of
 $37.6 \times 10^6$
. For other Reynolds numbers, the
$37.6 \times 10^6$
. For other Reynolds numbers, the
 $k_{mod}$
value may vary and needs to be examined with the CFD data. The modified Hoerner’s equation is accurate enough to estimate the drag coefficient of standard shapes of the airship within an error of approximately
$k_{mod}$
value may vary and needs to be examined with the CFD data. The modified Hoerner’s equation is accurate enough to estimate the drag coefficient of standard shapes of the airship within an error of approximately
 $\pm 2\%$
to the CFD results. A similar approach can be used to obtain the volumetric drag co-efficient of the conventional airship of any shape without much computational cost.
$\pm 2\%$
to the CFD results. A similar approach can be used to obtain the volumetric drag co-efficient of the conventional airship of any shape without much computational cost.
Table 3 presents a comparison of the drag coefficient for a double ellipsoid shape of the envelope similar to the NPL shape obtained from the CFD (
 $C_{d,cfd}$
) with Hoerner’s equation (
$C_{d,cfd}$
) with Hoerner’s equation (
 $C_{d,h})$
.
$C_{d,h})$
.
Drag data comparison

A comparison of drag coefficient of the multi-lobed airship(Reference CarriÓn, Steijl, Barakos and Stewart43)

From the comparison of the data presented in Table 3, it is evident that Hoerner’s empirical relation is good enough to estimate the skin friction drag of the envelope of the airship with standard shapes in the primary design phase. In this study, the volumetric drag coefficient of the bare hull of the conventional airship was estimated using Hoerner’s equation.
It is difficult to estimate the aerodynamic characteristics of the lifting body hybrid airship without carrying out the experiments in a wind tunnel and/or an analysis of the Computational Fluid Dynamics (CFD). There is a dearth of experimental aerodynamic data available publicly for two- or three-lobed lifting body hybrid airships. Brandon(Reference Buerge27) assumed that the skin friction drag of the hull of a lifting body hybrid airship is 1.5 times the value of the single-lobe conventional airship. Similarly, a CFD study on the complete configuration of a hybrid air vehicle with a shape similar to the Airlander 50 airship of hybrid air vehicles reported by CarriÓn(Reference CarriÓn, Steijl, Barakos and Stewart43) shows that the volumetric drag coefficient of the bare hull obtained from the CFD is 1.44 times the value calculated using Hoerner’s equation by assuming the multi-lobed body equivalent to an ellipsoid. Table 4 presents the difference in the value of volumetric drag coefficient of the bare hull (without including fins, strakes and leading edge root extensions) between the CFD data (based on the vehicle’s volume to the 2/3 power) and Hoerner’s equation.
In this study, the zero-lift drag coefficient for the multi-lobed hull has been taken as 1.5 times the value of the equivalent body (i.e. ellipsoid with the same volume and the frontal area as the multi-lobed hull).To obtain the accurate value of
 $\mathrm{C}_d$
of the multi-lobed hull, numerical computation methods are essential.
$\mathrm{C}_d$
of the multi-lobed hull, numerical computation methods are essential.
For a conventional airship, d is the maximum diameter of the envelope. It is difficult to define
 $(l/d)$
for unconventional airship configurations. In this study, the reference diameter has been chosen as a circle with the same area as the cross-section of the envelope at the mid-length, that is, equivalent diameter,
$(l/d)$
for unconventional airship configurations. In this study, the reference diameter has been chosen as a circle with the same area as the cross-section of the envelope at the mid-length, that is, equivalent diameter,
 $d_e$
(Fig. 8), as suggested by Carichner and Nicolai(Reference Carichner and Nicolai15). To calculate the zero-lift drag coefficient of the multi-lobed envelope using Hoerner’s equation, the equivalent ellipsoid with the same volume and the frontal area can be used to approximate the aerodynamic characteristics.
$d_e$
(Fig. 8), as suggested by Carichner and Nicolai(Reference Carichner and Nicolai15). To calculate the zero-lift drag coefficient of the multi-lobed envelope using Hoerner’s equation, the equivalent ellipsoid with the same volume and the frontal area can be used to approximate the aerodynamic characteristics.
Equivalent ellipsoid to a tri-lobed envelope with the same volume.

As suggested by Liang et al.(Reference Liang, Zhu, Guo and Zheng44), the envelope volumetric drag coefficient is doubled to account for the effect of the addition of various appendages on it for both the conventional and the multi-lobed configurations.
3.2.1 Drag due to lift
The lift of the hybrid airship includes the static lift from the buoyant force, dynamic lift from the wing or aerodynamically shaped lifting body, and the static lift from the thrust-vectored propulsion systems as shown in Fig. 9.
Sources of lift for the hybrid airship.

The total lift of a hybrid airship can be expressed as
 \begin{equation}L_{total}=L_{buoyant}+L_{aero}+L_{vectored}\end{equation}
Lift is an important factor that helps to establish how much heaviness can be offset effectively by means of aerodynamic lift in sizing an airship. The heaviness (
 $W_H$
) of an airship directly affects its payload capacity, and ballast requirement and can be measured by a term, that is, Buoyancy Ratio (BR), defined as the ratio of buoyant lift to the gross weight of the airship (
$W_H$
) of an airship directly affects its payload capacity, and ballast requirement and can be measured by a term, that is, Buoyancy Ratio (BR), defined as the ratio of buoyant lift to the gross weight of the airship (
 $W_g$
). The heaviness and the BR can be related through
$W_g$
). The heaviness and the BR can be related through
 \begin{equation}W_H=W_g(1-BR)\end{equation}
A multi-lobed hybrid airship provides much more aerodynamic lift than a conventional airship. Aerodynamic lift plays an important role in the design process of an airship for missions with a longer range and heavy cargo transportation. Modulation of the aerodynamic lift affects the heaviness of an airship. However, for airship designed for a long endurance mission, aerodynamic lift is not so important, and its effect is very small compared with other missions. Compared with unconventional airships, airships with a body of revolution generate less drag due to lift since they do not generate large amount of aerodynamic lift(Reference Carichner and Nicolai15).
In addition to the drag due to envelope, a multi-lobed airship generates a part of its drag from dynamic lift. The drag polar of an airship may be approximated by the simple quadratic form
 \begin{equation}C_D=C_{d0}+KC_{L}^2,\end{equation}
where K is the drag-due-to-lift factor (referred to the planform area) that depends on the Aspect Ratio (AR), which is expressed as(Reference Carichner and Nicolai15)
 \begin{equation}K=-0.0145\left(\frac{1}{AR}\right)^4+0.182\left(\frac{1}{AR}\right)^3-0.514\left(\frac{1}{AR}\right)^2+0.838\left(\frac{1}{AR}\right)-0.053\end{equation}
Figure 10 shows the determination of K obtained from the experimental aerodynamic data of the airships as a function of AR.
Determination of K as a function of AR.

Referring to the volume of the envelope, K can be expressed as
 \begin{equation}K(vol^{2/3})=\frac{K}{N_L}\end{equation}
 $N_L$
is a factor that depends upon the number of lobes of the envelope, and it can be expressed as(Reference Nicolai and Carichner45),
$N_L$
is a factor that depends upon the number of lobes of the envelope, and it can be expressed as(Reference Nicolai and Carichner45),
 \begin{equation}N_L=\frac{S_{plan}}{(Vol)^{2/3}}\end{equation}
For airships, the AR can be evaluated from the width of the envelope
 $(W_{hull})$
and the planform area
$(W_{hull})$
and the planform area
 $(S_{plan})$
as
$(S_{plan})$
as
 \begin{equation}AR=\frac{W_{hull}^2}{S_{plan}}\end{equation}
The lift coefficient can be computed referring to the volume of the envelope using the following expression:
 \begin{equation}C_L=C_{L\alpha}\alpha_{aoa}\left(\frac{S_{plan}}{Vol^{2/3}}\right)\end{equation}
From the study(Reference Nicolai and Carichner45), the lift-curve slope in the radians is evaluated as
 \begin{equation}C_{L\alpha}=\frac{dC_L}{d\alpha_{aoa}}=\left(\frac{2\pi AR}{2+\sqrt {4+AR^2}}\right)\end{equation}
Figure 11 shows the lift-curve slope of the airships with a body of revolution (BOR) with/or without tails and hybrid airships. All the values of
 $C_{L\alpha}$
are referenced to
$C_{L\alpha}$
are referenced to
 $S_{plan}$
, so that all the coefficients are referenced to the same reference area. The lift-curve slope of a conventional and the tri-lobed airship is calculated using Equation (20).
$S_{plan}$
, so that all the coefficients are referenced to the same reference area. The lift-curve slope of a conventional and the tri-lobed airship is calculated using Equation (20).
Lift-curve slope of the airships.

From the study(Reference Nicolai and Carichner45), it is observed that a conventional airship without tails becomes a poor lifting body compared with the multi-lobed hybrid airship configurations. Although airships with a body of revolution and tails have many advantages over the unconventionally shaped, hybrid airships, the latter have better aerodynamic performance and payload capacity, making them superior in cargo transportation. The comparison shows that the data from the empirical relation (Equation (20)) for hybrid airships (viz., P-791, HA-1 and Aerocraft) are in good agreement with the experimental data.
3.3 Environment module
In this section, the effect of the ambient condition on the sizing of the airship and the model used to evaluate the atmospheric properties at the operating altitude and wind speed is described in detail.
3.3.1 Atmospheric model
Environmental factors such as temperature, density, pressure, wind speed and solar intensity significantly influence the performance, design and capabilities of long endurance airships(Reference Colozza and Dolce46). Atmospheric density is one of the major factors that affect the lifting capability of stratospheric airships during station-keeping at altitude. It is assumed that the density changes with the variation in the altitude according to the Standard Atmosphere Model (ISA). At near space (around 20km of altitude), the air density is about (1/15) of its sea-level value. Atmospheric density can be expressed as a function of altitude using a third-order polynomial over an altitude range of 0–20km with a maximum error of 2.3% at altitudes greater than 20km. The altitude is normalised to obtain better numerical accuracy. The polynomial expression used for fitting the relative data is expressed as(Reference Guo and Zhu47)
 \begin{equation}\rho(h)=\rho(h_0)\left[c_0+c_1(h/d_c)+c_2(h/d_c)^2+c_3(h/d_c)^3\right]\end{equation}
where
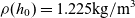 $\rho(h_0) = 1.225\mathrm{kg/m}^3$
and
$\rho(h_0) = 1.225\mathrm{kg/m}^3$
and
 $d_c$
is a dimensional scaling parameter, and using
$d_c$
is a dimensional scaling parameter, and using
 $d_c = 20\mathrm{km}$
,
$d_c = 20\mathrm{km}$
,
 \begin{equation*}c =\left(\begin{array}{c}c_0\\[3pt] c_1 \\[3pt] c_2\\[3pt] c_3\end{array}\right) = \left(\begin{array}{c}+0.9952 \\[3pt] -1.8356 \\[3pt] +1.1330 \\[3pt] -0.2224\end{array}\right)\end{equation*}
Figure 12 shows the variation of the atmospheric density with the change in the altitude using polynomial expression and compared with the ISA model.
Atmospheric density.

The ambient condition has significant effect on the sizing of an airship and should be considered during the design process. The temperature and pressure of the atmosphere are estimated using the standard atmosphere model at a given altitude.
3.3.2 Wind model
The Earth’s wind profile is highly dynamic in nature and changes considerably with the altitude, geographic location and day of operation. At the lower portion of the stratospheric region, generally between 18 and 25km of altitude, the intensity of winds is lower than at different altitudes. Wind velocity consists of two components, that is, steady state and time varying. It is difficult to predict the time-varying component of the wind speed encountered by an airship during its flight(Reference Mueller, Zhao and Garrard48). The Horizontal-Wind Model (HWM14), developed by the U.S. Naval Research Laboratory (NRL), was used to estimate the steady-state horizontal wind speed (which is a resultant of zonal and meridional components of wind) at a given altitude, the geographic location, the time of day and the day of operation. To design an airship with adequate power supplied to support the power requirements throughout a day, the variation of wind speed with respect to time was also taken into consideration.
Figure 13 shows the variation of wind speed with the altitude during summer and winter over Mumbai at the co-ordinates
 $72.88^{\circ}\mathrm{E}$
and
$72.88^{\circ}\mathrm{E}$
and
 $19.07^{\circ}\mathrm{N}$
. The vertical component of the wind was assumed to be negligible. Horizontal wind speed varies from location to location throughout the day, and this variation causes a significant change in the propulsive power required and, hence, the area of the solar array. To understand the effect of wind speed on the sizing of an airship, changes in the magnitude of wind speed over altitude and time need to be considered. The effect of local time over the variation of wind speed shown in Fig. 14 is not included in the present study. The effects of flight altitude, day of design and time of day were considered to capture the effect of the wind dynamics over the sizing of solar-powered long endurance high-altitude airships.
$19.07^{\circ}\mathrm{N}$
. The vertical component of the wind was assumed to be negligible. Horizontal wind speed varies from location to location throughout the day, and this variation causes a significant change in the propulsive power required and, hence, the area of the solar array. To understand the effect of wind speed on the sizing of an airship, changes in the magnitude of wind speed over altitude and time need to be considered. The effect of local time over the variation of wind speed shown in Fig. 14 is not included in the present study. The effects of flight altitude, day of design and time of day were considered to capture the effect of the wind dynamics over the sizing of solar-powered long endurance high-altitude airships.
Wind speed versus altitude.

Wind speed versus local time (h).

3.4 Energy module
The energy module has a significant effect on the sizing of HALESA and the solar array that supplies power to the payload, propulsion system and onboard avionics. To fly at stratospheric altitudes for a long duration, the only viable source of energy is solar energy. It is a known fact that solar energy depends on the altitude, operating location, time of operation and day of operation. In this study, we used a simple model which includes the estimation of direct solar radiation, reflected radiation and diffused radiation, developed by Dai and Fang(Reference Dai and Fang49), to predict the solar irradiation under clear sky conditions. Figure 15 shows the thermal environment of the stratospheric airship.
Thermal environment.

The solar array model has been developed using an elemental approach to estimate the size and the layout of the solar array over the surface of the airship based on the study(Reference Alam and Pant36,Reference Liang, Zhu, Guo and Zheng44) . The array is divided into
 $m\times n$
rectangular grids as shown in Fig. 16. To find the amount of energy generated by the solar array, the angle of incidence, which the sun rays make with each element of the array, must be determined and then integrated over the surface to yield the total power supplied.
$m\times n$
rectangular grids as shown in Fig. 16. To find the amount of energy generated by the solar array, the angle of incidence, which the sun rays make with each element of the array, must be determined and then integrated over the surface to yield the total power supplied.
A schematic of solar array.

The angle of incidence between the solar radiation and the normal to each element of the solar array is given as
 \begin{equation}\theta=\cos^{-1}(\hat{n}_{surface},-\hat{N}_{sun})\end{equation}
For any element, the length (
 $\bar{dl}$
) and the breadth (
$\bar{dl}$
) and the breadth (
 $\bar{db}$
) are expressed in terms of the calculated position vector (
$\bar{db}$
) are expressed in terms of the calculated position vector (
 $\bar{r}_{ij}$
).
$\bar{r}_{ij}$
).
 \begin{eqnarray*}\bar{dl}&=&\bar{r}_{i,j+1}-\bar{r}_{ij}\\[3pt]\bar{db}&=&\bar{r}_{i+1,j}-\bar{r}_{ij}\end{eqnarray*}
Assuming each grid of an array to be a flat plate, the normal vector (
 $\hat{n}_{surface}$
) of any grid is obtained considering the cross product as
$\hat{n}_{surface}$
) of any grid is obtained considering the cross product as
 \begin{eqnarray*}\hat{n}_{surf}&=&\hat{n}_{ij,x}\hat{i}+\hat{n}_{ij,y}\hat{j}+\hat{n}_{ij,z}\hat{k}\\[3pt] &=&\frac{\bar{dl}_{ij}\times\bar{db}_{ij}}{|\bar{dl}_{ij}||\bar{db}_{ij}|}\end{eqnarray*}
The normal vector (
 $\hat{n}_{sun}$
) of the solar radiation is
$\hat{n}_{sun}$
) of the solar radiation is
 \begin{equation}\hat{n}_{sun}=\sin\psi_{s}\cos\alpha\hat{i}+\cos\psi_{s}\cos\alpha\hat{j}+\sin\alpha\hat{k}\end{equation}
The solar radiation vector must be transformed to the axis system of the airship, providing the solar vector and the surface vector are relative to the same axis system. For this purpose, the solar radiation vector is expressed as
 \begin{equation}\hat{N}_{sun}=R\times\hat{n}_{sun}\end{equation}
where R is the transformation matrix to transform from the universal axis system to the axis system of the airship body and defined as
 \begin{equation*}R =\left(\begin{array}{c@{\quad}c@{\quad}c}c_{\theta_{b}} c_{\psi_{b}} & c_{\theta_{b}} s_{\psi_{b}} & -s_{\theta_{b}}\\[3pt]-c_{\theta_{b}} s_{\psi_{b}}+s_{\phi_{b}} s_{\theta_{b}} c_{\psi_{b}} & c_{\phi_{b}} c_{\psi_{b}}+s_{\phi_{b}} s_{\theta_{b}} s_{\psi_{b}} & s_{\phi_{b}} c_{\theta_{b}}\\[3pt]s_{\phi_{b}} s_{\psi_{b}}+c_{\phi_{b}} s_{\theta_{b}} c_{\psi_{b}} & -s_{\phi_{b}} c_{\psi_{b}}+c_{\phi_{b}} s_{\theta_{b}} s_{\psi_{b}} & c_{\phi_{b}} c_{\theta_{b}}\end{array}\right)\end{equation*}
Finally, the solar radiation vector in terms of the axis system of the airship body is expressed as
 \begin{equation*}\hat{N}_{sun}=\left(\begin{array}{c}\sin\psi_{s}\cos\alpha\cos\psi_{b}-\cos\psi_{s}\cos\alpha\sin\psi_{b}\\[3pt]\cos\psi_{s}\cos\alpha\cos\psi_{b}+\sin\psi_{s}\cos\alpha\sin\psi_{b}\\[3pt]\sin\alpha\end{array}\right)\end{equation*}
The energy generated by each element of the array at an interval of time
 $\Delta t_{k}$
can be expressed as
$\Delta t_{k}$
can be expressed as
 \begin{align} dE_{ij,k}&= \eta_{sc}I_{k}dA_{ij}\cos\theta_{ij,k}\Delta t_{k}, \ {\rm if}~\alpha\ge0,-\frac{\pi}{2}\le\theta_{ij,k}\le\frac{\pi}{2}\nonumber\\ &= 0, \ {\rm otherwise} \end{align}
where
 $I_{k}$
is the solar radiation at time k,
$I_{k}$
is the solar radiation at time k,
 $\alpha$
the solar elevation angle and
$\alpha$
the solar elevation angle and
 $\eta_{sc}$
the power generation efficiency of the solar cell.
$\eta_{sc}$
the power generation efficiency of the solar cell.
Hence, the total energy generated by the solar array can be obtained by integrating the above equation over the solar array area.
 \begin{equation}P_{sup}=\sum_{i=1}^m\sum_{j=1}^n\sum_{k=1}^p\eta_{sc}I_{k}dA_{ij}\cos\theta_{ij,k}\Delta t_{k}\end{equation}
3.5 Mass breakdown module
The empty weight of an airship includes the weight of the sub-systems, that is, structure, energy, propulsion and other subsystems. The empty and the total weights of an airship are calculated as
 \begin{eqnarray*}W_{empty} &=& W_{struct}+W_{energy}+W_{prop}+W_{misc}\\[3pt] W_{struct} &=& W_{env}+W_{tail}\\[3pt] W_{energy} &=& W_{sa}+W_{es}\\[3pt] W_{misc} &=& 0.25(W_{struct}+W_{energy}+W_{prop})\\[3pt] W_{total} &=& W_{empty}+W_{pay}\end{eqnarray*}
The structural weight of the envelope is obtained by multiplying the wetted surface area with the areal density of the fabric and a factor that accounts for joints, doublers, load patches and envelope-attached fittings. The wetted surface area of the envelope is obtained by using an elemental approach. In the elemental approach, the envelope of the airship is discretised into rectangular grids and the summation of area of each element gives the surface area of the envelope.
 \begin{equation} W_{env}=\left(\left(1.51\rho_{fab}S_{wet}\right)+m_{sep}+m_{gas}\right)g \end{equation}
The factor of 1.51 accounts for the mass of joints, the doublers, the load patches and the envelope-attached fittings(Reference Carichner and Nicolai15).
The envelope of the hybrid airship is supported internally by load curtains known as septum. The weight of the septum is determined on the basis of the loads acting on the envelope, the fabric density and the arrangement of the septum. A good initial estimate of the weight of the septum can be calculated from the side projected area of the envelope(Reference Carichner and Nicolai15). The area of septum (
 $A_{sep}$
) is calculated as
$A_{sep}$
) is calculated as
 \begin{equation}A_{sep}=(2)(0.75)A_{side}\end{equation}
where
 $A_{side}$
is the side projected area of the envelope. Hence, the mass of the septum is calculated as follows:
$A_{side}$
is the side projected area of the envelope. Hence, the mass of the septum is calculated as follows:
 \begin{equation}m_{sep}=\rho_{fab}A_{sep}\end{equation}
The mass of the lifting gas is estimated from the density of the lifting gas and the volume of the envelope, as follows:
 \begin{eqnarray}\rho_{gas} &=& \left(\rho_a/\rho_0\right)\left(0.1692\times k+1.225(1-k)\right)\end{eqnarray}
 \begin{eqnarray}m_{gas} &=& \rho_{gas}V_{env}\end{eqnarray}
where k is the purity of the lifting gas (with the helium purity assumed to be 97%,
 $k = 0.97$
) and
$k = 0.97$
) and
 $\left(\rho_a/\rho_0\right)$
is the ratio of the density of the ambient air at a specified altitude to the density of the air at sea level.
$\left(\rho_a/\rho_0\right)$
is the ratio of the density of the ambient air at a specified altitude to the density of the air at sea level.
The tail structure of an airship includes four stabilisers with control surfaces, actuation system and other accessories. Assuming that the tails have the same areal density as the envelope, the mass of control surfaces and the other components are included by adding an extra 20% to the total mass of the tail.
 \begin{equation}m_{tail}=1.2\rho_{fab}A_{fin}\end{equation}
where
 $A_{fin}$
is the surface area of fins estimated to be 0.0121
$A_{fin}$
is the surface area of fins estimated to be 0.0121
 $V_{env}$
for each pair.
$V_{env}$
for each pair.
The propulsion system consists of electric motors, propellers, transmission system and thrust vectoring system. The mass of the propulsion unit is estimated as
 \begin{equation}m_{prop}=P_{thrust}/w_{prop}\end{equation}
where
 $w_{prop}$
is the power density of the propulsion system and assumed to be 440
$w_{prop}$
is the power density of the propulsion system and assumed to be 440
 ${\rm W/kg}$
(Reference Carichner and Nicolai15).
${\rm W/kg}$
(Reference Carichner and Nicolai15).
The mass of the energy system includes the mass of the solar array and the secondary energy storage system used for storing the excess energy generated by the solar array during the daytime.
 \begin{equation}m_{energy}=m_{array}+m_{es}\end{equation}
The mass of the array depends on the area of array, the surface density and the efficiency of the solar cell, and can be estimated as
 \begin{equation}m_{array}=\rho_{sa}A_{sa}\end{equation}
The mass of the secondary energy storage system is calculated by
 \begin{equation}m_{es}=P_{total}t_{night}/w_{es}\end{equation}
where
 $w_{es}$
is the energy density of the battery with the value 200
$w_{es}$
is the energy density of the battery with the value 200
 ${\rm Wh/kg}$
(Reference Liang, Zhu, Guo and Zheng44).
${\rm Wh/kg}$
(Reference Liang, Zhu, Guo and Zheng44).
4.0 CASE STUDY FOR HALESA DEPLOYMENT IN INDIA
To illustrate its efficacy, the methodology described above was applied to obtain the optimum configuration of a HALESA for station-keeping and relocation over four major cities in India, (i.e. Delhi, Kolkata, Chennai and Mumbai) while carrying a dedicated payload of communications. The solutions for the conventional and tri-lobed airships were obtained to enable a comparative analysis. The sub-sections that follow describe the mission and discuss the key results obtained.
4.1 Requirements of HALESA mission
The key mission requirements for the HALESA are as follows:
-
• It must be able to maintain its position over a metropolitan city for around 3 months and then relocate to another metropolitan city within a short period of time, as follows:
-
•
$31^{\rm st}$
December to
$25^{\rm th}$
March over Delhi -
•
$31^{\rm st}$
March to
$25^{\rm th}$
June over Kolkata -
•
$30^{\rm th}$
June to
$25^{\rm th}$
September over Chennai -
•
$30^{\rm th}$
September to
$25^{\rm th}$
December over Mumbai -
• It may be deployed at any altitude between 15 and 20km Above Mean Sea Level (AMSL), but it should be able to always maintain its location within a ground footprint of 5— 5km during the entire period of deployment at a specific station.
-
• The system should be able to generate adequate power to maintain the station and relocate to the next location within 5 days, without bringing it down. It should be able to cater for a continuous power consumption of 1000W by a payload weighing 100kg.
-
• All the flight operations have been assumed to be conducted in the Indian Reference Atmosphere (IRA). The variation in the magnitude and direction of the ambient wind is taken into consideration using the horizontal wind model developed by the US Naval Research Laboratory.


4.2 Baseline configuration
To design an airship that has to be operated at multiple locations, the critical day of operation (a day for which the power requirement is maximum compared with all other days of operation) of the locations has to be identified within the given range of altitude. The critical day of operation differs with the operating location, the period of operation and the range of altitude as presented in Table 5.
For each location, the critical day of operation is identified and the altitude at which the wind speed is minimum is chosen as the operating altitude. The altitude with the minimum speed for the given altitude range is taken for each location, because the optimiser always converges with that altitude. The baseline configuration is designed based on the maximum power requirement within the specified period of operation among these four metropolitan cities.
Critical day of operation

Design constants for the baseline configuration

Figure 17 represents the baseline configurations obtained using the proposed methodology to meet the operating requirements. From the defined condition, Chennai has a wind speed of 19.01m/s, which is the maximum compared with all the other three locations for the given span of operation, on a specific day (i.e.
 $30^{\rm th}$
July) at an altitude of 20km.
$30^{\rm th}$
July) at an altitude of 20km.
Geometry of the baseline configuration (Note: Fins are added to the design to represent it as an airship. Sizing of the fins is beyond the scope of this study.).

The key design constants of the baseline configuration are listed in Table 6.
A comparison of key output parameters of the baseline configuration is presented in Table 7. The results show that the conventional airship is better than the tri-lobed HALESA, except the length of the airship due to its geometry.
Output from the baseline configuration

Sensitivity of mass of the airship to the mass of payload.

For the given payload and power requirements, the tri-lobed configuration has a maximum length of 231.6m, which is 2.6% lower than that of the conventional airship. The conventional airship with a body of revolution has less surface area than the tri-lobed hybrid airship of the same volume. The multi-lobed airship requires more fabric, has greater empty weight and has greater drag, causing higher fuel consumption. The airship with three lobes separated horizontally by a half of the lobe diameter has 6% greater surface area than the single-lobed airship of the same envelope volume. The tri-lobed airship has a frontal area that is 23% greater than that of the single-lobed airship.
4.3 Analyses of sensitivity key parameters
Sensitivity analyses were carried out for both the conventional and the tri-lobed airships to investigate the effect of various key parameters on airship mass. The results have been discussed in the sub-sections that follow.
4.3.1 Effect of payload mass on the mass of airship
Figure 18 shows the variation of the mass of the airship with a change in the payload capacity. The tri-lobed airship has higher mass but is smaller in size compared with the conventional airship for the given payload. Figure 19 shows the mass distribution of the baseline solutions of the conventional and the tri-lobed airship. In both the conventional and the tri-lobed airship, half of the total mass comes from its structural mass. The mass of the energy storage system for the tri-lobed airship is higher than that of the conventional airship because of its complex shape and higher drag.
Mass distribution of the airship. (a) Conventional airship, (b) tri-lobed airship.

4.3.2 Effect of operating location on the sizing
The operating location and day of operation have significant impact on the sizing of an airship, as shown in Fig. 20. Atmospheric parameters, wind speed and solar irradiation changes with different location, altitude and day of operation have a direct bearing on the mass, volume and payload capacity of an airship. From Fig. 20, it is observed that the mass of the airship is higher for Chennai, because of the high ambient wind speed and the higher power requirement.
Variation of mass of the airship over different cities.

4.3.3 Effect of lifting gas on the mass of airship
Hydrogen is considered unsafe for airships as a source of static lift due to its combustible nature, which has resulted in several fatal accidents in the past. Despite the cost, helium is the second most efficient source of static lift and is chosen as lifting gas in this study because of its inert nature. It may be noted that the selection of lifting gas has significant impact on airship mass shown in Fig. 21. Using helium as lifting gas, the airship mass is increased by 23%.
Sensitivity of mass of the airship to the lifting gas.

4.3.4 Impact of purity of the lifting gas on the mass of airship
Figure 22 shows the effect of purity of lifting gas on the size of an airship. A 1% increase in purity level results in an average of 2.5% reduction in airship mass due to reduction in mass of lifting gas, volume of airship and surface area of the envelope. The result shows that the purity of lifting gas has a significant effect on the chosen configuration of an airship for the desired mission.
Sensitivity of mass of the airship to the purity of the lifting gas.

4.3.5 Effect of density of material on the mass of airship
The density of the surface of the envelope material has a significant effect on the weight of an airship and its payload capacity. Using lightweight material without any compromise on the structural properties or carrying capacity of the payload, the mass of an airship can be reduced significantly as shown in Fig. 23.
Sensitivity of mass of the airship to the density of the envelope material.

4.3.6 Effect of density of battery on the mass of airship
The major challenge in using batteries as an energy source is their low specific energy compared with conventional fossil fuels(Reference Voskuijl, Van Bogaert and Rao50). At present, the batteries available do not carry high enough specific energy to support a large fully electric aircraft. The reduction in the mass of the airship with an increase in the energy density of the battery is plotted in Fig. 24. At a low energy density of the battery, the total mass of the tri-lobed airship is approximately 50% higher than that of the conventional airship. The mass of the tri-lobed airship is 18% higher than that of the conventional airship and is reduced by
 $\sim32\%$
at a high specific energy.
$\sim32\%$
at a high specific energy.
Sensitivity of mass of the airship to the density of battery.

Sensitivity of mass of airship to the power required by the payload.

Sensitivity of airship mass to the efficiency of solar cell.

4.3.7 Effect of power required by payload on the mass of airship
The rise in power required by the payload increases the area of the solar array to generate more power and, in turn, increases the weight of the airship and reduces its payload capacity. Curved solar panels are less efficient than flat panels. The shape of the axisymmetric envelope results in a curved upper surface on conventional airships, leading to a larger size of the solar array. The tri-lobed configurations provide a better solution and have a relatively flatter upper surface, which allows the mounting of efficient solar panels. However, the drag of the tri-lobed airship is greater compared with the conventional airship because of its complex shape and aerodynamic characteristics. Hence, the area and mass of the solar array are greater for the tri-lobed airship.
4.3.8 Impact of solar cell efficiency on the mass of airship
The efficiency of the solar cell increases significantly using the tri-lobed airship for the given payload and the power requirement. At present, a widely used monocrystalline silicon solar cell has the highest conversion efficiency of 26.7% out of all the commercial PV technologies. Figure 26 shows the sensitivity of the airship mass with the change in the efficiency of the solar cell.
5.0 CONCLUSIONS
-
• This study aims to systematically compare axisymmetric and multi-lobed envelope shapes for a solar-powered HALESA airship.
-
• A detailed methodology for conceptual sizing of a HALESA with two types of envelopes (axisymmetric and tri-lobed) is presented, including a detailed mass breakdown.
-
• The proposed methodology is multi-disciplinary in nature and takes into consideration the effect of parameters related to geometry, aerodynamics, environment and energy.
-
• The methodology is coupled to an optimisation algorithm to obtain the envelope configuration that corresponds to the minimum all-up mass, for operation over four metropolitan cities in India, while meeting some user-specified requirements, including the mass and power consumption of a payload.
-
• Sensitivity analysis reveals that the envelope size is strongly affected by the environmental conditions prevalent at the deployment location, especially the magnitude of the ambient wind.
-
• The HALESA with a tri-lobed envelope is seen to have a higher heaviness fraction, larger surface-to-volume ratio, flatter upper surface and a slightly lower length. However, the HALESA with a single-lobed envelope has lower envelope volume, surface area, solar array area and drag.
-
• HALESA with a tri-lobed envelope has a flatter curvature and lower lateral area, resulting in higher solar cell efficiency and better cross-wind handling. But the HALESA with single lobed envelope is smaller, lighter and meets the mission requirements better.


 Open access