


INTRODUCTION
For the time range younger than ∼50 ka BP, radiocarbon (14C) ages derived from planktonic foraminifera tests represent the most important toolbox for absolute dating of marine sediment cores (e.g. Skinner and Bard Reference Skinner and Bard2022). Known uncertainties and limitations of this method include bioturbation, atmospheric 14C changes, selective test dissolution or poorly constrained reservoir ages (Löwemark and Schäfer Reference Löwemark and Schäfer2003; Ascough et al. Reference Ascough, Cook and Dugmore2009; Mekik Reference Mekik2014; Stern and Lisiecki Reference Stern and Lisiecki2014; Ezat et al. Reference Ezat, Rasmussen, Thornalley, Olsen, Skinner, Hönisch and Groeneveld2017; Küssner et al. Reference Küssner, Sarnthein, Lamy and Tiedemann2018). It is often unclear to what extent these processes account for the significant differences observed in the 14C ages of coexisting planktonic foraminifera (Andree et al. Reference Andree, Beer, Oeschger, Broecker, Mix, Ragano, O’Hara, Bonani, Hofmann and Morenzoni1984; Broecker et al. Reference Broecker, Mix, Andree and Oeschger1984; Peng and Broecker Reference Peng and Broecker1984; Bard et al. Reference Bard, Arnold, Duprat, Moyes and Duplessy1987; Manighetti and McCave Reference Manighetti and McCave1995; Löwemark and Grootes Reference Löwemark and Grootes2004; Broecker et al. Reference Broecker, Barker, Clark, Hajdas and Bonani2006; Barker et al. Reference Barker, Broecker, Clark and Hajdas2007; Lindsay et al. Reference Lindsay, Lehman, Marchitto and Ortiz2015; Mekik Reference Mekik2014; Wycech et al. Reference Wycech, Kelly and Marcott2016; Ausin et al. Reference Ausin, Haghipour, Wacker, Voelker, Hodell, Magill, Looser, Bernasconi and Eglinton2019). Such offsets imply that 14C ages of planktonic foraminifera derived from marine sediment cores might not always faithfully reflect the depositional age of the surrounding sediment material (Mollenhauer et al. Reference Mollenhauer, Kienast, Lamy, Meggers, Schneider, Hayes and Eglinton2005; Ausin et al. Reference Ausin, Haghipour, Wacker, Voelker, Hodell, Magill, Looser, Bernasconi and Eglinton2019). Considering the fundamental role of a robust age model for any paleoceanographic interpretation, it is important to better understand the significance and drivers of planktonic foraminiferal inter-species 14C age offsets. However, so far, only few studies have addressed this topic in a systematic way—possibly a consequence of the high cost of high-quality accelerator mass spectrometry (AMS) analyses, scarce foraminiferal abundances in sediments (putting severe restrictions on the AMS measurements technique) and the difficulty to parse out various processes driving inter-species 14C age offsets.
The 14C age difference between co-occurring benthic (bottom-calcifying) and planktonic (surface-calcifying) foraminifera is a well-established proxy for deep ocean ventilation, which builds on the realization that they faithfully reflect the 14C signature of the water mass they grew in (Rafter et al. Reference Rafter, Gray, Hines, Burke, Costa, Gottschalk, Hain, Rae, Southon and Walczak2022). This proxy follows the rationale that deep-water masses acquire an older 14C signature than the surface ocean, which is in constant exchange with the atmosphere (Peng and Broecker Reference Peng and Broecker1984; Thornalley et al. Reference Thornalley, Barker, Broecker, Elderfield and McCave2011; Cook and Keigwin Reference Cook and Keigwin2015). All else constant, a similar difference in 14C signature can be expected from coexisting surface- and thermocline-calcifying foraminifera as the natural 14C content (Δ14C) of dissolved inorganic carbon (DIC) decreases markedly below the seasonal thermocline given the influence of 14C-depleted sub-surface waters. Thus, in stratified ocean areas, distal to regions of upwelling or subsurface water formation, foraminifera calcifying in the deep thermocline such as Globorotalia crassaformis and Globorotalia truncatulinoides should accordingly show older 14C ages than shallower, mixed-layer species such as Globigerinoides ruber and Trilobatus sacculifer (Fairbanks et al. Reference Fairbanks, Wiebe and Bé1980; Fairbanks et al. Reference Fairbanks, Sverdlove, Free, Wiebe and Bé1982; Schmuker and Schiebel Reference Schmuker and Schiebel2002; Cleroux et al. Reference Cleroux, Cortijo, Duplessy and Zahn2007; Regenberg et al. Reference Regenberg, Steph, Nürnberg, Tiedemann and Garbe-Schönberg2009; Cleroux and Lynch-Stieglitz Reference Cleroux and Lynch-Stieglitz2010; Schiebel and Hemleben Reference Schiebel and Hemleben2017).
Here we aim to estimate the depth gradients in 14C among five coexisting planktonic foraminifera species that calcify in different water depths between mixed layer and deep thermocline for three time slices in the past. We further investigate the extent to which these potential gradients can be explained by past water column 14C gradients. Changes in water column 14C gradients are expected for times of thermocline shifts. For instance, thermocline deepening in the low latitudes of the Atlantic Ocean is documented by high Mg/Ca paleo-temperatures reconstructed from thermocline-calcifying foraminifera during high-latitude cold events in the past, such as Heinrich Stadial 1 (HS1), and to a weaker extent during the last glacial maximum (LGM; Chiessi et al. Reference Chiessi, Mulitza, Paul, Pätzold, Groeneveld and Wefer2008; Lopes dos Santos et al. Reference Lopes dos Santos, Prange, Castañeda, Schefuß, Mulitza, Schulz, Niedermeyer, Sinninghe Damsté and Schouten2010; Bahr et al. Reference Bahr, Nürnberg, Schönfeld and Garbe-Schönberg2011; Schmidt et al. Reference Schmidt, Chang, Hertzberg, Them, Ji and Otto-Bliesner2012; Bahr et al. Reference Bahr, Nürnberg, Karas and Grützner2013a; Nürnberg et al. Reference Nürnberg, Böschen, Doering, Mollier-Vogel, Raddatz and Schneider2015; Reißig et al. Reference Reißig, Nürnberg, Bahr, Poggemann and Hoffmann2019). We hypothesize that 14C age offsets between mixed-layer and thermocline-calcifying foraminifera varied with these changes in upper ocean configuration, with a weaker stratification leading to a smaller 14C age offset between coexisting planktonic foraminifera. Our analyses also help to estimate age uncertainties potentially introduced by the choice of planktonic foraminiferal species selected for 14C age dating.
For this study, we have chosen two well-studied high-sedimentation study sites: sediment core KNR166-2-26JPC from Florida Straits and VM12-107 from the Caribbean Sea. In order to examine past geochemical variations of the water column at our study sites, we investigated 14C ages and δ18O of coexisting planktonic foraminifera during time slices that are characteristic for different states of ocean hydrography at both sites: the LGM, representative of a glacial background state (∼19–24 ka before present, BP), HS1 characterized by strong heat accumulation and weak upper ocean stratification in the low latitudes (∼15–17 ka BP, references for weaker upper ocean stratification), and the late Holocene as a reference for present-day interglacial conditions (samples from ∼1 ka BP).
STUDY AREA, METHODS, AND MATERIAL
Selection of Study Sites
We studied sediment cores VM12-107 (11°19.8’N, 66°37.8’W; 1,079 m) from Bonaire Basin in the Eastern Caribbean Sea (Schmidt et al. Reference Schmidt, Chang, Hertzberg, Them, Ji and Otto-Bliesner2012) and KNR166-2-26JPC (24°19.6’N, 83°15.1’W; 546 m) from the Florida Straits (Schmidt and Lynch-Stieglitz Reference Schmidt and Lynch-Stieglitz2011; Lynch-Stieglitz et al. Reference Lynch-Stieglitz, Schmidt, Henry, Curry, Skinner, Mulitza, Zhang and Chang2014; Figure 1). Both sites host a high number of foraminifera tests that are characterized by a high level of preservation and that are sufficient for the sample demands of 14C dating with an AMS equipped with gas ion source such as the mini-carbon dating system (MICADAS). Further, both have a moderate-to-high diversity of shallow and deep-calcifying planktonic foraminifera species, exhibit high sedimentation rates around or in excess of 10 cm/kyr and are sensitive to oceanographic changes (in particular upper-ocean stratification) during the late Pleistocene (Schmidt et al. Reference Schmidt, Chang, Hertzberg, Them, Ji and Otto-Bliesner2012; Lynch-Stieglitz et al. Reference Lynch-Stieglitz, Schmidt, Henry, Curry, Skinner, Mulitza, Zhang and Chang2014).
Location of our study cores superimposed on map of annual mean sea surface temperatures (SST; Boyer et al. Reference Boyer, Antonov, Baranova, Coleman, Garcia, Grodsky, Johnson, Locarnini, Mishonov, O'Brien, Paver, Reagan, Seidov, Smolyar and Zweng2013) in the Caribbean Sea and Florida Straits (FS) regions. Circles denote locations of our study cores KNR166-2-26JPC (abbreviated with 26JPC) and VM12-107. Crosses indicate the water column stations from Global Ocean Data Analysis Project (Olsen et al. Reference Olsen, Lange, Key, Tanhua, Álvarez, Becker, Bittig, Carter, Cotrim da Cunha and Feely2019): X1 = 29HE19920714#107, X2 = 316N19810401#15, X3 = 316N19810401#16, X4 = 316N19821201#4. Map was created using Ocean Data View (Schlitzer Reference Schlitzer2016).

The chronostratigraphies of both cores are constrained by AMS 14C dating of mixed Trilobatus sacculifer/Trilobatus trilobus and G. ruber specimens (Figure 2), and additionally by the correlation of planktonic foraminiferal δ18O and Mg/Ca-based SST with the Greenland δ18O ice-core and the Hulu speleothem record (Lynch-Stieglitz et al. Reference Lynch-Stieglitz, Schmidt and Curry2011; Schmidt and Lynch-Stieglitz Reference Schmidt and Lynch-Stieglitz2011; Lynch-Stieglitz et al. Reference Lynch-Stieglitz, Schmidt, Henry, Curry, Skinner, Mulitza, Zhang and Chang2014; Schmidt et al. Reference Schmidt, Chang, Hertzberg, Them, Ji and Otto-Bliesner2012). Average sedimentation rates for the three selected intervals are high (16–23 cm/kyr in core KNR166-2-26JPC and 9-16 cm/kyr in core VM12-107; Figure 2), hence minimizing the potential effect of bioturbation on the 14C ages of different planktonic foraminifera (Barker et al. Reference Barker, Broecker, Clark and Hajdas2007; Wycech et al. Reference Wycech, Kelly and Marcott2016).
Time-series overview at our two study sites, VM12-107 (top) and KNR166-2-26JPC, referred to as 26JPC (bottom). a, d) Planktonic foraminiferal δ18O records; b, e) sedimentation rates and c, f) age control points (Lynch-Stieglitz et al. Reference Lynch-Stieglitz, Schmidt and Curry2011, Reference Lynch-Stieglitz, Schmidt, Henry, Curry, Skinner, Mulitza, Zhang and Chang2014; Schmidt and Lynch-Stieglitz Reference Schmidt and Lynch-Stieglitz2011; Schmidt et al. Reference Schmidt, Chang, Hertzberg, Them, Ji and Otto-Bliesner2012; this study). Black arrows indicate examined time-slices.
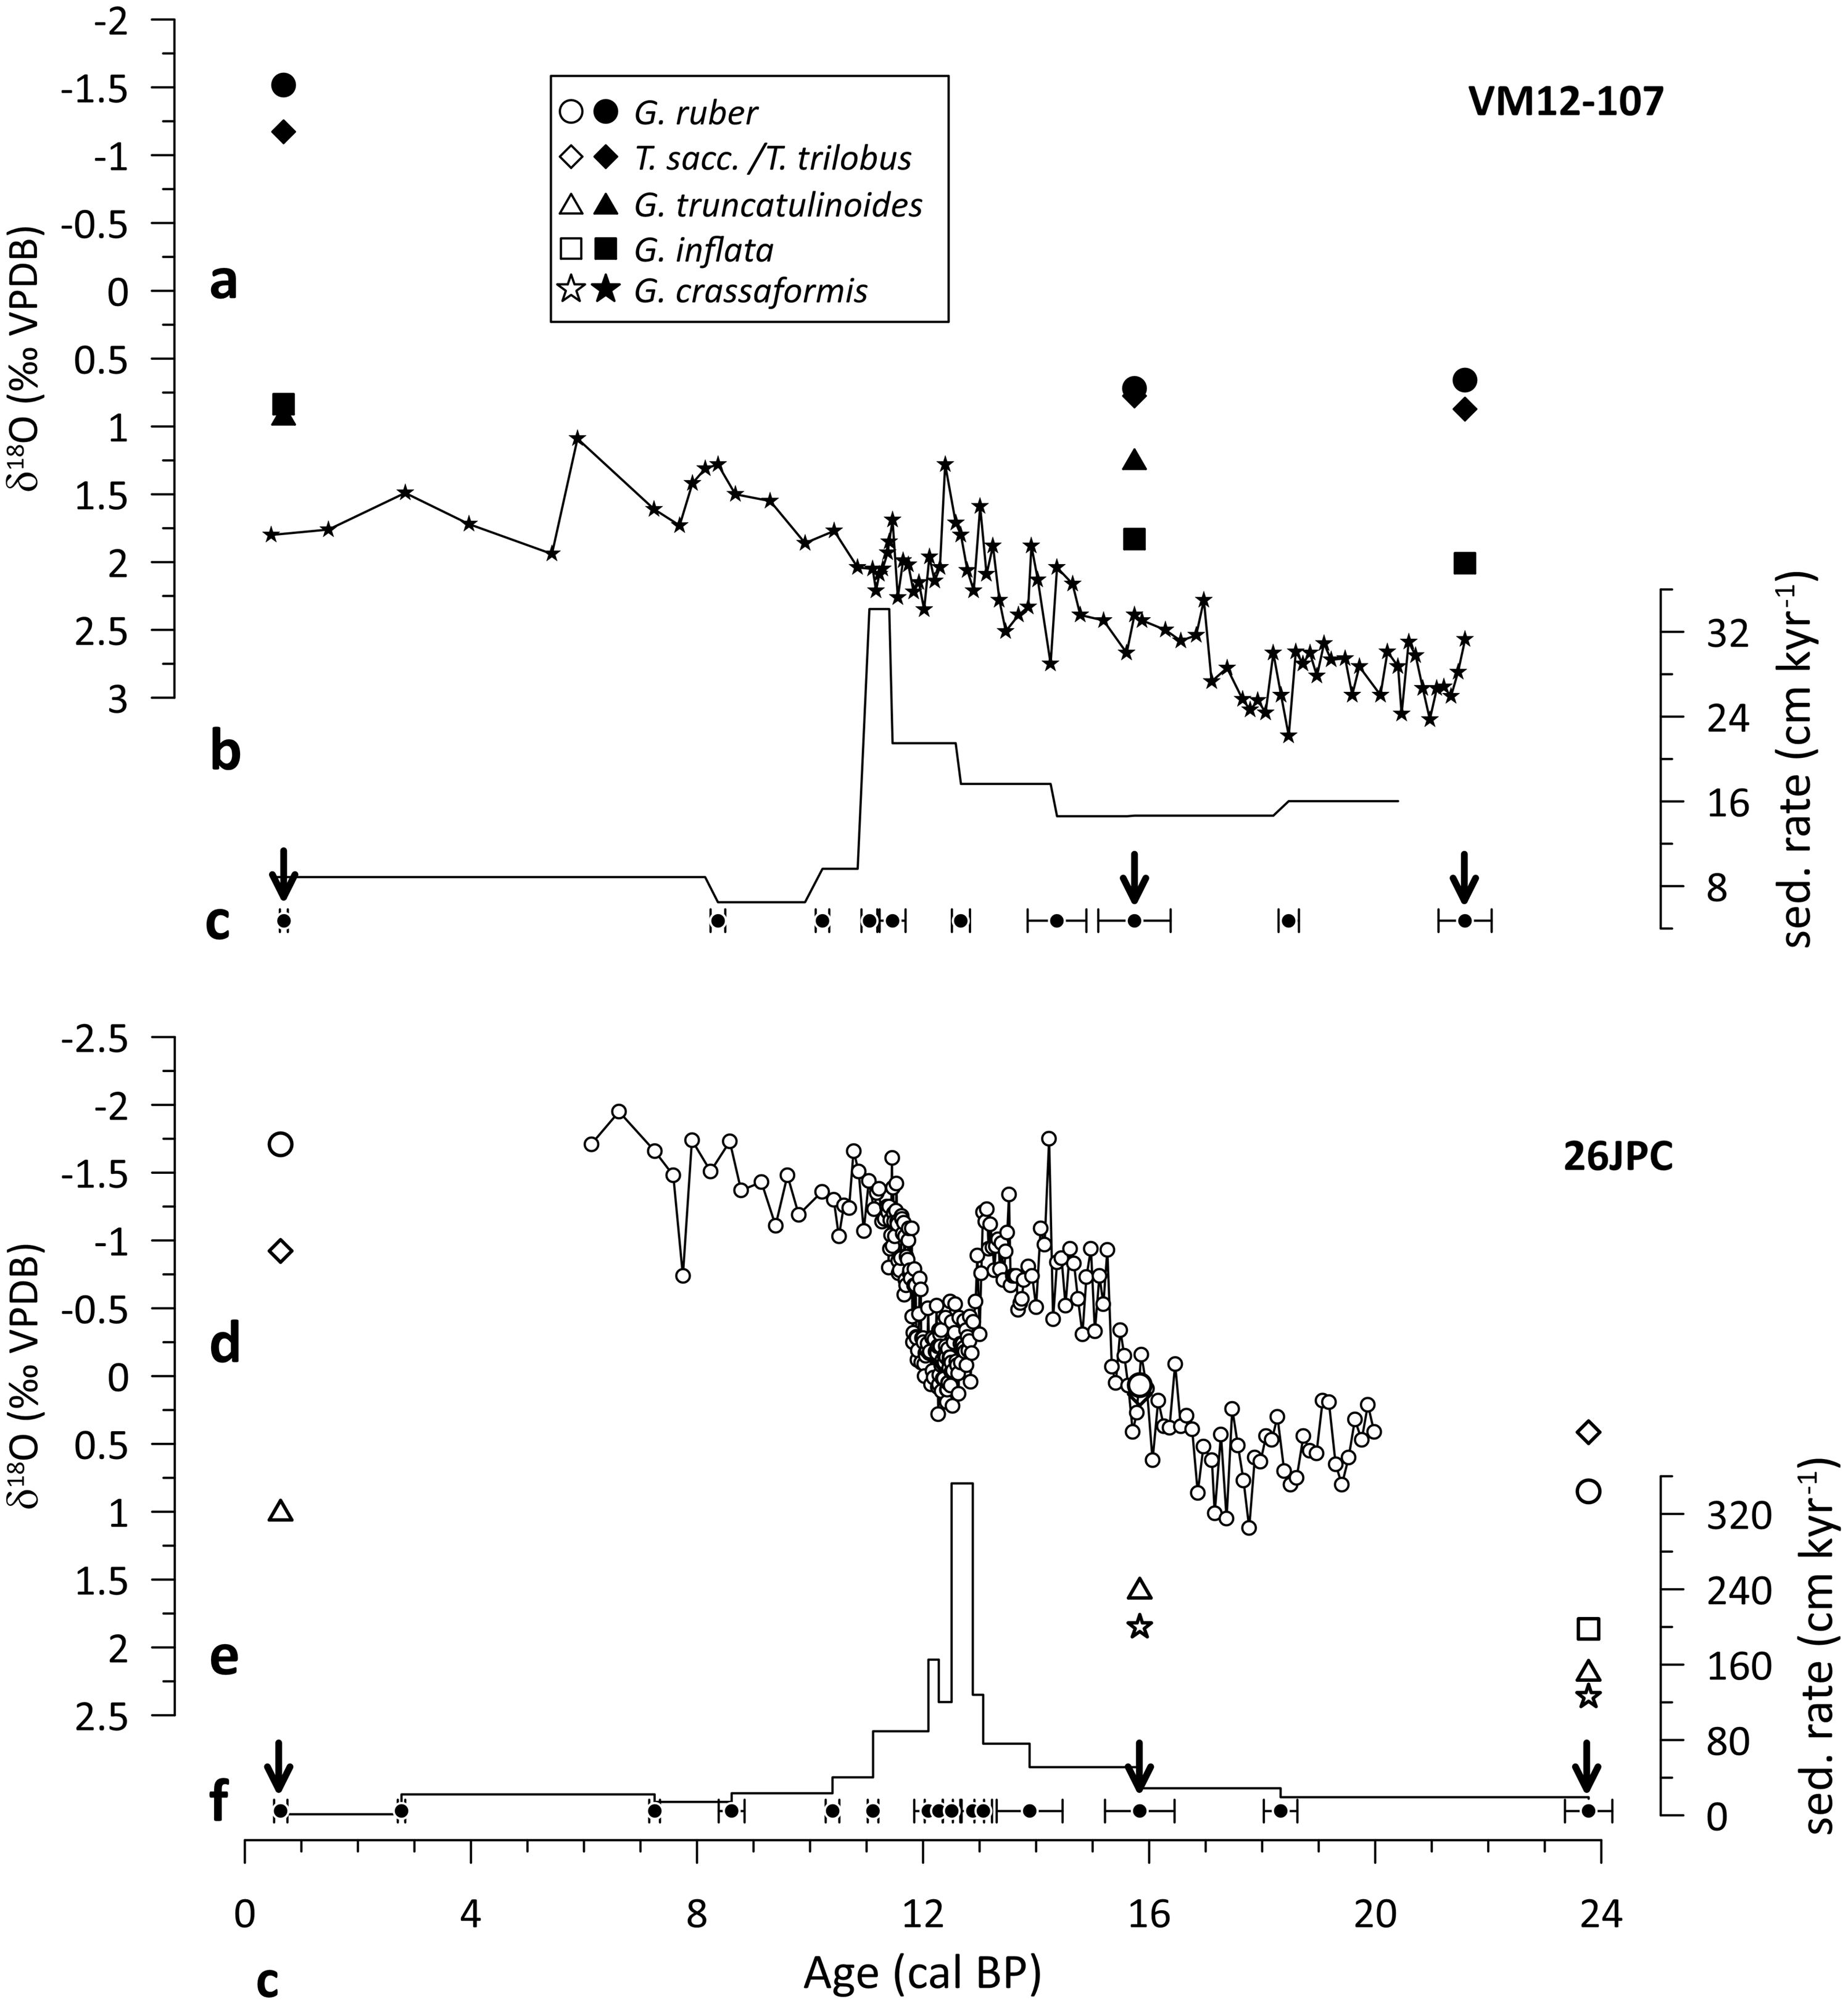
Both locations exhibited distinct changes in the upper-ocean structure during the past ∼20 kyr (Lynch-Stieglitz et al. Reference Lynch-Stieglitz, Schmidt, Henry, Curry, Skinner, Mulitza, Zhang and Chang2014; Schmidt et al. Reference Schmidt, Chang, Hertzberg, Them, Ji and Otto-Bliesner2012). This is in particular true for periods of weaker Atlantic meridional overturning circulation (AMOC) such as during HS1 and the Younger Dryas (YD) cold period, as inferred from 231Pa/230Th records (Ng et al. Reference Ng, Robinson, McManus, Mohamed, Jacobel, Ivanovic, Gregoire and Chen2018). In the case of Caribbean Site VM12-107, both intervals are characterized by subsurface warming and decreased upper-water column density stratification due to the influence of salty, warm subtropical gyre waters that flow southward during periods of reduced AMOC (Schmidt et al. Reference Schmidt, Chang, Hertzberg, Them, Ji and Otto-Bliesner2012). Similarly, planktonic foraminiferal stable oxygen isotopes from core KNR166-2-26JPC suggest a decrease of the northward water mass transport through Florida Straits, which is thought to have considerably reduced upper-ocean density stratification during HS1 and the YD (Lynch-Stieglitz et al. Reference Lynch-Stieglitz, Schmidt, Henry, Curry, Skinner, Mulitza, Zhang and Chang2014).
In the tropical and sub-tropical regions of the Atlantic Ocean, different habitat- and by inference calcification depths of planktonic foraminifera span a gradient of ∼60‰ in natural (i.e., bomb-corrected) Δ14C concentrations in the top 1000 m of the water column (Figure 3). Pre-bomb seawater 14C concentrations (Δ14C) in our study area are high in the upper 200 m of the water column (Olsen et al. Reference Olsen, Lange, Key, Tanhua, Álvarez, Becker, Bittig, Carter, Cotrim da Cunha and Feely2019), while they decline due to the admixture of “old” 14C from underlying intermediate water masses (here Antarctic Intermediate Water) below 200 m (Figure 3). We hence argue that given the pre-bomb water column Δ14C profile at our study sites the Δ14C difference between the deepest-calcifying foraminifera G. crassaformis and shallowest-calcifying foraminifer G. ruber should be about 30–60‰ translating into a 14C age difference of approximately 230–470 14C yr. This is generally higher than the uncertainty range of AMS 14C dates of last deglacial foraminiferal tests material of around 50–250 yr depending on sample size and 14C age as obtained for the Bern-MICADAS (Gottschalk et al. Reference Gottschalk, Szidat, Michel, Mazaud, Salazar, Battaglia, Lippold and Jaccard2018). We test if systematic reductions in 14C age differences between thermocline- and mixed layer-calcifying foraminifera during times of decline in the water-column density stratification can be observed.
Δ14C signatures in the upper water column of the study area in relation to ocean temperatures and planktonic foraminiferal calcification and habitat depths. Left: Bomb-corrected seawater 14C concentrations (Δ14C) at Station 316N19821201#4 in the Eastern Caribbean Sea (blue circles) and Stations 29HE19920714#107, 316N19810401#15 and 316N19810401#16 in the Florida Straits (red diamonds) from Global Ocean Data Analysis Project (Olsen et al. Reference Olsen, Lange, Key, Tanhua, Álvarez, Becker, Bittig, Carter, Cotrim da Cunha and Feely2019). The average relative error range of the Δ14C values is 5 %. Right: Annual mean temperature profiles monitored in proximity to the sediment cores examined in this study (core KNR166-2-26JPC, red line and core VM12-107, blue line, from World Ocean Atlas (Locarnini et al. Reference Locarnini, Mishonov, Baranova, Boyer, Zweng, Garcia, Reagan, Seidov, Weathers, Paver and Smolyar2019); see Figure 1 for core locations). Habitat depths (pink bars) approximating calcification depths for the planktonic foraminifera species targeted in this study are inferred either from plankton tow catches (Jentzen et al. Reference Jentzen, Schönfeld and Schiebel2018b) or core top δ18O estimates from the study area (Cleroux et al. Reference Cleroux, Cortijo, Duplessy and Zahn2007; Regenberg et al. Reference Regenberg, Steph, Nürnberg, Tiedemann and Garbe-Schönberg2009; Steph et al. Reference Steph, Regenberg, Tiedemann, Mulitza and Nürnberg2009).

Planktonic foraminifera
For our study, we selected planktonic foraminiferal species that predominantly calcify in the mixed-layer (G. ruber (white and pink), T. sacculifer, T. trilobus) and the thermocline (Globorotalia inflata, G. truncatulinoides (d, dextral coiling), G. crassaformis), and are sufficiently abundant to carry out 14C analyses in both cores for all targeted time slices (Figure 3). For G. ruber and T. sacculifer/T. trilobus we analysed the size fraction larger than 250 µm, for G. inflata, G. truncatulinoides and G. crassaformis we used the size fraction larger than 315 µm. In the Caribbean Sea, G. ruber (white and pink) is a mixed-layer species dwelling in the upper 30–40 m of the water column, while T. sacculifer and T. trilobus represent mixed-layer dwellers with an inferred calcification depth that is slightly deeper than that of G. ruber (0–100 m) (Schmuker and Schiebel Reference Schmuker and Schiebel2002; Regenberg et al. Reference Regenberg, Steph, Nürnberg, Tiedemann and Garbe-Schönberg2009; Steph et al. Reference Steph, Regenberg, Tiedemann, Mulitza and Nürnberg2009; Bahr et al. Reference Bahr, Schönfeld, Hoffmann, Voigt, Aurahs, Kucera, Flögel, Jentzen and Gerdes2013b). In the western subtropical North Atlantic and the Caribbean Sea, G. inflata dwells in the upper thermocline (180–300 m; Cleroux et al. Reference Cleroux, Cortijo, Duplessy and Zahn2007), while G. truncatulinoides (d, dextral coiling) is an intermediate to deep thermocline-dweller (170–700 m; Cleroux et al. Reference Cleroux, Cortijo, Duplessy and Zahn2007; Regenberg et al. Reference Regenberg, Steph, Nürnberg, Tiedemann and Garbe-Schönberg2009; Jentzen et al. Reference Jentzen, Nürnberg, Hathorne and Schönfeld2018a). It is believed that encrustation stages of G. truncatulinoides reflect different calcification depths (for non-encrusted specimens: 0-150 m, for encrusted: 170-700 m; (Cleroux and Lynch-Stieglitz Reference Cleroux and Lynch-Stieglitz2010; Jentzen et al. Reference Jentzen, Schönfeld and Schiebel2018b; Reynolds et al. Reference Reynolds, Richey, Fehrenbacher, Rosenheim and Spero2018). Hence, we only selected well-encrusted specimens to cover a deep thermocline habitat with G. truncatulinoides (d). G. crassaformis is a deep thermocline-dweller living at the base of the deep thermocline (450–900 m; Regenberg et al. Reference Regenberg, Steph, Nürnberg, Tiedemann and Garbe-Schönberg2009). Using a binocular microscope, we selected only well preserved and intact tests to avoid contamination by reworked and diagenetically altered specimens.
Radiocarbon Dating
Low abundances of planktonic foraminifera, often insufficient for conventional AMS 14C analyses, prohibits systematic in-depth analyses of 14C age differences between different planktonic foraminiferal species. We took advantage of new advances in AMS techniques via the MICADAS allowing for 14C analyses of small-sized (foraminiferal) samples (Wacker et al. Reference Wacker, Lippold, Molnár and Schulz2013; Gottschalk et al. Reference Gottschalk, Szidat, Michel, Mazaud, Salazar, Battaglia, Lippold and Jaccard2018; Missiaen et al. Reference Missiaen, Wacker, Lougheed, Skinner, Hajdas, Nouet, Pichat and Waelbroeck2020). For 14C analyses (Tables 1 and 2), we used the MICADAS of the University of Bern, Switzerland, fitted with a gas ion source allowing online analysis of small-size samples in gas form following the protocol described by Gottschalk et al. (Reference Gottschalk, Szidat, Michel, Mazaud, Salazar, Battaglia, Lippold and Jaccard2018). For larger sample sizes, graphitization has been applied in order to obtain a higher precision of the analyses (Table 2). For four samples with high sample weights (7–10 mg CaCO3), both methods have been applied in order to monitor analytical reproducibility and for direct comparison between graphitization and gas ion source methods. Reported radiocarbon ages are not reservoir age-corrected.
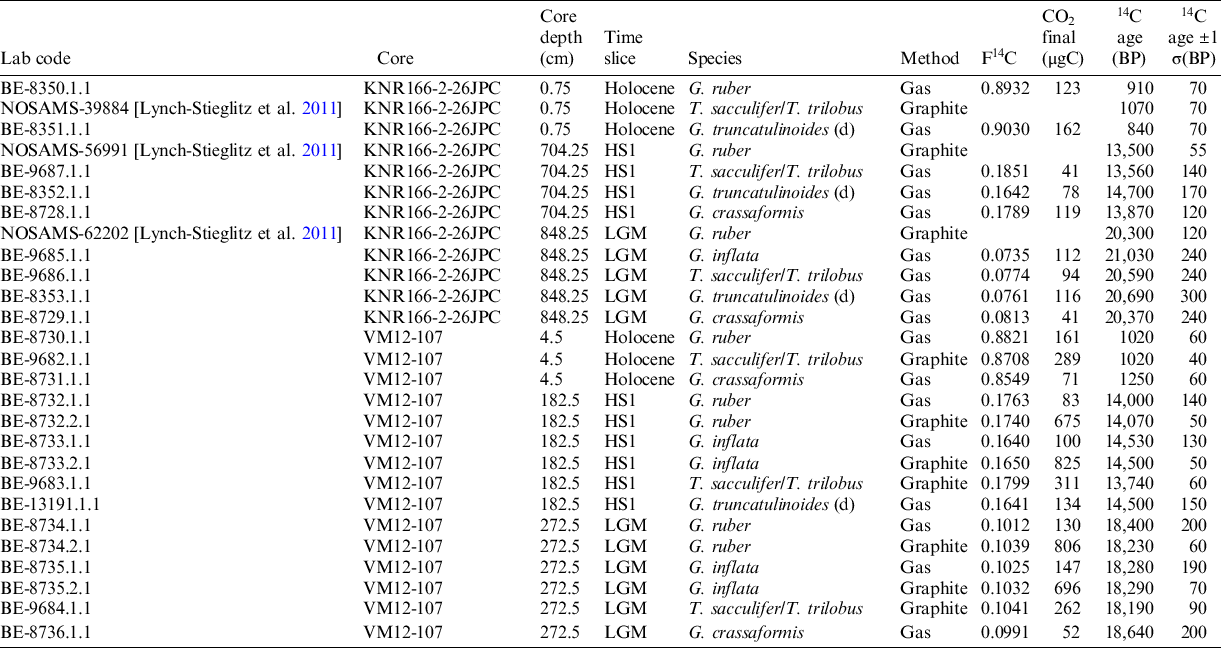
Sample overview. Sample intervals and weights of 14C-dated planktonic foraminifera species. Some species were absent or not of sufficient abundance to be considered for a reliable AMS measurement.

Overview of planktonic foraminiferal samples from sediment cores KNR166-2-26JPC and VM12-107 and results of 14C measurement. Radiocarbon ages and errors are reported after Stuiver and Pollach (Reference Stuiver and Polach1977).
Stable Oxygen Isotope Analyses
The stable oxygen isotope composition of planktonic foraminifera (here reported in δ-notation with reference to the Vienna Peedee Belemnite (VPDB) standard) has been measured for the three time slices from available foraminiferal species of both cores to constrain the respective states of upper-ocean hydrography. Stable oxygen isotope data were generated from sample depths bracketing the core intervals examined for 14C (see supplementary table for further details such as sample sizes). Measurement procedures followed the methods previously described by Lynch-Stieglitz et al. (Reference Lynch-Stieglitz, Schmidt and Curry2011). Isotope measurements were performed using a ThermoFisher MAT 253plus mass spectrometer coupled to a Kiel IV device calibrated with the NBS-19 and NBS-18 standards (KNR166-2-26JPC; Georgia Tech) and a ThermoFisher MAT 253plus mass spectrometer coupled to a Kiel IV device calibrated to an in-house Solnhofen limestone standard (VM12-107; Heidelberg University). Analytical precision based on repeated measurements of the in-house standard is lower than 0.06‰ for δ18O on both instruments.
RESULTS
We present 20 new 14C ages of five planktonic foraminiferal species from sediment core KNR166-2-26JPC and VM12-107, representing the Holocene, HS1 and the LGM (Table 2). These data complement three already available 14C dates from core KNR166-2-26JPC (Lynch-Stieglitz et al. Reference Lynch-Stieglitz, Schmidt, Henry, Curry, Skinner, Mulitza, Zhang and Chang2014). Four comparative 14C measurements with the gas ion source and involving graphitization yielded higher 14C age uncertainties (average: 160 14C yr) for the gas analyses when compared to solid sample analyses (average: 60 14C yr; Table 2). All four inter-method replicates produced 14C ages within the analytical uncertainties (average difference: 70 ± 170 14C yr; supplementary table).
In core KNR166-2-26JPC, the youngest 14C age (840 ± 70 BP) is found not for the mixed-layer species G. ruber or T. sacculifer/T. trilobus, but for the sub-thermocline calcifying G. truncatulinoides (d) (Table 2; Figure 4b). At core site VM12-107, however, G. crassaformis, i.e. the deepest calcifying foraminifera, yielded the oldest 14C age (1250 ± 60 BP) and the mixed-layer species G. ruber and T. sacculifer/T. trilobus give the youngest 14C age (1020 ± 70 BP; Figure 4b), as expected.
Planktonic foraminiferal δ18O (left panels) and 14C ages (right panels) for the three time slices, Holocene (a, b), HS1 (c, d) and LGM (e, f) from sediment core VM12-107 (black circle) and KNR166-2-26JPC (open square) for five different species (mixed-layer calcifying: G. ruber, T. sacculifer/T. trilobus and thermocline calcifying: G. inflata, G. truncatulinoides, G. crassaformis, arranged according to their average modern calcification depth as shown in Figure 3). Error bars comprise analytical uncertainties from AMS 14C measurements (1 sigma) and uncertainties of the habitat- und by inference calcification depth as given in Figure 3. For better comparison between the time-slices and core sites, all data are referenced against G. ruber. Due to the shallow water depth of KNR166-2-26JPC (546 m) we assume a more condensed habitat/calcification depth range for G. crassaformis and G. truncatulinoides shown within an upper range of the intervals depicted in Figure 3. As well lower global sea-levels during HS1 (∼100 m) and the LGM (∼120 m) are considered for KNR166-2-26JPC.
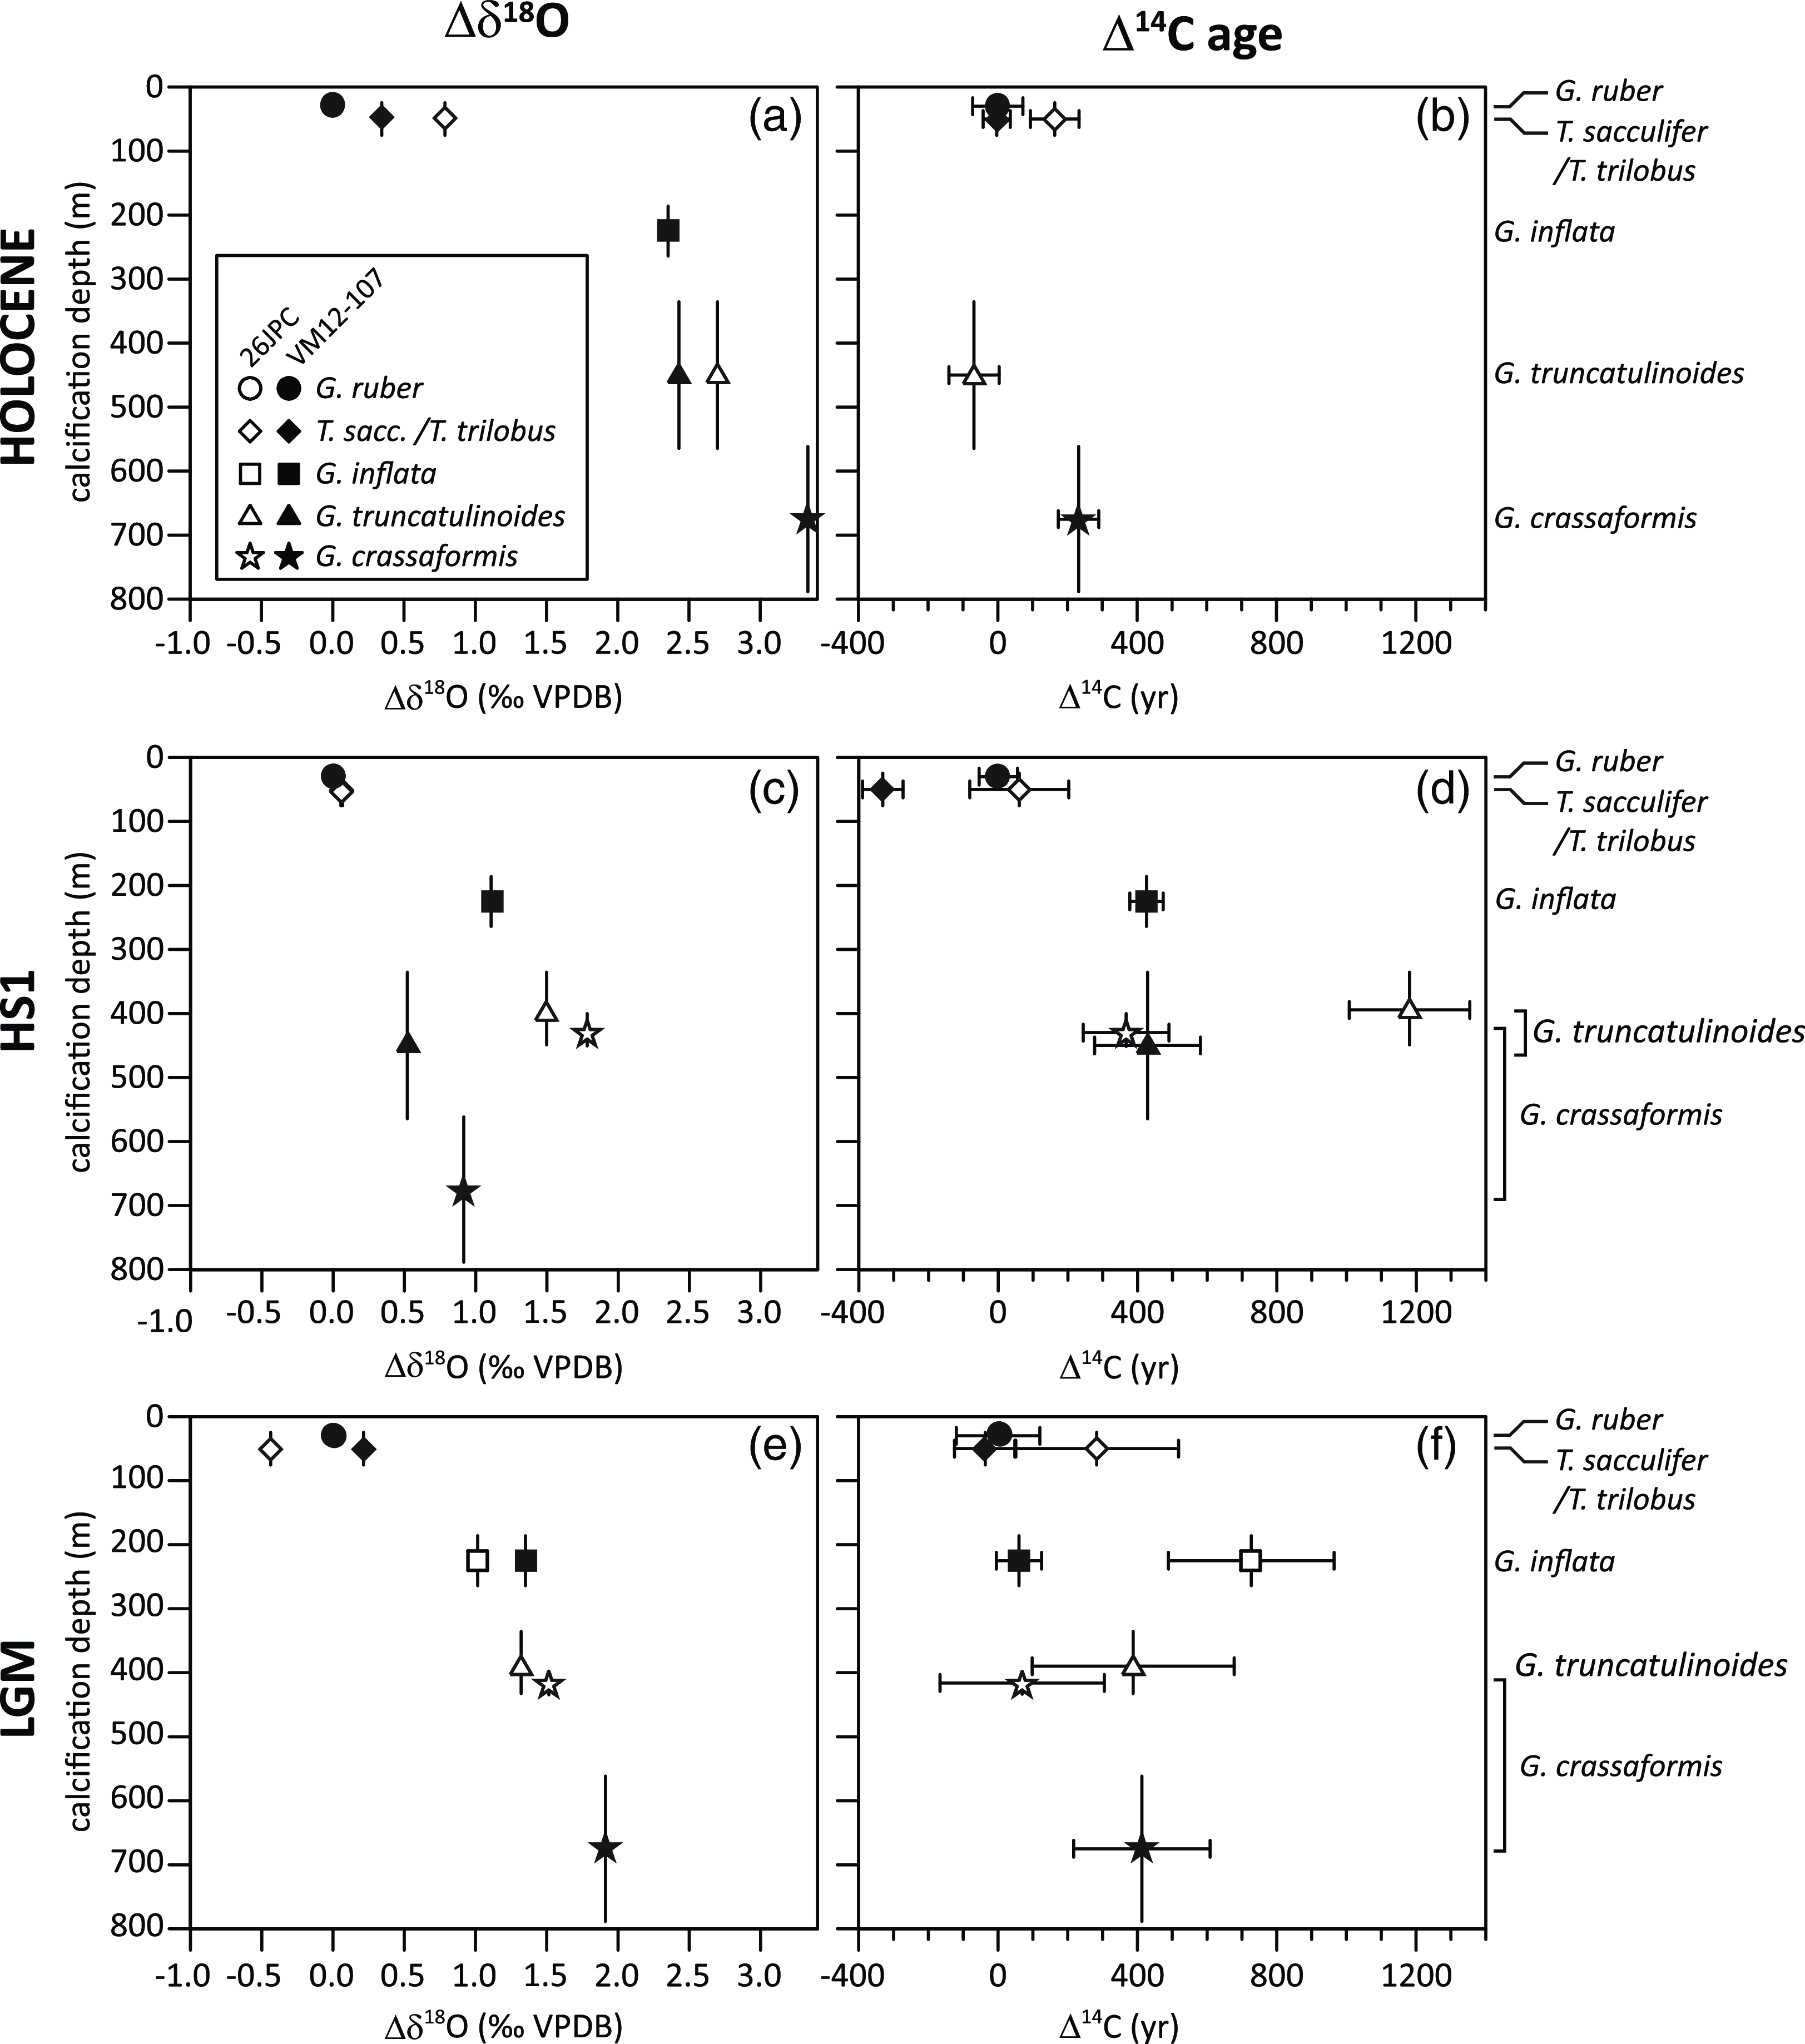
For the HS1 time-slice, we observe larger 14C age differences between coexisting planktonic foraminifera than seen for the Holocene (Figure 4d). The mixed-layer planktonic foraminiferal species generally exhibit the youngest 14C ages, with the exception of G. ruber in core VM12-107. 14C ages of the thermocline species G. inflata and G. truncatulinoides (d) are older than the 14C ages of the mixed-layer species G. ruber and T. sacculifer/T. trilobus in both cores. At KNR166-2-26JPC, the lower-thermocline calcifying planktonic foraminifer G. crassaformis exhibits an age 340 ± 190 BP older than the average age of the surface dwellers. In contrast, G. truncatulinoides (d) shows the oldest 14C ages, older by 830 ± 210 BP than G. crassaformis (Figure 4d). During the LGM time-slice, 14C ages in core VM12-107 slightly increase from mixed-layer to thermocline-calcifying planktonic foraminifera, similar to the Holocene (Figure 4f). In contrast, 14C ages in core KNR166-2-26JPC are oldest at the upper thermocline similar to HS1 (Figure 4d, f). Apart from our Holocene and LGM 14C ages in core VM12-107, we do not observe a consistent 14C age increase of planktonic foraminifera according to their expected modern calcification depths. Instead, we observe an upper-thermocline maximum of 14C ages during HS1 at both sites and during the LGM at site KNR166-2-26JPC.
The surface to sub-surface 14C age comparison contrasts with the planktonic foraminiferal δ18O data (Figure 4). The latter shows a consistent increase with the expected calcification depth, with only the upper-thermocline G. inflata δ18O in core VM12-107 during HS1 deviating from this trend. Overall, vertical δ18O gradients between mixed-layer and thermocline foraminiferal species are less pronounced for the LGM (average over both cores 1.7‰) compared to the Holocene (average over both cores 2.6‰) and weakest for the HS1 time slice, with KNR166-2-26JPC showing a steeper gradient (1.6‰) than VM12-107 (0.7‰). Therefore, while planktonic foraminiferal δ18O data suggest continuous, albeit variable, upper-ocean stratification at both core sites, our planktonic foraminiferal 14C age gradients do not.
From the multi-species 14C ages we can assess the effect of species choice on dating sediment layers when selecting other species than the shallowest calcifier G. ruber, which is most commonly used for dating in tropical and sub-tropical areas. For the inter-species analyses, we observe a maximum difference of 1200 ± 180 14C yr in core KNR166-2-26JPC during HS1 (G. ruber vs. G. truncatulinoides (d)). In this case, the choice of species alone could produce significant deviations in 14C ages within one discrete sediment layer clearly exceeding the analytical uncertainties. However, since thermocline calcifiers are commonly avoided for 14C based age models, we compare 14C ages of G. ruber to the ages of (i) a hypothetical mix of all available species according to their individual sample weights used in this study, (ii) a hypothetical mixture of G. ruber with the other mixed-layer species T. sacculifer/T. trilobus to one single radiocarbon sample, and (iii) the other available mixed layer species (T. sacculifer/T. trilobus) alone (Figure 5).
Radiocarbon ages of different subsets of planktonic foraminiferal species relative to G. ruber for both sediment cores and three time slices: 1) G. ruber 14C ages set to 0. 2) 14C ages of T. sacculifer/T. trilobus relative to G. ruber. 3) “mixed layer” indicates the 14C ages when G. ruber and T. sacculifer/T. trilobus would have been mixed, considering the respective sample weights for each species. 4) “all” gives the 14C ages when all available species would have been mixed, considering the respective sample weights for each species.
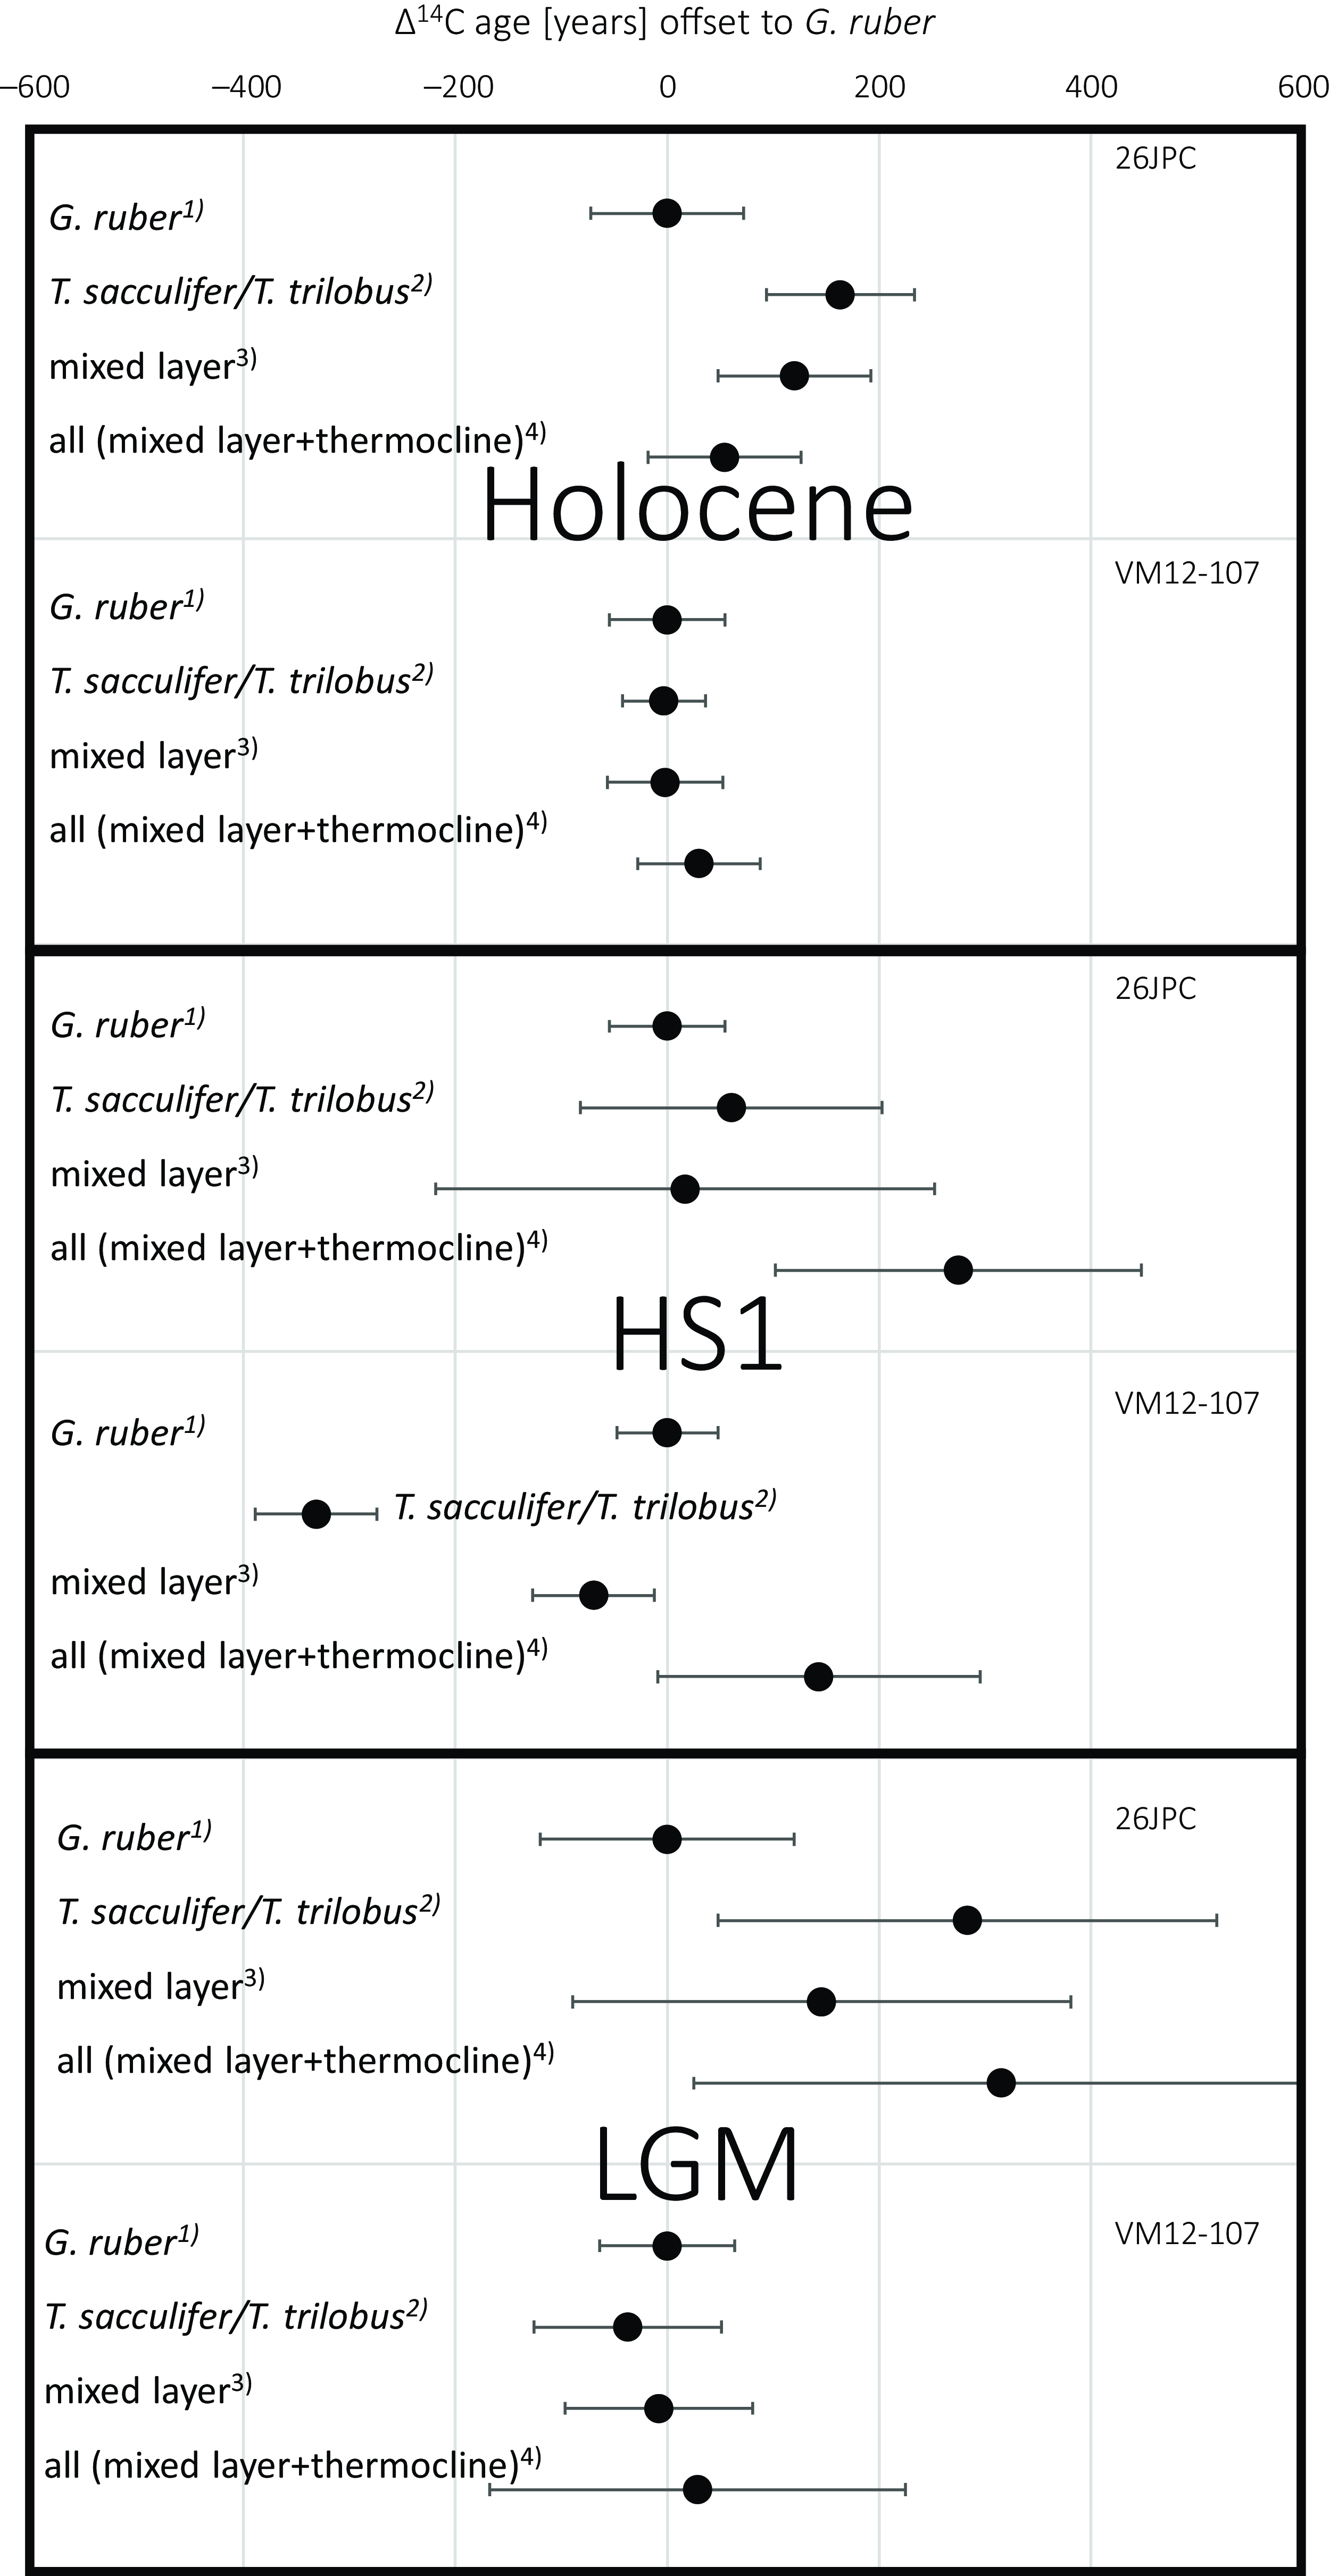
In all but one cases (KNR166-2-26JPC, HS1), blending all available species (mixed-layer and thermocline species) into one 14C age according to their individual contributions from their sample weight does not coherently yield a significant bias in 14C age from the G. ruber sample (Figure 5). While there are clear 14C age differences between the species (Figure 4) of one sediment layer, here the relative small sample sizes of the deep calcifiers compared to the more abundant G. ruber (Table 1) results in overlapping error bars for both approaches (Figure 5). Similarly, mixing G. ruber and. T. sacculifer/T. trilobus yields 14C ages not significantly different from the pure G. ruber result when considering the analytical uncertainty ranges (Figure 5). In two out of six cases significant differences in 14C ages can be observed when comparing G. ruber and T. sacculifer/T. trilobus during HS1 at VM107-12 (with G. ruber 330 ± 80 14C yr older, comparing the available graphite 14C measurements) and for the Holocene sample at KNR166-2-26JPC (160 ± 100 14C yr younger; Figure 5). Taking into account the analytical uncertainties, the 14C age of most subsets of selected species are not statistically different from a pure G. ruber sample at our study sites.
DISCUSSION
Deviations from the expected increase of planktonic 14C ages with calcification depth
For both cores, planktonic foraminiferal δ18O values increase with modern foraminiferal calcification depth indicating continued upper water column density stratification for the three time slices (Tedesco et al. Reference Tedesco, Thunell, Astor and Muller-Karger2007; Steph et al. Reference Steph, Regenberg, Tiedemann, Mulitza and Nürnberg2009). Based on the assumption that deeper water masses within the oceanographic setting of our core locations acquire an older 14C signature than the surface ocean, which continuously exchanges with the atmosphere, we expect an increase of 14C ages of coexisting planktonic foraminifera with increasing calcification depth in parallel with planktonic foraminiferal δ18O for all timeslices. If correct, both δ18O and 14C ages from planktonic foraminifera could serve independently as a measure of the upper water column density stratification at our study sites.
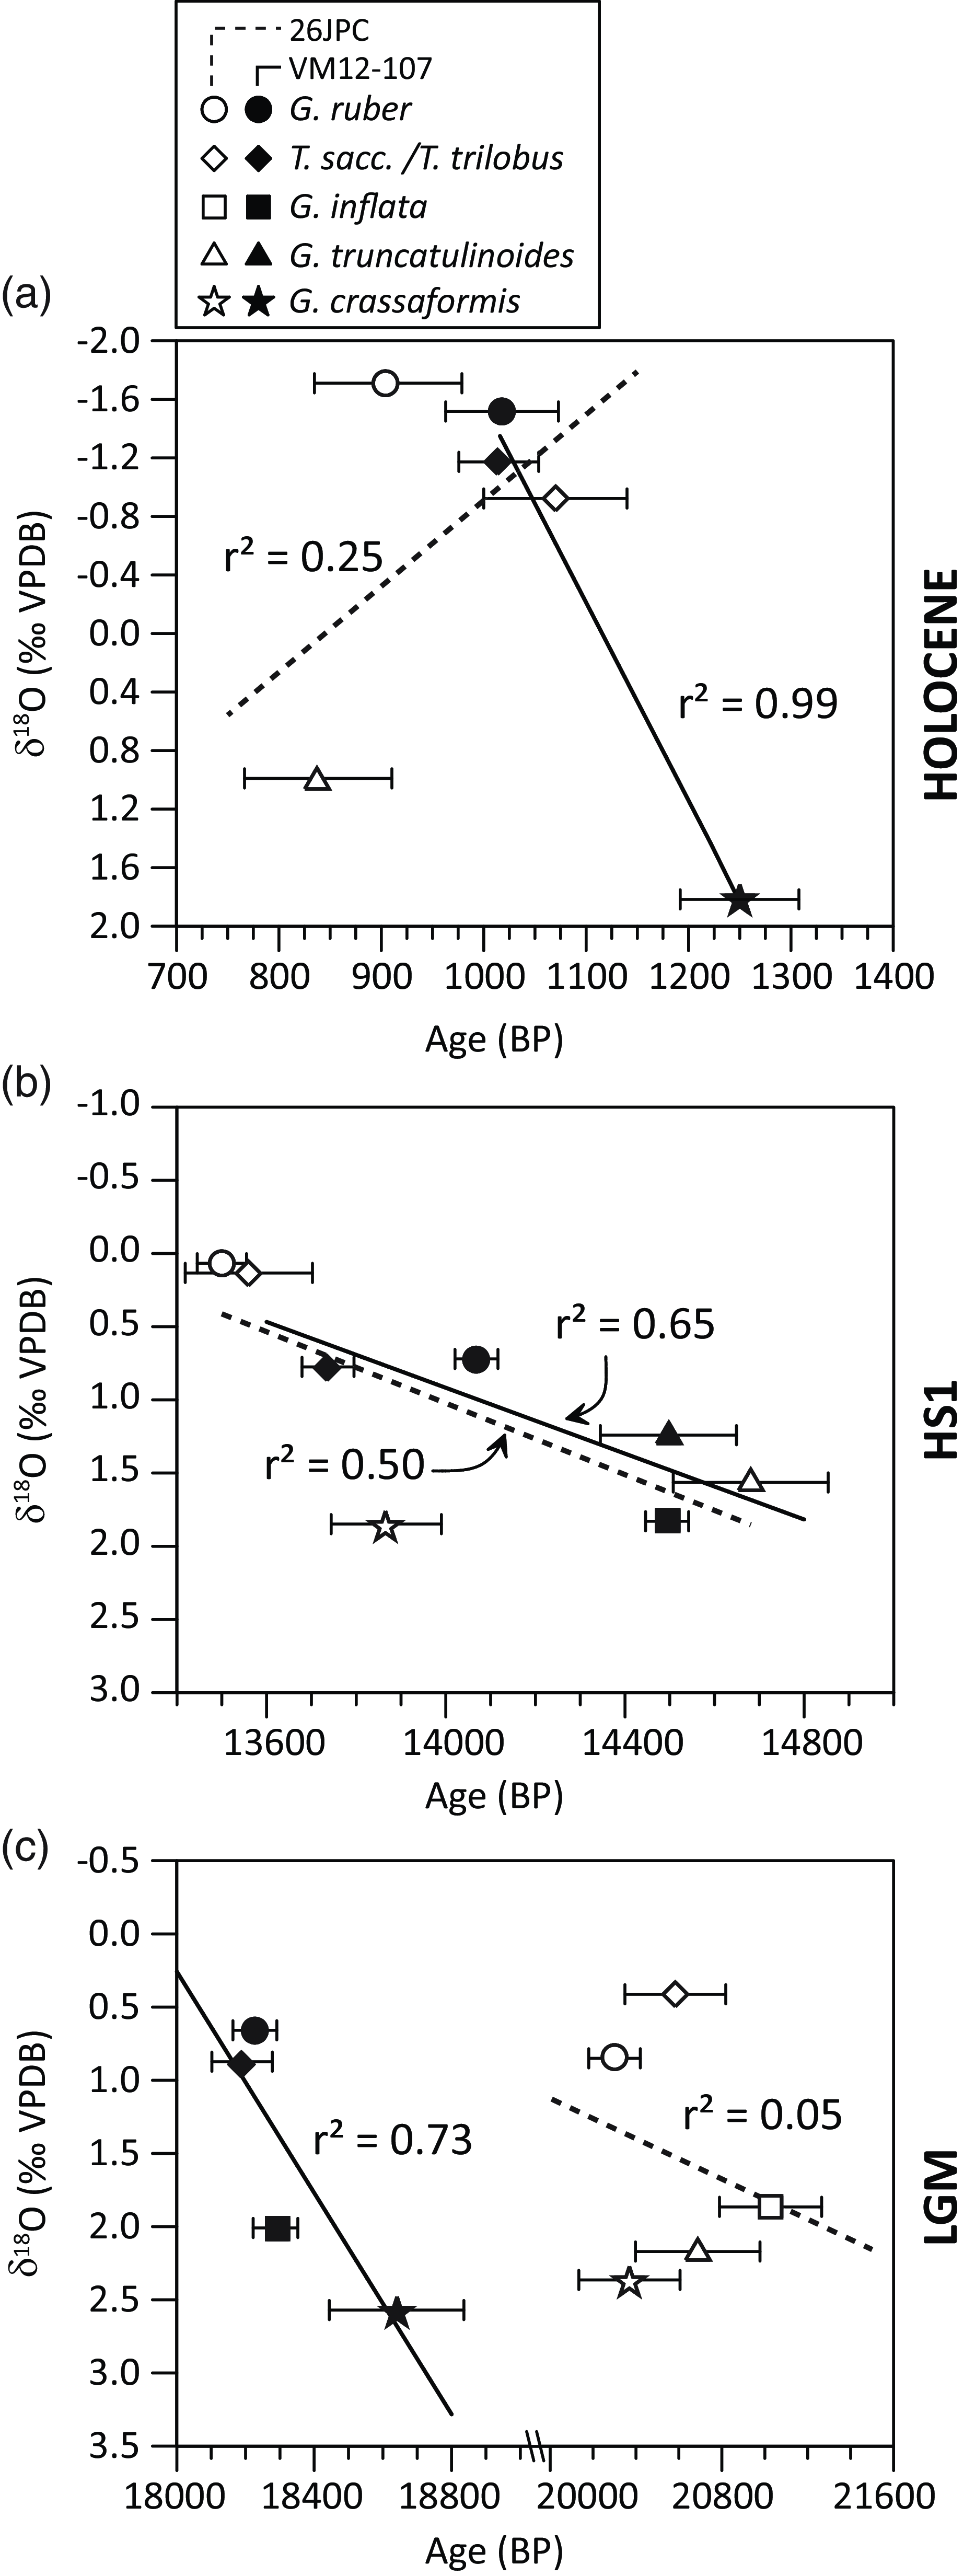
Planktonic foraminiferal 14C ages in VM12-107 show an expected increase with depth (Figure 4). However, planktonic foraminiferal 14C data from KNR166-2-26JPC shows strong deviations from the expected increase in 14C ages with depth (Figure 4). For instance, the Holocene G. truncatulinoides (d) sample from KNR166-2-26JPC appears too young by at least 350 14C yr to fit onto a linear regression line between 14C and δ18O that would be expected if both parameters are predominantly driven by the density stratification of the water column (Figure 6). Similarly, for HS1, the 14C age of G. crassaformis deviates from the linear correlation between 14C ages and δ18O dictated by other coexisting planktonic foraminifera (Figure 6b). This might be explained by factors other than a dominant control from the density stratification of the upper water column.
Planktonic foraminiferal δ18O versus radiocarbon age for the three examined time slices (a: Holocene, b: HS1, c: LGM) from sediment core VM12-107 and KNR166-2-26JPC for available data pairs. In contrast to observations in KNR166-2-26JPC, data from VM12-107 follow a discernible linear relation (though for the Holocene defined by the shallowest and deepest species only) between planktonic foraminiferal δ18O and 14C age.
Factors explaining deviations from expected 14C age offsets between planktonic foraminifera
Post-Depositional Effects
Offsets in 14C ages of coexisting planktonic foraminifera are often related to the post-depositional dissolution of foraminiferal tests. In particular, differential dissolution and fragmentation as a function of size, shape and robustness of shells (Barker et al. Reference Barker, Broecker, Clark and Hajdas2007; Broecker and Clark Reference Broecker and Clark2011) have been identified as a primary effect. However, we consider it very unlikely that dissolution as well as secondary calcification or chemical erosion of foraminiferal tests largely controlled the observed inter-species 14C ages, given the high sedimentation rates (16–23 and 9–16 cm/kyr) (Schmidt et al. Reference Schmidt, Chang, Hertzberg, Them, Ji and Otto-Bliesner2012; Lynch-Stieglitz et al. Reference Lynch-Stieglitz, Schmidt, Henry, Curry, Skinner, Mulitza, Zhang and Chang2014) and the shallow water depths (1079 m and 546 m) of our two study sites, VM12-107 and KNR166-2-26JPC, respectively. Further, the absence of 14C age reversals throughout the analyzed cores (Schmidt et al. Reference Schmidt, Chang, Hertzberg, Them, Ji and Otto-Bliesner2012; Lynch-Stieglitz et al. Reference Lynch-Stieglitz, Schmidt, Henry, Curry, Skinner, Mulitza, Zhang and Chang2014) suggests continuous sedimentation and the absence of disturbed sediment sequences.
Bioturbation, i.e., sediment stirring by benthic organisms, causes sediments from the same depth layer to contain a mixture of relocated younger and older material, which exacerbates data and age uncertainties of samples containing small numbers of individual proxy carriers (Trauth Reference Trauth1998). That is because individual species will be preferentially mixed in from adjacent periods of high abundance into sediment horizons of low abundance, which in turn increases age heterogeneity and hence 14C age uncertainties of substrates measured from discrete sediment samples beyond analytical uncertainties. Effects of bioturbation on sample heterogeneity are largest when foraminiferal abundances fluctuate and sedimentation rates are low (Löwemark et al. Reference Löwemark, Konstantinou and Steinke2008; Trauth Reference Trauth2013). Given the absence of abundance counts of planktonic foraminiferal species for our study cores, we cannot exclude that bioturbation affected the observed 14C and δ18O gradients at our study sites. Given a commonly assumed bioturbation depth of 3–14 cm (Teal et al. Reference Teal, Bulling, Parker and Solan2008), however, sedimentation rate becomes a crucial parameter determining the age range of a sample, and hence potential intra- and inter-species 14C age offsets, when a subset of this sample is analysed (Dolman et al. Reference Dolman, Groeneveld, Mollenhauer, Ho and Laepple2021).
Although having selected high accumulating sediment cores bearing a wide spectrum of different well-preserved planktonic foraminiferal species, some thermocline-calcifying species were clearly less abundant compared to G. ruber and/or T. sacculifer/T. trilobus (Table 1). With the advance of new 14C measurement techniques the amount of foraminiferal tests required for a 14C measurement has decreased significantly (Wacker et al. Reference Wacker, Lippold, Molnár and Schulz2013), but potential age heterogeneities due to bioturbation may induce a non-negligible source of uncertainties. For example, some samples of G. crassaformis comprised only nine individual tests. Such low numbers increase the likelihood of biases from bioturbated individuals. Dolman et al. (Reference Dolman, Groeneveld, Mollenhauer, Ho and Laepple2021) systematically analysed changes in foraminiferal 14C age uncertainties as a function of the number of individual tests analysed as well as the bioturbation depth and the sedimentation rate. When assuming a bioturbation of 6 cm, i.e. the global mean (Teal et al. Reference Teal, Bulling, Parker and Solan2008), and applying the approach of Dolman et al. (Reference Dolman, Groeneveld, Mollenhauer, Ho and Laepple2021), the 14C age uncertainty of our data increases in the worst case by 400% and in the best case by only 3%. In the first case, the relatively low sedimentation rate during the Holocene (∼9 cm/kyr) at VM12-107 along with only nine individuals of G. crassaformis results in an additional error of 240 14C yr. In contrast, the latter example benefits from ∼500 individual G. ruber tests and a sedimentation rate of ∼16 cm/kyr yielding an additional age error of 17 yr only. In general, the samples containing low amounts of individuals exhibit the highest level of uncertainty as the result of poorer counting statistics (Gottschalk et al. Reference Gottschalk, Szidat, Michel, Mazaud, Salazar, Battaglia, Lippold and Jaccard2018). The error bars of these 14C ages could have been reduced only by gathering significantly more tests (e.g., >50) for each species.
Changes in Foraminiferal Calcification Depths
The possibility of past shifts of the calcification depth of planktonic foraminifera makes interpretation of past inter-species 14C age offsets as indicator of upper-ocean 14C gradients difficult. The calcification depth reflects the preference of planktonic foraminiferal species for particular environmental conditions, including seawater [CO3 2−], oxygen concentration, temperature, light availability and nutrient concentration (e.g., (Kucera Reference Kucera, Hillaire-Marcel and De Vernal2007)). These conditions are intrinsically related to water depth, as well as the planktonic foraminiferal δ18O reflecting the calcification depth of the species under investigation (Tedesco et al. Reference Tedesco, Thunell, Astor and Muller-Karger2007; Aldridge et al. Reference Aldridge, Beer and Purdie2012; Osborne et al. Reference Osborne, Thunell, Marshall, Holm, Tappa, Benitez-Nelson, Cai and Chen2016; Rufino et al. Reference Rufino, Salgueiro, Voelker, Polito, Cermeño and Abrantes2022;). Some species, however, seem to prefer a constant habitat depth (Rebotim et al. Reference Rebotim, Voelker, Jonkers, Waniek, Schulz and Kucera2019). For instance Groeneveld and Chiessi (Reference Groeneveld and Chiessi2011) found G. inflata to occupy a fairly constant depth habitat within the permanent thermocline throughout different hydrographic conditions between 350 and 400 m. Other planktonic foraminifera exhibit specific seasonal production patterns, and thus have different preferred habitat and calcification depths (Deuser et al. Reference Deuser, Ross, Hemleben and Spindler1981; Tedesco et al. Reference Tedesco, Thunell, Astor and Muller-Karger2007; Jonkers et al. Reference Jonkers, Zahn, Thomas, Henderson, Abouchami, François, Masque, Hall and Bickert2015; Lindsay et al. Reference Lindsay, Lehman, Marchitto and Ortiz2015; Salmon et al. Reference Salmon, Anand, Sexton and Conte2015; Kretschmer et al. Reference Kretschmer, Jonkers, Kucera and Schulz2018). As a result, calcification depths for individual species may vary over time as a function of the environmental conditions (Jonkers and Kučera Reference Jonkers and Kučera2017). For example, deglacial climate changes have been observed to alter calcification depths of G. truncatulinoides in the western tropical Atlantic (Cleroux and Lynch-Stieglitz Reference Cleroux and Lynch-Stieglitz2010) and there are observations of G. crassaformis habitat depths for instance deviating from the commonly assumed depth ranges (Rebotim et al. Reference Rebotim, Voelker, Jonkers, Waniek, Schulz and Kucera2019). Hence, the calcification depth range for individual species (such as presented in Figure 3) could have deviated from present-day during HS1 and the LGM. In addition, other biological factors, such as different life cycles, potentially add further uncertainty in interpreting the 14C differences among planktonic foraminiferal species. However, our planktonic foraminiferal δ18O data suggests that during HS1 and LGM calcification depths did not deviate strongly from those inferred from present-day observations (Figure 4a,c,e), and hence cannot explain a deviation of planktonic foraminiferal 14C ages from an expected increase with calcification depth as inferred for the present day. In particular, for KNR166-2-26JPC, a hypothetical vertical shift in the calcification depth of multiple planktonic foraminifera, even by a few hundreds of meters, would not be able to explain identical 14C signatures of deep and mixed-layer calcifiers within error and 14C age maxima in the upper thermocline (Figure 4).
Hydrographic and sedimentary differences between both core sites
Increasing planktonic foraminiferal 14C ages with increasing calcification depths only occur at site VM12-107 (Figure 7). In core KNR166-2-26JPC, a comparison of δ18O with 14C shows that some data points deviate from an approximate linear relation between both isotopic values during the Holocene (G. truncatulinoides), HS1 (G. crassaformis) and the LGM (G. crassaformis). The absence of a correlation between calcification and 14C mostly concerns the deep-dwellers at KNR166-2-26JPC.
Radiocarbon ages of planktonic foraminifera for the three time slices (a: Holocene, b: HS1, c: LGM) from cores KNR166-2-26JPC and VM12-107 for five different species (in order of average assumed calcification depth) with horizontal error bars comprising analytical uncertainties from AMS measurements and the effects of bioturbation following Dolman et al. (Reference Dolman, Groeneveld, Mollenhauer, Ho and Laepple2021). Vertical error bars indicate habitat- and by inference calcification depth ranges as depicted in Figure 3. Due to the shallow water depth of KNR166-2-26JPC (546 m) we assume a more condensed habitat/calcification depth range for G. crassaformis and G. truncatulinoides shown within an upper range of the intervals depicted in Figure 3. As well lower global sea-levels during HS1 (∼100 m) and the LGM (∼120 m) are considered for KNR166-2-26JPC.

Water depth of KNR166-2-26JPC
Due to the shallow core depth of KNR166-2-26JPC at this location (546 m), the thermocline-calcifying species cannot occupy the full range of their present-day calcification depths (Figure 3) ranging from ∼200 to 700 m (G. truncatulinoides) and ∼500 to 900 m (G. crassaformis; Regenberg et al. Reference Regenberg, Steph, Nürnberg, Tiedemann and Garbe-Schönberg2009). This becomes exacerbated during the (de)glaciation, when sea level was lower. Accordingly, during the LGM with a sea-level ∼120 m lower than today, calcification depths at KNR166-2-26JPC of these species were at a maximum water depth of ∼420 m, limiting the depth of calcification. However, today, the thermocline is compressed and shoaled at this location due to strong currents, allowing Antarctic Intermediate Water that is typically found much deeper offshore to bath our core site. If upper ocean currents substantially weakened during the LGM and HS1, as reconstructions suggest (Lynch-Stieglitz et al. Reference Lynch-Stieglitz, Schmidt, Henry, Curry, Skinner, Mulitza, Zhang and Chang2014), reduced water depth and thermocline shifts could have forced the lower thermocline calcifiers to become instead upper thermocline-calcifiers. Our planktonic foraminiferal δ18O profiles consistent with the expected depth-profile corroborate that calcification depths did not significantly change during LGM and HS1 (Figure 4a,c,e). Hence, even condensed calcification ranges at site KNR166-2-26JPC during (de)glacial times cannot explain 14C ages of the deepest calcifier G. crassaformis to be lower than for assumed calcifiers in the upper water column, i.e., T. sacculifer/T. trilobus and G. inflata.
Transportation effects at KNR166-2-26JPC
Deep dwelling species G. truncatulinoides and G. crassaformis, which are thought to follow an annual life cycle (Deuser et al. Reference Deuser, Ross, Hemleben and Spindler1981; Lohmann and Malmgren Reference Lohmann and Malmgren1983; Lohmann Reference Lohmann2006; Cléroux et al. Reference Cléroux, Lynch-Stieglitz, Schmidt, Cortijo and Duplessy2009), might get transported for long distances (up to several hundred km) by ocean currents before deposition, and thus may not record in-situ conditions at the site of deposition (van Sebille et al. Reference van Sebille, Scussolini, Durgadoo, Peeters, Biastoch, Weijer, Turney, Paris and Zahn2015). The potential influence of displaced specimens is less important for the upper thermocline and mixed-layer dwelling species G. inflata, G. ruber, T. sacculifer, and T. trilobus, which reproduce in a monthly or 15-day cycle with a short life span of a few days (Berger and Soutar Reference Berger and Soutar1967; Schiebel et al. Reference Schiebel, Bijma and Hemleben1997; Jonkers and Kučera Reference Jonkers and Kučera2015; Schiebel and Hemleben Reference Schiebel and Hemleben2017). Thus, the mismatch between 14C ages and δ18O at KNR166-2-26JPC might be also explained by the deposition of allochthonous tests which would enhance the noise of the proxy signal, in particular because extraordinarily strong bottom currents are active at this site. In the Florida Straits, sedimentary evidence indicates a variable but continuous and strong Florida Current throughout the last ∼40,000 yr (Lynch-Stieglitz et al. Reference Lynch-Stieglitz, Schmidt, Henry, Curry, Skinner, Mulitza, Zhang and Chang2014). Being directly exposed to the main flow of this strong current (Leaman et al. Reference Leaman, Vertes, Atkinson, Lee, Hamilton and Waddell1995), planktonic foraminifera might get mobilized and subjected to transport to site KNR166-2-26JPC from other locations. Since the horizontal advection distance of foraminiferal tests (living and post-mortem) has been estimated to reach a few hundred kilometres (Siegel and Deuser Reference Siegel and Deuser1997; v. Gyldenfeldt et al. Reference v. Gyldenfeldt, Carstens and Meincke2000; van Sebille et al. Reference van Sebille, Scussolini, Durgadoo, Peeters, Biastoch, Weijer, Turney, Paris and Zahn2015), this effect is likely at its maximum extent in the highly dynamical environment of the Florida Straits (Hamilton et al. Reference Hamilton, Larsen, Leaman, Lee and Waddell2005). Depending on the strength of ocean currents at the specific calcification depths of the species, foraminifera may drift from distal areas incorporating isotopic signals along their trajectory into their shells different from the ocean state at the core site. Without high-resolution modeling of the study region for different climate boundary conditions, the effect of advection processes of foraminiferal test on our results cannot be excluded, let alone quantified.
Overall, despite the high abundance of planktonic foraminifera species at site KNR166-2-26JPC, our data demonstrate that unfavourable parameters such as shallow water depth, bottom currents, and bioturbation in combination or separately can diminish the ability of coexisting planktonic foraminifera to record the upper-ocean 14C variability. On the other hand, our study site VM12-107 indicates that under more favourable circumstances (less dynamic environment, good preservation, and high sedimentation rate) planktonic foraminiferal 14C ages are in principle able to track the upper-ocean 14C age gradients in the past. Even when correcting 14C age uncertainties for the effects of bioturbation, the 14C age increase with (present-day) calcification depth is evident at site VM12-107 (Figure 7), which is qualitatively to be expected given the modern hydrography.
Planktonic foraminiferal 14C age offsets as indicator of upper ocean stratification at site VM12-107
In addition, at site VM12-107, we observe a general increase of 14C ages of coexisting planktonic foraminifera with increasing calcification depth in parallel with δ18O for all examined time slices, yet with a different slope for HS1 (Figure 6). It was shown that the equatorial Atlantic thermocline was at a deeper water level during HS1 compared to the Holocene because of surface water cooling during AMOC slowdowns, while subsurface waters warmed (Figure 4; Schmidt et al. Reference Schmidt, Chang, Hertzberg, Them, Ji and Otto-Bliesner2012; Lynch-Stieglitz et al. Reference Lynch-Stieglitz, Schmidt, Henry, Curry, Skinner, Mulitza, Zhang and Chang2014). The same processes operated, albeit in weaker fashion, during the LGM (Reißig et al. Reference Reißig, Nürnberg, Bahr, Poggemann and Hoffmann2019). In line with these reconstructions, at VM12-107 weak planktonic foraminiferal δ18O gradients suggest a weaker upper ocean stratification during HS1 and the LGM, while steepening occurred towards the Holocene (Figure 4). Accordingly, for HS1 and LGM, we would expect the smallest difference in 14C ages between mixed-layer versus thermocline-calcifying planktonic foraminifera at site VM12-107, because weaker stratification would facilitate the vertical exchange within the water column, and turbulent mixing would transport atmospheric 14C more effectively to deeper water layers. However, we observe the largest difference in 14C ages between mixed-layer versus thermocline-calcifying planktonic foraminifera during HS1 (600 ± 190 14C yr) compared to LGM (430 ± 240 14C yr) and the Holocene (230 ± 100 14C yr). The larger gradients in 14C ages during HS1 may result from substantially elevated 14C reservoir ages during this time period (Hodell et al. Reference Hodell, Nicholl, Bontognali, Danino, Dorador, Dowdeswell, Einsle, Kuhlmann, Martrat and Mleneck-Vautravers2017; Stern and Lisiecki Reference Stern and Lisiecki2013), which would particularly affect the deeper thermocline calcifiers within a weakly stratified water column. Indeed, an increase in reservoir ages over HS1 and the LGM have been inferred for sub-polar, sub-tropical and tropical surface waters along the West Atlantic continental margin (Balmer et al. Reference Balmer, Sarnthein, Mudelsee and Grootes2016; Butzin et al. Reference Butzin, Köhler and Lohmann2017) as a consequence of a reduced AMOC and increased inflow of Antarctic Intermediate Water (Waelbroeck et al. Reference Waelbroeck, Duplessy, Michel, Labeyrie, Paillard and Duprat2001; Stern and Lisiecki Reference Stern and Lisiecki2013; Balmer et al. Reference Balmer, Sarnthein, Mudelsee and Grootes2016; Poggemann et al. Reference Poggemann, Hathorne, Nürnberg, Frank, Bruhn, Reißig and Bahr2017; Ng et al. Reference Ng, Robinson, McManus, Mohamed, Jacobel, Ivanovic, Gregoire and Chen2018; Süfke et al. Reference Süfke, Pöppelmeier, Goepfert, Regelous, Koutsodendris, Blaser, Gutjah and Lippold2019). It appears that mixing from below of waters carrying a higher reservoir age over-compensates for down-mixing of surface water high in 14C, facilitated by weaker density stratification. This, eventually, could have led to the larger gradient in 14C ages between mixed-layer and thermocline calcifiers during HS1 and LGM despite a weaker stratification of the upper water column at site VM12-107.
CONCLUSIONS
Based on 24 14C measurements of coexisting planktonic foraminifera from two sediment cores from the Caribbean Sea and Florida Straits and from three different time slices (Holocene, HS1 and LGM), we examined 14C ages of coexisting planktonic foraminifera as a function of calcification depth and past changes in water column density stratification. We also assessed the effects of 14C dating of different planktonic foraminifera species on 14C-based age models for our study sites. We found that the 14C age of coexisting planktonic foraminifera differs by up to 1200 ± 180 14C yr in our study area (i.e., G. ruber versus G. truncatulinoides at KNR166-2-26JPC during HS1). Radiocarbon dating of thermocline-calcifying planktonic foraminifera or combined 14C analyses of thermocline- and mixed layer-species mostly resulted in 14C ages older than mixed layer-calcifiers for the same sediment horizon. In our study, however, 14C age offsets between mono-specific G. ruber 14C ages and the 14C age of a combined sample (blending all available mixed layer and thermocline calcifying individuals under consideration of their individual weights) reach a maximum of 320 ± 120 14C yr (i.e., at KNR166-2-26JPC during LGM). Any offsets between G. ruber and mixed-species 14C ages fall within the analytical uncertainties of the 14C dates. Hence, if based on mixed planktonic species samples, at our core sites age models would not be significantly biased compared to solely G. ruber-based 14C dates (maximum of ∼6% deviation in 14C age, i.e., KNR166-2-26JPC for the Holocene).
Our 14C analyses were complemented by planktonic foraminiferal δ18O measurements that are strongly controlled by the density stratification of the upper water column. During all time intervals under investigation, i.e., the Holocene, HS1 and the LGM, planktonic foraminiferal δ18O signatures increase with expected modern calcification depths suggesting continuous upper-ocean stratification and broadly consistent calcification depths of the analysed foraminiferal species. In contrast, 14C ages do not consistently increase with inferred calcification depth during the analysed time slices. In particular, the deep-dwellers at the shallower core KNR166-2-26JPC within the vigorous Florida Current system showed similar 14C ages to coexisting mixed-layer planktonic foraminiferal species with an upper-thermocline maximum in 14C ages. This might be driven by stronger mixing in the upper water column in the dynamic environment of the Florida Strait, transport of allochthonous tests from other regions via currents, or the shallow water depth at core site KNR166-2-26JPC that likely puts limitations to deep calcification depths preferred by lower thermocline-calcifying planktonic foraminifera.
In contrast, 14C ages from VM12-107 from the Eastern Caribbean Sea increase with inferred calcification depths, even when effects of bioturbation after Dolman et al. (Reference Dolman, Groeneveld, Mollenhauer, Ho and Laepple2021) on planktonic foraminiferal 14C ages are considered. Thermocline- and mixed-layer calcifying foraminifera thus qualitatively represent the pre-bomb 14C profile of the upper water column at this site throughout the analyzed time interval. 14C age uncertainties, however, are too large for assessing changes in the magnitude of density stratification of the upper water column. Although a thermocline deepening in the low latitudes of the Atlantic Ocean has been independently reconstructed for HS1 and the LGM, a decrease in the 14C age offset between mixed-layer and thermocline calcifying planktonic foraminifera during HS1 cannot be identified. A larger increase in ocean reservoir ages at the thermocline likely resulted in an enhanced 14C age offset between mixed-layer and thermocline calcifying foraminifera during periods of weaker AMOC such as HS1 and LGM, masking the effect of decreased upper-ocean density stratification.
Overall, we found that mixed-layer and thermocline-calcifying planktonic foraminifera monitor Δ14C variations of the upper water column, yet the 14C signatures are possibly masked by bioturbation, selective dissolution, sample heterogeneities, variations of the calcification depths of the examined foraminiferal species, and/or analytical 14C age uncertainties. In addition, reservoir age changes, (de)glacial variations of the water depth in regions shallower than 900 m (the maximum reported habitat depth of G. crassaformis; Figure 3) and hydrographic dynamics in the water column also represent important influencing factors influencing planktonic foraminiferal 14C ages. All these factors, which are mostly dependent on the locality, should be taken into account for the interpretation of 14C ages of coexisting planktonic foraminiferal species, especially with regard to their representation of Δ14C profiles of the upper water column in the past. Our results are relevant for a regional context, whereby lessons learnt are transferable to the wider ocean region.
The main obstacle to decipher robust 14C ages from mono-specific planktonic foraminifera is the analytical measurement uncertainty, in particular when considering sample heterogeneities introduced by bioturbation. It is recommended, that future attempts of reconstructing calcification depth related 14C age gradients in the past should in the first place focus on increasing the sample sizes, while analysing abundance peaks of the planktonic foraminiferal species under investigation, where possible, and choosing high sedimentation rates sites (>10 cm/kyr) in order to lower the effects of bioturbation. Further, only sediment cores sites that cover the full habitat depth range of deep-calcifying foraminifera (e.g., down to 900 m for G. crassaformis) and that are not situated within a vigorous dynamical hydrographic setting should be involved, in order to avoid potential bias that may plague our core site KNR166-2-26JPC.
Supplementary material
For supplementary material accompanying this paper visit https://doi.org/10.1017/RDC.2023.69
ACKNOWLEDGMENTS
JL and AB were financially supported by the German Research Foundation (DFG grants LI1815/8, BA3809/12 and LI1815/4). We thank Antje Voelker and two anonymous reviewers for valuable suggestions and comments.


 Open access