


1. Introduction
Correlated and/or longitudinal count data, in which there may be correlation between successive observations, have traditionally been addressed using a generalized linear mixed model and specifying expected random effects. In this situation, univariate counts are often handled with the negative binomial distribution, and overdispersion is considered using gamma random effects. However, longitudinal count data commonly exhibit both correlation and overdispersion simultaneously, and so an analytical methodology that can account for both phenomena is required. As is well-known, overdispersion is caused by the presence of a positive correlation between responses or by an excessive variation between response counts.
However, autocorrelation can also occur in cross-sectional data when the observations are related in some other way. In a survey, for instance, one might expect people from nearby geographic locations to provide more similar answers to each other than people who are more geographically distant. Likewise, students from the same class might perform more comparably than those in different courses. Thus, autocorrelation can occur if observations depend on aspects other than time. It is essential to be aware of this consideration in conventional analyses, such as regression, in which the independence of observations is assumed.
Traditionally, models that are used to manage cross-sectional data assume independence between the variables in question. Realistically, however, the observations are often correlated to some degree. For example, following the line indicated by de Jong and Heller (Reference de Jong and Heller2008), and with specific reference to automobile insurance, claims are based on data collection during successive periods, usually four or five years. On the one hand, the data collected may, in some cases, belong to the same policyholder. A bad driver will tend to have more claims in successive years, while the opposite is true for a good one. On the other hand, the data may correspond to different persons who usually drive in the same geographical area and may have a similar pattern of claims. As de Jong and Heller (Reference de Jong and Heller2008, p. 130) point out, failure to take into account the correlation or otherwise of the data may lead to erroneous conclusions being drawn from the model.
Correlated count data distributions have practical applications in various fields, such as insurance, telecommunications, and healthcare. Specific implementations have been highlighted in various studies: in network congestion analysis, modeling network congestion with a Poisson model helps optimize packet throughput and manage network performance efficiently (Jahan et al. (Reference Jahan, Siddika, Chowdhury and Islam2018)); in insurance risk modeling, this approach facilitates the understanding of dependencies between insurance claims, and expedites premium calculations and risk assessment (Sakhaei & Nasiri, Reference Sakhaei and Nasiri2020; Valdez, Reference Valdez2013); and in the interpretation of healthcare data, it helps account for dependencies and overdispersion in study cohorts (Pittman et al., Reference Pittman, Buta, Garrison and Gueorguieva2023).
Estimating dependencies and handling complexities such as zero inflation and overdispersion present major difficulties. Some studies address this issue by utilizing advanced statistical models and computational techniques. However, these methods are subject to significant drawbacks: 1. This data type often exhibits overdispersion, excess zeros, and heterogeneity. 2. Biased estimates of covariate effects may result from disregarding these characteristics. 3. Traditional zero-inflated Poisson (ZIP) models with random effects can analyze such data, but they provide subgroup interpretations instead of overall population mean inferences. 4. Marginalized ZIP models address this limitation but may not account for overdispersion and heterogeneity.
In view of these considerations, researchers should carefully consider the statistical methods used to analyze longitudinal count data in order to ensure the results obtained are accurate and meaningful.
For example, such situations may arise during the analysis of dental caries data. Using data from the BELCAP study (Belo Horizonte caries prevention study), Böhning et al. (Reference Böhning, Dietz and Schlattmann1999) found that the ZIP model explained $90\%$
of the overdispersion, providing a better fit to the data than the homogeneous Poisson model. This study also emphasized the importance of considering zero inflation in count data and highlighted the usefulness of the ZIP model in dental epidemiology. A dental piece with caries might transmit the disease to neighboring teeth, and so the correlation is plausible. In a related study, Ghasemi et al. (Reference Ghasemi, Zayeri, Pourhoseingholi and Safavi2020) presented the doubly inflated Poisson (DIP) model for correlated count data, which addresses the two-point inflation problem (located both at zero and also at a non-zero value). This extended the traditional DIP model by including a random effect to handle the correlation structure in the data. The proposed model was subsequently applied to a real dental health dataset from Iran. The results obtained underscore the usefulness of this method for analyzing count data with two-point inflation.
$90\%$
of the overdispersion, providing a better fit to the data than the homogeneous Poisson model. This study also emphasized the importance of considering zero inflation in count data and highlighted the usefulness of the ZIP model in dental epidemiology. A dental piece with caries might transmit the disease to neighboring teeth, and so the correlation is plausible. In a related study, Ghasemi et al. (Reference Ghasemi, Zayeri, Pourhoseingholi and Safavi2020) presented the doubly inflated Poisson (DIP) model for correlated count data, which addresses the two-point inflation problem (located both at zero and also at a non-zero value). This extended the traditional DIP model by including a random effect to handle the correlation structure in the data. The proposed model was subsequently applied to a real dental health dataset from Iran. The results obtained underscore the usefulness of this method for analyzing count data with two-point inflation.
Another scenario in which correlated count data could be present is that of the number of claims referenced in an automobile insurance portfolio. The existence of previous claims made, or their absence, may reflect the possibility of future claims being presented, reflecting the quality of driving (low or high, respectively) by the policyholder. Furthermore, most automobile insurance portfolios are characterized by overdispersion (i.e., the variance is significantly greater than the mean), which is associated with the presence of correlation between successive events Drezner and Farnum (Reference Drezner and Farnum1994).
In this paper, we present a detailed review of the correlated Poisson distribution (CPD). This is a generalization of the Poisson distribution proposed by Drezner and Farnum (Reference Drezner and Farnum1994), with which we can model the existence of a correlation between the successive events under study and, therefore, the degree of dependence between them. This distribution warrants careful study because, to our knowledge, its usefulness has not actually been questioned since its initial publication. For instance, Katahira et al. (Reference Katahira, Nishikawa, Okanoya and Okada2010) presented a method for analyzing activity patterns in multiple neurons using hidden Markov models with a CPD. Compared to the independent Poisson models previously used, the CPD offers a more realistic means of reflecting complex dependencies between neuron spikes.
The CPD has an additional parameter that allows dependence between successive observations of the phenomenon under study. When the correlation is zero, the classical Poisson distribution is obtained. Its generating function of moments is expressed in closed terms, which means that moments of any order can be obtained. The distribution is generated in a similar way to that used by Woodbury (Reference Woodbury1949) to generate the correlated Bernoulli distribution. Its main shortcoming is that the probability function is expressed in a recursive form. However, with the computing power currently available, this is not an insurmountable problem. The distribution is thick-tailed, apparently unimodal, and positively skewed. Moreover, it provides simple expressions for estimating the parameters of the model. Given these characteristics, the CPD can be added to the catalog of generalizations of the Poisson distribution, such as the generalized Poisson distribution (Consul & Mittal, Reference Consul and Mittal1973), the hyper-Poisson distribution (Bardwell & Crow, Reference Bardwell and Crow1964), and the Poisson-Goncharov distribution (Denuit, Reference Denuit1997).
The rest of this paper is structured as follows. The CPD and some of its main properties are presented in Section 2. Some properties that were not studied in the original paper on the CPD are discussed in Section 3. In Section 4, we propose some estimation methods, after which we present some numerical applications. Bivariate and random-effects models are suggested in Section 6. Finally, Section 7 summarizes the main conclusions drawn and presents some ideas for further research in this field.
2. The correlated Poisson distribution
In this section, we introduce the basic properties of the CPD. Drezner and Farnum (Reference Drezner and Farnum1993, Reference Drezner and Farnum1994) provide a generalization of the binomial and Poisson distributions, in which there may be dependence between successive events, with possible non-zero correlation between them. Let us recall that a random variable $X$
taking values in
$X$
taking values in $\{0,1,\ldots \}$
follows a Poisson distribution with mean
$\{0,1,\ldots \}$
follows a Poisson distribution with mean $\lambda \gt 0$
if its probability function is given by
$\lambda \gt 0$
if its probability function is given by
 \begin{eqnarray} \Pr (X=x;\,\lambda )=\frac {\lambda ^x \exp (-\lambda )}{x!},\quad x=0,1,\ldots \end{eqnarray}
The Poisson distribution describes random independent events, and has traditionally been used in actuarial statistics with respect to automobile insurance claims. Nevertheless, empirical analysis generally rejects the Poisson model due to its excessive simplicity (depending on a single parameter) and because it is equidispersed (i.e., the mean equals the variance). Furthermore, in many practical situations, the events under study exhibit varying degrees of correlation, which a statistical distribution should adequately reflect. Unfortunately, the literature on such models is sparse due to the considerable computational problems involved in their implementation.
Taking into account the above comments, we consider the CPD introduced in Drezner and Farnum (Reference Drezner and Farnum1994), whose probability function is given by
 \begin{eqnarray} \Pr (X=x;\,\lambda ,\theta )=\exp [-\lambda (1-\theta )]\sum _{j=0}^{x}a_{xj}(\lambda ,\theta ),\quad x=0,1,\ldots , \end{eqnarray}
where $\lambda \gt 0$
and
$\lambda \gt 0$
and $a_{xj}(\lambda ,\theta )$
are calculated by the recurrence relation of order one given by
$a_{xj}(\lambda ,\theta )$
are calculated by the recurrence relation of order one given by
 \begin{eqnarray} a_{xk}(\lambda ,\theta )=\frac {\lambda (1-\theta )a_{x-1,k-1}(\lambda ,\theta )+\theta (x-1)a_{x-1,k}(\lambda ,\theta )}{k+x\theta }, \end{eqnarray} $k\in \{0,1,2,\ldots \}$
, with
$k\in \{0,1,2,\ldots \}$
, with $a_{00}(\lambda ,\theta )=1$
, and boundary conditions
$a_{00}(\lambda ,\theta )=1$
, and boundary conditions $a_{rs}(\lambda ,\theta )=0$
if either
$a_{rs}(\lambda ,\theta )=0$
if either $r=-1$
or
$r=-1$
or $s=-1$
or
$s=-1$
or $s\gt r$
. Furthermore, the parameter
$s\gt r$
. Furthermore, the parameter $\theta$
, which measures the correlation levels, can take values in the interval
$\theta$
, which measures the correlation levels, can take values in the interval $[0,1]$
. Observe that from (3) it holds that
$[0,1]$
. Observe that from (3) it holds that $a_{x0}(\lambda ,\theta )=0$
for
$a_{x0}(\lambda ,\theta )=0$
for $x\geq 1$
. Then, the expression
$x\geq 1$
. Then, the expression $\theta =0$
given in (2) reduces to expression (1). Henceforth, in this paper, when a discrete random variate follows the probability function given in (2), we write
$\theta =0$
given in (2) reduces to expression (1). Henceforth, in this paper, when a discrete random variate follows the probability function given in (2), we write $X\sim \mbox{CPD}(\lambda ,\theta )$
.
$X\sim \mbox{CPD}(\lambda ,\theta )$
.
From (2) and (3), it is derived that $\Pr (X=0;\,\lambda ,\theta )=\exp [-\lambda (1-\theta )]$
which is larger than
$\Pr (X=0;\,\lambda ,\theta )=\exp [-\lambda (1-\theta )]$
which is larger than $\exp (-\lambda )$
, the value of (1) at
$\exp (-\lambda )$
, the value of (1) at $x=0$
. Furthermore, it is readily apparent that (2) increases with
$x=0$
. Furthermore, it is readily apparent that (2) increases with $\theta$
and decreases with
$\theta$
and decreases with $\lambda$
.
$\lambda$
.
Theorem 1 (Drezner & Farnum, Reference Drezner and Farnum1994).
-
(i) The expression given in (2) is a genuine probability function. That is,
 \begin{equation*}\sum _{x=0}^{\infty }\Pr (X=x;\,\lambda ,\theta )=1.\end{equation*}
-
(ii)
$\mathbb{E}(X^k;\,\lambda ,\theta )\lt \infty$
if
$\theta \lt 1/k$
,
$k=1,2,\ldots$
-
(iii)
$\mathbb{E}(X;\,\lambda ,\theta )=\lambda$
. -
(iv)
$var(X;\,\lambda ,\theta ) = \mu _2= \lambda /(1-2\theta )$
for
$\theta \lt 1/2$
and infinite otherwise. -
(v) Skewness and excess kurtosis are given by
(4)
\begin{eqnarray} \tilde \mu _3 &=& \frac {\mu _3}{(\mu _2)^{3/2}}=\frac {1+\theta }{1-3\theta }\sqrt {\frac {1-2\theta }{\lambda }},\quad \theta \lt 1/3, \end{eqnarray}
(5)respectively. Here,
\begin{eqnarray} \tilde \mu _4 &=& \frac {\mu _4}{(\mu _2)^2}= \frac {(1+5\theta )(1-2\theta )}{\lambda (1-3\theta )(1-4\theta )},\quad \theta \lt 1/4, \end{eqnarray}
$\mu _3=\mathbb{E}[(X-\mu )^3]$
and
$\mu _4=\mathbb{E}[(X-\mu )^4]$
(see Drezner and Farnum (Reference Drezner and Farnum1994)).


Note that $\theta \lt 1/2$
can also be seen as a precision parameter since the more significant this value, the larger the variance of
$\theta \lt 1/2$
can also be seen as a precision parameter since the more significant this value, the larger the variance of $X$
, i.e., the degree of overdispersion.
$X$
, i.e., the degree of overdispersion.
3. New properties of the correlated Poisson distribution
As pointed out by Drezner and Farnum (Reference Drezner and Farnum1994), the $k$
-th moment of this distribution exists only for
$k$
-th moment of this distribution exists only for $\theta \lt k^{-1}$
. These authors also observed that the distribution can be constructed in the same way as the classical Poisson distribution, apart from the independence of events.
$\theta \lt k^{-1}$
. These authors also observed that the distribution can be constructed in the same way as the classical Poisson distribution, apart from the independence of events.
Since the index of dispersion, $\mbox{ID}=var(X)/\mathbb{E}(X)=1/(1-2\theta )\gt 1$
, for
$\mbox{ID}=var(X)/\mathbb{E}(X)=1/(1-2\theta )\gt 1$
, for $\theta \lt 1/2$
the distribution shows overdispersion. This is a common property in actuarial count data and elsewhere. Figure 1 shows that the CPD can be used to model discrete data related to Poisson-type counting processes. The inclusion of the parameter
$\theta \lt 1/2$
the distribution shows overdispersion. This is a common property in actuarial count data and elsewhere. Figure 1 shows that the CPD can be used to model discrete data related to Poisson-type counting processes. The inclusion of the parameter $\theta$
allows us to adjust for deviations not considered by the standard Poisson model (case
$\theta$
allows us to adjust for deviations not considered by the standard Poisson model (case $\theta =0$
). Note that in all cases considered, the distribution presents heavier tails than the Poisson distribution. Therefore, the model is suitable for modeling scenarios where the empirical distribution of the data exhibits heavy tails.
$\theta =0$
). Note that in all cases considered, the distribution presents heavier tails than the Poisson distribution. Therefore, the model is suitable for modeling scenarios where the empirical distribution of the data exhibits heavy tails.
Comparison of the Poisson distribution (case $\theta =0$
) and the correlated Poisson distribution for selected values of
$\theta =0$
) and the correlated Poisson distribution for selected values of $\lambda$
and
$\lambda$
and $\theta$
.
$\theta$
.

Some important indices of the shape of the distribution, apart from the mean and the variance, are the skewness and the kurtosis, given in (4) and (5), respectively. Figure 2 shows the skewness and kurtosis of the CPD versus the Poisson distribution. It can be seen that for the proposed distribution, both values are always larger than those for the Poisson distribution. Both indices increase with $\theta$
and decrease with
$\theta$
and decrease with $\lambda$
.
$\lambda$
.
Skewness and kurtosis of the correlated Poisson distribution.

Drezner and Farnum (Reference Drezner and Farnum1994) have shown that the moment-generating function (MGF) of the CPD is given by
 \begin{eqnarray} M_X(t;\,\lambda ,\theta )=\exp \left [\lambda (1-\theta )\sum _{j=1}^{\infty }\frac {\varphi (t)^j}{1-j\theta }\right ], \end{eqnarray}
where $\varphi (t)=1-\exp (-t)$
. Since
$\varphi (t)=1-\exp (-t)$
. Since
 \begin{eqnarray*} \sum _{j=1}^{\infty }\frac {\varphi (t)^j}{1-j\theta }=\varphi (t)\sum _{i=0}^{\infty }\frac {\varphi (t)^i}{1-(i+1)\theta } =\frac {\varphi (t)}{1-\theta }\,_2F_1(1,1-1/\theta ;\,2-1/\theta ;\,\varphi (t)), \end{eqnarray*}
where $_2F_1$
represents the hypergeometric function, the MGF can be expressed in terms of this special function as
$_2F_1$
represents the hypergeometric function, the MGF can be expressed in terms of this special function as
 \begin{eqnarray} M_X(t;\,\lambda ,\theta )=\exp \left [\lambda \;\varphi (t)\,_2F_1(1,1-1/\theta ;\,2-1/\theta ;\,\varphi (t))\right ]. \end{eqnarray}
Now, row moments of any orders can be computed from (6). From (6), it is also possible to derive the cumulant-generating function and the probability-generating function (pgf), thereby providing the factorial moments of the distribution.
From (7) we can directly obtain the cumulant-generating function, which is given by
 \begin{eqnarray*} K_X(t;\,\lambda ,\theta )=\log M_X(t;\,\lambda ,\theta )= \lambda \;\varphi (t)\,_2F_1(1,1-1/\theta ;\,2-1/\theta ;\,\varphi (t)). \end{eqnarray*}
On some occasions, statistical models can be used to reflect the property of conservation despite the addition of independent effects. For example, many types of insurance coverage are based on counts obtained from various independent coverages, if they are considered equivalent to one other. For example, this would be the case if the underwriter believed that a particular parametric model adequately described these counts. In this case, it is reasonable to assume that the same model validly describes the aggregate one. Expression (7) can also produce the following.
Proposition 1. If $X_i\sim \mbox{CPD}(\lambda _i,\theta )$
,
$X_i\sim \mbox{CPD}(\lambda _i,\theta )$
, $i=1,2,\ldots ,n$
are
$i=1,2,\ldots ,n$
are $n$
independent CPDs sharing the same parameter
$n$
independent CPDs sharing the same parameter $\theta$
, then the random variable
$\theta$
, then the random variable $S=\sum _{i=1}^{n}X_i$
follows a CPD with parameters
$S=\sum _{i=1}^{n}X_i$
follows a CPD with parameters $\theta$
and
$\theta$
and $\tilde \lambda$
, where
$\tilde \lambda$
, where $\tilde \lambda =\sum _{i=1}^{n}\lambda _i$
, that is
$\tilde \lambda =\sum _{i=1}^{n}\lambda _i$
, that is $S\sim \mbox{CPD}(\tilde \lambda ,\theta )$
.
$S\sim \mbox{CPD}(\tilde \lambda ,\theta )$
.
The following result can be used to approximate CPD probabilities using the normal distribution. Its proof is provided in Appendix A.
Proposition 2. Let $X \sim \text{CPD}(\lambda , \theta ),$
with
$X \sim \text{CPD}(\lambda , \theta ),$
with $\mathbb{E}(X) = \lambda$
and
$\mathbb{E}(X) = \lambda$
and $ \text{var}(X) = \frac {\lambda }{1-2\theta }.$
Given
$ \text{var}(X) = \frac {\lambda }{1-2\theta }.$
Given $0\leq \theta \lt 1/2$
, consider the standardization of the random variable
$0\leq \theta \lt 1/2$
, consider the standardization of the random variable $X$
given by
$X$
given by
 \begin{eqnarray*} Y_{\lambda } = \frac {X-\lambda }{\sqrt {\frac {\lambda }{1-2\theta }}} = \sqrt {1-2 \theta } \; \frac {X-\lambda }{\sqrt {\lambda }}. \end{eqnarray*}
Then, $\displaystyle Y_{\lambda } \stackrel {L}{\longrightarrow } Z$
as
$\displaystyle Y_{\lambda } \stackrel {L}{\longrightarrow } Z$
as $\lambda \to +\infty ,$
where
$\lambda \to +\infty ,$
where $Z$
is
$Z$
is $\mathcal{N}(0,1)$
and "
$\mathcal{N}(0,1)$
and " $\stackrel {L}{\longrightarrow }$
” means converges in law.
$\stackrel {L}{\longrightarrow }$
” means converges in law.
It is well-known that the Poisson, geometric, and negative binomial distributions are infinitely divisible, and as we will see in the next result, the CPD also has this property.
Proposition 3. The CPD is infinitely divisible.
Proof. From (7), it follows that the pgf (pgf) of the CPD can be written as
 \begin{eqnarray} G_X(z;\,\lambda ,\theta )=\sum _{z=0}^{\infty }z^x\Pr (X;\,\lambda ,\theta )=\exp \left [\lambda \upsilon (z,\theta )\right ],\;|z|\leq 1, \end{eqnarray}
where
 \begin{eqnarray*} \upsilon (z,\theta )=\frac {(1-\theta )(1-z)}{z\theta }\Phi \left (1-1/z,1,1-1/\theta \right ) \end{eqnarray*}
and where $\Phi (z,s,a)=\sum _{j=0}^{\infty }z^j/(a+j)^s$
is the Lerch transcendent function. Because
$\Phi (z,s,a)=\sum _{j=0}^{\infty }z^j/(a+j)^s$
is the Lerch transcendent function. Because
 \begin{eqnarray*} \exp \left [\lambda \upsilon (z,\theta )\right ]= \left \{\exp \left [\frac {\lambda }{n} \upsilon (z,\theta )\right ]\right \}^n \end{eqnarray*}
for any positive integer $n$
, we conclude that the distribution is infinitely divisible.
$n$
, we conclude that the distribution is infinitely divisible.
Descendent factorial moments can be obtained from (8) by taking the limit when $z$
tends to 1. Using Lévy’s Theorem (see for instance, Feller (Reference Feller1957)) the pgf given in (8) can be written as
$z$
tends to 1. Using Lévy’s Theorem (see for instance, Feller (Reference Feller1957)) the pgf given in (8) can be written as $G_X(z)=\exp \left \{\lambda \left [g(z)-1\right ]\right \}$
, where
$G_X(z)=\exp \left \{\lambda \left [g(z)-1\right ]\right \}$
, where $g(z)$
is another pgf.
$g(z)$
is another pgf.
Therefore, as mentioned in the previous section, we have $\Pr (0;\,\lambda ,\theta )\gt 0$
. The infinitely divisible distribution plays an important role in many areas of statistics, such as stochastic processes and actuarial statistics. When a distribution
$\Pr (0;\,\lambda ,\theta )\gt 0$
. The infinitely divisible distribution plays an important role in many areas of statistics, such as stochastic processes and actuarial statistics. When a distribution $G$
is infinitely divisible then for any integer
$G$
is infinitely divisible then for any integer $n \geq 2$
, there exists a distribution
$n \geq 2$
, there exists a distribution $G_n$
such that
$G_n$
such that $G$
is the
$G$
is the $n$
-fold convolution of
$n$
-fold convolution of $G_n$
, namely,
$G_n$
, namely, $G = G_n^{\ast n}$
. Johnson et al. (Reference Johnson, Kemp and Kotz2005, p. 363) pointed out that an infinitely divisible distribution with nonnegative support can be interpreted as a stopped sum of Poisson distributions, i.e., as the sum of
$G = G_n^{\ast n}$
. Johnson et al. (Reference Johnson, Kemp and Kotz2005, p. 363) pointed out that an infinitely divisible distribution with nonnegative support can be interpreted as a stopped sum of Poisson distributions, i.e., as the sum of $N$
independent and identically distributed random variables, where
$N$
independent and identically distributed random variables, where $N$
has a Poisson distribution. Thus, an infinitely divisible distribution can be expressed as a compound Poisson distribution (see Feller (Reference Feller1957)). As with the Poisson distribution, the CPD satisfies that
$N$
has a Poisson distribution. Thus, an infinitely divisible distribution can be expressed as a compound Poisson distribution (see Feller (Reference Feller1957)). As with the Poisson distribution, the CPD satisfies that $\Pr (X;\,\lambda ,\theta )\lt \exp (-1)$
(see Steuel and van Harn (Reference Steuel and van Harn2004)). Furthermore, the CPD has an arbitrarily thick tail that cannot be thinner than the Poissonian tails.
$\Pr (X;\,\lambda ,\theta )\lt \exp (-1)$
(see Steuel and van Harn (Reference Steuel and van Harn2004)). Furthermore, the CPD has an arbitrarily thick tail that cannot be thinner than the Poissonian tails.
Sundt (Reference Sundt2000) pointed out that the elements of a random vector with infinitely divisible distribution on $\{0,1,\ldots \}$
are nonnegative correlated, which is coherent with the correlation given by the CPD.
$\{0,1,\ldots \}$
are nonnegative correlated, which is coherent with the correlation given by the CPD.
Proposition 4. There exists a process with stationary independent increments associated with the CPD.
Proof. The result follows by taking into account that the CPD is infinitely divisible (see Steuel and van Harn (Reference Steuel and van Harn2004, Chapter II) and Panjer and Willmot (Reference Panjer and Willmot1983, Theorem 5)).
Finally, since the distribution is infinitely divisible, a lower bound for the variance can be obtained (see Johnson and Kotz (Reference Johnson and Kotz1982, p. 75)), that is, $var(X)\geq p_1/p_0$
.
$var(X)\geq p_1/p_0$
.
3.1 Stochastic ordering
Many families of distributions can be ordered according to the value of their parameters. If the random variate $X$
dominates the random variate
$X$
dominates the random variate $Y$
, then
$Y$
, then $F_Y(y)\leq F_X(x)$
, where
$F_Y(y)\leq F_X(x)$
, where $F$
is the cumulative distribution function and
$F$
is the cumulative distribution function and $M_X(t)\leq M_Y(t)$
, and this is considered a first order dominance. Unfortunately, the reverse implication is not true, that is, the moment-generating order does not imply the cumulative distribution function order. In this section, we show that the CPD can be ordered in terms of the moment-generating order, which is defined as follows (Shaked and Shanthikumar, Reference Shaked and Shanthikumar2007, Chap. 5 and Zhang and Li, Reference Zhang and Li2010).
$M_X(t)\leq M_Y(t)$
, and this is considered a first order dominance. Unfortunately, the reverse implication is not true, that is, the moment-generating order does not imply the cumulative distribution function order. In this section, we show that the CPD can be ordered in terms of the moment-generating order, which is defined as follows (Shaked and Shanthikumar, Reference Shaked and Shanthikumar2007, Chap. 5 and Zhang and Li, Reference Zhang and Li2010).
Definition 1 (Shaked & Shanthikumar, Reference Shaked and Shanthikumar2007). Let $X$
and
$X$
and $Y$
be two nonnegative random variables such that
$Y$
be two nonnegative random variables such that $M_Y(t)\lt \infty$
. Then, if
$M_Y(t)\lt \infty$
. Then, if $M_X(t)\leq M_Y(t)$
for all
$M_X(t)\leq M_Y(t)$
for all $t\gt 0$
, we say that
$t\gt 0$
, we say that $X$
is smaller than
$X$
is smaller than $Y$
in the MGF order (denoted as
$Y$
in the MGF order (denoted as $X\leq _{\mbox{mgf}}Y$
).
$X\leq _{\mbox{mgf}}Y$
).
Proposition 5. Let $X\sim \mbox{CPD}(\lambda _1,\theta )$
and
$X\sim \mbox{CPD}(\lambda _1,\theta )$
and $Y\sim \mbox{CPD}(\lambda _2,\theta )$
. From this it follows that:
$Y\sim \mbox{CPD}(\lambda _2,\theta )$
. From this it follows that:
-
(i)
$X\leq _{\mbox{mgf}}Y$
if
$\lambda _1\leq \lambda _2$
. -
(ii)
$Y\leq _{\mbox{mgf}}X$
if
$\lambda _1\geq \lambda _2$
.


Proof. Since the exponential function is monotone, the result is obtained using (7).
Some additional properties related to the moment-generating order can be seen in Li (Reference Li2004) and Shaked and Shanthikumar (Reference Shaked and Shanthikumar2007).
3.2 Relationship with actuarial statistics
For an insurance company exposed to a risk $X$
, a premium principle (risk measure)
$X$
, a premium principle (risk measure) $H(X)$
gives the premium associated with the contract providing coverage against
$H(X)$
gives the premium associated with the contract providing coverage against $X$
(see, for instance Heilmann (Reference Heilmann1989)). The simplest premium principle is the net premium, computed as
$X$
(see, for instance Heilmann (Reference Heilmann1989)). The simplest premium principle is the net premium, computed as $H(X)=\mathbb{E}\left ( X\right )$
and also denoted as pure risk premium. Here, the random variable
$H(X)=\mathbb{E}\left ( X\right )$
and also denoted as pure risk premium. Here, the random variable $X$
can be discrete or continuous if it represents a number of claims or claim size. Nevertheless, this premium principle without any loading can be insufficient. A more useful premium calculation principle is based on the exponential utility function, which leads to the exponential premium principle, given by
$X$
can be discrete or continuous if it represents a number of claims or claim size. Nevertheless, this premium principle without any loading can be insufficient. A more useful premium calculation principle is based on the exponential utility function, which leads to the exponential premium principle, given by $H(X)=(1/\alpha )\log M_X(\alpha )$
, where
$H(X)=(1/\alpha )\log M_X(\alpha )$
, where $\alpha \gt 0$
measures the risk aversion of the insurance company. For details about this premium principle, see, for instance, Denuit (Reference Denuit1999) and Gerber and Pafumi (Reference Gerber and Pafumi1998). It is well-known that when
$\alpha \gt 0$
measures the risk aversion of the insurance company. For details about this premium principle, see, for instance, Denuit (Reference Denuit1999) and Gerber and Pafumi (Reference Gerber and Pafumi1998). It is well-known that when $\alpha \to 0$
, the exponential premium principle reduces to the net premium. From (7), if
$\alpha \to 0$
, the exponential premium principle reduces to the net premium. From (7), if $X\sim \mbox{CPD}(\lambda ,\theta )$
, an explicit expression for the premium when the exponential premium principle is used can easily be derived from (7), as follows:
$X\sim \mbox{CPD}(\lambda ,\theta )$
, an explicit expression for the premium when the exponential premium principle is used can easily be derived from (7), as follows:
 \begin{eqnarray} H(X)=\frac {\lambda \;\varphi (\alpha )}{\alpha }\,_2F_1(1,1-1/\theta ;\,2-1/\theta ;\,\varphi (\alpha )),\quad \alpha \gt 0, \end{eqnarray}
which is ordered concerning $\lambda$
.
$\lambda$
.
The Esscher principle (Heerwaarden et al., Reference Heerwaarden, Kaas and Goovaerts1989, Heilmann, Reference Heilmann1989 and Gómez-Déniz et al., Reference Gómez-Déniz, Hernández and Vázquez-Polo1999, among others) is a risk measure used in actuarial sciences that is obtained from the Esscher transform. Although this risk measure does not respect the positive homogeneity property of coherent risk measure, it is an alternative premium principle that is widely used in actuarial science. When the CPD is used as a risk $X$
, the following result is needed to get the Esscher premium:
$X$
, the following result is needed to get the Esscher premium:
Proposition 6. If $X\sim \mbox{CPD}(\lambda ,\theta )$
, it holds that
$X\sim \mbox{CPD}(\lambda ,\theta )$
, it holds that
 \begin{eqnarray} \mathbb{E}\left [X\exp (\alpha X)\right ]=\left .\frac {1}{\alpha }M_X^{\prime }(\alpha t)\right |_{t=1},\quad \alpha \gt 0, \end{eqnarray}
where $M^{\prime }_X(t)$
represents the derivative of (7) with respect to
$M^{\prime }_X(t)$
represents the derivative of (7) with respect to $t$
.
$t$
.
Proof. We have $M_X(\alpha t)=\sum _{x=0}^{\infty }\exp (\alpha t x)\Pr (X=x;\,\lambda ,\theta )$
. By taking the derivative of this expression concerning
$M_X(\alpha t)=\sum _{x=0}^{\infty }\exp (\alpha t x)\Pr (X=x;\,\lambda ,\theta )$
. By taking the derivative of this expression concerning $t$
, we have
$t$
, we have $M_X^{\prime }(\alpha t)=\alpha \sum _{x=0}^{\infty }x\exp (\alpha t x)\Pr (X=x;\,\lambda ,\theta )$
, from which by replacing
$M_X^{\prime }(\alpha t)=\alpha \sum _{x=0}^{\infty }x\exp (\alpha t x)\Pr (X=x;\,\lambda ,\theta )$
, from which by replacing $t$
by 1, the result is obtained.
$t$
by 1, the result is obtained.
The next result provides the Esscher premium for a risk following the CPD.
Proposition 7. If $X\sim \mbox{CPD}(\lambda ,\theta )$
the premium obtained under the Esscher premium principle is given by
$X\sim \mbox{CPD}(\lambda ,\theta )$
the premium obtained under the Esscher premium principle is given by
 \begin{eqnarray} H(X)= \frac {\lambda }{\theta }\left [\theta -1+\exp (-\alpha )\,_2F_1(1,1-1/\theta ;\,2-1/\theta ;\,\varphi (\alpha ))\right ],\quad \alpha \gt 0. \end{eqnarray}
Proof. Taking into account that under the Esscher principle, the premium is defined as
 \begin{eqnarray*} H(X)=\frac {\mathbb{E}\left [X\exp (\alpha X)\right ]}{\mathbb{E}\left [\exp (\alpha X)\right ]}, \end{eqnarray*}
the result follows from (7) and (10), from the fact that
 \begin{eqnarray*} \frac {d}{dz}\,_2F_1(a,b;\,c;\,z)=\frac {a b}{c}\,_2F_1(1+a,1+b;\,1+c;\,z) \end{eqnarray*}
and after some algebra.
The premiums calculated using (9) and (11) are shown in Table 1 for different values of the parameters $\lambda$
,
$\lambda$
, $\theta$
, and
$\theta$
, and $\alpha$
. Observe that the case
$\alpha$
. Observe that the case $\theta =0$
reduces to the premiums given by
$\theta =0$
reduces to the premiums given by $H(X)=(\lambda /\alpha )(\exp (\alpha )-1)$
and
$H(X)=(\lambda /\alpha )(\exp (\alpha )-1)$
and $H(X)=\lambda \exp (\alpha )$
, the exponential and Esscher premiums for the Poisson distribution. Details can be seen in Heilmann (Reference Heilmann1989). The CPD model yields higher premium values than the standard Poisson model under the exponential principle, irrespective of
$H(X)=\lambda \exp (\alpha )$
, the exponential and Esscher premiums for the Poisson distribution. Details can be seen in Heilmann (Reference Heilmann1989). The CPD model yields higher premium values than the standard Poisson model under the exponential principle, irrespective of $\alpha$
. The same comment can be applied to the Esscher principle in situations of moderate risk aversion (moderate or low values of
$\alpha$
. The same comment can be applied to the Esscher principle in situations of moderate risk aversion (moderate or low values of $\alpha$
).
$\alpha$
).
Exponential and Esscher premiums for different values of the parameters $\lambda$
,
$\lambda$
, $\theta$
, and
$\theta$
, and $\alpha$

Table 1 Long description
The table compares exponential and Esscher premiums for different values of the parameters lambda, theta, and alpha. It has two sections: Exponential principle and Esscher principle. Each section contains a table with four rows and four columns. The columns are labeled with different alpha values: 0.25, 0.50, 0.75, and 1. The rows are labeled with different lambda and theta values: (0.50, 0.30), (0.50, 0.00), (0.75, 0.45), (0.75, 0.00), (1.00, 0.00). Each cell contains a numerical value representing the premium calculated for the corresponding parameters.
In the collective risk model, we consider the random variable of the compound distribution $S=\sum _{i=1}^{X}Y_i$
and assume that
$S=\sum _{i=1}^{X}Y_i$
and assume that $Y_1, Y_2,\ldots$
are independent and identically distributed random variables which are independent of
$Y_1, Y_2,\ldots$
are independent and identically distributed random variables which are independent of $X$
. In actuarial statistics,
$X$
. In actuarial statistics, $X$
represents the number of claims, and
$X$
represents the number of claims, and $Y_i$
represents the amount of the
$Y_i$
represents the amount of the $i$
th claim . It is assumed that
$i$
th claim . It is assumed that $S=0$
if
$S=0$
if $X=0$
and then if
$X=0$
and then if $X\sim \mbox{CPD}(\lambda ,\theta )$
, we have
$X\sim \mbox{CPD}(\lambda ,\theta )$
, we have
 \begin{eqnarray*} \mathbb{E}(S) &=& \lambda \mathbb{E}(Y),\\ var(S) &=& \lambda \left [\frac {\mathbb{E}^2(Y)}{1-2\theta }+var(Y)\right ]. \end{eqnarray*}
Therefore, the mean of $S$
is equal to the mean of the compound model when the number of claims follows the classical Poisson distribution and the variance of the compound CPD increases with the correlation
$S$
is equal to the mean of the compound model when the number of claims follows the classical Poisson distribution and the variance of the compound CPD increases with the correlation $\theta$
. Furthermore, the MGF of
$\theta$
. Furthermore, the MGF of $S$
is obtained from (7) and is given by
$S$
is obtained from (7) and is given by
 \begin{eqnarray*} M_S(t)=\exp \left [\lambda \varphi (M_Y(t))\,_2F_1(1,1-1/\theta ;\,2-1/\theta ;\,\varphi (M_Y(t))\right ], \end{eqnarray*}
where $M_Y(t)$
is the MGF of the random variable
$M_Y(t)$
is the MGF of the random variable $Y$
.
$Y$
.
3.3 Including covariates
Nowadays, data in which dependencies are present are commonly analyzed by exploring correlations using count data regression models (Dean et al., Reference Dean, Lawless and Willmot1989, Shaddick et al., Reference Shaddick, Choo and Walker2007; Ma et al., Reference Ma, Hanson and Ho2020; Chowdhury and Islam, Reference Chowdhury and Islam2016; among many others) and this approach can easily be extended to include covariates, if available, as shown in the next section on applying the model to accurate data.
Generally, a set of covariates support the models that explain a random event-dependent variable. Now, let ${y_i}=(y_{1i},\ldots ,y_{pi})^{\prime }$
be a vector of
${y_i}=(y_{1i},\ldots ,y_{pi})^{\prime }$
be a vector of $p$
covariates associated with the
$p$
covariates associated with the $i$
th observation,
$i$
th observation, $i=1,2\ldots ,n$
, which is a vector of linearly independent regressors that are thought to determine the correlated event
$i=1,2\ldots ,n$
, which is a vector of linearly independent regressors that are thought to determine the correlated event $x$
. For the
$x$
. For the $i$
th observation, the model takes the form
$i$
th observation, the model takes the form
 \begin{eqnarray} X_i & \sim & \mbox{CPD}(\lambda _i,\theta ),\nonumber \\ \log (\lambda _i) & = & \log E_i+ y_{i}^{\prime }{\boldsymbol \beta },\quad i=1,2,\ldots ,n, \end{eqnarray}
where $n$
denotes the number of observations and
$n$
denotes the number of observations and ${\boldsymbol \beta }=(\beta _1,\ldots ,\beta _p)^{\prime }$
is the corresponding vector of regression coefficients. We allow the mean to depend on the number of years of observation during the exposure (in years),
${\boldsymbol \beta }=(\beta _1,\ldots ,\beta _p)^{\prime }$
is the corresponding vector of regression coefficients. We allow the mean to depend on the number of years of observation during the exposure (in years), $E_i$
, also known as offset. Observe that the log-link assumed ensures that
$E_i$
, also known as offset. Observe that the log-link assumed ensures that $\lambda _i$
falls within the interval
$\lambda _i$
falls within the interval $(0,\infty )$
.
$(0,\infty )$
.
One of the advantages of regression analysis is that it enables us to study the marginal effect, which reflects the variation of the conditional mean of $X$
due to a one-unit change in the
$X$
due to a one-unit change in the $j$
-th covariate, and is calculated as
$j$
-th covariate, and is calculated as $\partial \lambda _j/\partial y_j=\beta _j\lambda _j\approx \beta _j\bar \lambda _j$
,
$\partial \lambda _j/\partial y_j=\beta _j\lambda _j\approx \beta _j\bar \lambda _j$
, $\bar \lambda _j=\sum _{j=1}^{n}\lambda _j/n$
, for a continuous variable and
$\bar \lambda _j=\sum _{j=1}^{n}\lambda _j/n$
, for a continuous variable and $\exp (\beta _j)$
for a dichotomous one (i.e., which only has the value 0 or 1), interpreted in terms of the odds ratio.
$\exp (\beta _j)$
for a dichotomous one (i.e., which only has the value 0 or 1), interpreted in terms of the odds ratio.
4. Estimation of parameters
In this section, we consider different methods to estimate the two parameters of the distribution, assuming a sample $\tilde x=(x_1,\ldots ,x_n)$
of size
$\tilde x=(x_1,\ldots ,x_n)$
of size $n$
is taken from a correlated Poisson population given in (2).
$n$
is taken from a correlated Poisson population given in (2).
4.1 Moments method
Moment estimates can be obtained by equating the sample and theoretical moments. In this case, the mean and variance of the distribution are used to derive the moment estimators of the parameters given by
 \begin{eqnarray*} \widehat \lambda =\bar x,\quad \widehat \theta =\frac {\tilde s^2-\bar x}{2 \tilde s^2}, \end{eqnarray*}
where $\bar x$
and
$\bar x$
and $\tilde s^2$
are the common unbiased estimates of the mean and variance of the population, respectively.
$\tilde s^2$
are the common unbiased estimates of the mean and variance of the population, respectively.
4.2 Mean and zero proportion method
A different approach is needed to estimate the parameters when the distribution has unique features. In this case, the zero proportion method tends to work well when the mode of the distribution has the value zero, and the proportion of zeros is relatively high (see for instance Alanko and Duffy (Reference Alanko and Duffy1996) and Gómez-Déniz et al. (Reference Gómez-Déniz, Sarabia, Pérez-Sánchez and Vázquez-Polo2008)). The CPD depends on two parameters, and therefore, two equations are needed to estimate the parameters.
The population proportion of zeros is given by $p_0=\exp [-\lambda (1-\theta )]$
. Now, by equating this population proportion to the sample one,
$p_0=\exp [-\lambda (1-\theta )]$
. Now, by equating this population proportion to the sample one, $\tilde p_0$
and the sample mean, say
$\tilde p_0$
and the sample mean, say $\bar x=\sum _{i=1}^n x_i$
, where
$\bar x=\sum _{i=1}^n x_i$
, where $n$
is the sample size, to the population mean, some simple manipulation reveals that the estimated parameters are given by
$n$
is the sample size, to the population mean, some simple manipulation reveals that the estimated parameters are given by
 \begin{eqnarray*} \lambda = \bar x,\quad \theta = 1+\frac {1}{\bar x}\log \tilde p_0. \end{eqnarray*}
4.3 Maximum likelihood method
The parameters for the CPD can also be estimated by the maximum likelihood method. Denoting the parameters of the distribution by $\Omega =(\lambda ,\theta )$
, the log-likelihood function is given by
$\Omega =(\lambda ,\theta )$
, the log-likelihood function is given by
 \begin{eqnarray*} \ell (\tilde x;\,\Omega )=-n\lambda (1-\theta )+\sum _{i=1}^{n}\log \sum _{j=0}^{x_i}a_{x_ij}(\lambda ,\theta ). \end{eqnarray*}
The normal equations which provide the maximum likelihood estimators of the parameters are:
 \begin{eqnarray} \frac {\partial \ell (\tilde x;\,\Omega )}{\partial \lambda } &=& -n(1-\theta )+\sum _{i=1}^{n}\frac {1}{\sum _{j=0}^{x_i}a_{x_ij}(\lambda ,\theta )} \sum _{j=0}^{x_i}\frac {\partial a_{x_ij}(\lambda ,\theta )}{\partial \lambda } = 0, \end{eqnarray}
 \begin{eqnarray} \frac {\partial \ell (\tilde x;\,\Omega )}{\partial \theta } &=& n\lambda +\sum _{i=1}^{n}\frac {1}{\sum _{j=0}^{x_i}a_{x_ij}(\lambda ,\theta )} \sum _{j=0}^{x_i}\frac {\partial a_{x_ij}(\lambda ,\theta )}{\partial \theta } = 0. \end{eqnarray}
Evidently, the maximum likelihood estimator solutions to equations (13) and (14) cannot be obtained in a closed form except in the Poisson case (i.e., $\theta =0$
). Then, the above nonlinear system of equations can be solved iteratively using the Newton-Raphson method, a process that involves complex numerical computation. For the model with covariates, we replace (13) by
$\theta =0$
). Then, the above nonlinear system of equations can be solved iteratively using the Newton-Raphson method, a process that involves complex numerical computation. For the model with covariates, we replace (13) by
 \begin{eqnarray*} \frac {\partial \ell (\tilde x;\,\theta ,\boldsymbol{\beta })}{\partial \beta _r}=\frac {\partial \ell (\tilde x;\,\theta ,\boldsymbol{\beta })}{\partial \lambda _i({y})}x_{ir}\lambda _i({y}),\quad r=1,2,\ldots ,p, \end{eqnarray*}
where $\lambda _i({y})=E_i\exp (y_{i}^{\prime }{\boldsymbol \beta })$
,
$\lambda _i({y})=E_i\exp (y_{i}^{\prime }{\boldsymbol \beta })$
, $i=1,2,\ldots ,n$
.
$i=1,2,\ldots ,n$
.
4.4 Model with inflation at zero
It is well-known that insurance datasets often contain many zeros, a situation that can be modeled by using zero-inflated and hurdle models. See, for instance Boucher et al. (Reference Boucher, Denuit and Guillén2007).
We can divide the claims process into two parts. In the first stage, there are no claims, and the second part provides the intensity of the claims. On the one hand, this can be made by the zero-inflated model, with probability mass function given by,
 \begin{eqnarray} g(x;\,\lambda ,\theta ,\phi )= \left \{ \begin{array}{lr} 1-\phi +\phi \, p(0;\,\lambda ,\theta ),& x=0,\\ \phi \, p(x;\,\lambda ,\theta ),& x\gt 0, \end{array} \right . \end{eqnarray}
where $p(\cdot ;\,\lambda ,\theta )$
is the probability mass function given in (2). In fact, (15) can be seen as a mixture of two distributions, a degenerate distribution for the zero case and a standard count distribution.
$p(\cdot ;\,\lambda ,\theta )$
is the probability mass function given in (2). In fact, (15) can be seen as a mixture of two distributions, a degenerate distribution for the zero case and a standard count distribution.
On the other hand, a hurdle-at-zero model has a probability mass function given by,
 \begin{eqnarray} g(x;\,\lambda ,\theta ,\varphi )= \left \{ \begin{array}{lr} 1-\varphi ,& x=0,\\ \frac {\varphi }{1- p(0;\,\lambda ,\theta )}p(x;\,\lambda ,\theta ),& x\gt 0, \end{array} \right . \end{eqnarray}
where $p(0;\,\lambda ,\theta )=\exp [-\lambda (1-\theta )]$
and
$p(0;\,\lambda ,\theta )=\exp [-\lambda (1-\theta )]$
and $\varphi \in [0,1]$
. The major advantage of the hurdle model over the zero-inflated model, besides being easier to understand, is that the parameters for its two parts are distinct and can be estimated separately. This allows for the maximization of the log-likelihood function to be performed separately for each part. Note that the hurdle model is a special case of the zero-inflated model by taking
$\varphi \in [0,1]$
. The major advantage of the hurdle model over the zero-inflated model, besides being easier to understand, is that the parameters for its two parts are distinct and can be estimated separately. This allows for the maximization of the log-likelihood function to be performed separately for each part. Note that the hurdle model is a special case of the zero-inflated model by taking $\varphi =(1-p(0;\,\lambda ,\theta ))\phi$
. In (15),
$\varphi =(1-p(0;\,\lambda ,\theta ))\phi$
. In (15), $\phi$
is a weight parameter controlling the degree of zero inflation. In contrast, in (16),
$\phi$
is a weight parameter controlling the degree of zero inflation. In contrast, in (16), $\varphi$
is the probability of crossing the hurdle, i.e., the probability of reporting at least one claim.
$\varphi$
is the probability of crossing the hurdle, i.e., the probability of reporting at least one claim.
Of course, covariates may be included in both inflated models through $\phi$
(or
$\phi$
(or $\varphi$
) and
$\varphi$
) and $\lambda$
.
$\lambda$
.
Observed and fitted frequencies in six automobile insurance portfolios

Table 2 Long description
The table presents observed and fitted frequencies in six automobile insurance portfolios across different countries and years. It includes data for Belgium (1958), Zaire (1974), Belgium (1975-76), Great Britain (1968), Germany (1960), and Switzerland (1961). The table is divided into sections for each country and year, with columns for count, observed frequencies, and fitted CPD frequencies. Each section lists the counts from 0 to 7, along with the corresponding observed and fitted frequencies. Additionally, the table includes estimated parameters and diagnostic statistics for each portfolio, such as lambda, theta, MEAC, chi-square, degrees of freedom, and p-value. The data is presented row-wise, with each row corresponding to a specific count and its observed and fitted frequencies.
5. Applications
In this section, we examine two applications to illustrate how the CPD works. The recursive expression of the $a_{xk}(\lambda ,\theta )$
values requires intensive computation. A code written with Mathematica shows excellent performance in the examples presented in this section. Given their simplicity, such models are intriguing for practical purposes.
$a_{xk}(\lambda ,\theta )$
values requires intensive computation. A code written with Mathematica shows excellent performance in the examples presented in this section. Given their simplicity, such models are intriguing for practical purposes.
In the first example, we consider six sources of data, concerning the number of automobile liability policies issued for private cars in Belgium (1958), Zaire (1954), Belgium (1975–76), Great Britain (1968), Germany (1960), and Switzerland (1961). The data, which are well-known in the actuarial literature (see Gómez-Déniz et al. (Reference Gómez-Déniz, Sarabia, Pérez-Sánchez and Vázquez-Polo2008), Gossiaux and Lemaire (Reference Gossiaux and Lemaire1981) and Willmot (Reference Willmot1987) for details) are heavily skewed to the right and, moreover, overdispersed, i.e., the sample variance, $\tilde s^2$
, is greater than the sample mean,
$\tilde s^2$
, is greater than the sample mean, $\tilde x$
. Therefore, in order to fit these data, we must use an overdispersed distribution, such as the CPD.
$\tilde x$
. Therefore, in order to fit these data, we must use an overdispersed distribution, such as the CPD.
The observed and expected frequencies according to the CPD for each case are given in Table 2. Parameters estimated by maximum likelihood and some related statistics are shown, including standard errors in parentheses. Table 2 also presents the mean empirical correlation (autocorrelation), MEAC, calculated for the different types of claims present in the dataset and the lags $\tau =\{1,5,10,50,250\}$
according to the proposal (for serial correlation) provided by Cameron and Trivedi (Reference Cameron and Trivedi1998, p. 228), given by
$\tau =\{1,5,10,50,250\}$
according to the proposal (for serial correlation) provided by Cameron and Trivedi (Reference Cameron and Trivedi1998, p. 228), given by
 \begin{eqnarray} \rho _\tau =\frac {\mathbb{E}(z_j z_{j-\tau })}{\sqrt {\mathbb{E}(z_j^2)\mathbb{E}(z_{j-\tau }^2)}},\quad \tau =1,2,\ldots , \end{eqnarray}
where $z_j=x_j-\bar x$
. Note that the correlation between two observations decreases as the distance between them increases until they become uncorrelated. The results shown in these tables indicate moderate dependence between the observations, and all estimators are statistically significant.
$z_j=x_j-\bar x$
. Note that the correlation between two observations decreases as the distance between them increases until they become uncorrelated. The results shown in these tables indicate moderate dependence between the observations, and all estimators are statistically significant.
As can be seen, the maximum likelihood method provides an almost perfect fit, one that in most cases is better than those provided by the negative binomial distribution and the Poisson-inverse Gaussian distribution (see Willmot (Reference Willmot1987) and Dean et al. (Reference Dean, Lawless and Willmot1989)) if we choose the $\chi ^2$
-test as the criterion for comparison. This superiority is also confirmed by the respective
$\chi ^2$
-test as the criterion for comparison. This superiority is also confirmed by the respective $p$
-values, shown in Table 2. The cells in this Table have been grouped to comply with the rule of five when applying the
$p$
-values, shown in Table 2. The cells in this Table have been grouped to comply with the rule of five when applying the $\chi ^2$
test.
$\chi ^2$
test.
The Poisson distribution given in (1) and negative binomial distributions whose probability function is given by
 \begin{eqnarray*} \Pr (X=x)=\left(\substack{r+x-1\\[10pt]x}\right)\left (\frac {r}{r+\lambda }\right )^r\left (\frac {\lambda }{r+\lambda }\right )^x,\quad x=0,1,\ldots , \end{eqnarray*} $r\gt 0$
and
$r\gt 0$
and $\lambda \gt 0$
were used to compare the above results with those obtained with the CPD in the hurdle-at-zero model. Under this parameterization, the mean of this negative binomial distribution is just
$\lambda \gt 0$
were used to compare the above results with those obtained with the CPD in the hurdle-at-zero model. Under this parameterization, the mean of this negative binomial distribution is just $\lambda$
while the variance is
$\lambda$
while the variance is $\lambda (1+\lambda /r)$
.
$\lambda (1+\lambda /r)$
.
We have estimated the data set corresponding to the German automobile insurance portfolio, which presents $87.29\%$
of zeros, using the hurdle-at-zero model and the Poisson, Negative Binomial, and CP distributions. Regarding the BIC, the best model corresponds to the negative binomial distribution (
$87.29\%$
of zeros, using the hurdle-at-zero model and the Poisson, Negative Binomial, and CP distributions. Regarding the BIC, the best model corresponds to the negative binomial distribution ( $\mbox{BIC}=20467$
). However, the only significant parameter in this case is the inflation parameter
$\mbox{BIC}=20467$
). However, the only significant parameter in this case is the inflation parameter $\varphi$
. The Poisson model provides a BIC given by
$\varphi$
. The Poisson model provides a BIC given by $20482.20$
, while the hurdle model based on the CPD is valued at
$20482.20$
, while the hurdle model based on the CPD is valued at $20480.10$
, slightly higher than the Poisson offers. For this last model, all the parameters were significant.
$20480.10$
, slightly higher than the Poisson offers. For this last model, all the parameters were significant.
The above computations were performed using Wolfram Mathematica (v. 13.2) software. The Newton-Raphson method was used to estimate the parameters by maximum likelihood, with their moment estimates as starting values.
The second application we consider concerns the French Motor Personal Line datasets available in the package “CASdatasets” in R. This is a collection of ten datasets provided by a private motor French insurer. Each dataset includes risk features such as claim amount, risk area, gender of the policyholder, and number of claims for different types of coverage. From this collection, we analyzed the freMPL10 dataset, which includes 32100 policies for the year 2004. Our study considers nineteen variables, twelve of them as covariates (an intercept is also included), as shown in Table 3. The dependent variable is the total number of claims given by the sum of the claims in each of the five coverages provided (two kinds of responsibility, parking, windscreen, and fire & theft).
Description of dependent variables and explanatory variables considered

Table 3 Long description
A table with two columns: Variable and Description. The table has 19 rows, each describing a different variable. Row 1: Exposure, The exposure, in years; min = 0.001, max = 1. Row 2: Log(lic age), Logarithm of the driving license age, in months. Row 3: Veh age, Takes the value 1 if the age of the vehicle is less than or equal to five years, 0 otherwise. Row 4: Gender, Takes the value one if male, 0 if female. Row 5: Status, Takes the value 0 if alone, 1 if other. Row 6: Private 1, Takes the value 1 if the usage of the vehicle is private, 0 otherwise. Row 7: Private 2, Takes the value 1 if the usage of the vehicle is private + trip to the office, 0 otherwise. Row 8: Professional, Takes the value 1 if the usage of the vehicle is professional, 0 otherwise. Row 9: Log(driver age), Logarithm of the driver age, in years. Row 10: Has km limit, Takes the value 1 if there is a km limit, 0 otherwise. Row 11: Risk area, Unknown risk area between 1 and 13. Row 12: Bonus, Takes the value 1 if the numerical value for bonus/malus is less than 100, 0 otherwise. Row 13: Malus, Takes the value 1 if the numerical value for bonus/malus is larger than 100, 0 otherwise. Row 14: Claimr, Number of responsible claims in the four preceding years. Row 15: Claimnr, Number of nonresponsible claims in the four preceding years. Row 16: Claimparking, Number of parking claims in the four preceding years. Row 17: Claimfiretheft, Number of fire-theft claims in the four preceding years. Row 18: Claimwindscreen, Number of windscreen claims in the four preceding years. Row 19: Claims, Claimr+claimnr+claimparking+claimfiretheft+claimwindscreen.
Table 4 shows the empirical correlation, computed according to (17), for different lags and the five types of claims, together with the estimated value of the correlation parameter $\theta$
obtained by maximum likelihood. According to the standard errors, shown in parentheses, this value is significant. As can be seen, the estimated value of
$\theta$
obtained by maximum likelihood. According to the standard errors, shown in parentheses, this value is significant. As can be seen, the estimated value of $\theta$
is close to the empirical correlation, which is again moderate. Table 4 also shows the index of dispersion for each claim type in the last column. It can be seen that in all cases, correlation and overdispersion occur simultaneously.
$\theta$
is close to the empirical correlation, which is again moderate. Table 4 also shows the index of dispersion for each claim type in the last column. It can be seen that in all cases, correlation and overdispersion occur simultaneously.
Mean empirical autocorrelation (MEAC) and estimate of the correlation parameter, $\theta$
for the different types of claim in the dataset. The standard error (SE) of the estimated parameter
$\theta$
for the different types of claim in the dataset. The standard error (SE) of the estimated parameter $\theta$
is shown in parentheses. ID column shows the index of dispersion of the empirical data
$\theta$
is shown in parentheses. ID column shows the index of dispersion of the empirical data

Table 4 Long description
A table with five rows and four columns comparing different types of claims with their mean empirical autocorrelation (MEAC), estimated correlation parameter (θ) with standard error (SE), and index of dispersion (ID). Row 1: Claim type is Claim fire, MEAC is 0.128, θ (SE) is 0.025 (0.004), ID is 1.105. Row 2: Claim type is Claim nr, MEAC is 0.134, θ (SE) is 0.050 (0.003), ID is 1.052. Row 3: Claim type is Claim parking, MEAC is 0.066, θ (SE) is 0.049 (0.006), ID is 1.113. Row 4: Claim type is Claim theft, MEAC is 0.060, θ (SE) is 0.040 (0.006), ID is 1.084. Row 5: Claim type is Claim windscreen, MEAC is 0.154, θ (SE) is 0.065 (0.004), ID is 1.148. Row 6: Claim type is Claims, MEAC is 0.089, θ (SE) is 0.222 (0.004), ID is 1.216.
Tables 5 and 6 show the results obtained for the homogeneous (without covariates) and nonhomogeneous (with covariates) cases, respectively. The bottom of Table 5 includes the execution times (in seconds) of the three models executed using Wolfram Mathematica (v. 13.2)
Observed and fitted number of claims for the French motor personal line, estimated parameters, and some diagnostic statistics

Table 5 Long description
A table with 11 rows and 7 columns comparing observed and fitted number of claims for the French motor personal line, including estimated parameters and diagnostic statistics. The columns are labeled Count, Observed, Fitted (P), Fitted (NB), Fitted (CPD), and additional diagnostic statistics. Row 1: Count, 0; Observed, 12257; Fitted (P), 11117.10; Fitted (NB), 12286.90; Fitted (CPD), 12223.50. Row 2: Count, 1; Observed, 10803; Fitted (P), 11788.30; Fitted (NB), 10720.00; Fitted (CPD), 10832.00. Row 3: Count, 2; Observed, 5571; Fitted (P), 6249.98; Fitted (NB), 5626.27; Fitted (CPD), 5621.94. Row 4: Count, 3; Observed, 2296; Fitted (P), 2209.10; Fitted (NB), 2300.91; Fitted (CPD), 2262.65. Row 5: Count, 4; Observed, 794; Fitted (P), 585.62; Fitted (NB), 807.66; Fitted (CPD), 790.52. Row 6: Count, 5; Observed, 274; Fitted (P), 124.19; Fitted (NB), 255.42; Fitted (CPD), 255.00. Row 7: Count, 6; Observed, 87; Fitted (P), 21.95; Fitted (NB), 74.86; Fitted (CPD), 79.02. Row 8: Count, 7; Observed, 11; Fitted (P), 3.32; Fitted (NB), 20.70; Fitted (CPD), 24.22. Row 9: Count, 8; Observed, 5; Fitted (P), 0.44; Fitted (NB), 5.47; Fitted (CPD), 7.51. Row 10: Count, 9; Observed, 0; Fitted (P), 0.05; Fitted (NB), 1.39; Fitted (CPD), 2.40. Row 11: Count, 10; Observed, 2; Fitted (P), 0.00; Fitted (NB), 0.34; Fitted (CPD), 0.81. The table also includes total values, estimated parameters, and diagnostic statistics such as BIC, chi-squared, degrees of freedom, p-value, and runtime in seconds.
Parameter estimates, standard errors (in parentheses), negative log-likelihood (NLL), BIC, CAIC, Pearson goodness-of-fit statistics for the Poisson (P), negative binomial (NB), and correlated Poisson (CPD) distributions

Table 6 Long description
The table compares parameter estimates, standard errors, negative log-likelihood, BIC, CAIC, and Pearson goodness-of-fit statistics for the Poisson (P), negative binomial (NB), and correlated Poisson (CPD) distributions. It includes 15 rows and 10 columns. Column headers are P, NB, and CPD. Row labels include Log(lic age), Veh age, Gender, Status, Private 1, Private 2, Professional, log(driver age), has km limit, Risk area, Bonus, Malus, Constant, and 7. Additional rows include NLL, BIC, CAIC, PS, Number of observations, and Runtime (in seconds). Each row provides specific values for the P, NB, and CPD columns. Notable trends include varying parameter estimates and statistical measures across the different distributions. $^{***}$
indicates 1% significance level;
$^{***}$
indicates 1% significance level; $^{**}$
indicates 5% significance level;
$^{**}$
indicates 5% significance level; $^{*}$
indicates 10% significance level.
$^{*}$
indicates 10% significance level.
Parameter estimates and corresponding standard errors are shown in Table 5 for the homogeneous case, together with some usual statistics. The model based on the negative binomial distribution shows a slight improvement over the model based on the CPD. Table 6 displays the model with covariates. The connection used to describe the number of claims for the negative binomial distribution is the log-link mentioned in (12), so, the interpretation of the marginal effects is the same as explained in Section 3.3.
From Table 6 and in comparison with the Poisson and negative binomial distributions, it can be seen that the model based on the CPD substantially improves the values of the negative of the log-likelihood value (NLL), the Bayesian Information Criterion (BIC), and the Consistent Akaike Information Criterion (CAIC). Moreover, the CPD is also superior to the NB distribution except for the PS statistic. As for the covariates considered, the estimates of the parameters are approximately the same for the three models considered. Nevertheless, a significant difference lies in the fact that in the NB model, the variable veh age is statistically relevant, which is not the case for the model based on the CPD. In a sense, the presence of correlation, as measured by the parameter $\theta$
, reduces the number of explanatory variables in the model, making it more attractive from a practical perspective, in accordance with the principle of Ockham’s razor. For the remaining covariates, the results, in terms of significance, are similar for the three models, Poisson, NB, and CPD.
$\theta$
, reduces the number of explanatory variables in the model, making it more attractive from a practical perspective, in accordance with the principle of Ockham’s razor. For the remaining covariates, the results, in terms of significance, are similar for the three models, Poisson, NB, and CPD.
Note that the percentage of zeros in this data set is low; therefore, it appears to be needless to use a zero-inflated or hurdle model.
5.1 Regression diagnostics
Various model fit statistics and residuals are readily available in the statistical literature. Here, we focus on the raw (ordinary) residuals, $r_i=x_i-\widehat \lambda _i$
,
$r_i=x_i-\widehat \lambda _i$
, $i=1,\ldots ,n$
, the Pearson residuals
$i=1,\ldots ,n$
, the Pearson residuals $s_i=$ $(x_i-\widehat \lambda _i)/\sqrt{\widehat \sigma _i/E_i\phantom{a^{1}}}$
, and the Anscombe residuals, which are given by
$(x_i-\widehat \lambda _i)/\sqrt{\widehat \sigma _i/E_i\phantom{a^{1}}}$
, and the Anscombe residuals, which are given by
 \begin{eqnarray*} ar_i &=& \frac {3E_i^{1/6}}{2}\frac {x_i^{2/3}-\widehat \lambda _i^{2/3}}{\widehat \lambda _i^{1/6}},\\ ar_i &=& \frac {3 E_i^{1/6}}{2}\frac {\widehat r((1+x_i/\,\widehat r\,)^{2/3}-(1+\widehat \lambda _i/\,\widehat r\,)^{2/3})+x_i^{2/3}-\widehat \lambda _i^{2/3}}{(\lambda +\lambda ^2/\,\widehat r\,)^{1/6}},\\ ar_i &=& \frac {3(1-2\widehat \theta )^{1/2}E_i^{1/6}}{2}\frac {x_i^{2/3}-\widehat \lambda _i^{2/3}}{\widehat \lambda _i^{1/6}} \end{eqnarray*}
for the Poisson, negative binomial, and CPDs, respectively. Details about how to build the Anscombe residual can be found in de Jong and Heller (Reference de Jong and Heller2008, p. 78) and Frees et al. (Reference Frees, Derrig and Meyers2014, p. 374).
The Pearson goodness-of-fit statistic, given by $\mbox{PS}=\sum _{i=1}^{n}s_i^2$
(see for instance, Dean et al. (Reference Dean, Lawless and Willmot1989) and Ohlsson and Johansson (Reference Ohlsson and Johansson2010, p. 53)) is shown at the bottom of Table 6. This value is better with the CPD than with the Poisson distribution but worse than with the negative binomial. Some diagnostic plots based on the residuals are also shown. All of these plots reflect adequate behavior of the residuals, showing that, to a reasonable approximation, they are normally distributed, i.e., fairly linear. These plots are shown in Figure 3. The box-whisker chart of these residuals is shown in Figure 4. As usual, the edges of the boxes denote the 25th and 75th percentiles of the residuals, while the middle line in the box denotes the median of the residuals. Although the figures are quite similar, the range of variation of the residuals is smaller for the CPD than for the other models analyzed, a finding that supports the CPD model. While Figure 3 shows very similar behavior among the models considered, Figure 4 indicates that the CPD model exhibits better marginal behavior. This finding lends support to the CPD model.
$\mbox{PS}=\sum _{i=1}^{n}s_i^2$
(see for instance, Dean et al. (Reference Dean, Lawless and Willmot1989) and Ohlsson and Johansson (Reference Ohlsson and Johansson2010, p. 53)) is shown at the bottom of Table 6. This value is better with the CPD than with the Poisson distribution but worse than with the negative binomial. Some diagnostic plots based on the residuals are also shown. All of these plots reflect adequate behavior of the residuals, showing that, to a reasonable approximation, they are normally distributed, i.e., fairly linear. These plots are shown in Figure 3. The box-whisker chart of these residuals is shown in Figure 4. As usual, the edges of the boxes denote the 25th and 75th percentiles of the residuals, while the middle line in the box denotes the median of the residuals. Although the figures are quite similar, the range of variation of the residuals is smaller for the CPD than for the other models analyzed, a finding that supports the CPD model. While Figure 3 shows very similar behavior among the models considered, Figure 4 indicates that the CPD model exhibits better marginal behavior. This finding lends support to the CPD model.
QQ-plots of the raw, Pearson, and Anscombe residuals for the Poisson, negative binomial, and correlated Poisson distributions.

Box plots of the raw, Pearson, and Anscombe residuals for the Poisson, negative binomial, and correlated Poisson distributions.

Figure 4 Long description
Three box plots compare residuals for Poisson, negative binomial, and correlated Poisson distributions. Panel A: The box plot shows raw residuals. The x-axis ranges from -10 to 10. The y-axis represents different distributions: Poisson, negative binomial (NB), and correlated Poisson distribution (CPD). Poisson residuals are centered around zero with some spread, NB residuals show a wider spread, and CPD residuals are more dispersed with outliers. Panel B: The box plot shows Pearson residuals. The x-axis ranges from -2 to 6. The y-axis represents the same distributions. Poisson residuals are centered around zero with moderate spread, NB residuals show a wider spread, and CPD residuals are more dispersed with outliers. Panel C: The box plot shows Anscombe residuals. The x-axis ranges from -5 to 5. The y-axis represents the same distributions. Poisson residuals are centered around zero with moderate spread, NB residuals show a wider spread, and CPD residuals are more dispersed with outliers.
In addition, the Vuong test was performed to distinguish between each of the models considered, comparing the estimates of the CPD with the NB model, taking into account that the NB distributions are non-nested with the CPD. In this regard, we tested the null hypothesis that the CPD is equally close to the actual model, against the alternative that either the CPD or the NB is closer (see Vuong, Reference Vuong1989). Due to the asymptotically normal behavior of the $Z$
statistic under the null hypothesis, the latter hypothesis was rejected in favor of the alternative, i.e., that model
$Z$
statistic under the null hypothesis, the latter hypothesis was rejected in favor of the alternative, i.e., that model $f(\cdot )$
occurs with a significance level
$f(\cdot )$
occurs with a significance level $\alpha ,$
when
$\alpha ,$
when $Z\gt z_{1-\alpha }$
, where
$Z\gt z_{1-\alpha }$
, where $z_{1-\alpha }$
is the
$z_{1-\alpha }$
is the $(1-\alpha )$
quantile of the standard normal distribution. In our case,
$(1-\alpha )$
quantile of the standard normal distribution. In our case, $Z=1.93$
(CPD versus NB) with
$Z=1.93$
(CPD versus NB) with $p = 0.054$
. Thus, we conclude that the CPD model achieves a better fit than the NB model, although the evidence from the
$p = 0.054$
. Thus, we conclude that the CPD model achieves a better fit than the NB model, although the evidence from the $p$
-value is limited.
$p$
-value is limited.
5.2 Out-of-sample validation of the CPD
This section examines the ability of the CPD-based regression model to predict the number of out-of-sample claims. We will use the QQ plot of the residuals between the predicted and observed number of claims in the freMPL8 and freMPL6 datasets available in the CAS datasets package. The difficulty encountered in this case is that these datasets do not include the VEHAGE covariate. Therefore, we re-estimated the initial model without using the VEHAGE covariate, based on the freMPL10 dataset. Figure 5 shows the residuals, which are almost perfectly aligned with the 45 $^{o}$
line in the center and therefore appear to be normally distributed. However, there is a slight deviation at the top and bottom of the distribution, thus underestimating or overestimating the observed empirical values. Overall, the CPD model accurately predicts the observed values.
$^{o}$
line in the center and therefore appear to be normally distributed. However, there is a slight deviation at the top and bottom of the distribution, thus underestimating or overestimating the observed empirical values. Overall, the CPD model accurately predicts the observed values.
QQ-plots of the randomized quantile residuals for out-of-sample data set: freMPL6 (left) and freMPL8 (right).

6. Bivariate model and random effects
This section briefly addresses the bivariate model and random effects. For simplicity, suppose that the insurer provides financial protection against two coverages simultaneously, and the insurer seeks to charge each policyholder based on their coverage. In this situation, on the one hand, it’s easy to create a bivariate model using a copula, where the individual distributions are discrete probability distributions (CPD) and there is some relationship between the two coverages. A very simple copula is the one provided by the Sarmanov family of bivariate distributions that have been considered in some actuarial works in recent years (Hernández et al., Reference Hernández, Fernández and Gómez-Déniz2009; Bahraoui et al., Reference Bahraoui, Bolancé, Pelican and Vernic2015; Bolancé and Vernic, Reference Bolancé and Vernic2019; Gómez-Déniz, Reference Gómez-Déniz2025; among others).
Specifically, assume that $f_{i}(x_{i})=\mbox{CPD}(x_i \vert \lambda _i,\theta _i)$
,
$f_{i}(x_{i})=\mbox{CPD}(x_i \vert \lambda _i,\theta _i)$
, $i=1,2$
, for coverages 1 and 2. Let
$i=1,2$
, for coverages 1 and 2. Let $\phi _{i}(x_i)$
,
$\phi _{i}(x_i)$
, $i=1,2$
, be bounded nonconstant functions such that
$i=1,2$
, be bounded nonconstant functions such that $ \sum _{0}^{\infty }\phi _{i}(x_i)f_{i}(x_i)=0$
(usually named as mixing functions). Then,
$ \sum _{0}^{\infty }\phi _{i}(x_i)f_{i}(x_i)=0$
(usually named as mixing functions). Then,
 \begin{eqnarray*} h(x_{1},x_{2})=f_{1}(x_{1}) f_{2}(x_{2})\left [1+\omega \ \phi _{1}(x_{1}) \phi _{2}(x_{2}) \right ] \end{eqnarray*}
provided that $\omega$
is a real number that satisfies the condition
$\omega$
is a real number that satisfies the condition $1+\omega \ \phi _{1}(x_{1}) \phi _{2}(x_{2})\geq 0$
for all
$1+\omega \ \phi _{1}(x_{1}) \phi _{2}(x_{2})\geq 0$
for all $x_{1}$
and
$x_{1}$
and $x_{2}$
, is a genuine bivariate probability mass function with specified marginals
$x_{2}$
, is a genuine bivariate probability mass function with specified marginals $f_{1}(x_{1})$
and
$f_{1}(x_{1})$
and $f_{2}(x_{2})$
. Note that the dependence is captured through the mixing functions and the
$f_{2}(x_{2})$
. Note that the dependence is captured through the mixing functions and the $\omega$
parameter. In practice, various mixing functions may be selected; however, relating them with the MGF of the marginal distributions provides the most effective method for determining the bounds of the
$\omega$
parameter. In practice, various mixing functions may be selected; however, relating them with the MGF of the marginal distributions provides the most effective method for determining the bounds of the $\omega$
parameters. We propose the function
$\omega$
parameters. We propose the function $\phi _i(x_i)=\exp (-x_i)-\sum _{x_i=0}^{\infty }\exp (-x_i)f_i(x_i)$
for
$\phi _i(x_i)=\exp (-x_i)-\sum _{x_i=0}^{\infty }\exp (-x_i)f_i(x_i)$
for $i=1,2$
, which can be derived from (7).
$i=1,2$
, which can be derived from (7).
On the other hand, it is common in actuarial statistics to incorporate random effects through an infinite mixture of distributions. To achieve this, consider that the parameter $\lambda$
is a random variable that follows a gamma distribution with a shape parameter
$\lambda$
is a random variable that follows a gamma distribution with a shape parameter $a\gt 0$
and a rate parameter
$a\gt 0$
and a rate parameter $b\gt 0$
. Then, the unconditional distribution of
$b\gt 0$
. Then, the unconditional distribution of $X$
is obtained from (2) and given by,
$X$
is obtained from (2) and given by,
 \begin{eqnarray} \Pr (X=x;\,\theta ,a,b)=\frac {b^a}{\Gamma (a)}\sum _{j=0}^{x}\int _0^{\infty }a_{xj}(\lambda ,\theta )\lambda ^{a-1}\exp [-\lambda (b+1-\theta )]\,\text{d}\lambda , \end{eqnarray}
where $a_{xj}(\lambda ,\theta )$
is as in (3).
$a_{xj}(\lambda ,\theta )$
is as in (3).
The mixture of the Poisson distribution with the gamma distribution is well-known to yield the negative binomial distribution. Therefore, (18) represents a correlated negative binomial distribution, with the correlation quantified by the $\theta$
parameter. In the special case where
$\theta$
parameter. In the special case where $\theta =0$
, the distribution reduces to the classical negative binomial distribution.
$\theta =0$
, the distribution reduces to the classical negative binomial distribution.
7. Conclusions and further works
As Drezner and Farnum (Reference Drezner and Farnum1994) pointed out, the CPD is the probability distribution of the number of events arriving during a given time period when events are arriving at a constant flow but are not independent. This article considers the CPD in greater detail, highlighting both its well-known properties and some novel ones. In this article, we consider how the CPD might be applied in the field of actuarial statistics, where it could provide a viable alternative to common statistical distributions like the Poisson and the negative binomial. In addition, we extend the model to include covariates via a natural linear regression. An inherent problem in longitudinal count data is that the data could exhibit correlation and overdispersion simultaneously. The likelihood-based estimation employed in traditional models, whereby inputs are treated as independent, yields poorer results than the CPD model. In this study, we show that CPD models have desirable statistical properties and adequately capture part of the correlation present in the data.
The questions examined in this article could be extended in various ways. As previously mentioned, the mixture of the CPD requires the calculation of the integral (18), which does not seem easy to obtain analytically. If this were possible, not only would a more flexible distribution be obtained, but it would also allow us to perform a Bayesian analysis to integrate prior and posterior information, which could be very useful in bonus-malus systems. Other alternative mixtures, which have already been proposed using the classical Poisson distribution, include the beta distribution and the inverse Gaussian distribution as mixing distributions.
Another valuable avenue of work would be to utilize the CPD studied here as the primary distribution in the collective risk model. This model uses the distribution of the number of claims (primary distribution) and the distribution of their amounts (secondary distribution) to derive the distribution of total claim amounts. In principle, it is not straightforward to use recursive algorithms (widely employed in this scenario) to obtain this latter distribution.
Data availability statement
Data availability is not applicable to this article as no new data were created in this study. The codes for numerical examples that support the findings are available from the corresponding author upon reasonable request.
Acknowledgments
The authors thank the Associate Editor and two anonymous referees for their constructive comments, which have greatly helped them improve the quality of the paper.
Funding
This work was partially supported by the Agencia Estatal de Investigación (Ministerio de Ciencia e Innovación, Spain) under Grant PID2021-127989OB-I00. The funder had no role in study design, data collection and analysis, decision to publish, or preparation of the manuscript.
Competing interests
The authors declare none.
Appendix A. Proof of Proposition2
The case $\theta =0$
coincides with
$\theta =0$
coincides with $X \sim \text{Poi}(\lambda )$
and
$X \sim \text{Poi}(\lambda )$
and $\text{Poi}(\lambda ) \stackrel {L}{\longrightarrow } Z$
holds, given that
$\text{Poi}(\lambda ) \stackrel {L}{\longrightarrow } Z$
holds, given that $\lambda \to +\infty .$
Let us now consider
$\lambda \to +\infty .$
Let us now consider $0\lt \theta \lt 1/2.$
The moment-generating function (MGF) of
$0\lt \theta \lt 1/2.$
The moment-generating function (MGF) of $Y$
is given by
$Y$
is given by
 \begin{eqnarray*} M_Y(t) &=& \mathbb{E}\left ( \mathrm{e}^{t Y} \right ) = \exp \left ( -t \frac {\lambda \sqrt {1-2\theta }}{\sqrt {\lambda }}\right ) M_X\left ( t \frac {\sqrt {1-2\theta }}{\sqrt {\lambda }}\right ) \\ & = & \exp \left ( -t \frac {\lambda \sqrt {1-2\theta }}{\sqrt {\lambda }}\right ) \exp \left \{ \lambda (1-\theta ) \sum _{j=1}^{\infty } \frac {\varphi ( t \frac {\sqrt {1-2\theta }}{\sqrt {\lambda }})^{j}}{1-j \theta }\right \}. \end{eqnarray*}
Also,
 \begin{equation} \log M_Y(t) = -t \frac {\lambda \sqrt {1-2\theta }}{\sqrt {\lambda }}+ \lambda (1-\theta ) \sum _{j=1}^{\infty } \frac {\varphi ( t \frac {\sqrt {1-2\theta }}{\sqrt {\lambda }})^{j}}{1-j \theta }. \end{equation}
We focus now on the term $\displaystyle \lambda (1-\theta ) \sum _{j=1}^{\infty } \frac {\varphi ( t \frac {\sqrt {1-2\theta }}{\sqrt {\lambda }})^{j}}{1-j \theta }$
.
$\displaystyle \lambda (1-\theta ) \sum _{j=1}^{\infty } \frac {\varphi ( t \frac {\sqrt {1-2\theta }}{\sqrt {\lambda }})^{j}}{1-j \theta }$
.
 \begin{eqnarray} \lambda (1-\theta ) \sum _{j=1}^{\infty } \frac {\varphi ( t \frac {\sqrt {1-2\theta }}{\sqrt {\lambda }})^{j}}{1-j \theta } & = & \lambda (1-\theta ) \left ( \frac {\varphi ( t \frac {\sqrt {1-2\theta }}{\sqrt {\lambda }})}{1-\theta } + \frac { \varphi ( t \frac {\sqrt {1-2\theta }}{\sqrt {\lambda }})^{2}}{1-2\theta } + \frac { \varphi ( t \frac {\sqrt {1-2\theta }}{\sqrt {\lambda }})^{3}}{1-3\theta } + \ldots \right ) \nonumber \\ & = & \lambda \; \varphi \left ( t \frac {\sqrt {1-2\theta }}{\sqrt {\lambda }}\right ) + \frac {1-\theta }{1-2 \theta } \; \lambda \; \varphi \left ( t \frac {\sqrt {1-2\theta }}{\sqrt {\lambda }}\right )^{2} + \nonumber \\ & & + \frac {1-\theta }{1-3 \theta } \; \lambda \; \varphi \left ( t \frac {\sqrt {1-2\theta }}{\sqrt {\lambda }}\right )^{3} + \ldots \end{eqnarray}
Now observe that for every $t$
, we have
$t$
, we have
 \begin{equation*} \varphi (t) = 1- \exp (-t) = 1- \sum _{i=0}^{+\infty } (-1)^{i} \; \frac {t^{i}}{i!} = \sum _{i=1}^{+\infty } (-1)^{i+1} \; \frac {t^{i}}{i!}, \end{equation*}
and
 \begin{equation*} \varphi (t)^{j} = \sum _{k=0}^{j} \left(\substack{j\\k}\right) (-1)^{k} \exp (-k t) = \sum _{k=0}^{j}\left(\left(\substack{j\\k}\right)(-1)^{k} \left ( \sum _{i=0}^{+\infty } (-1)^{i} \; \frac {k^{i} t^{i}}{i!}\right )\right ). \end{equation*}
Thus, using the series expansion of $\varphi (t)$
we obtain:
$\varphi (t)$
we obtain:
 \begin{eqnarray} \lambda \; \varphi \left ( t \frac {\sqrt {1-2\theta }}{\sqrt {\lambda }}\right ) & = & \lambda \left ( t \frac {\sqrt {1-2\theta }}{\sqrt {\lambda }} - \frac {t^2}{2!} \frac {1-2\theta }{\lambda } + \frac {t^3}{3!} \frac {(1-2\theta )^{3/2}}{\lambda ^{3/2}} - \frac {t^4}{4!} \frac {(1-2\theta )^{4/2}}{\lambda ^{4/2}}+ \ldots \right ) \nonumber \\ &= & t \frac { \lambda \sqrt {1-2\theta }}{\sqrt {\lambda }} - \frac {t^2}{2!} (1-2\theta ) + \frac {t^3}{3!} \frac {(1-2\theta )^{3/2}}{\lambda ^{1/2}} - \frac {t^4}{4!} \frac {(1-2\theta )^{4/2}}{\lambda ^{2/2}}+ \ldots \nonumber \\ & =& t \frac { \lambda \sqrt {1-2\theta }}{\sqrt {\lambda }} - \frac {t^2}{2!} (1-2\theta ) + \sum _{k=3}^{+\infty } \frac {t^k}{k!}\mathcal{O}_{1k}(\lambda ), \end{eqnarray}
where $ \mathcal{O}_{1k}(\lambda ) = (-1)^{k} \frac {(1-2\theta )^{k/2}}{\lambda ^{(k-2)/2}}.$
Observe that
$ \mathcal{O}_{1k}(\lambda ) = (-1)^{k} \frac {(1-2\theta )^{k/2}}{\lambda ^{(k-2)/2}}.$
Observe that $\mathcal{O}_{1k}(\lambda ) \to 0,$
as
$\mathcal{O}_{1k}(\lambda ) \to 0,$
as $\lambda \to +\infty$
, for all
$\lambda \to +\infty$
, for all $k\geq 3.$
Thus,
 \begin{eqnarray*} \frac {1-\theta }{1-2\theta } \;\lambda \; \varphi \left ( t \frac {\sqrt {1-2\theta }}{\sqrt {\lambda }}\right )^2 & = &\frac {1-\theta }{1-2\theta } \;\lambda \; \left ( t^2 \frac {1-2\theta }{\lambda } - \frac {6 t^3}{3!} \frac {(1-2\theta )^{3/2}}{\lambda ^{3/2}} + \frac {12 t^4}{4!} \frac {(1-2\theta )^{4/2}}{\lambda ^{4/2}} + \ldots \right )\\ & = & t^2 (1-\theta ) + \frac {1-\theta }{1-2\theta } \sum _{k=3}^{+\infty } \frac {t^k}{k!}\mathcal{O}_{2k}(\lambda ), \end{eqnarray*}
where $ \mathcal{O}_{2k}(\lambda ) = (-1)^{k} (2(2^{k-1}-1)) \frac {(1-2\theta )^{k/2}}{\lambda ^{(k-2)/2}},$
with
$ \mathcal{O}_{2k}(\lambda ) = (-1)^{k} (2(2^{k-1}-1)) \frac {(1-2\theta )^{k/2}}{\lambda ^{(k-2)/2}},$
with $\mathcal{O}_{2k}(\lambda ) \to 0,$
as
$\mathcal{O}_{2k}(\lambda ) \to 0,$
as $\lambda \to +\infty$
, for all
$\lambda \to +\infty$
, for all $k\geq 3.$
Analogously,
 \begin{eqnarray*} \frac {1-\theta }{1-3\theta } \;\lambda \; \varphi \left ( t \frac {\sqrt {1-2\theta }}{\sqrt {\lambda }}\right )^3 & = &\frac {1-\theta }{1-3\theta } \;\lambda \; \left ( \frac {6 t^3}{3!} \frac {(1-2\theta )^{3/2}}{\lambda ^{3/2}} - \frac {36 t^4}{4!} \frac {(1-2\theta )^{4/2}}{\lambda ^{4/2}} + \ldots \right )\\ & = & \sum _{k=3}^{+\infty } \frac {t^k}{k!}\mathcal{O}_{3k}(\lambda ), \end{eqnarray*}
where $ \mathcal{O}_{3k}(\lambda ) = c_{3k} \frac {(1-2\theta )^{k/2}}{\lambda ^{(k-2)/2}},$
and
$ \mathcal{O}_{3k}(\lambda ) = c_{3k} \frac {(1-2\theta )^{k/2}}{\lambda ^{(k-2)/2}},$
and $c_{3k}$
are positive or negative real numbers determined by the coefficients accompanying
$c_{3k}$
are positive or negative real numbers determined by the coefficients accompanying $t^k, \; k\geq 3,$
in the series expansion of
$t^k, \; k\geq 3,$
in the series expansion of $\varphi (z)^{3},$
and
$\varphi (z)^{3},$
and $\mathcal{O}_{3k}(\lambda ) \to 0,$
as
$\mathcal{O}_{3k}(\lambda ) \to 0,$
as $\lambda \to +\infty$
, for all
$\lambda \to +\infty$
, for all $k\geq 3.$
In general, after some cumbersome but simple calculations and simplifications, the terms $ \frac {1-\theta }{1-j \theta } \;\lambda \; \varphi \left ( t \frac {\sqrt {1-2\theta }}{\sqrt {\lambda }}\right )^{j}$
can be stated as
$ \frac {1-\theta }{1-j \theta } \;\lambda \; \varphi \left ( t \frac {\sqrt {1-2\theta }}{\sqrt {\lambda }}\right )^{j}$
can be stated as
 \begin{eqnarray} \frac {1-\theta }{1-j \theta } \;\lambda \; \varphi \left ( t \frac {\sqrt {1-2\theta }}{\sqrt {\lambda }}\right )^{j} = \sum _{k=3}^{+\infty } \frac {t^k}{k!}\mathcal{O}_{jk}(\lambda ), \end{eqnarray}
where $ \mathcal{O}_{jk}(\lambda ) = c_{jk} \frac {(1-2\theta )^{k/2}}{\lambda ^{(k-2)/2}},$
where
$ \mathcal{O}_{jk}(\lambda ) = c_{jk} \frac {(1-2\theta )^{k/2}}{\lambda ^{(k-2)/2}},$
where $c_{jk}$
are positive or negative real numbers determined by the coefficients accompanying
$c_{jk}$
are positive or negative real numbers determined by the coefficients accompanying $t^k, \; k\geq 3,$
in the series expansion of
$t^k, \; k\geq 3,$
in the series expansion of $\varphi (z)^{j},$
and
$\varphi (z)^{j},$
and $\mathcal{O}_{jk}(\lambda ) \to 0,$
as
$\mathcal{O}_{jk}(\lambda ) \to 0,$
as $\lambda \to +\infty$
, for all
$\lambda \to +\infty$
, for all $k\geq 3.$
Using (A.3)–(A.4) we can rewrite expression (A.2) as
 \begin{eqnarray*} \lambda (1-\theta ) \sum _{j=1}^{\infty } \frac {\varphi ( t \frac {\sqrt {1-2\theta }}{\sqrt {\lambda }})^{j}}{1-j \theta }= t \frac { \lambda \sqrt {1-2\theta }}{\sqrt {\lambda }} - \frac {t^2}{2!} (1-2\theta ) + t^2 (1-\theta ) +\sum _{j=1}^{+\infty } \frac {1-\theta }{1-j \theta } \left (\sum _{k=3}^{+\infty } \frac {t^k}{k!}\mathcal{O}_{jk}(\lambda )\right ). \end{eqnarray*}
Returning to (A.1), $\displaystyle \log M_Y(t)$
can be stated as
$\displaystyle \log M_Y(t)$
can be stated as
 \begin{eqnarray*} \log M_Y(t) &=& - t \frac { \lambda \sqrt {1-2\theta }}{\sqrt {\lambda }} + t \frac { \lambda \sqrt {1-2\theta }}{\sqrt {\lambda }} - \frac {t^2}{2!} (1-2\theta ) + t^2 (1-\theta ) \\ & & \phantom {xxxxxxxxxxxxxx} + \sum _{j=1}^{+\infty } \frac {1-\theta }{1-j \theta } \left (\sum _{k=3}^{+\infty } \frac {t^k}{k!}\mathcal{O}_{jk}(\lambda )\right ) \\ & = & t^2 \frac {1}{2} + \sum _{j=1}^{+\infty } \frac {1-\theta }{1-j \theta } \left (\sum _{k=3}^{+\infty } \frac {t^k}{k!}\mathcal{O}_{jk}(\lambda )\right ). \end{eqnarray*}
It follows that
 \begin{equation*} \log M_Y (t) \to \frac {t^2}{2}, \quad \text{as } \lambda \to +\infty , \end{equation*}
and thus $\displaystyle M_Y (t) \to \exp \left (\frac {t^2}{2}\right ),$
as
$\displaystyle M_Y (t) \to \exp \left (\frac {t^2}{2}\right ),$
as $\lambda \to +\infty$
, which is the mgf of a
$\lambda \to +\infty$
, which is the mgf of a $\mathcal{N}(0,1)$
random variable.
$\mathcal{N}(0,1)$
random variable.

 θ=0
θ=0 λ
λ θ
θ
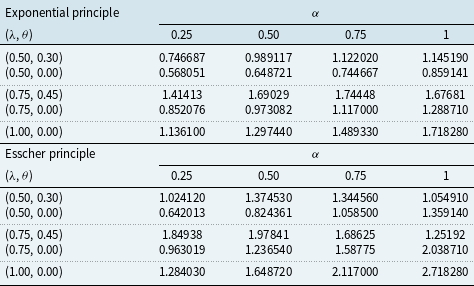
 λ
λ θ
θ α
α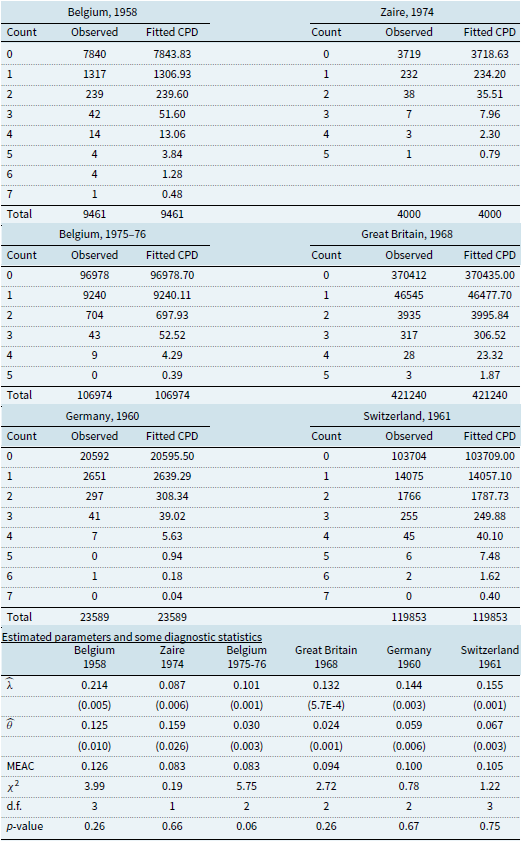
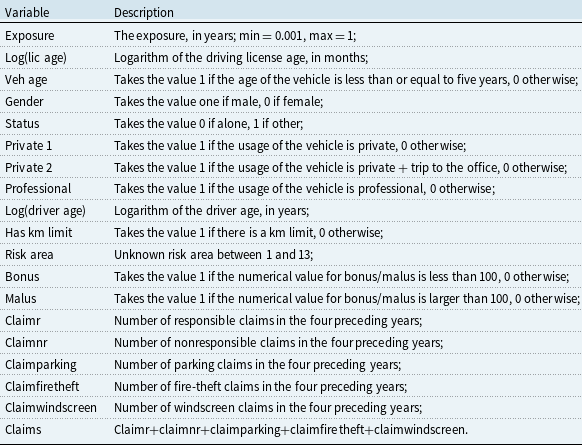
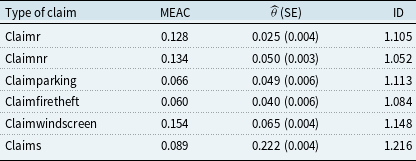
 θ
θ θ
θ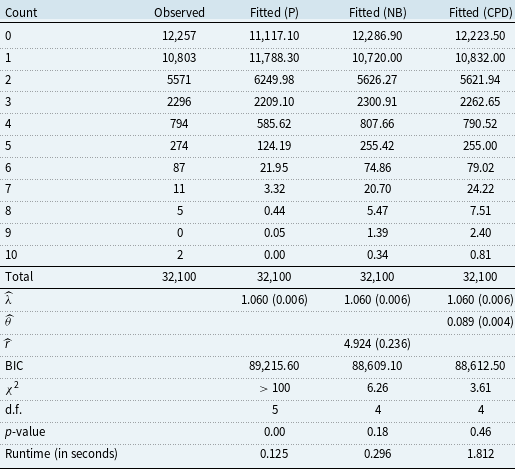
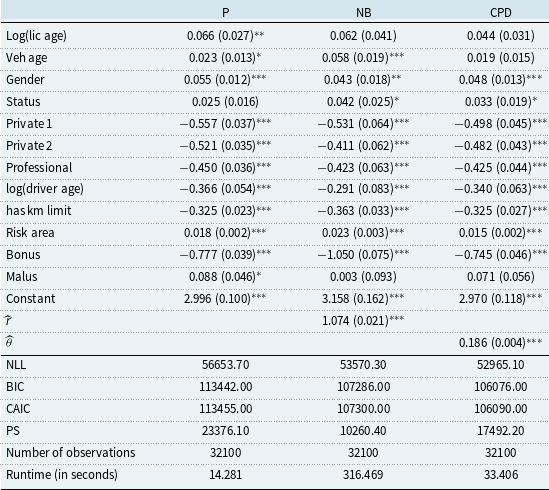

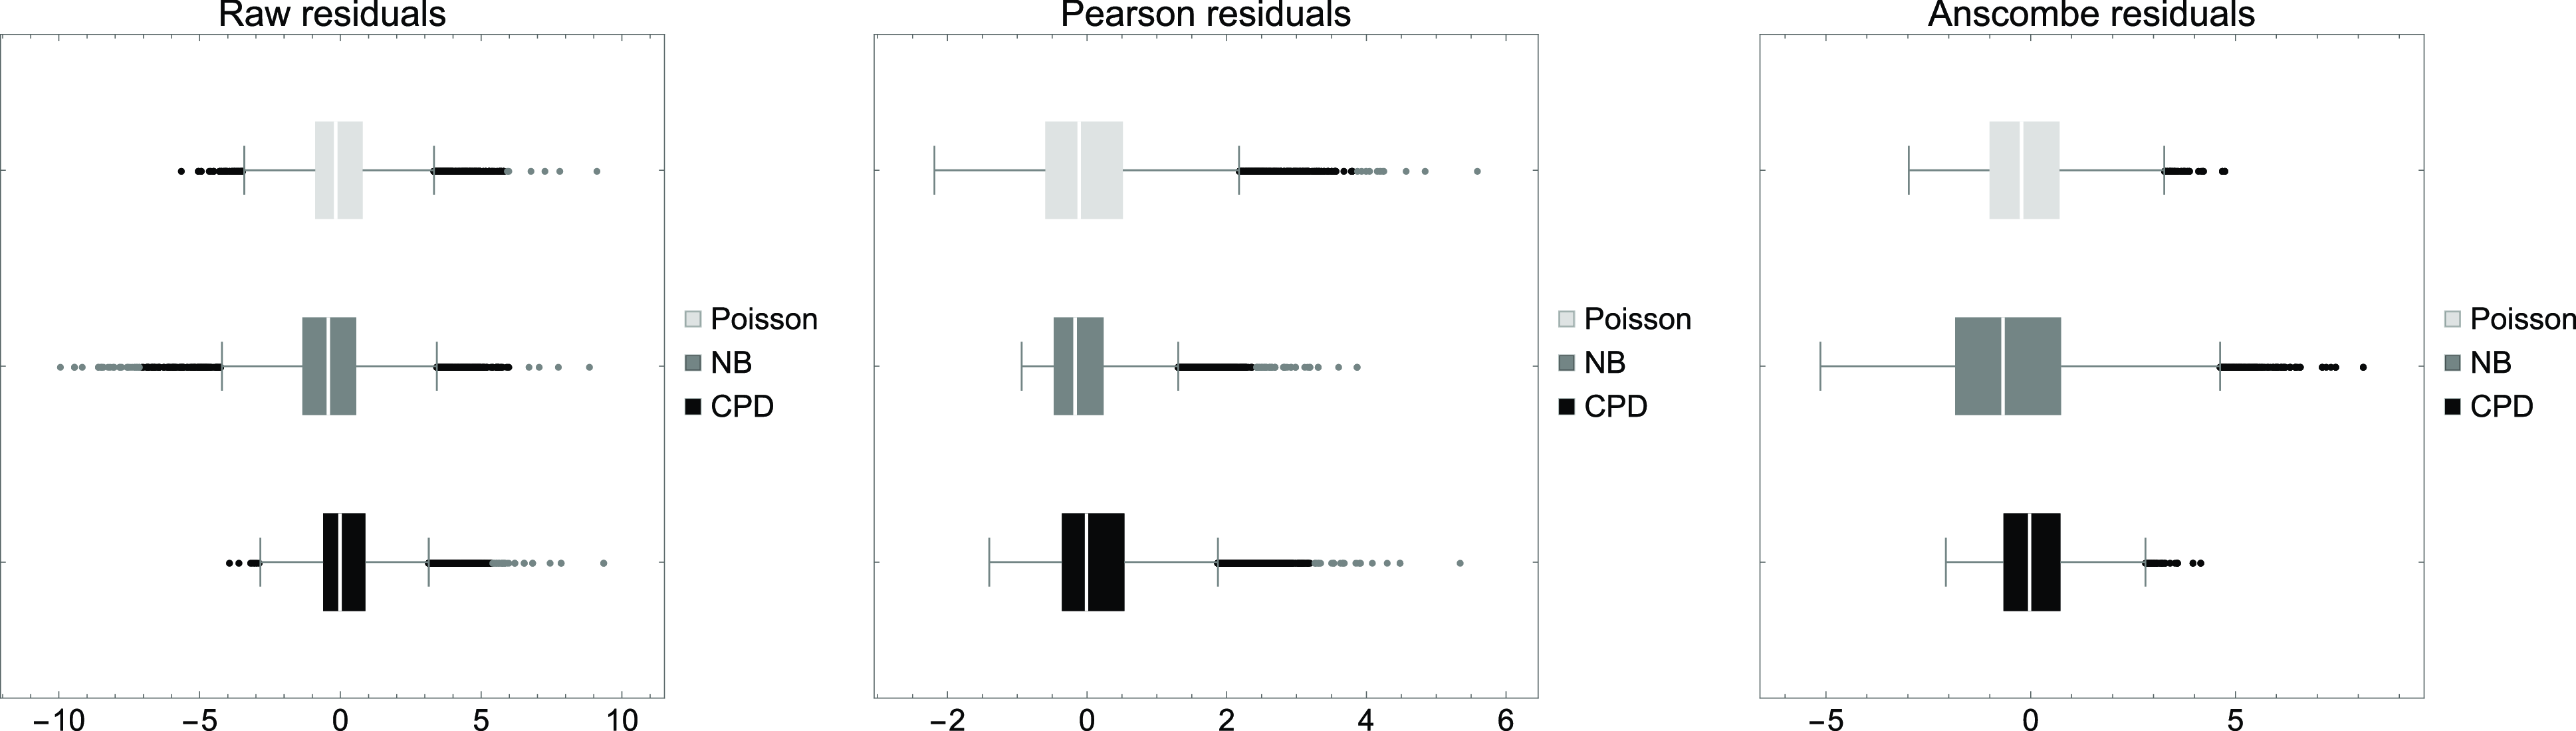


 Open access