

1. Introduction
The Himalaya–Karakoram (HK) is the highest mountain range on Earth and one of the most climate-sensitive regions due to its distinct geographic and climatic characteristics (Maussion and others, Reference Maussion2014). Glacier meltwater from the HK region sustains over a billion people across its river basins, supporting irrigation, hydropower generation, industry and municipal water supply (Immerzeel and others, Reference Immerzeel2020; Azam and others, Reference Azam2021).
Climate change has led to glacier wastage worldwide (Zemp and others, Reference Zemp2019; Hugonnet and others, Reference Hugonnet2021; The GlaMBIE Team, 2025) including in the Himalaya (Brun and others, Reference Brun, Berthier, Wagnon, Kääb and Treichler2017; Azam and others, Reference Azam2018; Lee and others, Reference Lee, Carrivick, Quincey, Cook, James and Brown2021), but with an exception for the Karakoram range where glaciers have nearly been in balance over the last 5–6 decades (Gardelle and others Reference Gardelle, Berthier and Arnaud2012; Bolch and others, Reference Bolch, Pieczonka, Mukherjee and Shea2017; Jackson and others, Reference Jackson2023). The dimensional changes of glaciers (snout or areal change) represent an indirect and delayed response to climate change, while glacier-wide mass changes reflect a direct and immediate response (Oerlemans, Reference Oerlemans2001; Banerjee and Azam, Reference Banerjee and Azam2016). Consequently, glacier mass balance is often utilized to interpret the climate change (Vincent and others, Reference Vincent2018). The glacier-wide mass balance can be estimated using the in situ glaciological method involving on-glacier measurements (Østrem and Stanley, Reference Østrem and Stanley1969; Wagnon and others, Reference Wagnon2013), geodetic methods utilizing satellite-derived data (Bolch and others, Reference Bolch, Pieczonka, Mukherjee and Shea2017; Brun and others, Reference Brun, Berthier, Wagnon, Kääb and Treichler2017; Maurer and others, Reference Maurer, Schaefer, Rupper and Corley2019; Berthier and others, Reference Berthier2023; Mandal and others, Reference Mandal, Vishwakarma, Angchuk, Azam, Garg and Soheb2024) or mass-balance models that incorporate meteorological data (Hussain and others, Reference Hussain, F, Srivastava and Vinze2022; Srivastava and others Reference Srivastava, Garg and Azam2022; Rounce and others, Reference Rounce2023).
Pioneer in situ mass-balance measurements were conducted in the late 19th century in the Alps (Chen and Funk, Reference Chen and Funk1990; Vincent and others, Reference Vincent2004; Zemp and others, Reference Zemp2015). The longest glaciological mass-balance records, dating back to the 1910s, originate from Claridenfirn, Grosser Aletschgletscher and Silvrettagletscher in the Swiss Alps (Huss and Bauder, Reference Huss, Bauder and Funk2009). The first glaciological mass-balance measurements in the HK region were conducted 50 years ago, in June 1974, on the Gara Glacier in Himachal Pradesh (western Himalaya, India) by the Geological Survey of India (GSI) (Raina and others Reference Raina, Kaul and Singh1977). Around the same time, in July 1974, similar measurements were carried out on the Rikha Samba Glacier (Nepal) by a joint Japanese–Nepalese team (Fujii and others, Reference Fujii, Nakawo and Shrestha1976). Over time, the GSI progressively expanded its glacier monitoring network to cover different climatic regimes across the eastern, central and western Himalaya. GSI was the primary organization, especially in the 1970s‒1980s, responsible for monitoring glacier-wide mass balances in the Indian Himalaya (Azam and others, Reference Azam2018). In the Nepalese part of central Himalaya, Japanese scientists also conducted some mass-balance survey during 1978‒1979 on AX010 Glacier (Shorong Himal) (Ageta and others, Reference Ageta, Ohata, Tanaka, Ikegami and Higuchi1980; Fujita and Nuimura, Reference Fujita and Nuimura2011). Department of Science and Technology, India organized a multi-disciplinary and multi-institutional research program on Chhota Shigri Glacier (western Himalaya, India), including mass-balance monitoring during 1986‒1989 (Dobhal and others, Reference Dobhal, Kumar and Mundepi1995). During the 1990s and post-2000, several regional/international research teams from academic/research institutions started monitoring of some selected Himalayan glaciers in Bhutan, China, India and Nepal (Azam and others, Reference Azam2018). Though it has been 50 years since the first glaciological observation in the Himalaya, the Karakoram has yet to witness its first in situ glacier-wide mass-balance monitoring, where the glaciological measurements were conducted only on the ablation area of Baltoro Glacier in 2004 (Mayer and others, Reference Mayer, Lambrecht, Belo, Smiraglia and Diolaiuti2006).
There are increasing concerns about glacier wastage due to climate change, and its consequent impact on downstream populations regarding water availability and hazards (Immerzeel and others, Reference Immerzeel2020; Sattar and others, Reference Sattar, Emmer, Lhazom, Rai and Azam2025). To preserve and conserve glaciers, the High Court of Uttarakhand (India) declared glaciers as legal entities in March 2017 (Lalit Miglani vs State of Uttarakhand and Others, 2017). In March 2021, the President of the Republic of Tajikistan proposed recognizing the need to protect glaciers through an International Year of Glaciers’ Preservation in 2025 (Water and Climate Coalition, 2022). The United Nations declared 2025 the IYGP and designated 21 March of each year as the World Day of Glaciers, starting from 2025 onwards (United Nations 77th session, 2022). The IYGP will serve as a prelude to the Decade of Action for Cryospheric Sciences, which will span from 2025 to 2034.
In honour of IYGP 2025 and marking 50 years since the first glacier-wide mass-balance measurements in 1974, this technical review presents a comprehensive analysis of in situ mass-balance observations across the Himalayan region. Building upon previous reviews (Bolch and others, 2012, Reference Bolch, Wester, Mishra, Mukherji and Shrestha2019; Azam and others, Reference Azam2018; Jackson and others, Reference Jackson2023 etc.), it highlights the progress in field-based glacier monitoring and provides targeted recommendations for future efforts. The focus is specifically on the Himalaya to align with the historical significance of the first mass-balance measurements and to provide region-specific insights relevant for ongoing and future monitoring efforts.
2. Himalaya–Karakoram region
The HK region has an area of 2.7 million km2 (Azam and others, Reference Azam2021) and comprises of three major river basins: Indus, Ganga and Brahmaputra. With a glacierized area of 42 595 km2, HK hosts 42 090 glaciers (Sakai, Reference Sakai2019). Latest RGI 7.0 version also suggested the similar number of glaciers (42 085) and area (42 211 km2) (RGI 7.0 Consortium, 2023). The Karakoram range, having the largest glaciers, covers 48% of the total glacierized area of the HK, while 21%, 23% and 8% is found in the western, central and eastern Himalaya, respectively (Azam and others, Reference Azam2021). Around 11% of the HK glacierized area is debris covered, with higher concentration in the Karakoram and southern slopes of the HK (Herreid and Pellicciotti, Reference Herreid and Pellicciotti2020).
3. Methods
3.1. Glaciological mass balance
A glacier accumulates mass through accumulation processes (snow accumulation, snow drift, avalanches, refreezing, etc.), while it loses mass through ablation processes (snow-ice melt, calving, snow drift, avalanches, sublimation, etc.). The glacier mass balance, or budget, represents the net balance between these accumulation and ablation processes and is typically expressed in meters water equivalent (m w.e.) for ease of comparison globally. Conventionally, the glaciological method assumes that sub-surface mass changes are negligible and quantifies mass exchanges solely at the glacier surface, as surface melt dominates the ablation processes while snow accumulation dominates the accumulation processes (Østrem and Stanley, Reference Østrem and Stanley1969). At selected locations, ablation stakes are inserted using a steam drill to measure point-scale ablation in the ablation area, while accumulation pits are dug to estimate point-scale accumulation in the accumulation area. Subsequently, the point-scale data is extrapolated to the entire glacier to estimate glacier-wide mass balance on an annual or seasonal basis (summer and winter balance). Annual mass balances are typically calculated at the end of the ablation season, which corresponds to the end of summer. The HK range spans latitudes ranging from 27° to 38° (Fig. 1), resulting in variations in the end of the ablation season. In the Karakoram and western Himalaya, the ablation season typically ends by September, while in the central and eastern Himalaya, it extends until the end of October (Sherpa and others, Reference Sherpa2017; Mandal and others, Reference Mandal2020).
Glaciological mass balances from 38 glaciers in the Himalaya–Karakoram (HK). The mean glacier-wide mass balances (red dots) are shown for each mass balance series. Abbreviations for the glaciers are provided in Table S1, along with additional details. The HK boundaries are from Bolch and others (Reference Bolch, Wester, Mishra, Mukherji and Shrestha2019). The background grey area represents the glacierized cover from Sakai (Reference Sakai2019).

The traditional glaciological method (Østrem and Stanley, Reference Østrem and Stanley1969) is employed by organizations such as the GSI, along with other regional and international organizations, for mass-balance measurements in the Himalaya (Azam and others, Reference Azam2018). While pit measurements have historically been used for accumulation estimation (Azam and others, Reference Azam2018), a few recent studies have shown a preference for snow/firn coring using an auger, often marked with blue dye for identification and equipped with a recco detector (Wagnon and others, Reference Wagnon2013). Sometimes, the accumulation stakes have also been installed to measure the accumulation. Figure 2 illustrates a classical scheme of ablation and accumulation points developed on Gara Glacier in the western Himalaya in September 1974 (Raina and others, Reference Raina, Kaul and Singh1977).
Distribution of ablation stakes, accumulation stakes and accumulation pits on Gara Glacier (western Himalaya, India). The map is modified version of a 1:15 000 scale map (GSI, 1977). A network of 34 stakes in the ablation and 13 in the accumulation area were installed during the first glaciological expedition in 1974 by GSI on Gara Glacier (5.2 km2). In September 1975, besides measuring the ablation and accumulation from stakes, four pits were also dug in the accumulation area for annual glacier-wide mass balance estimation (Raina and others, Reference Raina, Kaul and Singh1977). ELA = equilibrium line altitude.

3.2. Up-to-date compilation of glacier-wide mass balances
This study presents an up-to-date compilation of glacier-wide mass balances by extracting all available in situ glaciological mass-balance data from peer-reviewed journals, technical reports, and submissions to the World Glacier Monitoring Service (WGMS) (Table S1). A total of 38 glacier mass-balance series have been reported (as of November 2024), including 14 new series initiated since the last detailed review by Azam and others (Reference Azam2018). Among these 14 new series, the mass balances of Trambau Glacier in the central Himalaya (Nepal) and Drang Drung, Gepang Gath, Hoksar, Khardung, Patsio, Pensilungpa, Phuche, Stok and Sutri Dhaka glaciers in the western Himalaya (India) have been published in peer-reviewed journals (Table S1). However, the other mass-balance data from Thana Glacier in Bhutanese eastern Himalaya and Batal, Bara Shigri and Samudra Tapu glaciers in Indian western Himalaya are available from technical reports or WGMS (Table S1), where sufficient details of mass-balance observations are not available. Moreover, the mass-balance series of these newly initiated mass-balance series is often limited to a few years, generally <10 years (Table S1).
For Gangju La and Thana glaciers (eastern Himalaya, Bhutan), annual glacier-wide mass balances were also estimated using the in situ geodetic method with Differential Global Navigational Satellite System (DGNSS) survey data (Tshering and Fujita, Reference Tshering and Fujita2016; NCHM, 2021). It was found that these estimates were quite close (within uncertainty bars) to those obtained using the traditional glaciological method over the years when both methods were employed (NCHM, 2021). Therefore, whenever the in situ glaciological mass balance was unavailable, DGNSS-based geodetic mass balance is included in the current analysis. On Trambau Glacier (central Himalaya, Nepal), the glacier-wide mass balances were estimated by combining the observed point mass balance in the ablation area and modelled mass-balance profiles in the accumulation area (Sunako and others, Reference Sunako, Fujita, SAKAI and Kayastha2019) hence included in current technical review. On Batal and Bara Shigri glaciers, no accumulation measurements were conducted, and to estimate the glacier-wide mass balance, the annual accumulation was assumed from the nearby Sutri Dhaka Glacier (personal communication with observers). The locations of all 38 glaciers along with their mean mass balances are shown in Fig. 1, and the details of each mass-balance series are provided in Table S1.
3.3. Error assessment of available glacier-wide mass-balance series
The estimated glacier-wide mass balances carry random and systematic errors. The random error generally encompasses the uncertainties linked to measurements, such as those related to positive and negative point mass-balance observations and sampling error resulting from the limited number of sampling sites. The systematic errors arise mainly due to the poor representation of the selected point measurements, avalanche contribution, snow drift and deposition, missing observations and assumed fixed area for mass-balance calculation.
The random error has only been estimated on 15 glaciers out of 38 mass balance series in the Himalaya (Table S1). Unlike the traditional glaciological method for point mass-balances measurements, no single standardized method has been applied to estimate these random errors. A few studies assessed the random errors following the framework proposed by Thibert and others (Reference Thibert, Blanc, Vincent and Eckert2008) on Chhota Shigri, Drang Drung, Gangju La, Gepang Gath, Mera, Pokalde, Rikha Samba, Sutri Dhaka, West Changri Nup and Yala glaciers. On Hoksar, Kolahoi, Patsio and Stok glaciers, the random errors were estimated by combining the uncertainties in the accumulation zone assessed by applying different accumulation gradients (Kenzhebaev and others, Reference Kenzhebaev2017) and in the ablation zone estimated using a one-sigma confidence interval of the regression coefficient (Sold and others, Reference Sold2016). On Pensilungpa Glacier, the method of standard error calculation for a single stake and pit was used (Østrem and Brugman, Reference Østrem and Brugman1991; Dyurgerov, Reference Dyurgerov2002), and then the glacier-wide error was estimated applying the point-scale error with corresponding glacier area using the quadratic sum (Mehta and others, Reference Mehta, Kumar, Garg and Shukla2021). On Trambau Glacier, the random error was evaluated as a quadratic sum of root mean square error from the stake-derived point mass balances and modelled profiles by varying the precipitation gradient (Sunako and others, Reference Sunako, Fujita, SAKAI and Kayastha2019). On the Chorabari and Dokriani glaciers, an error of 10% of the estimated mass balance was assumed to be associated (Dobhal and others, Reference Dobhal, Gergan and Thayyen2008; Reference Dobhal, Mehta and Srivastava2013), while it was assumed 1–3% on the Naradu Glacier (Kumar and others, Reference Kumar2021). These assumed random errors on the Chorabari, Dokriani and Naradu glaciers are not given in Table S1. The information about error estimation on Bara Shigri and Batal glaciers is unavailable.
3.4. Estimating mean mass-balance series from a temporally and spatially inhomogeneous data
The glacier-wide mass-balance data from 38 glaciers are temporally and spatially inhomogeneous (Table S1; Fig. 1). Most of the mass-balance records are short and cover different time periods, which make it difficult to compare them directly or to perform robust trend analyses. Previous studies have estimated the arithmetic mean (Corley, Reference Cogley and Anderson2005; Azam and others, Reference Azam2018) or area-weighted mean (Kaser and others, Reference Kaser, Cogley, Dyurgerov, Meier and Ohmura2006; Zemp and others, Reference Zemp, Hoelzle and Haeberli2009; Dussaillant and others, Reference Dussaillant2025) mass balances from the available series to represent regional or global average mass balances. In this technical review, a framework has been developed to estimate the mean mass-balance series from a temporally and spatially inhomogeneous data.
3.4.1. Annual area-weighted glacier mass balance
The monitored glaciers differ substantially in size (Table S1); therefore, their individual annual mass-balance values ( ${B_{{a_{g,t}}}}$) were combined using area weighting, giving larger glaciers proportionally more influence on the regional mean for each year t. The annual area-weighted mean mass balance ( ${\bar B_t}^A$) was computed as:
 \begin{equation}{\bar B_t}^{\left( A \right)} = \frac{{\mathop \sum \nolimits_{g = 1}^n {A_g}\,{B_{{a_{g,t}}}}}}{{\mathop \sum \nolimits_{g = 1}^n {A_g}}}\end{equation}
where Ag is the glacier area (km2) and n denotes the number of glaciers with available mass-balance data in a given year.
Mass-balance records from Gangju La, AX010, Dokriani Bamak, Kangwure, Rikha Samba, Hamtah, Kolahoi and Naradu are discontinuous; each observation period is therefore treated as an independent series, even when only 1 year of data are available.
3.4.2. Measurement error in annual area-weighted glacier mass balance
Of the 38 mass-balance series, random errors ( ${\sigma _{g,t}}$) have been explicitly estimated for only 15 glaciers, with values ranging from ± 0.19 m w.e. for Chhota Shigri Glacier (western Himalaya) to ± 0.44 m w.e. for Trambau Glacier (central Himalaya) (Table S1). For glaciers lacking direct random error estimates, these were assigned from the geographically nearest glacier with available error data. Assuming the individual glacier errors are independent, the standard error of the area-weighted mean mass balance is given by the standard law of propagation of error:
 \begin{equation}S{E_{meas}}\left( {{{\bar B}_t}^{\left( A \right)}} \right) = \,\frac{{\sqrt {\mathop \sum \nolimits_{g = 1}^n A_g^2\,\sigma _{g,t}^2} }}{{\mathop \sum \nolimits_{g = 1}^n {A_g}}}\end{equation}
 Equation 2 follows the standard propagation of independent errors, giving the error of the weighted mean as the root of the area-squared weighted sum of individual glacier random errors. The estimated standard error decreases with the sample size because in the eq. 2 the denominator ( $\sum\nolimits_{g = 1}^n {{A_g}} $) increases faster than the numerator’s square root. Therefore, the overall SE decreases approximately as 1/ $\sqrt n $ (Fig. S1; Table S2).
3.4.3. Accounting for inter-glacier variability with measurement error
In addition to associated random errors, observed glacier mass balances vary because of real physical differences among glaciers arising from different topography, elevation range, orientation, debris cover and local meteorological conditions (Azam and others, Reference Azam2018; Dussaillant and others, Reference Dussaillant2025). Even if all mass-balance measurements were perfectly accurate, such spatial variability would still exist. Therefore, to obtain a realistic error in the area-weighted regional mean, one must include both (a) the reported measurement error of each glacier and (b) the natural spatial variability between glaciers. When averaging over many glaciers, random errors (from glaciological method) behave like random noise, while inter-glacier differences behave like true spread in the population of glaciers. The total variance of the area-weighted annual mean mass balance therefore has two parts:
 \begin{equation}Variance\left( {{{\bar B}_t}^{\left( A \right)}} \right) = Varianc{e_{measurement}} + \,Varianc{e_{Spatial}}\end{equation}
 For each year t, the inter-glacier variance ( $\tau _t^2$) is estimated from the dispersion of glacier-specific values around the area-weighted mean following the steps:
1. Compute the area-weighted mean mass balance ( ${\bar B_t}^{\left( A \right)}$), using eq. 1.
2. Compute the weighted residuals for each glacier:
 \begin{equation}{r_{g,t}} = \,{B_{{a_{g,t}}}} - \,{\bar B_t}^{\left( A \right)}\,\end{equation}
3. Calculate the area-weighted sample variance of these residuals:
 \begin{equation}{s_t}^2 = \frac{{\mathop \sum \nolimits_{g = 1}^n {A_g}\,{{\left( {{r_{g,t}}} \right)}^2}}}{{\mathop \sum \nolimits_{g = 1}^n {A_g}}}\end{equation}
4. Subtract the portion of variance explained by measurement error to isolate the real spatial variance:
 \begin{equation}{\tau _t}^2 = max\left( {0,\,\,{s_t}^2 - { }\frac{{\mathop \sum \nolimits_{g = 1}^n {A_g}\,\sigma _{g,t}^2}}{{\mathop \sum \nolimits_{g = 1}^n {A_g}}}} \right)\end{equation}
 The ‘max(0, .)’ ensures that the estimate remains non-negative if the observed spread is fully explained by reported errors. This  ${\tau _t}^2\,$ represents the true spatial variance of glacier-specific mass balances in year t.
Each glacier contributed to the spatial variance proportionally to its area. The additional variance of the mean due to inter-glacier difference is:
 \begin{equation}Varianc{e_{Spatial}} = \,{\tau _t}^2\frac{{\mathop \sum \nolimits_{g = 1}^n A_g^2\,}}{{{{\left( {\mathop \sum \nolimits_{g = 1}^n {A_g}} \right)}^2}}}\end{equation}
Adding this to measurement error (eq. 2) yields the total standard error.
 \begin{equation}S{E_{total}}\left( {{{\bar B}_t}^{\left( A \right)}} \right) = \,\sqrt {S{E_{meas}}{{\left( {{{\bar B}_t}^{\left( A \right)}} \right)}^2} + \,\,{\tau _t}^2\frac{{\mathop \sum \nolimits_{g = 1}^n A_g^2\,}}{{{{\left( {\mathop \sum \nolimits_{g = 1}^n {A_g}} \right)}^2}}}} \,\end{equation}
 Hence, the total standard error of the annual mean combines both the measurement error (eq. 2) and the contribution from spatial variability (eqs. 6–7). If the observed glaciers exhibit similar temporal responses, the between-glacier variance ( ${\tau _t}^2)$ approaches zero, causing the total standard error (eq. 8) to approximate the measurement error (eq. 2). Conversely, when glaciers respond markedly differently, ${\tau _t}^2$ becomes significant, leading to a total standard error larger than measurement error.
The cumulative area-weighted mass balance  $B_{cum}^{\left( A \right)}$ over the study period is estimated as:
 \begin{equation}B_{cum}^{\left( A \right)}{ } = \,\mathop \sum \limits_{1975}^{2023} {\bar B_t}^{\left( A \right)}\end{equation}
where  ${\bar B_t}^{\left( A \right)}$ denotes annual area-weighted mean mass balance (eq. 1).
The standard error of the cumulative mass balance was estimated using error propagation in quadrature, assuming that annual errors (eq. 8) are independent between years:
 \begin{equation}S{E_{cum}} = \,\sqrt {\mathop \sum \limits_{1975}^{2023} {{\left[ {\,S{E_{total}}\left( {{{\bar B}_t}^{\left( A \right)}} \right)} \right]}^2}} \,\end{equation}
3.4.4. Long-term regional mean glacier mass balance
The available mass-balance series are uneven in time; therefore, a long-term regional mean should ideally reflect both glacier size and record duration. The corresponding mean is computed following:
 \begin{equation}{\bar B^{\left( {AD} \right)}} = \frac{{\mathop \sum \nolimits_{g = 1}^n {A_g}\,{D_g}\,\,{{\hat B}_g}}}{{\mathop \sum \nolimits_{g = 1}^n {A_g}\,{D_g}}}\end{equation}
 Where  ${\bar B^{\left( {AD} \right)}}$ is the area–duration weighted mean mass balance, ${A_g}$ is the area of the glacier g, ${D_g}$ is the duration of observations (in years) of the mass-balance record for glacier g, and ${\hat B_g}$ is the mean annual mass balance of the glacier g over the available period (Table S1).
To evaluate how different weighting strategies influence the result, four approaches were tested: (i) simple arithmetic mean, (ii) area-weighted mean, (iii) duration-weighted mean and (iv) combined area–duration weighted mean. The resulting regional mean mass-balance estimates range from −0.62 m w.e. a−1 (area–duration weighted) to −0.64 m w.e. a−1 (area-weighted) to −0.65 m w.e. a−1 (mean) and −0.67 m w.e. a−1 (duration-weighted), indicating a relatively narrow spread of 0.05 m w.e. a−1. Although the numerical differences are small, the area–duration weighted mean is the best available method that integrates both glacier size and the length of observation, thereby providing a balanced representation of the heterogeneous dataset.
3.4.5. Error in long-term regional mean glacier mass balance
In this case, the associated propagated measurement standard error becomes:
 \begin{equation}S{E_{meas}}\left( {{{\bar B}^{\left( {AD} \right)}}} \right) = \,\frac{{\sqrt {\mathop \sum \nolimits_{g = 1}^n A_g^2\,D_g^2\,\sigma _g^2} }}{{\mathop \sum \nolimits_{g = 1}^n {A_g}\,{D_g}}}\end{equation}
 Where  ${\sigma _g}$ is the typical random error of the mean annual glacier mass balance, ${\hat B_g}.$
Similarly, the inter-glacier variability term becomes:
 \begin{equation}{\tau _t}^2 = max\left( {0,\,\,\frac{{\mathop \sum \nolimits_{g = 1}^n {A_g}\,{D_g}\,{{\left( {{{\hat B}_g} - \,{{\bar B}^{\left( {AD} \right)}}} \right)}^2}}}{{\mathop \sum \nolimits_{g = 1}^n {A_g}\,{D_g}}} - { }\frac{{\mathop \sum \nolimits_{g = 1}^n {A_g}\,{D_g}\,\sigma _g^2}}{{\mathop \sum \nolimits_{g = 1}^n {A_g}\,{D_g}}}} \right)\end{equation}
And total standard error:
 \begin{equation}S{E_{total}}\left( {{{\bar B}^{\left( {AD} \right)}}} \right) = \,\sqrt {S{E_{meas}}{{\left( {{{\bar B}^{\left( {AD} \right)}}} \right)}^2} + \,\,{\tau _t}^2\frac{{\mathop \sum \nolimits_{g = 1}^n A_g^2\,D_g^2}}{{{{\left( {\mathop \sum \nolimits_{g = 1}^n {A_g}\,{D_g}} \right)}^2}}}} \,\end{equation}
These error estimates account for both the cumulative measurement precision and the spatial heterogeneity of glacier behaviour across the region.
Changes in glacier area also influence estimated annual mass balances hence regional mass balances. However, only a few studies provide both areal and mass change data, and most estimates use a fixed glacier area (hypsometry) since areal change records are often unavailable or do not coincide with mass-balance observations (Azam and others, Reference Azam2018). For Chhota Shigri (since 2002) and Mera Glacier (since 2007), areal changes have been quantified and homogenization applied using linearly adjusted area shrinkage (Wagnon and others, Reference Wagnon2021; Azam and others, Reference Azam2024). On Chhota Shigri, this modified annual mass balances by at most 0.02 m w.e. a−1, indicating negligible impact over 2003–2020 due to limited observed shrinkage, whereas larger effects may be expected elsewhere. Extending such homogenization to all glaciers would require consistent areal change estimates and likely a full reanalysis using the geodetic mass estimate, as many series may contain systematic biases from measurement network limitations (Zemp and others, Reference Zemp2013).
3.5. Benchmark glaciers and their basin/regional representativeness
None of the available mass-balance series in the Himalaya qualifies as a WGMS reference glacier, which requires a minimum of 30 years of continuous measurements (Table S1). To address this gap, the WGMS introduced the term ‘benchmark glacier’ for glaciological mass–balance programs that have not yet reached the 30-year threshold but are in regions lacking ‘reference glaciers’ (WGMS, Reference Zemp, Gärtner-Roer, Nussbaumer, Welty, Dussaillant and Bannwart2023). A WGMS ‘benchmark glacier’ must have at least 10 years of ongoing glaciological mass–balance measurements, with no more than a 1-year observational gap in the past decade. In the Himalaya, seven glaciers qualify as WGMS ‘benchmark glaciers’, including Mera, Pokalde, Rikha Samba, West Changri Nup and Yala glaciers in the central Himalaya (Nepal), and Chhota Shigri and Hoksar in the western Himalaya (India) (Table S1).
In this study, the regional representativeness of benchmark glaciers has been assessed using the geodetic mass balances available from Hugonnet and others (Reference Hugonnet2021). They provided the pentadal geodetic glacier mass estimates over 2000–2005, 2005–2010, 2010–2015 and 2015–2020 periods for all mountain ranges including the HK region. The available glaciological mass balances from the benchmark glaciers were averaged over the common pentadal periods and the null hypothesis H0 (the mean glaciological mass balance is not statistically different from the available geodetic estimates) was accepted at 95% and 90% levels (Zemp and others, Reference Zemp2013), whenever both glaciological and geodetic mass balances were available (Section 5.2). Ideally, such a comparison should be conducted after homogenizing glacier-wide mass balances with corresponding area changes (Zemp and others, Reference Zemp2013). However, due to the unavailability of consistent area change data for many benchmark glaciers, homogenization could not be performed. Nevertheless, Azam and others (Reference Azam2024) demonstrated that applying homogenization to the Chhota Shigri Glacier resulted in only minor adjustments to the annual mass-balance values—well within the uncertainty range—suggesting limited impact on the overall analysis.
4. Results
4.1. Annual glacier-wide mass balances
A total of 302 annual glacier-wide mass balances have been recorded from 38 glaciers since September 1974, comprising 32 positive mass-balance years (11%) and 270 negative mass-balance years (89%) (Fig. 3A). The 302 annual glacier-wide mass balances showed an area–duration weighted mean wastage of −0.62 ± 0.33 m w.e. a−1, equivalent to a cumulative mass loss of −23.95 ± 1.44 m w.e. over 1974‒2023 (Fig. 3C). The most negative mass loss, −2.65 m w.e. a−1, was observed on Thana Glacier (Bhutan) during the 2019/20 hydrological year, whereas the most positive mass balance, 0.57 m w.e. a−1, was observed on Gara Glacier (India) during the 1981/82 hydrological year.
(A) Annual glacier-wide mass balances (m w.e. a−1) from the Himalayan glaciers up to 2023. A total of 302 annual mass-balance values are available from 38 glaciers. Details of each series are provided in Table S1, and glacier locations are shown in Figure 1. (B) Mean annual area-weighted glacier-wide mass balances (m w.e. a−1) from in situ observations, compared with mean annual area-weighted balances for the same 38 glaciers extracted from Dussaillant and others (Reference Dussaillant2025), and with WGMS reference glaciers. The number of annual measurements is shown for in situ and WGMS data; for Dussaillant and others (Reference Dussaillant2025), the number of measurements is fixed at 38 each year and is therefore not shown. (C) The histograms show the mean annual area-weighted glacier-wide mass balances (m w.e. a−1) from in situ observations along with estimated errors and the thick continuous line and shadow show the cumulative mass balances and associated uncertainty over 1974–2023.

Out of 38 glaciers, 17 mass-balance series were discontinued (AX010, Changmekhangpu, Chorabari, Dokriani Bamak, Dunagiri, Kangwure, Gara, Gor Garang, Hamtah, Naimona’nyi, Neh Nar, Patsio, Rulung, Shaune Garang, Shishram, Stok and Tipra Bank glaciers) with a maximum observation period of ∼10–12 years for a few glaciers (Table S1). However, it is possible that some of these glaciers are still being monitored, but no recent information is available in the literature or WGMS. Many of these series were discontinued, as glacier monitoring by GSI were conducted in a mission mode (Azam and others, Reference Azam2018). Nineteen series remain continuous (Batal, Bara Shigri, Chhota Shigri, Drang Drung, Gangju La, Gepang Gath, Hoksar, Khardung, Mera, Pensilungpa, Phuche, Pokalde, Rikha Samba, Sutri Dhaka, Samudra Tapu, Thana, Trambau, West Changri Nup, Yala), while two series (Kolahoi and Naradu glaciers) have been reinitiated (Table S1).
The longest continuous mass-balance series comes from Chhota Shigri Glacier (western Himalaya, India) with 21 years of monitoring, exhibiting a rate of ‒0.47 ± 0.19 m w.e. a−1 over 2002‒2023 (Azam and others, Reference Azam2024). In contrast, observation of Shishram Glacier (western Himalaya, India) was limited to only one hydrological year, 1983/84, revealing a mass loss of ‒0.29 m w.e. a−1 (Kaul, Reference Kaul1986). Mera Glacier (central Himalaya, Nepal) boasts the second-longest mass-balance series, with a mass wastage rate of ‒0.43 ± 0.21 m w.e. a−1 spanning over 2007–2023 (Wagnon and others, Reference Wagnon2021; WGMS, 2024). The observation on Khardung and Phuche glaciers is continuous since 2010 (personal communication with observers), but the annual glacier-wide mass balances have been published only over 2014–2017 period (Dharpure and others, Reference Dharpure, Goswami, Patel, Jain and Kulkarni2024).
4.2. Glacier mass-balance comparision
The number of available annual mass-balance measurements in the Himalaya increased from just one in 1975 to a peak of 22 in 2017 (Table S2). In contrast, WGMS reference glaciers benefited from broader and more consistent monitoring, with measurements rising from 36 in 1975 to 61 in 2021. Despite differences in spatial and temporal coverage, the mean mass-balance series from the Himalaya shows a strong agreement with the WGMS reference glacier series (Fig. 3B). During the period 1974–2023, the average mass balance for WGMS reference glaciers was −0.51 m w.e. a−1, equivalent to a cumulative mass loss of −25. 51 m w.e. (Fig. S2), compared to a slightly more negative area-duration weighted mean mass loss of −0.62 ± 0.33 m w.e. a−1 equivalent to a cumulative mass loss of −23.95 ± 1.44 m w.e. for the Himalayan glaciers (Fig. 3C). It should be noted that the mean mass balance of −0.62 ± 0.33 m w.e. a⁻¹ for 1974–2023 is area–duration weighted, whereas the annual mean and cumulative mass balances (Fig. 3C) are area-weighted (see Section 3.4). Therefore, a difference arises between the estimated cumulative mass loss from the present approach and that obtained by simply multiplying the area–duration weighted mean mass balance over 1974–2023 (−30.38 m w.e.).
However, the estimated mass wastage from glaciological observations appears somewhat more negative than estimates from geodetic analyses. For example, Maurer and others (Reference Maurer, Schaefer, Rupper and Corley2019) reported a mean mass wastage of − 0.31 ± 0.13 m w.e. a−1 for the 650 largest Himalayan glaciers during 1975–2016. In contrast, the geodetic estimates from King and others (Reference King2019) were more consistent with the glaciological data within uncertainty ranges, reporting −0.25 ± 0.09 m w.e. a−1 (∼1974–2000) versus −0.31 ± 0.34 m w.e. a−1 for the pre-2000 period, and −0.39 ± 0.09 m w.e. a−1 versus −0.66 ± 0.33 m w.e. a−1 (2000 to ∼2015) for the post-2000 period.
Dussaillant and others (Reference Dussaillant2025; hereafter Dussaillant2025) temporally downscaled geodetic data using in situ observations and provided annual glacier-wide mass balances for all glaciers larger than 0.01 km2 worldwide. Their dataset is extracted for 1974–2023 for the 38 glaciers with in-situ measurements. The area–duration weighted mean mass balance over this period is −0.48 m w.e. a−1, which is lower than the −0.62 ± 0.33 m w.e. a−1 estimated in this study (Fig. 3B). However, the cumulative mass loss of −23.60 m w.e. (Fig. S3) from Dussaillant2025 is very close the cumulative mass loss of −23.95 ± 1.44 m w.e. estimated in this study (Fig. 3C). This difference in mean annual mass balances, though within the uncertainty range, is expected because Dussaillant2025 derived annual balances from geodetic measurements, which are less affected by systematic errors linked to unsampled areas—a major source of bias in in situ data. For example, in situ measurements from Hamtah Glacier indicated a high mean wastage of −1.43 m w.e. a−1 during 2000–2012, compared with −0.68 m w.e. a−1 from Dussaillant2025, reflecting a 55% overestimation in in situ data due to the absence of a well-developed accumulation area and therefore the lack of accumulation measurements (Vincent and others, Reference Vincent2013). As suggested by Azam and others (Reference Azam2018), certain glaciers may carry systematic biases in in situ observations, leading to more negative mass balances compared to Dussaillant2025. Another factor contributing to the difference is that the dataset of Dussaillant2025 provides continuous temporal coverage, whereas in situ observations are sparse and heterogeneous.
Azam and others (Reference Azam2018) identified six Himalayan glaciers with potential systematic biases in their in situ mass-balance series (Changmekhangpu, Chorabari, Dunagiri, Kangwure, Hamtah and Kolahoi). To account for this, I removed these six glaciers, along with four others (Batal, Bara Shigri, Samudra Tapu and Thana glaciers) for which mass-balance observations are insufficiently detailed (Section 3.2). The resulting area–duration weighted mean mass balance is −0.54 ± 0.33 m w.e. a−1, slightly less negative than −0.62 ± 0.33 m w.e. a−1, thereby highlighting the possible influence of biased series on the regional estimate.
Chhota Shigri (the longest mass-balance series) and Mera Glacier (the second longest) provide a unique opportunity to evaluate the Dussaillant2025 dataset because both glaciers have been reanalysed using high-resolution Pléiades stereo imagery (Section 5.4). Unlike most Himalayan glaciers, whose in situ mass-balance series may suffer from unquantified systematic errors, these two datasets represent the most robust and bias-corrected glaciological records currently available in the region.
The Dussaillant2025 dataset closely follows the temporal variability of the reanalysed annual mass-balance series but shows less negative mean values for both Chhota Shigri (–0.26 versus −0.47 m w.e. a−1 over 2002–2023) and Mera Glacier (–0.38 versus −0.45 m w.e. a−1 over 2007–2023), suggesting a positive bias in the Dussaillant2025 estimates (Fig. 4). This difference, which remains within the uncertainty bounds, likely reflects methodological differences between temporally downscaled geodetic estimates and reanalysed glaciological series rather than residual bias in the field data.
Comparison of annual glacier-wide mass balances for (A) Chhota Shigri and (B) Mera glaciers derived from reanalysed glaciological observations and from Dussaillant and others (Reference Dussaillant2025). Geodetic mass-balance estimates used to reanalyse the glaciological series are also shown for the corresponding periods. Thin error bars and envelopes indicate the uncertainty associated with the reanalysed glaciological mass balances and geodetic estimates; uncertainty estimates are not available for the Dussaillant and others (Reference Dussaillant2025) series. The hydrological years 2002/03 and 2020–2023 fall outside the calibration periods on Chhota Shigri but were corrected using the mean bias estimated for 2003–2014 and 2014–2020, respectively (Azam and others, Reference Azam2024). Similarly, the years beyond calibration period were calibrated on Mera Glacier (Wagnon and others, Reference Wagnon2021).

At the regional scale, over the entire Himalaya (20432 glaciers >0.01 km2; 19860 km2 total area), the area–duration weighted mean mass balance from Dussaillant2025 is −0.38 ± 0.31 m w.e. a−1, compared with −0.62 ± 0.33 m w.e. a−1 from all in situ data and −0.54 ± 0.33 m w.e. a−1 from the screened in situ dataset for 1974–2023. Although these estimates overlap within their uncertainty ranges, Dussaillant2025 indicates mean wastage of −0.46 ± 0.33 m w.e. a−1 during 1974–1999 and −0.50 ± 0.33 m w.e. a−1 during 2000–2023, suggesting no acceleration of wastage after 2000, in contrast to other studies (see Section 4.3).
These glacier-scale and regional-scale comparisons demonstrate that both heterogeneous in situ data and the Dussaillant2025 dataset have limitations. While the estimates fall within uncertainty ranges, the possibility of systematic negative biases in in situ observations (Azam and others, Reference Azam2018) suggests that the estimated −0.62 ± 0.33 m w.e. a−1 value should be interpreted with caution. A recommendation for a systematic evaluation of available in situ series is proposed in Section 5.4.
4.3. Accelerated glacier wastage post-2000
In situ observations show an increase in annual mass balances, rising from 75 during the pre-2000 period (1974–2000) to 227 during the post-2000 period (2000–2023). The area–duration weighted mean mass wastage increased, from −0.31 ± 0.34 m w.e. a‒1 in the pre-2000 period to −0.66 ± 0.33 m w.e. a−1 post-2000. Figure 5 displays the probability distribution curves (Fig. 5A) and box whisker plots (Fig. 5B) for both periods, clearly indicating an accelerated wastage post-2000. In our previous review, Azam and others (Reference Azam2018) suggested that the mean glaciological mass balance may have become less negative after 2000. However, this inference was based on a limited dataset (only 142 against 302 data points in this paper) and was recommended for further validation. The expanded dataset used in this study confirms that the earlier apparent reduction in mass loss was likely an artifact of sparse post-2000 observations (67 data points in Azam and others vs 227 in the current study, 340% increase).
(A) The annual glacier-wide mass balances (m w.e. a−1) from all 38 glaciers are represented as green shades (pre-2000, n = 75), blue shades (post-2000, n = 227) and red shades (2021/22 hydrological year, n = 12) vertical lines. The fitted probability density function for pre-2000 (green curve), post-2000 (blue curve) and 2021/22 hydrological year (red curve) are also shown. (B) The box whisker plot showing the data pre-2000, post-2000 and 2021/22 hydrological year. The outliers indicate the extreme negative mass balance years post-2000.

Consistent with these findings, a geodetic analysis of the 650 largest Himalayan glaciers reported a doubling of mean mass wastage—from −0.22 ± 0.13 m w.e. a−1 during 1975–2000 to −0.43 ± 0.14 m w.e. a−1 during 2000–2016 (Maurer and others, Reference Maurer, Schaefer, Rupper and Corley2019). Similarly, King and others (Reference King2020), covering six major Himalayan regions (1275 glaciers spanning 7450 km2), found a significant increase from −0.25 ± 0.09 m w.e. a−1 (1974–2000) to −0.39 ± 0.09 m w.e. a−1 (2000–2015). A synthesis by Bolch and others (Reference Bolch, Wester, Mishra, Mukherji and Shrestha2019) also reported increased glacier mass loss post-2000. A more recent review by Jackson and others (Reference Jackson2023), which compiled geodetic estimates from across the Himalayan region, reported an almost twofold increase in mass loss post-2000. WGMS reference glaciers also showed a strong increase in mass wastage from −0.32 m w.e. a−1 during pre-2000 period (1974–2000) to −0.72 m w.e. a−1 during the post-2000 period (2001–2023). In contrast to the present study and all other studies, Dussaillant2025 indicates mean wastage for the entire Himalaya as −0.46 ± 0.33 m w.e. a−1 during 1974–1999 and −0.50 ± 0.33 m w.e. a−1 during 2000–2023, suggesting a very small acceleration of wastage after 2000.
Nevertheless, comparisons of glacier mass wastage between pre- and post-2000 periods remain methodologically challenging. For example, Bolch and others (Reference Bolch, Wester, Mishra, Mukherji and Shrestha2019) included all available studies—geodetic, glaciological, and model-based—for both timeframes, whereas Jackson and others (Reference Jackson2023) relied exclusively on geodetic studies, compiling data from various sources for the pre-2000 period and using only the dataset from Hugonnet and others (Reference Hugonnet2021) for the post-2000 analysis. Furthermore, the spatial coverage for 1974–1999 is comparatively limited, while post-2000 data consistently cover more than 92% of the total glacierized area.
The absence of post-2000 mass loss acceleration in the Dussaillant2025 dataset is consistent with the structure of their reconstruction method. While this approach provides unique spatial and temporal coverage, it inherently smooths interannual variability and reduces sensitivity to step-like changes in mass loss. Annual mass balances are derived by spatially kriging glaciological anomalies—which are sparse in the Himalaya and often extrapolated over large distances (up to ∼500–1000 km)—and calibrating them to multi-year geodetic mass-balance estimates (Eqs. 3 and 7 in Dussaillant2025). This approach inherently smooths interannual variability, as short-term fluctuations are constrained by long-period geodetic means and further averaged through weighted combinations of multiple calibration periods (Eq. 8 in Dussaillant2025). As a result, accelerations evident in direct geodetic comparisons (e.g. Maurer and others, Reference Maurer, Schaefer, Rupper and Corley2019) or in in situ series in the present study are damped in the final product of Dussaillant2025. The absence of mass loss acceleration in Dussaillant2025 therefore reflects methodological smoothing rather than a contradiction of the observed increase in glacier mass loss, underscoring the importance of continued long-term in-situ observations and temporally resolved geodetic data at the glacier-wide scale for reanalysing mass-balance series and detecting acceleration at regional scales.
4.4. Acceleration of glacier mass loss since 1974
In this section, an analysis of long-term glacier mass-balance trends is conducted using the area–duration weighted mean annual mass-balance series. Sen’s slope was applied because it provides a robust estimate of long-term trends that is less sensitive to outliers and strong interannual variability than ordinary least-squares regression (Sen, Reference Sen1968), making it particularly suitable for long-term glacier mass-balance analyses. The Sen’s slope analysis yields a trend of −0.0093 m w.e. a−1 (P = 0.021), indicating a statistically significant long-term acceleration in glacier mass loss since 1974 (Fig. 6A). Linear regression yields a trend of −0.0091 m w.e. a−1 (P = 0.012), which is consistent with the Sen’s slope estimate (−0.0093 m w.e. a−1), confirming the robustness of the detected long-term acceleration in glacier mass loss.
Area–duration weighted mean annual mass-balance series from the present study. Panel (A) shows the full period (1974–2023), while panel (B) compares pre- and post-2000 trends. Black lines denote Sen’s slope trends, representing long-term changes in annual mass balance and a progressive shift toward increasingly negative conditions.

The area–duration weighted mean glacier mass balance over 1974–2023 is −0.62 ± 0.33 m w.e. a−1, representing the average magnitude of annual mass loss. In contrast, the Sen’s slope of −0.0093 m w.e. a−1 reflects the rate of change in the annual mass-balance series rather than the absolute mass loss itself. In practical terms, this corresponds to an apparent acceleration in glacier mass loss of ∼9 cm w.e. per decade over the past five decades.
The pre-2000 period exhibits a moderate but statistically insignificant negative trend, whereas the post-2000 period is characterized by strong interannual variability and several extreme negative mass-balance years (Fig. 6B). Consequently, despite enhanced mass loss after 2000, the linear trend remains weak and statistically insignificant. This behaviour indicates that post-2000 glacier wastage (−0.66 ± 0.33 m w.e. a−1) is dominated by episodic extreme melt years rather than a smooth, monotonic acceleration (Fig. 6B).
The mass-balance series from Dussaillant2025 shows a weak and statistically insignificant long-term trend over 1974–2023, with a Sen’s slope of 0.0024 m w.e. a−1 (P = 0.55). Similarly, trends for both the pre-2000 and post-2000 periods are statistically insignificant (Fig. S4). The absence of a significant trend in the Dussaillant2025 dataset again reflects the temporal smoothing inherent in their reconstruction approach, whereas the significant trend derived from in-situ observations reflects the stronger interannual variability preserved in direct measurements (Section 4.3).
4.5. Extreme glacier wastage in 2021/22 hydrological year
In 2022, the global mean temperature was 1.15 ± 0.13°C higher than the pre-industrial 1850–1900 average (WMO, 2022), resulting in extreme glacier mass loss in many of the mountain ranges (Cremona and others, Reference Cremona, Huss, Landmann, Borner and Farinotti2023). Special attention was given to the extreme 2021/22 hydrological year as Asia was gripped by early summer heatwave. Glacier-wide mass-balance data were available for only 12 glaciers for the 2021/22 year, showing an exceptionally high mass wastage of −1.15 ± 0.14 m w.e. a−1 (Fig. 5). In agreement, the mean wastage of all WGMS reference glaciers was −1.09 m w.e. a−1 for 2021/22 (WGMS, Reference Zemp, Gärtner-Roer, Nussbaumer, Welty, Dussaillant and Bannwart2023) and Dussaillant2025 estimated a mean wastage of −1.12 m w.e. a−1 for 2021/22 for the entire Himalaya.
Chhota Shigri Glacier, representing the longest mass-balance series in the Himalaya, showed the maximum wastage of ‒1.71 ± 0.24 m w.e. a‒1 in 2021/22 since 2002 (Azam and others, Reference Azam2024). In line, the Tuyuksu Glacier (Tien Shan, Kazakhstan) experienced a mass loss of ‒1.13 m w.e. a−1 (WGMS, 2024) while Urumqi Glacier No. 1 (Tien Shan, China) lost ‒1.25 ± 0.10 m w.e. a−1 (Xu and others, Reference Xu, Li, Wang, Li, Zhou and Liu2024) in 2021/22. Furthermore, the Hintereisferner (Austrin Alps) also showed a record-breaking wastage of ‒3.32 m w.e. a‒1 in the 70-year long record of annual mass balances over 1952–2022 (Voordendag and others, Reference Voordendag, Prinz, Schuster and Kaser2023).
5. Discussion
5.1. Monitored glaciers: spatial coverage and glacier size
The western Himalaya has the highest number of monitored glaciers, with 22, followed by the central Himalaya with 16, and the eastern Himalaya with only three (Table S1; Fig. 1). Furthermore, most of these monitored glaciers are concentrated in a few regions, such as Lahaul–Spiti valley (eight glaciers), the Baspa Basin (four glaciers), and the Jhelum Basin (four glaciers) in the western Himalaya, and the Garhwal Region (four glaciers) in the central Himalaya. Despite hosting the largest glaciers and the maximum ice volume, the Karakoram Region has yet to witness field-based glacier-wide mass-balance monitoring. Existing field measurements are limited to localized ablation studies such as on Baltoro and Burche glaciers primarily conducted either to investigate melt characteristics or to support satellite-based geodetic analyses (Mayer and others, Reference Mayer, Lambrecht, Belo, Smiraglia and Diolaiuti2006; Muhammad and Tian, Reference Muhammad and Tian2016). Additionally, regions like Sikkim, Zanskar and Bhutan (eastern Himalaya) remain largely unexplored.
Most of the monitored glaciers are relatively small, with seven glaciers covering less than 1 km2, 14 glaciers ranging between 1 and 5 km2, eight glaciers between 5 and 10 km2, and nine glaciers exceeding 10 km2 (Table S1). These small glaciers often lack fully developed accumulation areas. For instance, glaciers such as Changmekhangpu (5.6 km2), West Changri Nup (0.9 km2), Chorabari (6.7 km2), Hamtah (3.2 km2) and Batal (4.6 km2) are surrounded by steep headwalls, resulting in poorly formed accumulation zones. On such glaciers, accumulation areas are primarily sustained by sporadic avalanche inputs, which cannot be measured by traditional glaciological methods. As a result, glacier-wide mass-balance estimates for these glaciers often show negative biases (Vincent and others, Reference Vincent2013; Laha and others, Reference Laha2017; Sherpa and others, Reference Sherpa2017). However, in the current analysis, the compiled mean glacier-wide mass balances from all 38 glaciers showed no relationship with glacier area (R 2 = 0.001; figure not shown).
To address the gap in monitoring large glaciers in the Himalaya (Azam and others, Reference Azam2018; Vishwakarma and others, Reference Vishwakarma2022), new monitoring efforts have recently been initiated on Bara Shigri (131.50 km2), Samudra Tapu (81.68 km2) and Drang Drung (69.6 km2) glaciers in the western Himalaya (Table S1). These large glaciers have well-developed accumulation areas; however, accessing these regions is often challenging due to crevasses and logistical difficulties. For example, monitoring on Bara Shigri Glacier is limited to the ablation area, and the glacier-wide mass balances were estimated applying the accumulation measurements from Sutri Dhaka Glacier (personal communication with observers). Although the accumulation area of Sutri Dhaka Glacier is located only ∼30 km away from that of Bara Shigri Glacier, and both glaciers lie in the same Lahaul–Spiti valley, snow accumulation on Bara Shigri might differ significantly. This is due to Bara Shigri’s six-times larger area (131.50 km2) and broader elevation range (4040–6632 m a.s.l.) compared to Sutri Dhaka Glacier (20.5 km2; 4487–6000 m a.s.l.). Consequently, the glacier-wide mass-balance estimates for Bara Shigri Glacier likely subject to biases. For Samudra Tapu Glacier, no information is currently available regarding point mass-balance measurements (WGMS, 2024) hence difficult to judge the glacier-wide mass-balance series. Accumulation measurements on Drang Drung Glacier were conducted; however, due to a dense crevasse network, these measurements were restricted to areas near the equilibrium line altitude. As a result, the estimated glacier-wide mass balances may be subject to biases (Azam and others, Reference Azam, Hussain and Kaushik2025).
5.2. Basin and regional representativeness of benchmark glaciers
In situ monitoring of all glaciers within a mountain range is practically impossible. Therefore, a few glaciers are selected from different basins with the expectation that these will serve as representative glaciers for their respective basins. The results from these monitored glaciers are then extrapolated to understand regional glacier behaviour under changing climate. The basic considerations of a suitable glacier representing local geographical area and climate settings have been discussed in the literature (Østrem and Stanley, Reference Østrem and Stanley1969; Cogley and others, Reference Cogley2011). However, in the HK region, extreme altitudes and the inaccessibility of glacierized areas have often led to compromises in adhering to these suggested criteria (Azam and others, Reference Azam2018).
A detailed assessment of the representativeness of available seven benchmark glaciers is conducted here, as these glaciers have ongoing, continuous mass–balance series spanning at least 10 years (Table 1). In the Himalaya, arbitrarily selected glaciers are often referred to as representative glaciers. However, each glacier has a unique topographic configuration—characterized by factors such as debris cover, the ratio of accumulation to ablation areas, altitude range, valley orientation and the presence of thermokarst features—as well as distinct micro-meteorological conditions. Consequently, mass-balance variations can differ significantly between glaciers, even when they are exposed to the same regional climatic conditions. For instance, in the Everest region, the rate of mass loss of Mera, Pokalde and West Changri Nup glaciers varies significantly, from the least wastage on Mera Glacier (‒0.43 ± 0.21 m w.e. a−1 over 2007–2023) to moderate mass wastage on Pokalde Glacier (‒0.87 ± 0.28 m w.e. a−1 over 2009–2023), and extremely rapid mass wastage on Changri Nup Glacier (‒1.51 ± 0.27 m w.e. a−1 over 2010–2023) (Table S1). These contrasting mass balances are suggested to be due to the lower maximum elevations of Pokalde (5430–5690 m a.s.l.) and West Changri Nup (5330–5690 m a.s.l.) glaciers, resulting in years when their accumulation area ratio drops to zero, as well as steeper vertical mass-balance gradients on Pokalde and West Changri Nup glaciers (located ∼30 km further north of Mera Glacier in the drier inner part of the range) (Sherpa and others, Reference Sherpa2017). Though there is strong regional heterogeneity among these field-monitored glaciers, the mean glacier-wide mass wastage of ‒0.44 ± 0.17 m w.e. a−1 over 2009–2018 on Mera Glacier is very close to the regional geodetic mass wastage of ‒0.38 ± 0.11 m w.e. a−1 over 2009–2018 from 79 glaciers surrounding Mount Everest, including the Dudh Koshi Basin (King and others, Reference King2020). This suggests the representativeness of Mera Glacier to the Everest area. Conversely, Pokalde Glacier (‒0.75 ± 0.28 m w.e. a−1 over 2009–2018), with nearly two times the mean geodetic wastage, and West Changri Nup Glacier (‒1.45 ± 0.27 m w.e. a−1 over 2010–2018), with more than four times the wastage, are not representative of the regional glaciers surrounding Mount Everest (Table 2).
Representativeness of the Himalayan benchmark glaciers to their corresponding basin/valley and the whole region (central Himalaya [CH] and western Himalaya [WH]).

Regional representativeness of benchmark glaciers. The geodetic estimates for the western and central Himalaya are from Hugonnet and others (Reference Hugonnet2021). The glaciological mean annual glacier-wide mass balances for the selected benchmark glaciers are from the collected mass-balance database (Table S1). The null hypothesis H0 (the mean glaciological mass balance is not statistically different from the available geodetic estimates) was accepted at 95% and 90% levels over the different periods whenever both glaciological and geodetic mass balances were available (Yes = Null hypothesis accepted; No = Null hypothesis not accepted).

Yala is a small (1.6 km2), low-lying glacier in Langtang Valley (Nepal) with a limited elevation range (5168–5661 m a.s.l.). Yala Glacier showed a mean mass wastage of ‒0.87 ± 0.28 m w.e. a−1 over 2011–2023, which is identical to the mean mass wastage of Pokalde Glacier over almost same period (‒0.87 ± 0.28 m w.e. a−1 over 2009–2023). A detailed analysis of the mass-balance series of Yala Glacier suggested that the series is negatively biased compared to available regional estimates (Stumm and others, Reference Stumm, Joshi, Gurung and Silwal2021). Therefore, Yala is not a representative glacier for the Langtang Valley. Rikha Samba (Hidden Valley, Nepal) is a higher-lying glacier with a larger elevation range (5416–6515 m a.s.l.). Stumm and others (Reference Stumm, Joshi, Gurung and Silwal2021) performed a detailed comparison of glacier-wide mass-balance series on Rikha Samba Glacier with the available regional geodetic mass estimates and suggested that Rikha Samba can be considered a representative glacier for Hidden Valley (Nepal).
The representativeness of Chhota Shigri Glacier for the entire Lahaul–Spiti valley (western Himalaya) has been suggested in previous studies (Vincent and others, Reference Vincent2013; Azam and others, Reference Azam2021). Recently, the in situ glacier-wide mass balances of Chhota Shigri Glacier were reanalysed for the period 2002–2023 (Azam and others, Reference Azam2024). Therefore, its representativeness is re-evaluated here using available geodetic estimates for the Lahaul–Spiti valley. Kääb and others (Reference Kääb, Treichler, Nuth and Berthier2015) estimated a mean geodetic wastage of ‒0.42 ± 0.26 m w.e. a‒1 around Chhota Shigri Glacier (2°N × 2°E cell) over 2003–2008, while the in situ mass wastage on Chhota Shigri Glacier during the same period was slightly higher at ‒0.67 ± 0.19 m w.e. a‒1, but within uncertainty bars. Another study by Vijay and Braun (Reference Vijay and Braun2016) reported a geodetic mass balance of ‒0.55 ± 0.37 m w.e. a‒1 for the Lahaul–Spiti valley (encompassing 1710 km2 of glacierized area) over 2000–2012. Chhota Shigri Glacier showed a comparable mean wastage of ‒0.44 ± 0.19 m w.e. a‒1 over slightly different period of 2002–2012. Brun and others (Reference Brun, Berthier, Wagnon, Kääb and Treichler2017) estimated the geodetic mass balance for the Lahaul–Spiti (covering 7,960 km2 of glacierized area) as ‒0.37 ± 0.15 m w.e. a‒1 over 2000–2016. In agreement, the in situ mass balance for Chhota Shigri Glacier during 2002–2016 showed a comparable mean wastage of ‒0.45 ± 0.19 m w.e. a‒1. In addition, Mukherjee and others (Reference Mukherjee, Bhattacharya, Pieczonka, Ghosh and Bolch2018) analysed geodetic mass changes in the Lahaul–Spiti valley, including Chhota Shigri, over 1971–2013 and demonstrated that the mass-balance evolution of Chhota Shigri Glacier is consistent with the mean behaviour of the broader region. The strong agreement between regional geodetic estimates and in-situ glaciological measurements on Chhota Shigri Glacier reaffirms its representativeness for the Lahaul–Spiti valley. Unfortunately, no geodetic estimates are available for the Jhelum Basin to assess the representativeness of mass-balance series of Hoksar Glacier (western Himalaya).
The basin/valley representativeness of Mera, Rikha Samba and Chhota Shigri glaciers has been further checked at regional scale following the statistical procedure against the available geodetic mass estimates from Hugonnet and others (Reference Hugonnet2021) (Section 3.5). As no basin-wide mass balance is available to check the representativeness of the Hoksar Glacier, it is also included in this analysis. The glaciological mass wastage on Mera Glacier is statistically similar to geodetic mass wastage in the central Himalaya over 2010–2015 and 2015–2020 periods at 95% level; however, the null hypothesis was not accepted at 90% level over 2015–2020 period (Table 2). Comparing the glaciological mass balances with geodetic mass wastage over longer period of 2010–2020, the null hypothesis was accepted at both 95% and 90% levels (Table 2). This suggests that the Mera is a representative glacier for the whole central Himalaya. Over the common observed period of 2011–2021, the mass balance of Rikha Samba Glacier (‒0.35 ± 0.32 m w.e. a−1) is very close to that of Mera Glacier (‒0.44 ± 0.18 m w.e. a−1). The glaciological mass wastage on Rikha Samba was also statistically similar to the geodetic mass wastage in the central Himalaya over 2015–2020 period, suggesting its regional representativeness (Table 2). However, it must be noted that this representativeness is just for 5-year period.
The glaciological mass-balance series on Chhota Shigri Glacier was also statistically similar to the geodetic estimates in the whole western Himalaya and the null hypothesis was accepted over 2005–2010, and 2010–2015 periods, except at over 2015–2020, when it was accepted at only at 95% level. However, over longer periods (2005–2020 and 2010–2020), the null hypothesis was accepted at both 95% and 90% levels (Table 2). This confirms that the Chhota Shigri is a representative glacier for the whole western Himalaya. The glaciological mass wastage on Hoksar Glacier is more than double that of geodetic mass wastage of the western Himalaya over 2015–2020 and the null hypothesis was not accepted (Table 2), suggesting that Hoksar is not a representative glacier for the western Himalaya. As this comparison period was possible only over 5-year period and at very large scale, it should not be considered that the Hoksar Glacier can not be a representative glacier for the Jhelum Basin; therefore, its representativeness must be checked when the geodetic estimates are available for the Jhelum Basin. Furthermore, as the null hypothesis was rejected at 90% level over 2015–2020 for both Mera and Chhota Shigri glaciers, it is suggested to occasionally check their regional representativeness after 5–10 years.
Mera, Rikha Samba and Chhota Shigri glaciers are not only the representative glaciers for their basins/valley but also representative glaciers for the whole central and western Himalaya. It is to be noted that these glaciers have large elevation ranges, developed accumulation areas (where accumulation is less affected by avalanche inputs and measurements can be performed), and less debris-cover over their ablation areas (Table S1). Therefore, observers should consider these topographic factors into consideration while selecting a glacier for long-term monitoring.
However, Mera, Rikha Samba and Chhota Shigri glaciers are the representative glaciers for their corresponding basins, their annual mass balances over the common observed periods did not show any correlations. The correlations between annual mass balances of Chhota Shigri and Rikha Samba (R 2 = 0.007; 2007–2023) and Chhota Shigri and Mera (R 2 = 0.097; 2011–2021) were negligible, while a poor correlation was observed between annual mass balances of Rikha Samba and Mera glaciers (R 2 = 0.186; 2011–2021). These correlations can partly be explained due the different climatic conditions: Chhota Shigri falls in monsoon-arid climate while Rikha Samaba and Mera glaciers are in the monsoon-dominated climate hence their climatic conditions as well as the response to local meteorological conditions is different (Mandal and others, Reference Mandal2020; Stumm and others, Reference Stumm, Joshi, Gurung and Silwal2021). In addition, non-climatic factors—including glacier hypsometry, aspect, debris cover and dynamic instabilities—further amplify these spatial differences, producing heterogeneous mass-balance behaviour across glaciers in the same or neighbouring valleys (Sherpa and others, Reference Sherpa2017; Mukherjee and others, Reference Mukherjee, Bhattacharya, Pieczonka, Ghosh and Bolch2018; Garg and others, Reference Garg, Shukla and Azam2024; Vatsal and others, Reference Vatsal2024).
5.3. Recommendation for standardized random error estimation
Random errors in glaciological method accumulate according to the law of error propagation. A thorough assessment of the random errors has been rare on the Himalayan glaciers, and mass-balance data have frequently been documented and used without or with a roughly estimated error (Table S1). In Section 3.3, a review of random errors estimated for corresponding mass-balance series is presented. Of 38 mass-balance series, the random errors have been estimated only on 15 series by applying a variety of methods. The lack of a standardized method for random error estimations in the glacier-wide mass-balance series on the Himalayan glaciers is a significant issue that needs to be addressed. Method of random errors estimation in glacier mass balance should be standardized to improve the quality of data and provide reliable and directly comparable uncertainty estimates. An exhaustive framework for random error estimation in glacier-wide mass balance using glaciological method is established by Thibert and others (Reference Thibert, Blanc, Vincent and Eckert2008), based on 51 years of data from Glacier de Sarennes in the French Alps. Given that the methodology for traditional mass-balance observations is standardized globally (Østrem and Stanley, Reference Østrem and Stanley1969), this error estimation framework is widely applicable and can be employed to assess uncertainties in any in situ mass-balance series. However, a longer period of observations generally results in better-constrained estimates of random errors, improving the robustness of the uncertainty assessment (Thibert and others, Reference Thibert, Blanc, Vincent and Eckert2008). Out of 19 ongoing mass-balance series (Section 4.1), the methodology of Thibert and others (Reference Thibert, Blanc, Vincent and Eckert2008) has been applied only on nine glaciers (Chhota Shigri, Drang Drung, Gangju La, Mera, Pokalde, Rikha Samba, Sutri Dhaka, West Changri Nup and Yala). It is therefore recommended to apply the methodology proposed by Thibert and others (Reference Thibert, Blanc, Vincent and Eckert2008) to all ongoing mass-balance series to enable direct and consistent comparison of random errors across different glaciers.
5.4. Recommendation for reanalysing the mass-balance series in the Himalaya
In situ glacier-wide mass balances obtained using the traditional glaciological method often carry systematic biases, which accumulate linearly with number of measurement years. Among the 38 mass-balance series (Table S1), several observed glaciers are heavily debris-covered, avalanche-fed or lack a well-developed accumulation area. Consequently, some of these glaciers’ mass-balance series may have biases (Laha and others, Reference Laha2017; Azam and others, Reference Azam2018). These biases can be assessed using available geodetic estimates for the same period, and, if necessary, corrected by reanalysing the glaciological mass balance with geodetic mass-balance data (Zemp and others, Reference Zemp2013; Andreassen and others, Reference Andreassen, Elvehøy, Kjøllmoen and Engeset2016).
Reanalysing existing glacier mass-balance series in the Himalaya remains challenging because many records predate 2000, involve small glaciers where geodetic estimates might have large uncertainties, and cover short observation periods (Table S1). In addition, obtaining geodetic estimates that exactly match the timing of in situ observations is often difficult. However, recent studies show that this limitation can be partly addressed using historical stereo imagery, particularly declassified spy satellite data, which enable geodetic mass-balance reconstruction for the 1970s–1980s (Pellicciotti and others, Reference Pellicciotti, Stephan, Miles, Herreid, W and Bolch2015; Maurer and others, Reference Maurer, Schaefer, Rupper and Corley2019; King and others, Reference King2020; Bhattacharya and others, Reference Bhattacharya2021). For the more recent period, ASTER-derived DEMs provide broad spatial coverage and sufficient temporal continuity for regional analyses, although their precision may be insufficient for short time spans or small glaciers. Overall, while temporal sampling and data quality remain limiting factors, the combined use of historical imagery and modern satellite datasets offers a viable pathway for reanalysing selected Himalayan mass-balance series.
To date, only the mass-balance series for the Mera and Chhota Shigri glaciers have been validated and calibrated for systematic errors using geodetic mass balances. The mass-balance series (2007–2019) of Mera Glacier was reanalysed using geodetic mass balance derived from two DEMs created from Pléiades stereo-images taken in November 2012 and October 2018 (Wagnon and others, Reference Wagnon2021). The glacier-wide annual mass balance was systematically decreased by 0.11 m w.e. a−1 to fit with the geodetic estimate. The positive bias in the glaciological mass balance was attributed to overestimated accumulation above 5520 m a.s.l., likely due to the measurement network’s inability to account for spatial variability.
The glacier-wide mass-balance series on Chhota Shigri Glacier was reanalysed over 2003–2020 by combining a nonlinear mass-balance model (Vincent and others, Reference Vincent2018) with the traditional reanalysis framework (Zemp and others, Reference Zemp2013) (see Fig. 5 of Azam and others, Reference Azam2024). The nonlinear model effectively captures the spatiotemporal variability of point mass balances from a heterogeneous in situ point mass-balance network and can also identify erroneous measurements in point mass-balance observations; therefore, the observed point mass balances were recalculated using the nonlinear model and the glacier-wide mass balances were re-computed before reanalysis. Comparing with the geodetic mass estimates available over 2003‒2014 and 2014‒2020, it was found that the nonlinear model outperforms traditional glaciological method for computing glacier-wide mass balances. The glacier-wide mass balances were systematically increased by 0.03 m w.e. a−1 over 2003‒2014 and by 0.17 m w.e. a−1 over 2014‒2020 to match the geodetic estimates. Furthermore, in case of missing field observations, the nonlinear model can also be used to estimate the glacier-wide mass balance using a single observation or even the snow line altitude, estimated from satellite data, at the end of ablation season (Azam and others, Reference Azam2024); hence filling the gaps in observed mass-balance series.
Given the better performance of the nonlinear model for glacier-wide mass-balance estimation, it is advisable to combine the application of the nonlinear model with traditional reanalysis framework, whenever sufficient data are available (Azam and others, Reference Azam2024). This recommendation is particularly important in the Himalaya, where data gaps often occur due to access challenges. It is suggested to reanalyse the mass-balance series with sufficiently long and continuous observation records, such as Chorabari, Dokriani, Gangju La, Pokalde, Rikha Samba, Yala and West Changri Nup glaciers (Table S1). Additionally, with the recent advancements in remote sensing methods, it is recommended to conduct reanalyses exercise at regular intervals, ideally every 5 or 10 years.
5.5. Advancements in Himalayan glacier mass-balance research since previous reviews
Over the past decade, several review papers have addressed glacier mass balance in the Himalaya (Bolch and others, 2012; Reference Bolch, Wester, Mishra, Mukherji and Shrestha2019; Azam and others, Reference Azam2018; Kulkarni and others, Reference Kulkarni2021; Vishwakarma and others, Reference Vishwakarma2022; Jackson and others, Reference Jackson2023). Building upon and significantly advancing the foundational work of Bolch and others (2012) and Azam and others (Reference Azam2018), this technical review presents the most comprehensive and up-to-date synthesis of glacier-wide mass-balance measurements in the Himalaya to date. While Bolch and others (2012) compiled 15 glaciological mass-balance series and identified regional knowledge gaps across High Mountain Asia and Azam and others (Reference Azam2018) compiled 24 glaciological mass-balance series up to 2015 (expanded to 28 by Jackson and others, Reference Jackson2023), the present technical review extends this dataset to 38 glaciers, incorporating records available up November 2024. It also includes previously unpublished data and recent monitoring from large glaciers such as Bara Shigri, Samudra Tapu and Drang Drung. Beyond data compilation, this technical review also offers a set of targeted, actionable recommendations to strengthen future monitoring efforts—such as prioritizing large and debris-covered glaciers, enhancing metadata transparency and promoting cross-border data sharing.
Additionally, this technical review highlights the growing potential to reanalyse historical glacier mass changes using newly accessible high-resolution satellite data (e.g. KH-9 Hexagon, Pléiades and commercial stereo imagery), thereby improving both the temporal depth and spatial resolution of geodetic mass-balance estimates. Coinciding with 50 years of in situ mass-balance observations and aligning with the objectives of the IYGP 2025, this technical review provides a timely, methodologically rigorous, and forward-looking contribution to Himalayan glaciology.
6. Conclusions
A comprehensive technical review of the available glacier-wide mass-balance data in the Himalaya has been conducted. As of November 2024, monitoring has been done on 38 glaciers, beginning with the first mass-balance measurements on Gara Glacier (western Himalaya, India) in 1974. Of these, 17 have been discontinued after a monitoring period of 5–10 years, 19 continue to be monitored, and two series have been resumed.
In total, 302 annual glacier-wide mass-balance measurements were available from 38 glaciers, yielding a mean mass balance of −0.62 ± 0.33 m w.e. a−1, equivalent to a cumulative wastage of −23.95 ± 1.44 m w.e. over 1974‒2023. The longest continuous mass-balance record comes from Chhota Shigri Glacier (western Himalaya, India), showing mean wastage of −0.47 ± 0.19 m w.e. a−1 since 2002. Data reveal a sharp increase in annual mass balances, rising from 75 in the pre-2000 period to 227 in the post-2000 period. The mean mass wastage strongly increased, from −0.31 ± 0.34 m w.e. a−1 before 2000 to −0.66 ± 0.33 m w.e. a−1 after 2000, aligning with findings from geodetic studies in the Himalaya. Overall, the mean glacier wastage shows an apparent acceleration of ∼9 cm w.e. per decade over the past five decades. Moreover, the extreme 2021/22 hydrological year showed an unusually high mean mass-balance wastage of −1.20 ± 0.36 m w.e. a−1, in agreement with the early summer heatwave in 2022.
Most of the monitored glaciers are relatively small and often lack fully developed accumulation zones, leading to possible negative biases in glacier-wide mass-balance estimates. To fill the gap in monitoring larger glaciers, efforts have been launched on Bara Shigri, Drang Drung and Samudra Tapu glaciers with well-developed accumulation areas. However, accessing the accumulation areas of these glaciers is challenging due to dense crevasses and logistical difficulties. The compiled mean glacier-wide mass balances from all 38 glaciers showed no correlation with glacier size.
Out of the 38 observed glaciers in the Himalaya, only seven (Chhota Shigri, Hoksar, Mera, Pokalde, Rikha Samba, West Changri Nup and Yala) meet the criteria for benchmark glaciers as defined by WGMS. None of the monitored series in the Himalaya qualify as WGMS reference glaciers, which require a minimum of 30 years of uninterrupted monitoring. Among these, Mera and Rikha Samba glaciers are recognized as representative glaciers, not only for their respective basins/valleys but also for the entire central Himalaya. Chhota Shigri has been identified as the representative glacier for the western Himalaya.
In honour of the IYGP 2025 and Decade of Action for Cryospheric Sciences (2025–2034), the following actions are recommended: (i) Standardize Methodologies: Adopt a consistent, established methodology for estimating random errors across all ongoing mass-balance series to enable direct comparisons of random errors between glaciers; (ii) Integrate and Reanalyze: Combine nonlinear mass-balance models with traditional reanalysis frameworks and reanalyse mass-balance series for glaciers such as Chorabari, Dokriani, Gangju La, Pokalde, Rikha Samba, Yala and West Changri Nup; (iii) Expand Monitoring: Identify additional glaciers for long-term monitoring in underexplored regions such as the Karakoram, Sikkim, Zanskar and the Bhutanese Himalaya. Focus on glaciers with large elevation ranges, well-developed accumulation areas and minimal debris cover; (iv) Continue Benchmark Monitoring: Sustain ongoing monitoring efforts, particularly for benchmark representative glaciers like Mera, Rikha Samba and Chhota Shigri; and (v) Share the mass-balance data with WGMS to increase the representation of Himalayan glaciers’ climate change response at global scale.
Supplementary material
The supplementary material for this article can be found at https://doi.org/10.1017/jog.2026.10151.
Data availability statement
The compiled data can be obtained from the author on request.
Acknowledgements
M.F.A. acknowledges the Ministry of Earth Sciences (grant no. MOES/PAMC/H&C/131/2019-PC-II). Special thanks to Arif Hussain, Himanshu Kaushik, Smriti Srivastava and Argha Banerjee for their valuable suggestions on analysis and figure development. A heartfelt thanks to all those who participated in the field expeditions and collected glacier mass-balance data in the harsh Himalayan environment. Thanks to scientific editor Evan Miles, Tobias Bolch and an anonymous reviewer for their constructive reviews which significantly improved the paper.

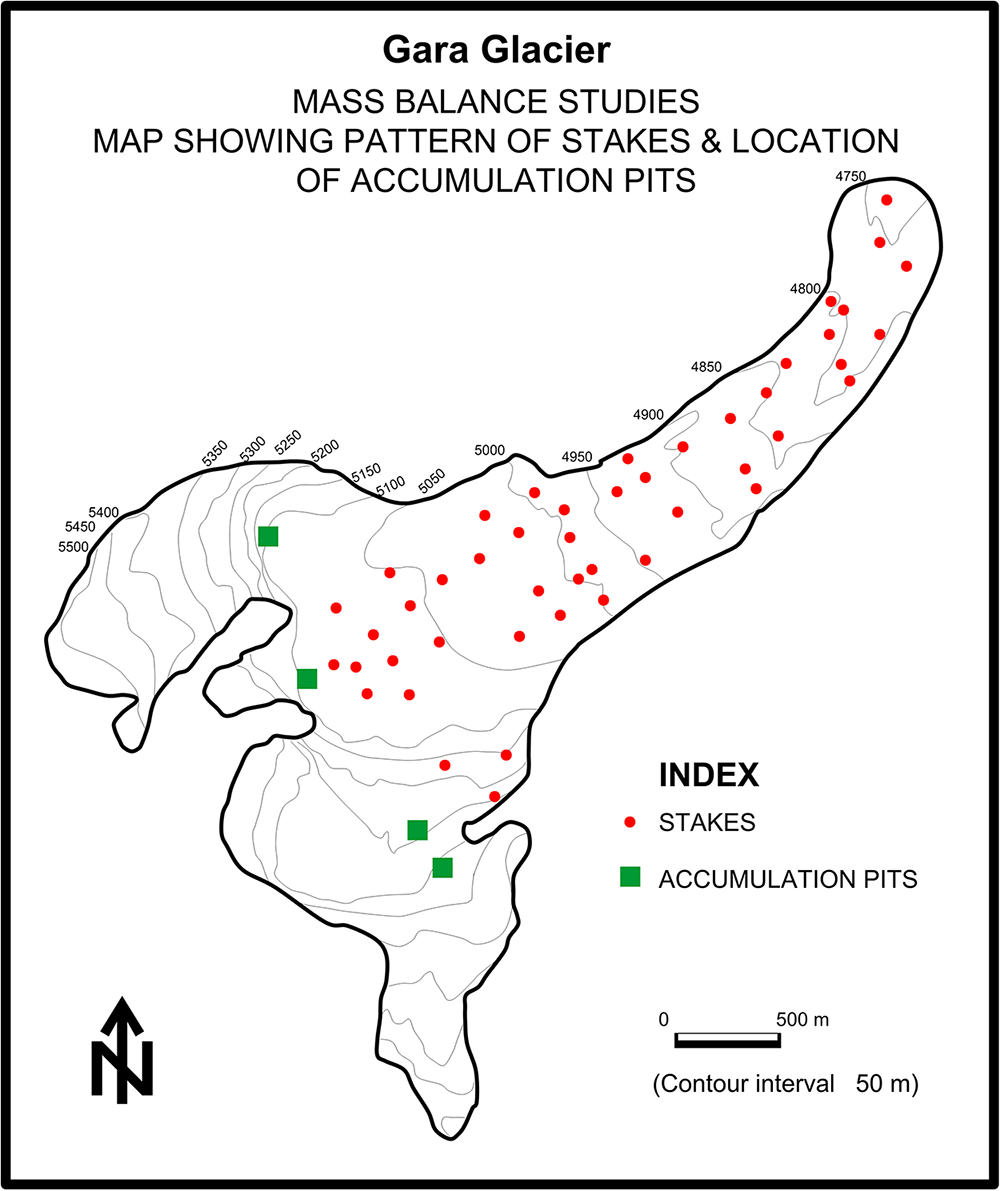


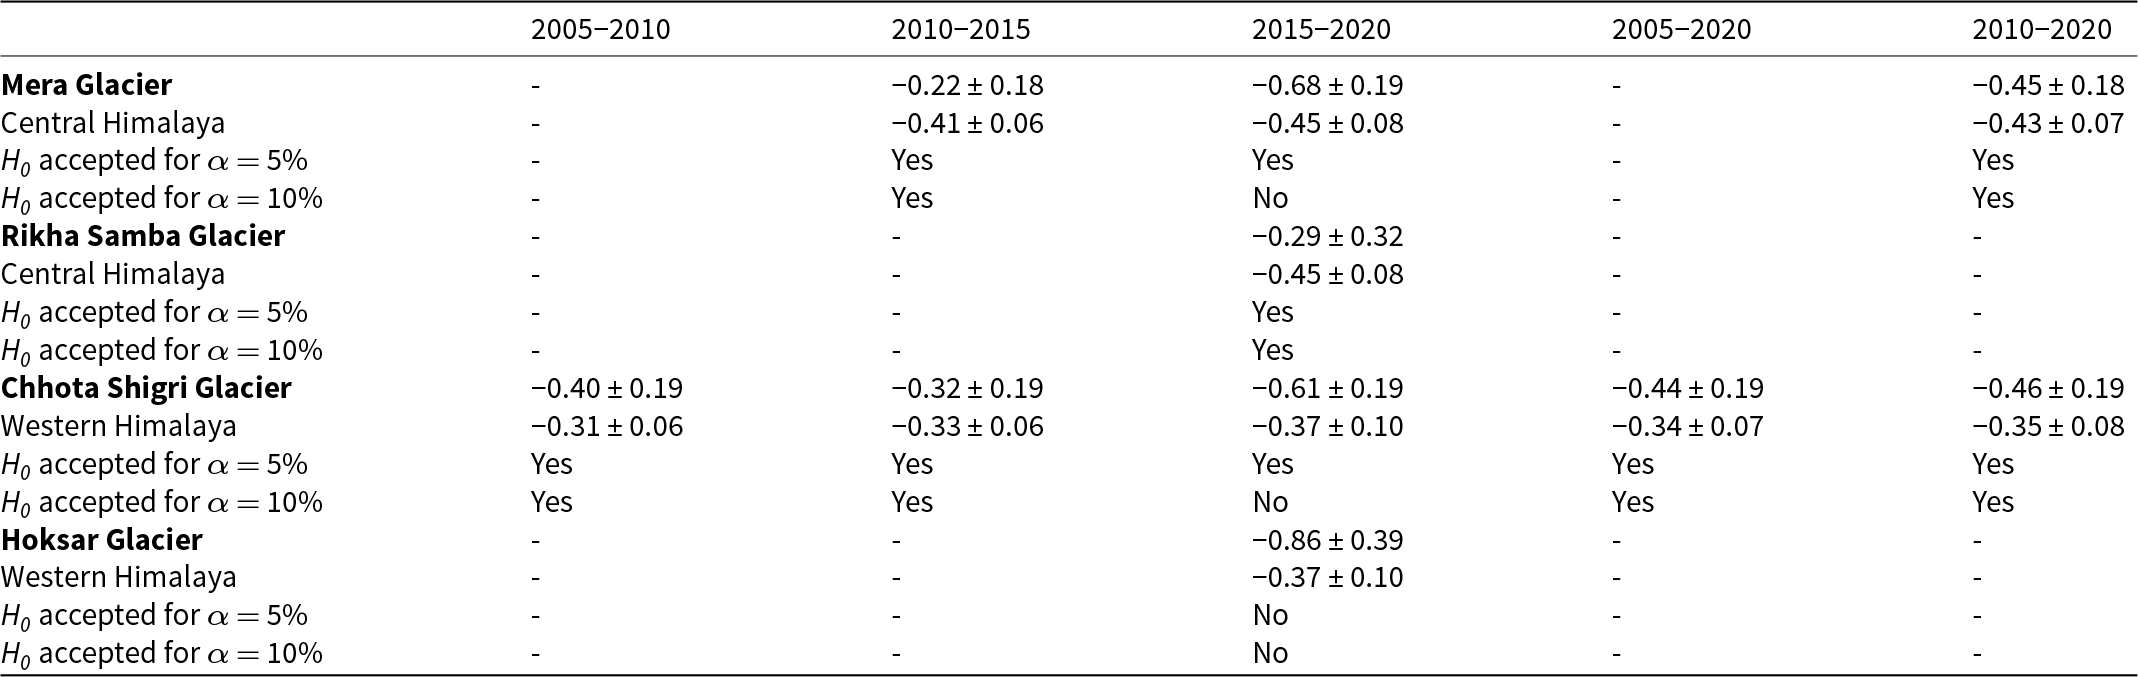


 Open access