

INTRODUCTION
One of the main challenges in a radioactive waste repository, relating to the potential for the water intrusion after waste emplacement, is the quantification of the release rate of radionuclides present in a conditioned wasteform. As a part of this activity, the quantification of the release rate of radionuclides from activated stainless steels, highlighting the radiocarbon (14C) release rate, has been one of the main activities of the Spanish Waste Management Organisation Enresa (Empresa Nacional de Residuos Radiactivos) in the European Commission CArbon-14 Source Term (CAST) project.
Since 2010, Enresa has been dismantling the José Cabrera Nuclear Power Plant (NPP):
∙ Type: Westinghouse one-loop pressurized water reactor
∙ Net electrical power: 160 MWe
∙ Net thermal power: 510 MWth
∙ Fuel elements: 69 – 14 × 14
∙ Fuel type: UO2 – enrichment 3.6% (235U)
∙ UO2 mass (core): 20.76 t.
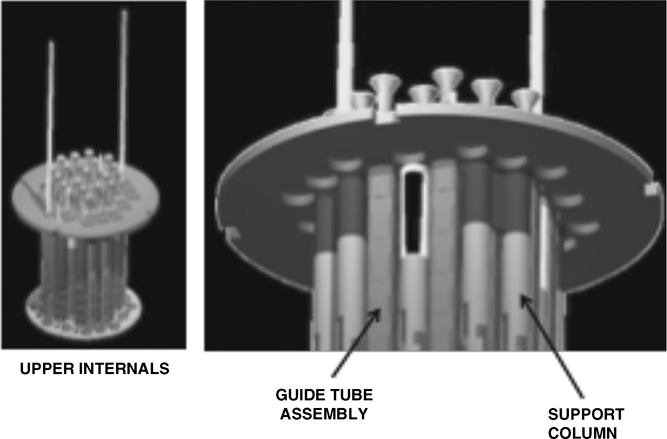
The removal and cutting process of the upper and lower internal components of the reactor was carried out in 2012–2013. As a result of this process, a total of 4 canisters of high activated steel were produced for dry interim storage, in addition to the 12 canisters of spent fuel produced during the pre-dismantling period (2006–2010).
To save volume in the canisters of high level radioactive waste (HLW), a previous theoretical analysis was developed to assess the actual HLW and intermediate level radioactive waste (ILW) classification of the reactor internals, an aspect that was verified during the cutting process itself. As a result of the in situ characterization during segmentation and packaging activities, a total of 7 concrete containers were produced, to be sent to El Cabril disposal center, as surface repository designed for low and intermediate level waste (L&ILW).
One of the crucial waste acceptance criteria in a repository is the resistance to the radionuclide release when water is potentially present. In general, heterogeneous ILW waste has to be disposed of in concrete containers with an extra inside envelope of mortar with the aim to meet the release rate waste acceptance criterion, since heterogeneous waste is generally contaminated and the radionuclides are not firmly attached to the surface.
On the other hand, it is expected for activated steels that the radionuclides are quite fixed in the whole waste itself. The analysis of whether activated steel complies with the release rate criteria, without the necessity of an additional mortar envelope, is a matter of great importance since it would allow an increase of the waste volume and reduce the cutting activities.
The El Cabril laboratory performed a leaching test following the corresponding ISO Norm (ISO 1982), on an activated item of the reactor upper internal components of Jose Cabrera NPP (Figure 1). This test is done in aerobic conditions and its objective is to determine the release rate of radionuclides, including the release rate of 14C. The preparation of the leaching experiments to measure the release of 14C is described in this report in addition to the obtained results.
Due to the El Cabril design for L&ILW, long-lived radionuclides have stronger constraints than short or medium lived ones (IAEA 2004), therefore 14C activity is limited, owing to the radionuclide’s long half-life period of 5730 years and its chemical interaction with the engineering barriers and the geosphere (Freeman and Vogel Reference Freeman and Vogel1995; Bart et al. Reference Bart, Cau-di-Coumes, Frizon and Lorente2012; IAEA 2013; Ojovan and Lee Reference Ojovan and Lee2014).
Activated steels from reactor internals are generally considered HLW, foreseen to be sent to a deep geological disposal repository. Enresa is currently licensing a 60-year centralized interim storage for HLW, and the volume optimization issue is one of the main concerns involved in this center. Keeping in mind this aspect, part of the activated steels is not actually HLW, but ILW, meaning that it is possible to send it to a less restrictive disposal facility such as El Cabril repository.
In relation to the Spanish national program (MITC 2006, 2008), the behavior of activated wastes containing 14C and other long-lived radionuclides (USNRC 2000) is a matter of importance in the near future for Enresa, due to the decommissioning projects to be developed.
Acknowledging existing significant possibilities of starting new additional decommissioning projects in the near future, the knowledge of the chemical speciation of 14C present in wastes is a subject of interest that will ease the development of waste acceptance criteria of the disposal facilities involved for L&ILW or HLW.
MATERIALS AND METHODS
Characterization of the Item
The 14C/60Co ratio in the tested item has been theoretically determined by means of the ORIGEN SCALE code (ORNL 1982–2009; ASTM 2008; ISO 2013), based on the irradiation history of the piece, neutron flux/spectra, and chemical composition of stainless steel (SS304-316), whereas 60Co and the rest of the listed radionuclides have been measured by gamma spectrometry (Table 1). This ratio is very consistent with the 14C/60Co measured by Ciemat (Rodríguez et al. Reference Rodríguez, Gascón, Magro, Piña, Lara and Sevilla2018) in another component of the upper internals of José Cabrera NPP that has been subject to analysis.
Listed below are the basic irradiation conditions of the reactor internal components of José Cabrera NPP:
∙ José Cabrera NPP was in operation from June 30, 1968 to April 30, 2006, which equates to a total of 13,818 days with 29 cycles of operation.
∙ The load factor accumulated during the operational life of the plant is 70.97%.
∙ Therefore, the days of irradiation, obtained by multiplying the number of days that the core has been in operation (13,818 days) by the load factor, was 9807 days.
∙ The degree of maximum spent fuel burn-up was 45,000 MWd/tU and enrichment at least 3.15% in weight of 235U.
∙ Finally, the composition was calculated allowing for decay to a reference date of January 7, 2011.
∙ The material irradiated was stainless steel SS304/SS316.
Sample Preparation
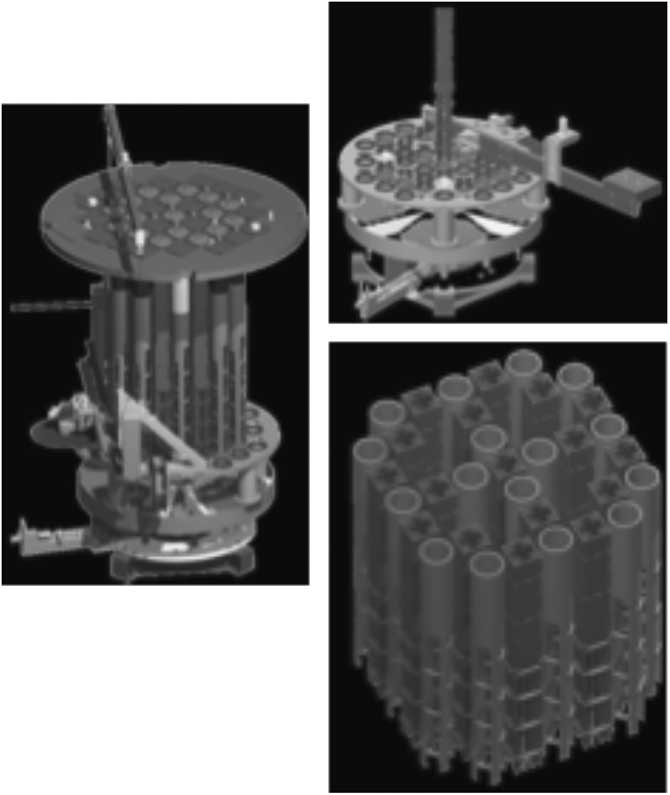
The upper internal cutting process was carried out underwater on the bottom of the spent fuel pool area, in which a turntable was placed, and by use of a disc saw and a band saw in a moving frame. The cutting activities were accomplished in a dynamic and sequential manner.
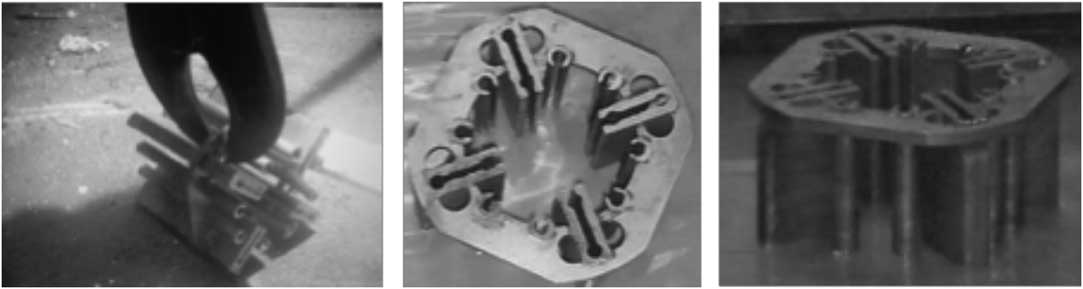
Additional detailed cutting was required in order to get a suitable sample size for both laboratory management and transport issues (Figures 2 and 3).
The dose rate of the piece at the test date was 1.08E+01 mSv/h. The final characteristics of the cut item are shown in Table 2.
Description of the Test
The leaching test performed is a semi-dynamic process where the piece is introduced in deionized water in 7 consecutive steps of different time duration (Table 3), from which the activity release is measured. In each step the leachate is replaced with fresh leachant.
The use of deionized water increases the release rate due to the gradient of chemical element concentration from item to water being greater than in other mineral waters. Also, for the same reason, the removal of leachate in each step increases the release rate, simulating a dynamical process.
The leachant characteristics are the following:
∙ pH=7±1.
∙ Conductivity σ<5 μS/cm.
∙ Temperature=20±3°C.
∙ Atmosphere: oxygen.
These parameters have been measured in the leachant for every step (Table 4).
Accelerator Mass Spectrometry
Due to the expected low amount of 14C released in the leaching process, a more sensitive technique than the typical liquid scintillator one is required in order to quantify it at every step. accelerator mass spectrometry (AMS) has the required low detection limit to achieve this goal (Hedges and Hall Reference Hedges and Hall1986; Tuniz et al. Reference Tuniz, Bird, Fink and Herzog1998; Kumar Reference Kumar2016).
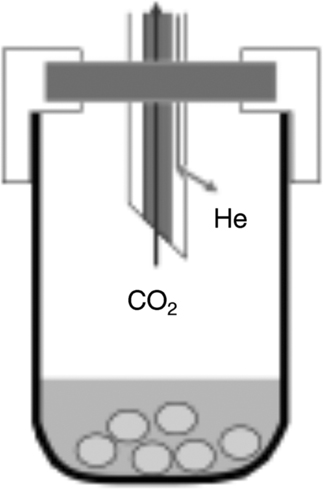
The standard sample preparation for the measurement of 14C by using AMS techniques consists basically of the following (Figure 4):
∙ Incorporate the carbon of the sample in a carbonate form by precipitation with calcium nitrate Ca(NO3)2. This procedure is planned in order to be able to recover the inorganic carbon and further development is planned to being able to recover both inorganic and organic carbon.
∙ Bubbling up the flask with He to remove the air inside the flask (and therefore the CO2 of the air).
∙ Hydrolysis of the calcium carbonate by phosphoric acid.
∙ Transport of the produced CO2 to the graphitization system (the sample has to be always made of graphite for AMS analysis).
Two approaches were used for the sample preparation before the graphitization process:
∙ Carbonate precipitation prior to the hydrolysis step, as indicated.
No volume restriction is required in this case and the technique allows measurement of very low 14C content. Note this sample preparation step takes some time to implement.
∙ Direct hydrolysis of the liquid sample without previous precipitation.
This technique has a volume restriction and the carbonate concentration has to be above a threshold, but in this case a direct measurement of the sample is possible.
RESULTS AND DISCUSSION
Activity Released
During the leaching experiments, a solid phase in the leachate was observed, and both the leachate and the solid fraction have been measured for the different radionuclides considered (Table 5).
The activity of 14C has been measured by the liquid scintillator technique and no values above detection limit (ISO 2010) were obtained in the different steps (Table 6).
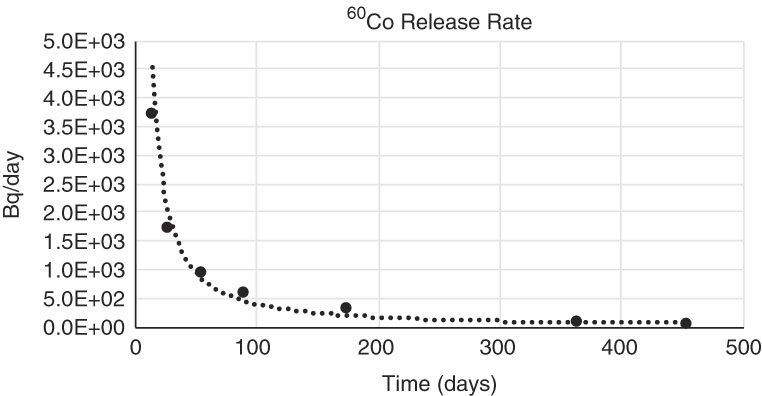
The only isotope with values above detection limit for both phases, solid and liquid, in all the measurements performed is 60Co, the release rate trend is shown in Figure 5.
A similar trend of released activity is observed for all the isotopes. For 137Cs (Figure 6), only the solid fraction shows activities above the detection limit in all the steps, and no values above detection limits were obtained in the liquid fraction. This seems to be in apparent contradiction to the expected behavior of cesium (caesium) being a soluble element, although this feature is also observed in soils where cesium strongly fixes in the clay and no water mobility is observed for it.
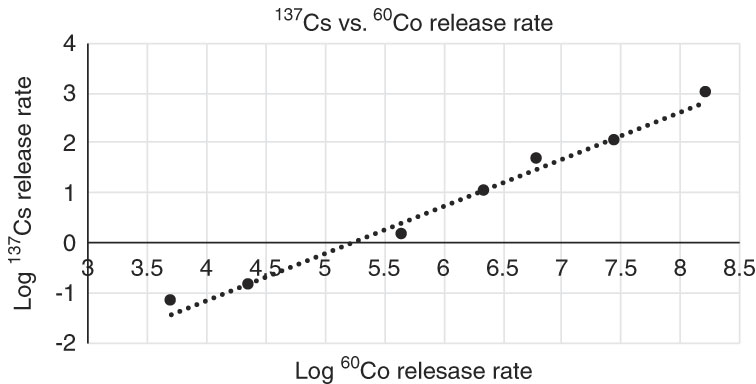
A regression between 60Co and 137Cs release rates in log scale shows a good correlation coefficient of 0.993 (Figure 7), and also the unit slope is inside its confidence interval, which indicates that a scaling factor, can be applied for the determination of the release rate of 137Cs, taking as a reference the release rate of 60Co, namely
 $$^{{137}} {\rm Cs}{\equals}5.22{\rm E}-03\cdot^{{60}} {\rm Co}$$
Scaling factor theory is a semi-empirical approach based on data correlation between activities of two isotopes in a waste stream. Given that the complete theoretical description of the activity content in a waste implies a very complex development, involving production and transport mechanisms, chemical reactions, solubility properties, etc., a new approach based on data results in real cases is required in order to obtain practical and robust results (USNRC 2000; ISO 2007; IAEA 2009).
In this sense, it is expected that activation products well correlate among them, being 60Co the easy to measure radionuclide (key nuclide) to be used for the correlation processes with the activated isotopes that are difficult to measure. In the same way, fission products are expected to well correlate among them, being 137Cs the representative easy to measure isotope, which is used as a key nuclide for the rest of difficult to measure fission isotopes (USNRC 2000; ISO 2007; IAEA 2009).
Empirical results of data regression between fission and activated isotopes show good correlation between them when no significant fuel failure has taken place, therefore good correlation between 60Co and 137Cs can be determined in those cases (USNRC 2000; ISO 2007; IAEA 2009). When this correlation is detected, it could be suitable to use 60Co as the only key nuclide of every difficult to measure isotope, regardless of their production mechanisms (activation or fission).
As indicated previously, no 14C activity has been detected above detection limit (between 0.04 Bq/g and 0.07 Bq/g) in any of the leachate samples, therefore further techniques have to be developed with the aim of quantifying it.
An important aspect is the determination of the final ratio of the activity release in relation to the initial activity for each radionuclide, which provides the degree of resistance of the analyzed substance to the release of radioactivity when water is present (Table 7).
Given that 60Co is assumed to be homogenously distributed in the sample (Rodriguez et al. Reference Rodríguez, Gascón, Magro, Piña, Lara and Sevilla2018), and knowing the ratio of 60Co mass to the total mass, then as the only isotope with all the measured values above detection limit in both phases is 60Co, it would be possible to take the release rate values of this radionuclide as representative of the corrosion rate by using the following relationship:
 $$\eqalign{ & {\rm Corrosion}\_{\rm rate}{\,\equals\,}^{{60}} {\rm CO}\_{\rm release}\_{\rm rat{{\tf="TimesNewRomanMTStd-Italic"\char"ED }}o}\cdot{\rm sample}\_{\rm mass}\,/\,({\rm sample}\_{\rm density}\cdot{\rm sample}\_{\rm surface}\cdot{\rm test}\_{\rm time})$$
This corrosion rate (Table 8) is well below the waste acceptance criterion established at El Cabril repository of 5.00E-04 cm/day, indicating the suitability of activated stainless steel to retain radioactivity when water is potentially present.
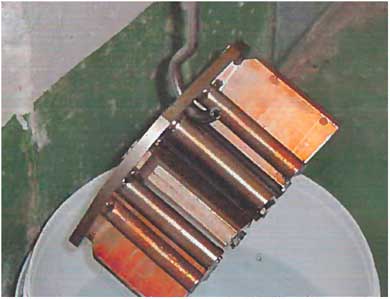
After the 455-day test, the sample piece used in the experiment shows an oxidation state, as can be seen in Figure 8.
The final part of this work consists of the measurement of 14C in the leachate at every experimental step by means of an AMS technique that is currently under development in the National Centre of Accelerators, NCA, in Seville, Spain.
Initial activity of the piece measured by gamma spectrometry. 14C determined by neutron activation codes based on neutron flux, irradiation history and chemical composition.

Description of the basics characteristics of the sample for analysis.

Schedule of the test, showing the length of every step, the accumulated days from the first one and the exact dates.

Leachant characteristics indicating the stability of temperature, conductivity and pH during the test time.

Released activity for the measured gamma radionuclides. Two phases were observed, liquid and solid, only 60Co was measured above detection limits in both phases. 137Cs was only detected above detection limit in the solid phase.

Detection limits measured at each step for 14C, no values above them were obtained by liquid scintillator measurements.

Total activity released ratio, which is the fraction of activity that has escaped from the sample for every radionuclide.

Corrosion rate determined from 60Co released in the two phases, assuming homogeneity in the distribution of the mass of 60Co in the sample.

Accelerator Mass Spectrometry Developments
AMS results are currently (as of March 2018) still awaited. In the absence of this information, a measurement of the total carbon content present (released plus constant background) in every step in this leaching experiments has been performed at the outset, thus allowing values of weight percentage of the leached carbon in comparison with total carbon inventory of the sample to be derived—see Table 9. The AMS laboratory has first to check whether the technique is appropriate or not relative to the content of total carbon that has to be above a threshold, otherwise it would have no sense to apply it.
Percentage of total carbon (mainly 12C, organic plus inorganic) in the leachate steps, indicating that the AMS technic is applicable being its content above the threshold of 1 mg.

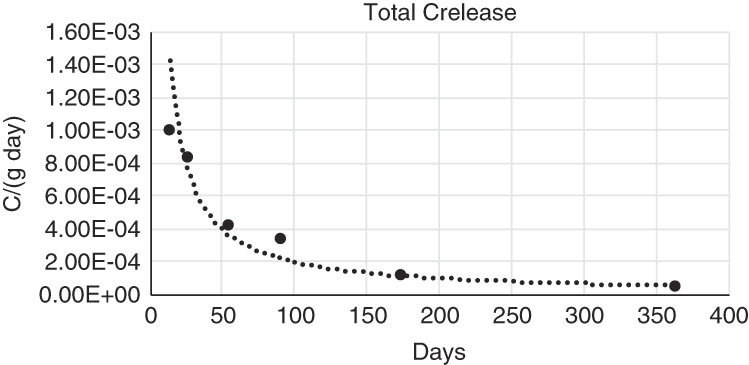
From this information, a total carbon release rate in the leachate versus time could be inferred (Figure 9). Note there is an assumption that all the carbon comes from the leached piece, something that has to be determined once the 14C or total carbon due to the background has been measured.
As indicated before, given that 14C is an activation product, it is expected that there is a correlation with 60Co, and as in the case of the release rate of 137Cs, a good correlation between 60Co release rate and total carbon release rate is found (r=0.982) (USNRC 2000; ISO 2007; IAEA 2009). In the logarithmic plot the unit slope is inside the slope confidence interval, meaning that a scaling factor for the total carbon release rate could be derived from the 60Co release rate. (Figure 10)
 $${\rm C}{\equals}4.26{\rm E}-07\cdot^{{60}} {\rm Co}$$
Location of the piece of stainless steel from the upper internals of the Jose Cabrera NPP that was cut and sent to El Cabril repository for release rate test in aerobic conditions.
Scheme of the cutting sequence from upper internals to the final piece. A band/disc saw in a rotating turntable was used to get the item.
Pictures taken underwater showing the final item to test in release rate analysis.
Scheme of precipitated sample inside phosphoric acid and the double tube. First bubbling with He to remove atmospheric CO2 and finally for CO2 recovering after hydrolysis.
Release rate of 60Co for both phases, solid and liquid, being the content of 60Co activity in the liquid phase two orders of magnitude higher than the 60Co activity in the solid phase.
137Cs release rate measured. It surprises that only the solid phase shows 137Cs above detection limit.

137Cs release rate vs. 60Co release rate in logarithmic scale. Slope one is inside the confidence interval of mean data, indicating that a scaling factor as geometric mean can be used to the prediction of 137Cs release rate from 60Co release rate, in non-transformed data.
Final picture of the sample after 455 days of testing, showing a pale red color indicating a degree of corrosion. (Please see online version for color figure.)
Total carbon measured at every leachate step divided by the proper time, namely the carbon release rate. No background subtraction has been done, being therefore a conservative value.
Total carbon release rate vs. 60Co release rate in logarithmic scale. Slope one is inside the confidence interval of mean data, indicating that a scaling factor as geometric mean can be used to the prediction of the total carbon release rate from 60Co release rate.

It is not expected that both impurities of parent elements of 60Co and 14C, namely 59Co and 14N, respectively, have neither correlation nor preferred locations in the piece involved (ISO 2013), and that is, the neutron activation, the process that triggers the final observed correlation between the activated isotopes (ISO 2007, 2013; IAEA 2009).
CONCLUSION
A standard leaching test that is usually performed in relation to waste packages at El Cabril laboratory has been adapted in order to leach activated stainless steel of type SS304-SS316, with the aim of addressing the release rate of radionuclides from this kind of radioactive materials.
The corrosion rate obtained from the piece of 4.39E-04 cm/year fulfills the waste acceptance criterion of 5.00E-04cm/day established for El Cabril repository, indicating the suitability of this material to retain the radionuclides when water is potentially present.
Although AMS results are awaited, a main conclusion based on other results to date is that there seems to be a strong correlation between the releases rates of the respective radionuclides involved, including by implication 14C. In this sense, as 60Co is the easiest of the respective radionuclides to measure, it can be selected as the key nuclide to be used as a basis for scaling the release rates of other radionuclides, and a scaling factor for release rates could be established for every material analyzed in this study. The stainless steel corrosion rate could also be scaled with the 60Co release rate.
Although the final values of 14C at every step of the leaching test are not available for this paper (AMS results are outstanding), a release rate of carbon could be inferred from the total carbon measured at every step, which shows a similar trend as for the rest of the gamma-emission radionuclides measured.
ACKNOWLEDGMENTS
This project has received funding from the European Research Council (ERC) inside the CArbon Source Term Project (CAST), under the European Union’s Horizon 2020 research and innovation program (grant agreement No 679103), and from a European Union FP7 career integration grant.


 Open access