1. Introduction
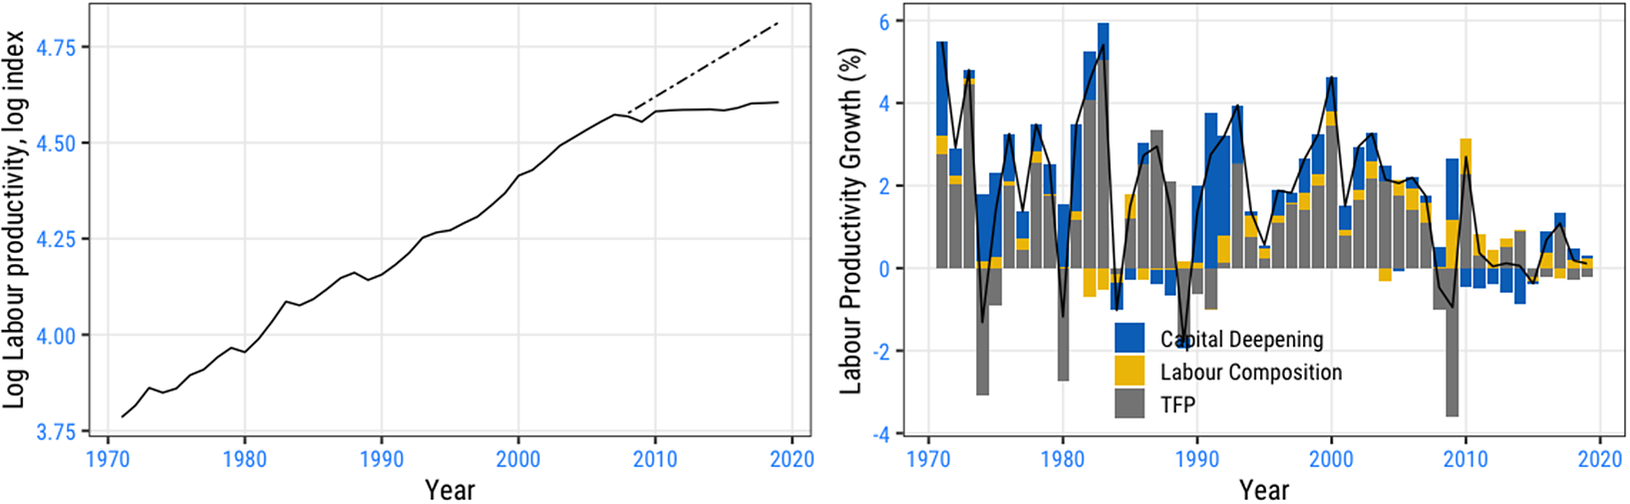
The UK’s productivity shortfall dominated its economic challenges in the years between the global financial crisis (GFC) of 2008 and the emergence of Covid-19 in 2020. Labour productivity stagnated for over a decade and contributed to the UK’s real wage squeeze, prolonged fiscal consolidation and, arguably, the Brexit vote. The productivity shortfall emerging since 2008 reached 21 log points by 2019 (Figure 1, left panel). While productivity growth in other countries also slowed down after the GFC, the slowdown in the UK was particularly stark.
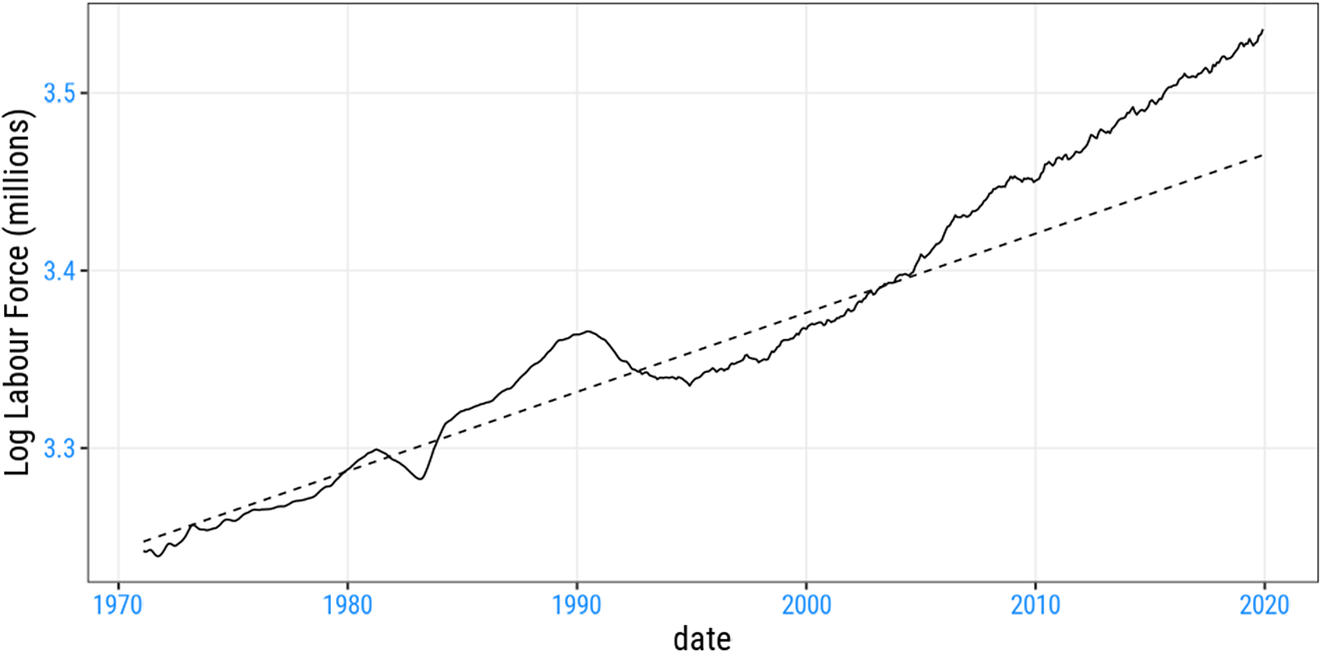
The UK productivity shortfall (1970–2019).
Sources: ONS.

A growth accounting exercise indicates that the main proximate cause of the labour productivity shortfall was a material slowdown in aggregate total factor productivity (TFP) growth (Figure 1, right panel), focused largely in the manufacturing, information and technology, and finance sectors of the economy. The reasons for the slowdown in TFP growth in these sectors are not obvious and are not considered in this paper.Footnote 1
Yet around one-fifth of the slowdown is accounted for by reduced capital deepening—capital shallowing. This paper considers the causes of the capital shallowing that could be observed throughout the economy over this period. We present evidence that suggests it could be due to a common labour supply shock. Between 2005 and 2019, the UK labour force expanded by almost 4 million, or 12.5%. That expansion was partly driven by rising participation rates, especially at older ages, but was mostly driven by inward migration.
Standard growth models suggest that in the long-run labour productivity is independent of the quantity of labour supplied. Nevertheless, it appears likely that increased labour supply weighed on labour productivity growth and real wages during a prolonged adjustment phase from the mid-2000s. Consistent with the micro-economic evidence, this possibility need not imply that labour supplied by older persons or migrants ‘undercut’ wage-setting; it was just that greater labour supply pushed down on productivity and real wages generally.
While Pessoa and Van Reenen (Reference Pessoa and Van Reenen2014) and Van Reenen and Yang (Reference Van Reenen and Yang2024) recognise the role of reduced capital deepening in contributing to the UK productivity shortfall up to 2012, they do not emphasise the role of rising labour supply. Most surveys of the productivity slowdown (e.g. Goldin et al., Reference Goldin, Koutroumpis, Lafond and Winkler2024) neither draw attention to, nor quantify, a role for labour supply. Oulton’s (Reference Oulton2018) study is a notable exception.
Identifying the effect of economy-wide shocks, such as an expansion of labour supply, is not straightforward. While there has been a ‘revolution of identification’ in many applied fields of economics, particularly using panel datasets, this has not been the case in macroeconomics where convincing natural experiments rarely exist. Even with large shocks, such as Brexit for example, it is difficult to provide the clear counterfactuals that can be used when distinct treatment and control groups are available: with macroeconomic shocks all groups are affected by the ‘treatment’. Our empirical approach is to show that the macroeconomic and sectoral evidence is consistent with a labour supply expansion that contributed to capital shallowing in all sectors and an associated slowdown in productivity growth.
We reach three main conclusions. First, we quantify the impact of the UK labour supply shock in the 15 years to 2019 as having lowered UK labour productivity by around one-fifth of the 21 log point shortfall. While this is modest relative to the overall shortfall, it is still sizable in absolute terms.
Second, we reconcile our view that a positive labour supply shock contributed to weaker labour productivity growth with standard growth theory by viewing the latter as applying in the long run. In the shorter term, capital takes time to adjust. We present model simulation evidence that suggests that a labour supply shock of a similar size to the labour supply increase observed in the UK between 2007 and 2019 could reduce the level of labour productivity temporarily by around 4%. While this result is sensitive to a range of model assumptions, the quantified effect is close to the size of the reduced contribution of capital deepening to the productivity slowdown over that period. Moreover, adjustment of the capital stock post-crisis may have been further slowed down in the UK by credit imperfections and heightened risk aversion. If correct, this channel would link the labour supply view with impaired capital adjustment.
Third, we reconcile our view that inward immigration, as a contributor to increased labour supply, weighed on labour productivity with the micro evidence suggesting immigration has had negligible effects on UK real wages or productivity. Most micro-based studies provide estimates that implicitly hold constant the macro-channel of reduced capital deepening that we highlight. Those that do not do this (e.g. Ottaviano and Peri, Reference Ottaviano and Peri2012) emphasise an important role for slow capital adjustment to weigh on real wages in the short run, as do we.
The remainder of the paper is organised as follows. Section 2 outlines several facts about the UK labour productivity shortfall from aggregate and sector-level data. Section 3 turns to the key features of the rising labour supply view. Section 4 presents macroeconomic simulation results which help gauge the macroeconomic significance of these views. We include cross-country analysis as supplementary evidence of UK experience. Section 5 concludes.
2. The productivity shortfall: some stylised facts
Our analysis of UK productivity uses estimates from the Office for National Statistics (ONS) for the UK market sector and component industries.Footnote 2 These estimates are badged as ‘experimental’ and are subject to revision.
Relative to a simple extrapolative trend from 1970 to 2007, the UK labour productivity shortfall reached 21 log points in 2019. While growth in hourly labour productivity averaged 2.5% p.a. from 1970 to 2007, it slumped to 0.27% p.a. from 2007 to 2019.
2.1. Reduced capital deepening in a growth accounting exercise
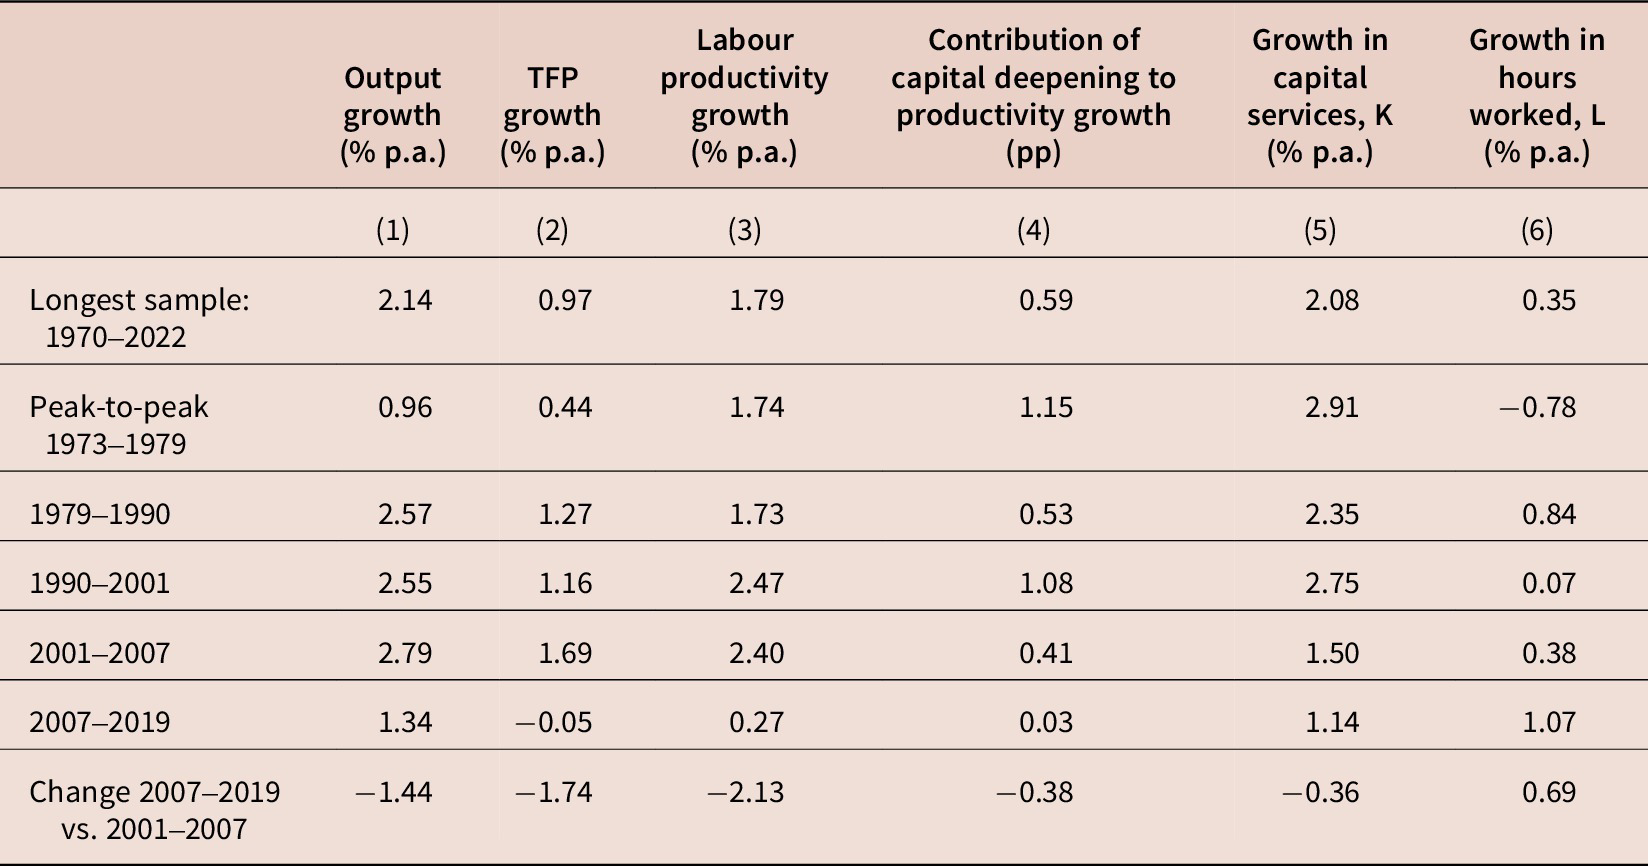
Table 1 summarises a growth accounting exercise for the UK’s market sector since 1970. As usual, estimates of TFP in such decompositions are derived as a residual and in the short run can reflect labour hoarding and other cyclical influences.
A growth accounting exercise

Note: UK market sector
-
• Average annualised compound growth per period $ g=100.\left(\frac{\mathit{\ln}{X}_t-\mathit{\ln}{X}_{t-n}}{n}-1\right) $
-
• Output growth (col 1) = Growth in hours worked (col 6) + Labour productivity growth (col 3)
-
• Labour productivity growth (col 3) = TFP growth (col 2) + Contribution of K/L to productivity growth (col 4) + Contribution of labour composition (not shown).
Source: ONS, own calculations.
We draw attention to the following facts from Table 1:
-
• In each of the four economic cycles before the GFC, average peak-to-peak labour productivity growth had been in the region of 2% p.a. with differences in average output growth across the cycles being reflected in differences in labour input growth.
-
• The post-GFC cycle from 2008 to 2019 was unusual in that while output growth was weaker than usual, at 1.34% p.a., its composition was skewed towards growth in labour input (1.07% p.a.) rather than growth in labour productivity (0.27% p.a.).
-
• The 2.13 pp fall in labour productivity growth from 2.4% p.a. in 2001–2007 to 0.27% p.a. in 2007–2019 is largely accounted for by a fall in TFP growth of 1.74 pp, from an above average rate of 1.69% p.a. in 2001–2007 to virtually zero (−0.05% p.a.) in 2007–2019. Standard neoclassical economics offers little explanation for long-term movements in TFP beyond attributing it to technical progress.Footnote 3
-
• Capital deepening was unusually weak in 2007–2019. In the run-up to the GFC, capital deepening had accounted for 0.41 pp of average annual labour productivity growth during 2002–2007. By contrast, there was little change in the aggregate capital/labour ratio after 2008. Overall, the turn-around in capital deepening between 2001–2007 and 2007–2019 (0.4 pp) accounted for around a fifth of the slowdown in labour productivity growth (2.13 pp).
2.2. A sector-level perspective
More light can be shed on the drivers of the overall productivity slowdown by looking at changes in trends in the different market sectors of the economy.Footnote 4 Coyle and Mei (Reference Coyle and Mei2023) and Riley et al. (Reference Riley, Rincon-Aznar and Samek2018) have also investigated sectoral patterns in productivity growth using earlier vintages of ONS data.
While labour productivity stagnated in the post-GFC period, there was widely different experience in the various industrial sectors comparing 2001–2007 with 2007–2019. Labour productivity growth fell in seven of the 15 market sectors under consideration; these are mining and quarrying (B, −1.82 pp), manufacturing (C, −6.00 pp), wholesale and retail (G, −1.94 pp), transport and storage (H, −2.80 pp), information and communication (J, −4.65 pp), financial and insurance (K, −8.22 pp) and professional and scientific (M, −2.73 pp). This group includes the external-facing trading sectors. Productivity growth rose in agriculture (A, 0.91 pp), electricity (D, 2.80 pp), water (E, 0.19 pp), construction (F, 2.56 pp), accommodation and food (I, 0.07 pp), administration and support (N, 1.13 pp) and other services (RSTU, 0.55 pp) and was unchanged in the public sector (OPQ). This group includes mainly the internal-facing non-traded sectors.
There is a strong positive correlation between the change in labour productivity growth within the different sectors between 2001–2007 and 2007–2019 and the change in output growth within those sectors. Demand weakness may have contributed to the productivity slowdown, though such an interpretation would have to explain why businesses in these sectors did not cut back employment to a larger extent.Footnote 5
As also noted by Coyle and Mei (Reference Coyle and Mei2023) and Riley et al. (Reference Riley, Rincon-Aznar and Samek2018), the decline in labour productivity growth mainly reflects lower productivity growth within sectors rather than reallocation across sectors. The decline in the ‘within’ contribution, obtained by weighting industry labour productivity growth by each sector’s beginning of period current price output share, is also 2.13 pp. The 2.13 pp fall in labour productivity growth from 2001–2007 to 2007–2019 is largely accounted for by the slowdown in productivity growth in manufacturing (contributing −0.95 pp), wholesale and retail (−.26 pp), information and communication (−0.30 pp) and financial and insurance (−0.60 pp).Footnote 6 Other sectors made small positive or close-to-zero contributions. It is worth noting that in four of these sectors (B, D, E and I) productivity growth remained negative in 2008–2019.
Table 2 reports ONS estimates of labour productivity growth and its decomposition into TFP change and capital deepening over the pre- and post-GFC economic cycles. Accounting for growth at the industrial sectoral level indicates a reduction in the contribution of capital deepening throughout the economy. We interpret this as evidence of the effect of a common labour supply shock.
Sectoral productivity decompositions

Note: $ {\displaystyle \begin{array}{cc}\mathrm{Labour}\ \mathrm{productivity}\ \mathrm{growth}=& \hskip-1em \mathrm{TFP}\;\mathrm{growth}+\mathrm{Contribution}\ \mathrm{of}\;\mathrm{K}/\mathrm{L}\;\mathrm{to}\ \mathrm{productivity}\ \mathrm{growth}\\ {}& \hskip-5em +\mathrm{Contribution}\ \mathrm{of}\ \mathrm{labour}\ \mathrm{composition}\;\left(\mathrm{not}\ \mathrm{shown}\right)\end{array}} $
Bold signifies table headings
The sectoral decompositions highlight two factors about the productivity slowdown:
-
1) With the exception of the professional and scientific sector, each of the sectors that made a material negative contribution to the change in labour productivity growth between 2001–2007 and 2008–2019 (C, G, H, J, K and M) experienced both weaker TFP growth and a lower contribution from capital deepening.
-
2) Nearly all sectors that benefitted from higher TFP growth in the post-GFC cycle also experienced a lower contribution from capital deepening.
This suggests to us that while certain key sectors experienced an unexplained negative TFP shock, there was a common shock that caused the contribution of capital deepening to decline throughout the economy. A positive labour supply shock would help explain such capital shallowing.
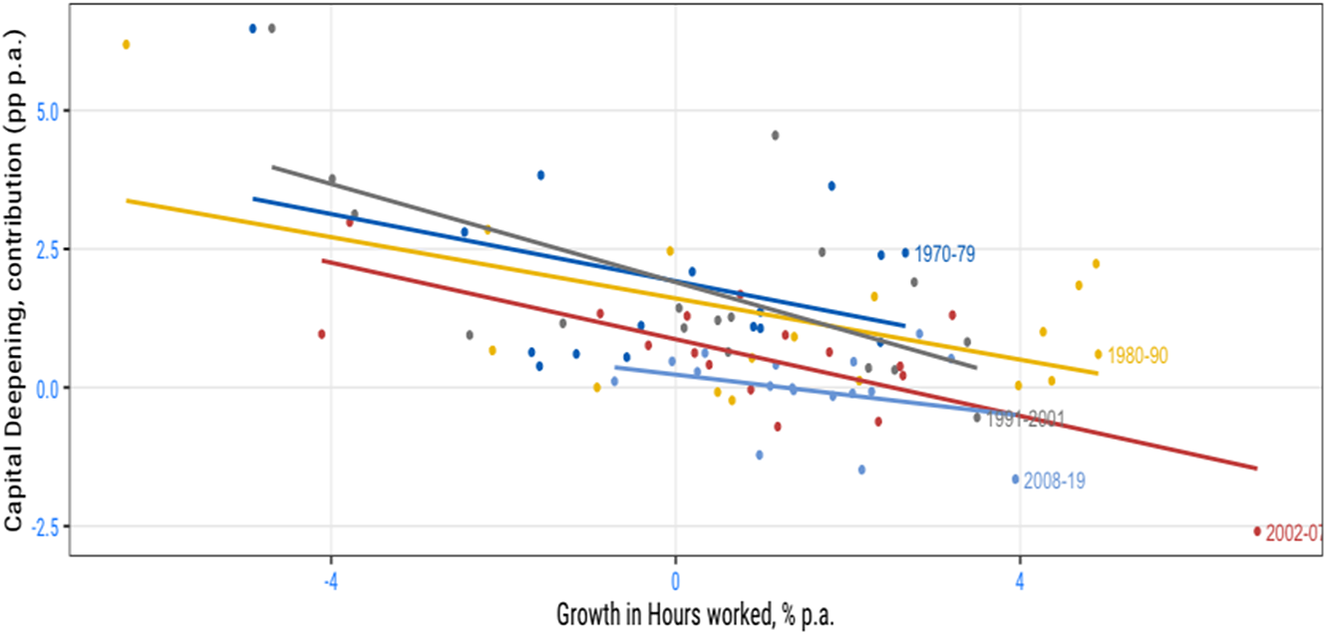
A typical feature of the UK economy is that there is a negative correlation between a sector’s labour expansion and capital deepening that we attribute to slow adjustment of capital to shocks. To illustrate this relationship, we compare average growth in hours worked and the capital deepening contribution, averaged within five distinct business cycles since 1971 for each sector. Figure 2 suggests those sector/period averages with larger labour expansions were associated with a significantly lower capital deepening contribution. Plotting the relationship separately for each business cycle suggests a broadly similar relationship in each period. At a descriptive level, larger labour input expansions are associated with a lower contribution from capital per worker to productivity growth.
The relationship between growth in hours worked and the capital deepening contribution within business cycles.
Note: Each dot shows a sector’s labour expansion plotted against its capital deepening contribution, with the colour of the dot indicating the business cycle it is drawn from. The lines show the best fit drawn through the scatter for each business cycle. These are all negatively sloped, as is the overall line of best fit through the scatter of all observations.

2.3. Capital/labour substitution
In simple theory, a labour supply shock would be transmitted to the economy through downward pressure on wages causing businesses to substitute labour for capital. Consistent with a labour supply shock, ONS data suggest that the relative price of labour fell quite substantially, by around 20%, in the post-GFC period.Footnote 7 The aggregate capital/labour ratio declined from the mid-2000s and, especially, post-crisis.
If capital and labour are gross complements (and the elasticity of substitution σ < 1), an increase in the supply of labour raises the demand for capital. While there is no consensus about the precise value of σ, published estimates in the Constant Elasticity of Substitution (CES) framework using aggregate US or sector-level data suggest σ < 1. This suggests we should expect the capital/labour ratio to fall less than proportionately with the fall in the relative price of labour. That applies in the long run and especially in the short run. Adjustment of the aggregate capital stock plays a key role in transmitting the benefits of a larger labour force through the economy, but this takes time. More generally, a slower adjustment of capital will weigh on the capital/labour ratio (and productivity) in response to a rise in labour supply.
3. Rising labour supply
We now describe key features of the UK’s rising labour supply, amid reduced capital deepening and the productivity shortfall.
The UK population rose strongly from the late 1990s to 2019, driven partly by net inward migration and partly by an excess of births over deaths. Net inward migration from Central and Eastern Europe was particularly strong after 2004 when the A8 countries joined the EU (Portes, Reference Portes2016; Oulton, Reference Oulton2018). Unlike most of the EU, the UK chose not to apply transitional controls on migration from the A8 accession countries. In much of Western Europe, these transitional controls did not end completely until May 2011. The UK population grew from 60.4 million in 2005 to 66.8 million in 2019. Over this period, net inward migration totalled 3.8 million based on the International Passenger Survey. This compares with the contribution to population growth coming from births less deaths that totalled 2.7 million.
Around one-half of migrants (both inbound and outbound) participate in the labour force. From 2005 to 2019, the UK labour force expanded by 3.8 million, or 12.5% (Figure 3), around two-thirds of which was accounted for by net inward migration. Migrants in the UK labour force totalled 3.1 million in 2005 and 6.1 million in 2019. Numbers in the UK labour force born in the UK rose from 27.2 million to 28.0 million.
The UK labour force.
Note: Trend-line is fitted for the period 1971–2005.

In tandem with the increase in population, the 16+ labour force participation rate rose by around 1 pp from 2005 and similarly from its 2010 low. That is equivalent to a rise of around 310,000 in the labour force. The aggregate change masks the profound changes in participation at older ages. It also understates the underlying shift in labour supply at a time when real wages had stagnated or fallen.
The rising participation rate is significant for three reasons.
First, it is a symptom of a positive labour supply shock as it coincided with a historically large squeeze in real wages. With a positively-sloped labour supply curve, only a labour supply curve shifting ‘to the right’ can reconcile falling real wages with a higher participation rate.
Second, a rising participation rate is historically unusual after a downturn. The participation rate fell quite notably following the recessions of the early-1980s and early-1990s. There is evidence that increased labour supply is a household response to financial pressures. Benito and Saleheen (Reference Benito and Saleheen2013) found that negative financial shocks are followed by an increased incidence of participating in the labour market and increased desired working hours. Blundell et al. (Reference Blundell, Pistaferri and Saporta-Eksten2016) found that families self-insure adverse shocks through increased labour supply. They find that families do this much more often than they use credit markets, the traditional means of adjustment emphasised in models of household behaviour that take labour supply as given.
Third, the rise in participation rate occurred despite the drag from a rising incidence of older persons with below-average participation rates. This compositional effect was a drag on participation, especially from 2010. A large behavioural effect (from higher participation rate at a specific age, especially among older persons) more than offset the increased incidence of older persons to result in the higher participation rate.Footnote 8 The behavioural effect among those aged 50–64 contributed +3 pp to a rise in participation, with an additional 1 pp contribution from those aged 65+.Footnote 9
The increase in labour force that one can attribute to older persons is about one-third as large as that resulting from net inward migration. The rise in the participation rate since 2005 of those aged 50+, which pushed up on the aggregate participation rate by almost 4 pp, implied a 1.1 million rise in labour force.
4. The macroeconomic impact of labour supply shocks
4.1. The long run
One possible interpretation of our aggregate growth accounting exercise is that the observed reduced rate of capital deepening is a response to the slowdown in TFP growth associated with the financial crisis. This is a natural interpretation in a standard growth model in which the capital stock is determined by the usual first order condition requiring the marginal product of capital to equal the real interest rate. Under constant returns to scale, both productivity and the capital/labour ratio are independent of the size of the labour force.Footnote 10
To illustrate this point, consider a Cobb–Douglas production function which implies the following for labour productivity (y − l).
 $$ y-l=a+b\left(k-l\right) $$
where y = log output, l = log labour force, k = log capital stock, a = log TFP, b = capital share. This has the following first-order condition.
 $$ \left(1-b\right)\left(l-k\right)=\mathit{\log}\left(r/b\right)\hbox{--} a $$
with r = discount rate. This leads to:
 $$ y-l=a+\left[b/\left(1-b\right)\right]\left[a-\mathit{\log}\left(r/b\right)\right]=a/\left(1-b\right)-\left[b/\left(1-b\right)\right].\mathit{\log}\left(r/b\right) $$
implying that labour productivity (y − l) is independent of the quantity of labour supplied (l). In the long run, and given diminishing marginal returns to labour (and capital), rises in the size of the labour force do not affect labour productivity as the optimum capital stock will increase in line with labour supply in equilibrium.
From Equation (2), a negative TFP shock (a) also implies reduced capital deepening. This could mean that the turnaround in aggregate capital deepening we have observed is due to reduced TFP growth and not to a labour supply shock. This argument has been made by Fernald and Inklaar (Reference Fernald and Inklaar2022). In the long run, as Prescott (Reference Prescott1998, p. 526) puts it, ‘TFP determines labour productivity, not only directly but also indirectly by determining capital per worker.
Our interpretation is that this only applies after the economy and labour market have fully adjusted to higher labour supply. The role of stronger domestic labour supply is, therefore, best seen as a view of the ‘medium run’.Footnote 11 But this is important because adjustment does not occur instantaneously. Moreover, the evidence in Section 2 suggests that while some sectors experienced both lower TFP growth and capital shallowing, consistent with a TFP shock, others experienced higher TFP growth and capital shallowing, a combination that is not consistent with a TFP shock alone. We suggest instead that this was due to a common positive labour supply shock that overlay a more heterogeneous, but primarily negative, TFP shock.
In standard macroeconomic analysis, a positive labour supply shock shifts the long-run aggregate supply curve ‘to the right’ and causes actual output to rise in line with increased potential. In the short run, greater availability of labour pushes down on real wages and, by reducing marginal costs, encourages imperfectly competitive firms to lower prices and thereby stimulate demand, output and employment. With capital tending to be slow to adjust, higher employment is associated initially with reduced capital deepening and lower labour productivity. Yet, with a lower capital/labour ratio pushing up the marginal product of capital, firms have an incentive to increase investment until the capital/labour ratio rises back to its original level and the economy returns to its balanced growth path.
In the new, long-run equilibrium, output and the capital stock will have risen proportionately to increased labour supply and labour productivity will ultimately be unaffected by the labour supply shock (e.g. Borjas, Reference Borjas2019).
The key practical question is how long this adjustment process takes to complete and relatedly its impact on labour productivity in the meantime. In an influential analysis of immigration in the United States, Ottaviano and Peri (Reference Ottaviano and Peri2012) explicitly took capital adjustments into account. They noted that ‘the recent growth literature usually estimates a 10% speed of convergence of capital to the own balanced growth path for advanced (OECD) economies (Islam, 1995; Caselli et al 1996)’. They estimate a similar rate of convergence based on US data, 1960–2004.
According to Dustmann et al. (Reference Dustmann, Glitz and Frattini2008), this adjustment speed means that, instead of reducing the capital/labour ratio by 11% and consequently average real wages by 3.6%, the immigrant inflows to the United States between 1990 and 2004 only reduced the capital/labour ratio by 3.4%, which in turn implies a much smaller negative effect of only 1.1% on average wages in the economy. Basically, the faster capital is able to adjust, the smaller will be the effect on average wages in the economy.
Our own assessment is that adjustment could be considerably slower than this in the recent UK context, resulting in an extended period of weaker productivity. Evidence for a substantial elasticity of investment with respect to the cost of capital is sparse (Chirinko et al., Reference Chirinko, Fazzari and Meyer1999) and aggregate relationships typically suggest slow adjustment of fixed investment to its determinants. Moreover, some of the key channels of adjustment may have been especially impaired in the aftermath of the financial crisis.
In order to quantify the possible effects of increased labour supply on productivity over this adjustment period, we employ an empirically-based macroeconomic model that has been calibrated to recent UK quarterly national accounts data.Footnote 12 The model highlights the possibility of an extended period of weak productivity growth following an increase in labour supply and illustrates the key channels involved. We also show the simulated impact of a reduction in TFP growth for an extended period. Together these shocks can account for the stylised facts of the UK experience following the GFC.
4.2. Simulation results
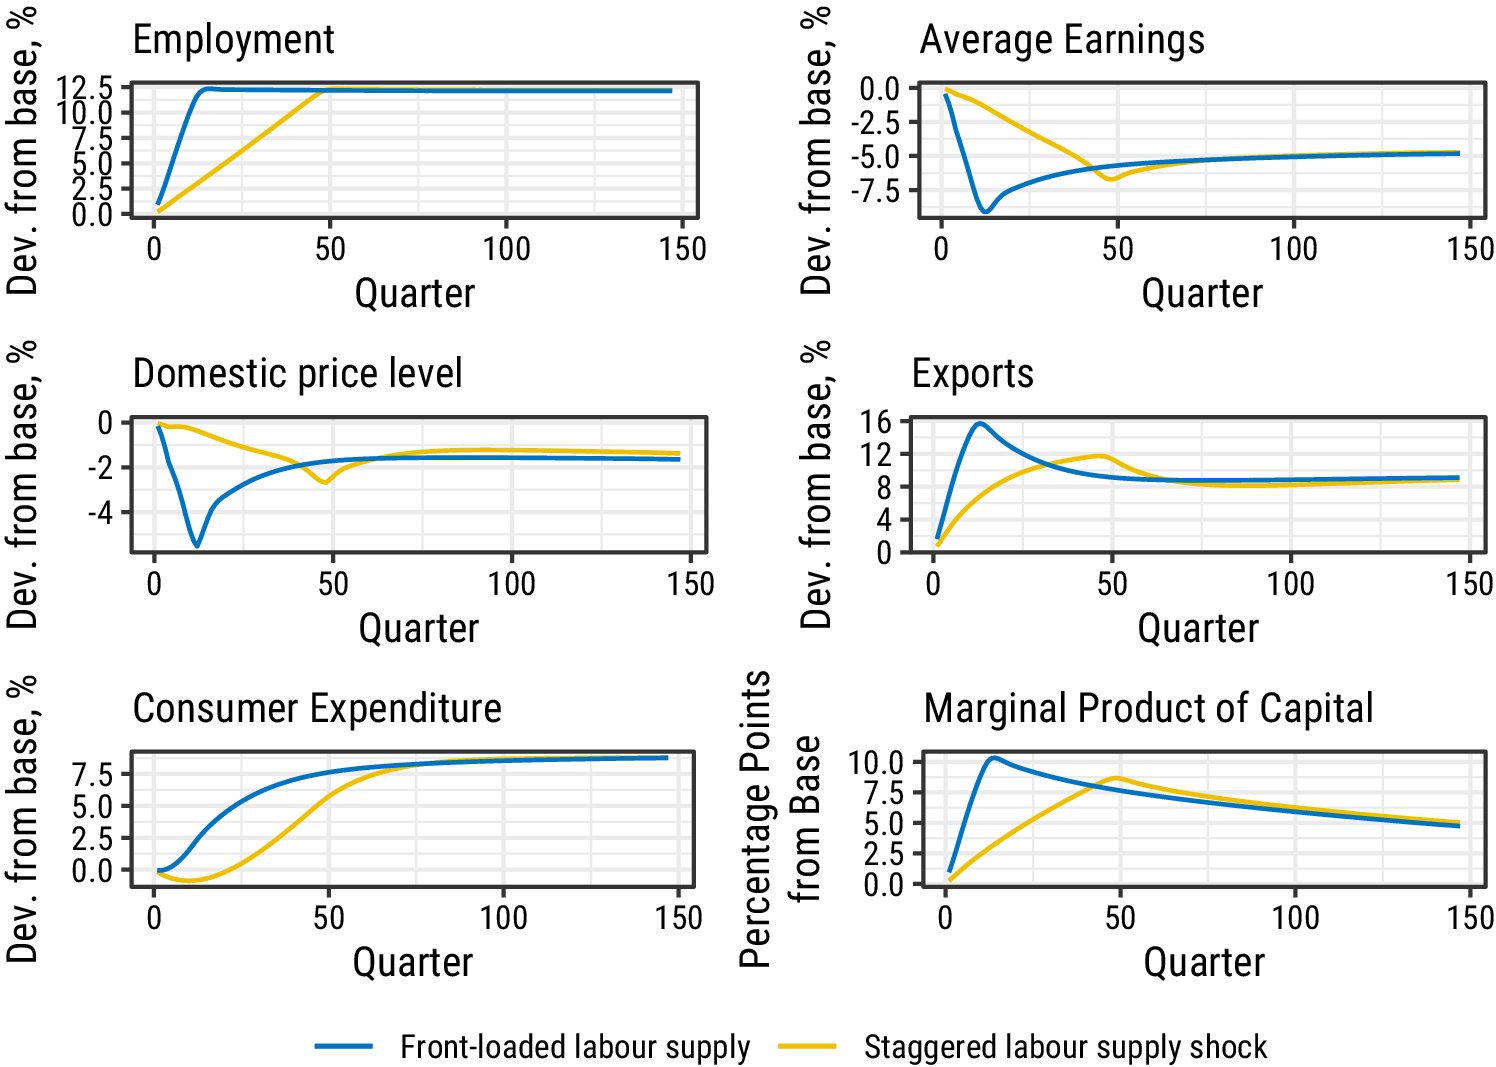
We use the model (outlined in an Annex) to simulate the effects of a 12.5% increase in the population of working age, corresponding roughly to the increase in UK labour supply that occurred between the GFC that began in 2007 and 2019. In the main case, we allow for an increase that occurs smoothly over a 12-year period (labelled ‘staggered labour supply’). We contrast this with a variant where the increase occurs smoothly over 3 years (‘frontloaded labour supply’).
Employment increases quickly in response to the rise in labour supply (Figure 4). This owes to the extra labour supply pushing down initially on wages and domestic prices leading to increased demand for UK output, and hence employment via the production function. The demand increase is driven by the internationally traded sectors, manufacturing, financial services and other private traded services, where exports rise sharply in response to increased competitiveness. It spills over to other sectors via greater demand for intermediate outputs and as domestic output expands. But domestic demand rises quite sluggishly in comparison. This is partly because of short-term yet persistent weakness in real household income reflecting lower real wages weighing on consumers’ expenditure.
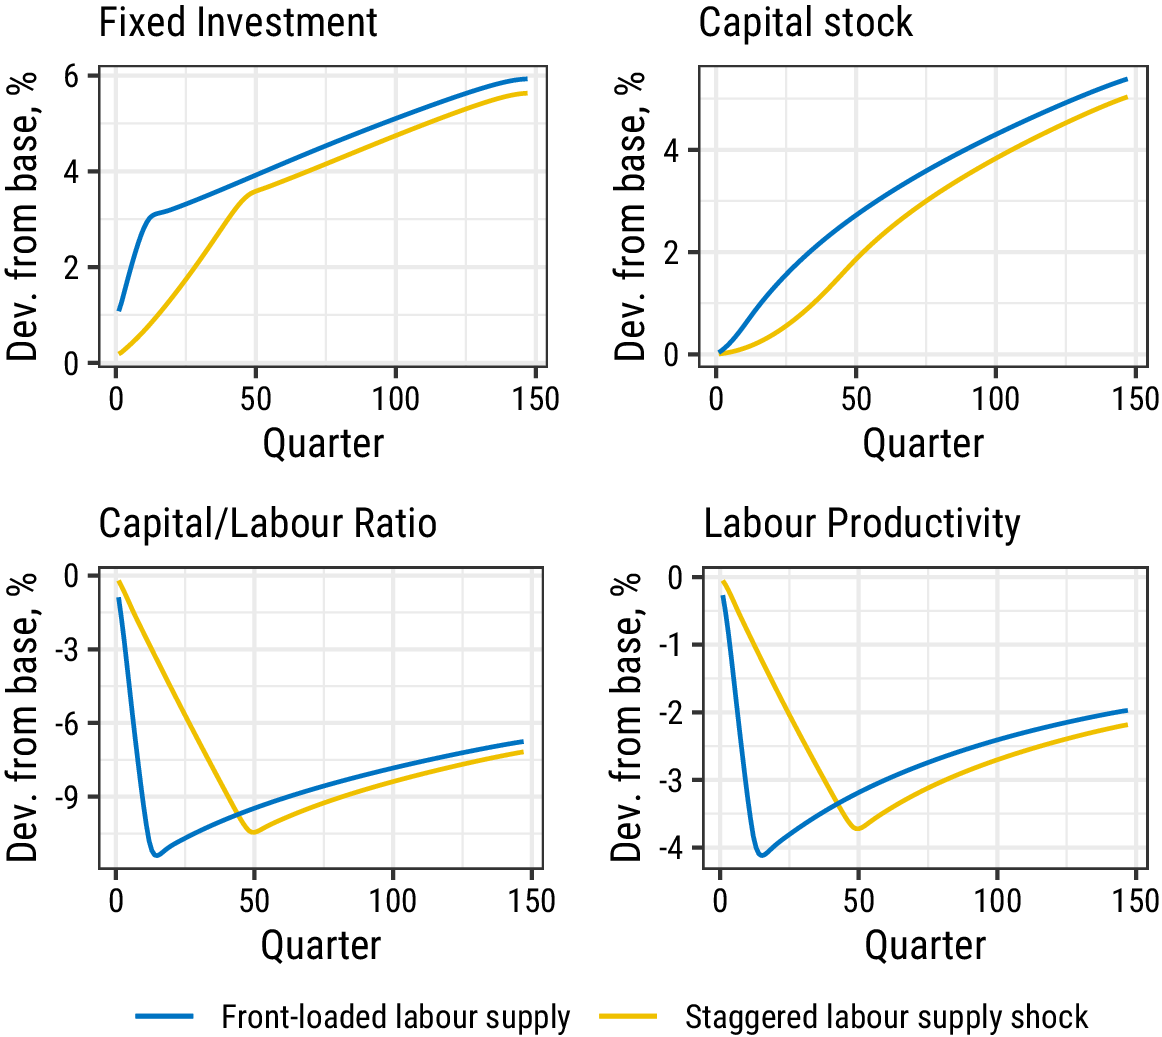
The simulated macroeconomic effect of increased labour supply.

Domestic-facing, non-traded sectors such as construction and private non-traded services thereby respond more weakly than the internationally traded sectors. The marginal product of capital increases as output rises ahead of the capital stock and this leads to higher fixed investment (Figure 4). But fixed investment increases only moderately leading to a slow expansion in the capital stock. The net effect is that the capital–labour ratio declines and labour productivity is lowered by around 4% at its peak effect (Figure 5).
The simulated macroeconomic effect of increased labour supply.

The model simulations show that the faster the labour supply shock occurs the larger the short-run adjustment will be, particularly for wages and prices, but the ultimate adjustment is broadly the same.
In summary, the simulation evidence suggests that a labour supply shock of a similar size to the labour supply increase observed in the UK between 2007 and 2019 could reduce the level of labour productivity temporarily by around 4%. This effect is close to the size of the reduced contribution of capital deepening to the productivity slowdown over that period.
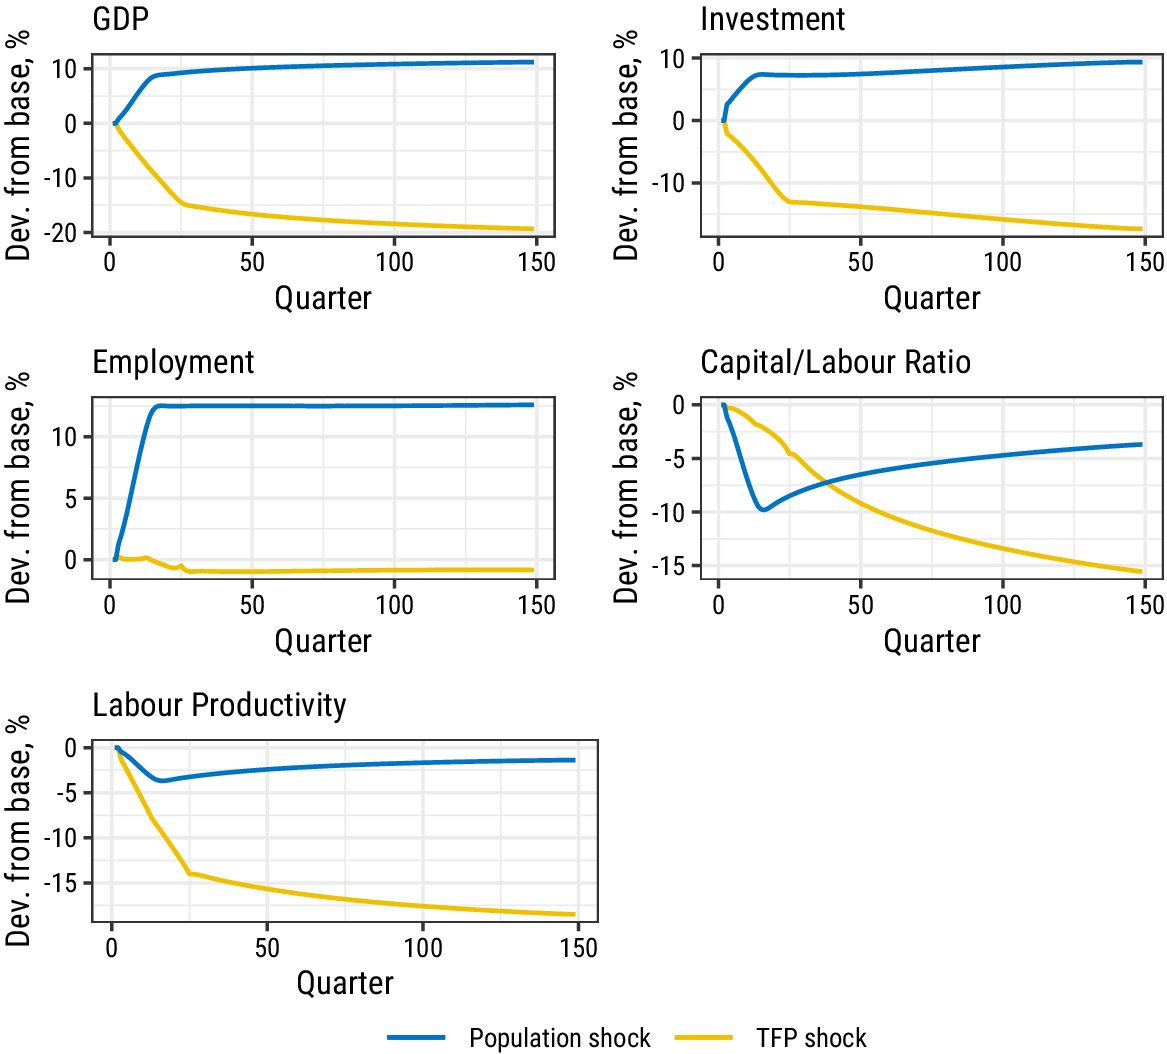
As highlighted earlier in this paper, the evidence suggests that the major part of the productivity slowdown was due to a reduction in TFP. Figure 6 compares the effect on key macroeconomic aggregates of the labour supply shock with a reduction in TFP that is sufficient to reduce labour productivity by 16 log points over 50 quarters. This is achieved in the model by reducing the growth rate of technical progress in the different sectors by 0.5 pp for 6 years.
The simulated macroeconomic effect of increased labour supply (front-loaded) and reduced TFP.

The top left panel of Figure 6 shows that the negative effect on GDP of the TFP shock would dominate the positive effect of the labour supply shock, so that GDP would be reduced by a combination of these shocks, consistent with the evidence of a lower average growth rate over this period.
The top right panel of Figure 6 shows a similar pattern for fixed investment with the negative effect of the TFP shock dominating the positive effect of the labour supply shock, again consistent with the evidence of weak investment over this period.
The middle-left panel of Figure 6 shows that the positive labour supply shock is required to account for higher employment after the GFC. In this case, the positive effect of the labour supply shock dominates the negligible effect of the TFP shock on employment, consistent with the strong pick-up in employment after the GFC.
The middle-right panel of Figure 6 shows that the positive labour supply shock and the negative TFP shock reinforce each other in their negative effect on the capital/labour ratio. The most significant impact in the short run is that of the positive labour supply shock in bringing about capital shallowing. As discussed earlier this negative effect should wear off in time, but the negative effect of the TFP shock will then become more dominant.
The bottom panel of Figure 6 shows the reinforcing effects of the two shocks on labour productivity. At its peak, the positive labour supply shock would reduce labour productivity by about 4 log points, accounting for around one-fifth of the decline.
How plausible is this simulation evidence? Inevitably, the modelled effect is sensitive to the various assumptions underlying the empirical relationships in the model. Of key importance are the investment relationships that lie behind the small adjustment of fixed investment and the capital stock to an increase in the marginal product of capital. Greater investment sensitivity would reduce the estimated effect on labour productivity, but there is little empirical evidence of such an effect. In fact, as documented in Section 2, recent trends at the aggregate level and in individual sectors support a reduction in capital intensity since the financial crisis, consistent with the simulation evidence. Impaired capital markets following the financial crisis could have made capital adjustment more difficult than implied by the model.
4.3. Cross-country evidence
We now complement our previous analysis with cross-country evidence on productivity growth, population growth and rates of productivity convergence.
We confront two hypotheses with cross-country evidence: (i) countries with higher population growth experience lower productivity growth and (ii) rates of productivity convergence have slowed over time, in particular since the great financial crisis. We then assess how those links vary across countries and how the UK compares in these two respects.
We use data from the Conference Board’s Total Economy Database. From that database, we select its 25 countries in Western Europe, North America, Oceania and Japan for the period from 1960 to 2019, thereby spanning a set of developed market economies over a long period that ended pre-Covid.
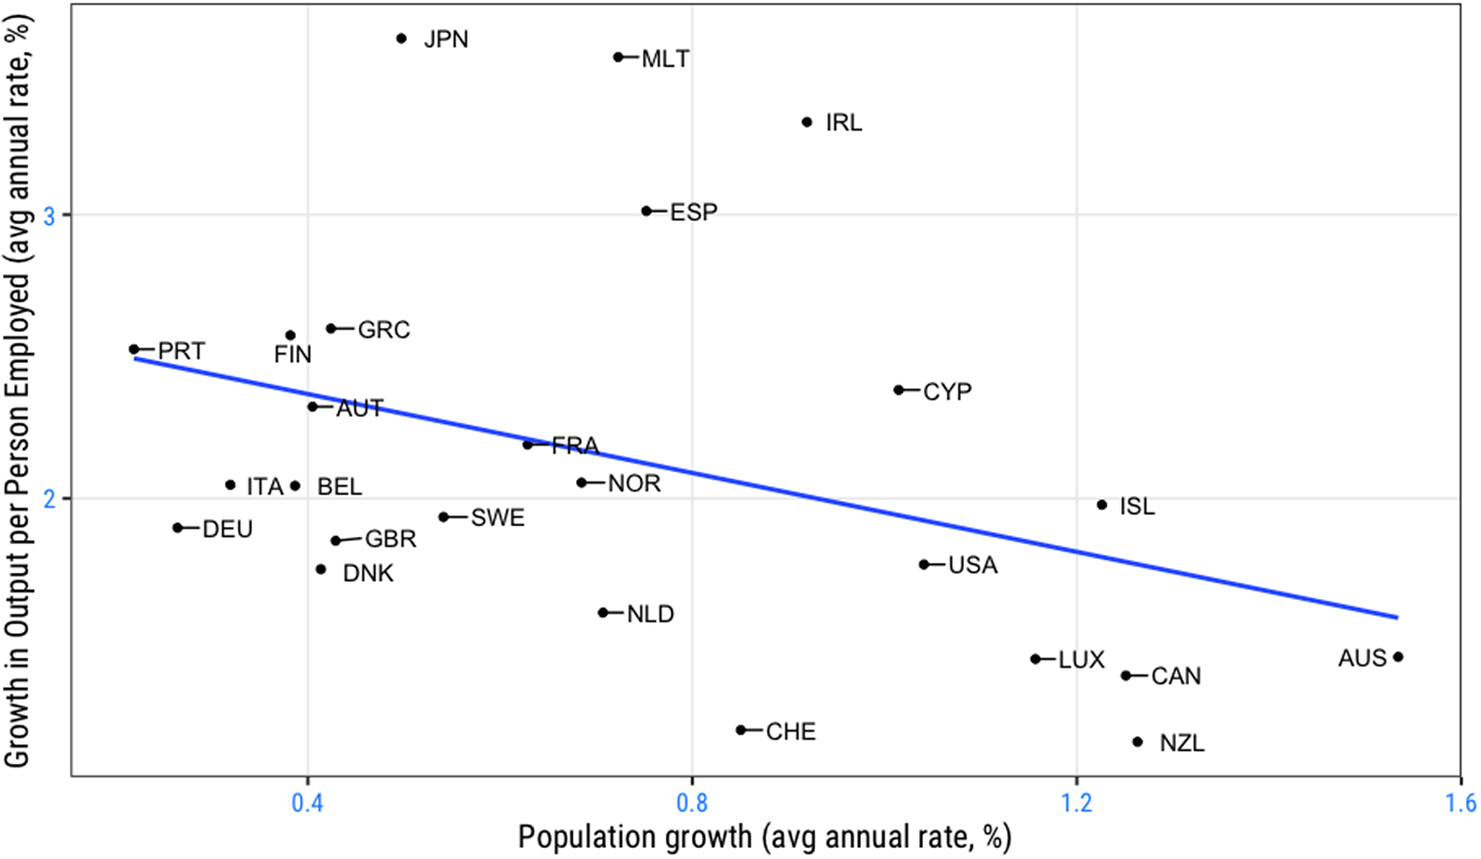
As a starting point, average productivity growth correlates negatively with (average annual) population growth in the 60-year period (Figure 7). Lower productivity growth economies over this extended period have tended to have higher population growth. This echoes the cross-country relationship highlighted by Beaudry and Collard (Reference Beaudry and Collard2002) for the period up to 2002.Footnote 13
Labour productivity growth and population growth.
Source: Conference Board, Total Economy Database and Authors’ calculations.

We exploit the cross-country variation in the data by regressing country-level average productivity growth (in a 20-year window) on its population growth and the initial level of productivity which allows for convergence effects. The higher the initial level of labour productivity (20-years earlier), the weaker should be expected productivity growth. This involves estimating:
 $$ \Delta \log {\left(\frac{Y}{L}\right)}_{it}={\alpha}_{0,t}+{\alpha}_{1,t}\log {\left(\frac{Y}{L}\right)}_{i0}+{\alpha}_{2,t}\Delta {Pop}_{it}+{e}_{it} $$
Where ‘i’ indexes countries, ‘i’ = 1, 2…, 25, and ‘t’ indexes years, t = 1980, 1981…, 2019. We exploit this variation in 40 years of data on labour productivity growth across 25 countries.
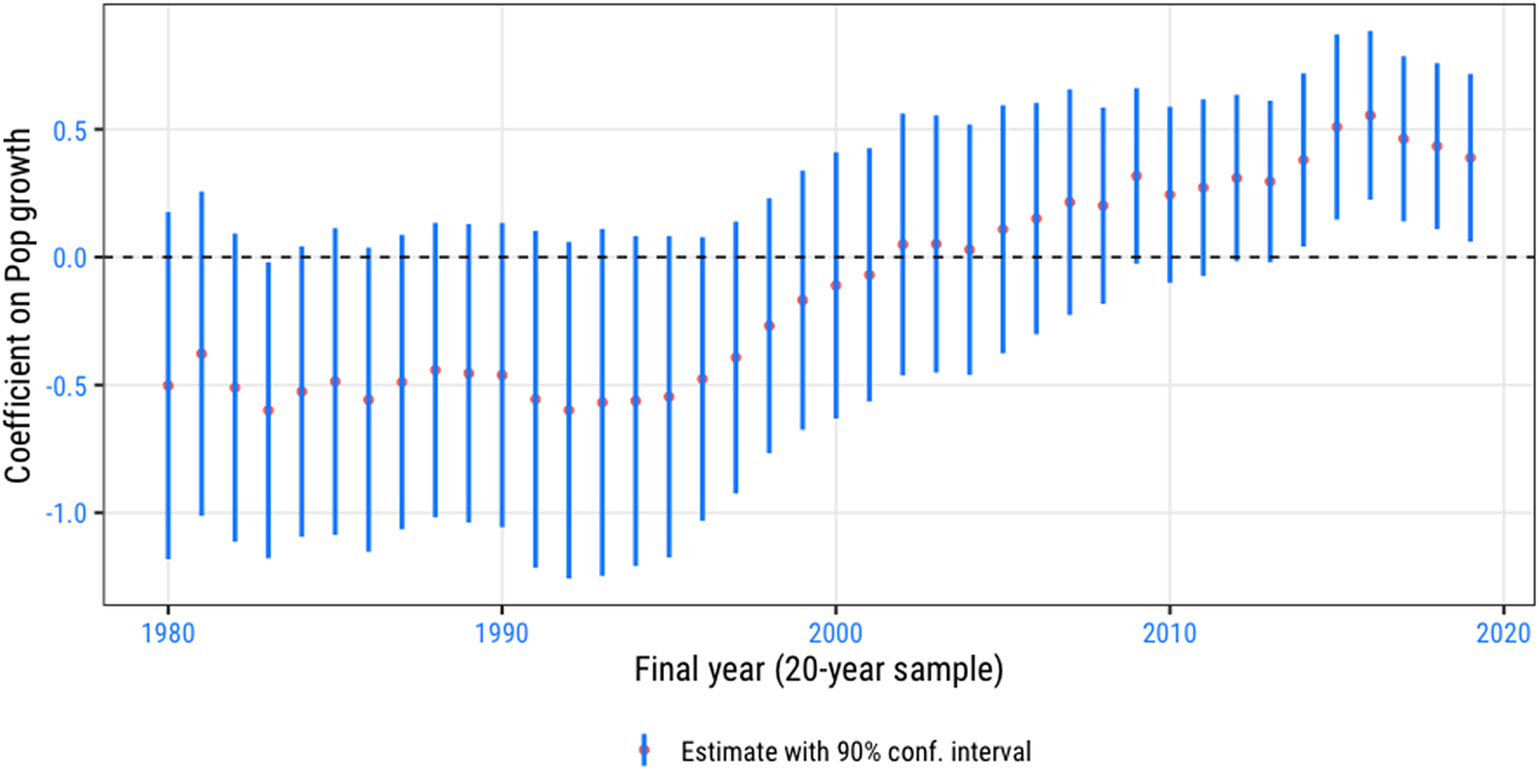
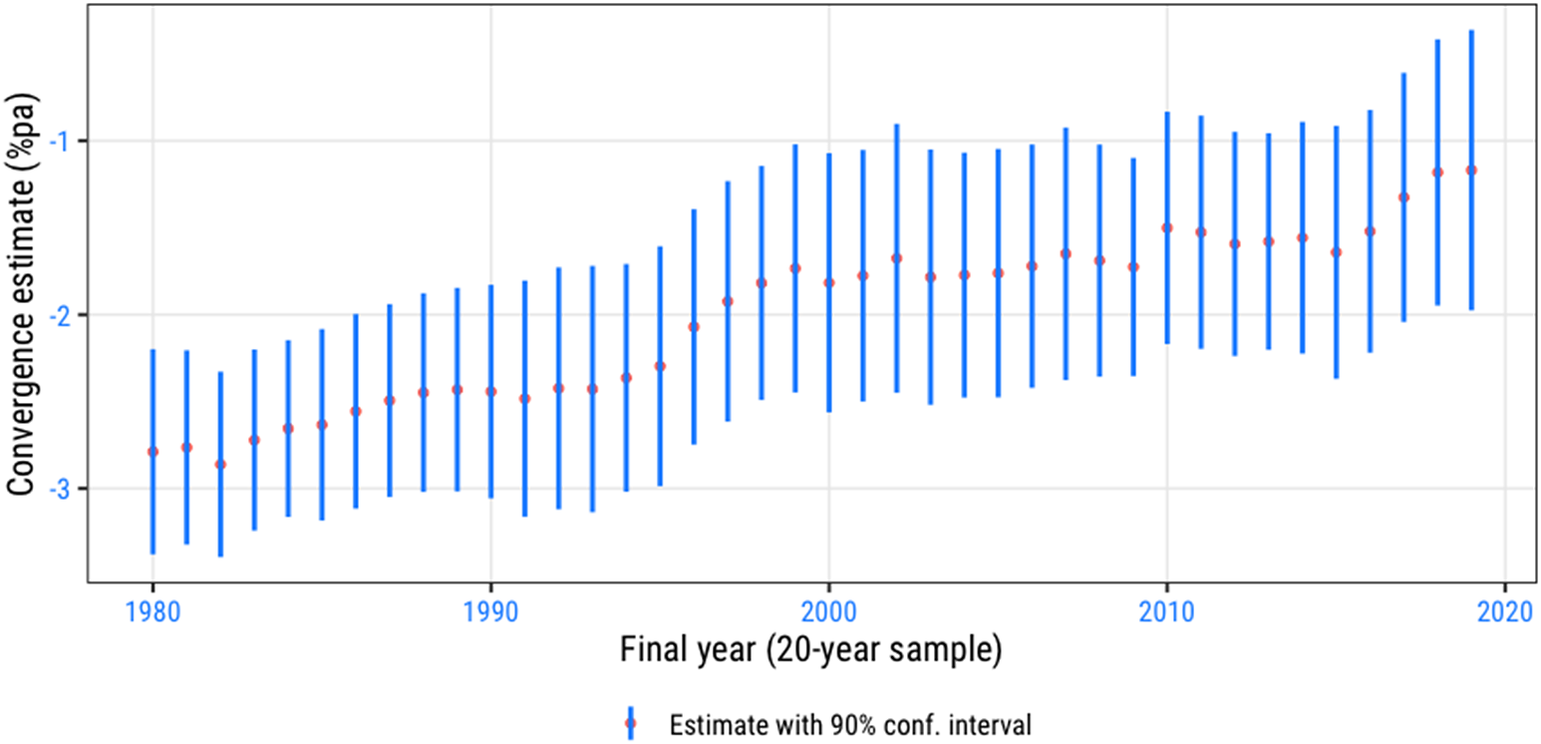
As in the study by Beaudry and Collard (Reference Beaudry and Collard2002), we show the evolution of the rolling coefficients on population growth (α2) and those coefficients capturing convergence (α1) (Figure 8 and Figure 9 respectively). These allow us to assess our two hypotheses.
The evolving relationship between labour productivity growth and population growth.
Source: Conference Board, Total Economy Database and Authors’ calculations.

The evolving relationship between labour productivity growth and estimated rate of convergence.
Source: Conference Board, Total Economy Database and Authors’ calculations.

Our estimates indicate that the inverse cross-country relation between productivity growth and population (shown in Figure 7) was driven by the experience up to the 1980s and mid-1990s, supporting our first hypothesis for that period. Yet, there is evidence that this estimated relationship has since changed sign. More recently, higher productivity growth economies have tended to have higher population growth, also controlling for convergence.
Regarding convergence itself, the estimated rate of convergence has slowed notably since the early-2000s and in the post-crisis period. Compared with an estimated 2.5% p.a. annual speed of convergence in productivity growth up to the 1980s, this has slowed down to a little over 1% p.a. by 2019, across the sample as a whole (Figure 9). It is natural to think of the financial crisis as having impaired the reallocation of capital, and perhaps labour, in such a way as to have slowed down convergence for countries away from the productivity frontier.
Beaudry and Collard (Reference Beaudry and Collard2002) argued that productivity growth in the 1970s was slower in economies where and when labour force was high, specifically after the adoption of a general purpose technology, and this owed to reduced capital deepening. They also suggest that this relationship was changing by the end of their sample which ran to 1997. Our evidence is consistent with, and extends, that view.
With UK experience since the financial crisis in mind, this cross-country evidence points to a slower pace of convergence as a factor weighing on UK productivity growth. Yet, prima facie, it struggles to reconcile weaker productivity growth with the UK’s increased population growth in this more recent period.
How can we reconcile the UK’s underperformance in the more recent period with its increased population growth – in particular, given the finding that an earlier inverse relationship between productivity growth and population growth has faded and may have even changed sign?
4.3.1. How the UK Compares
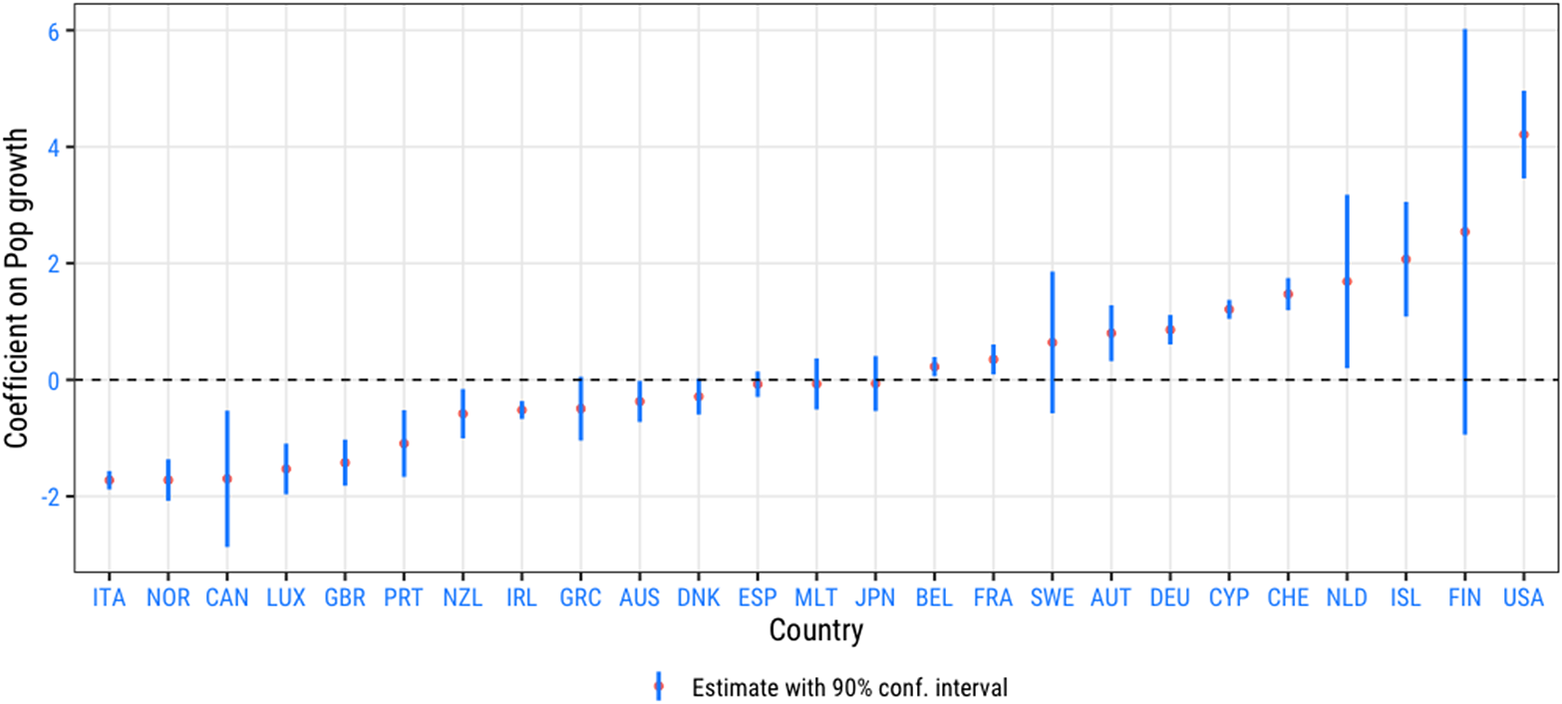
Our cross-country panel allows us to explore how these links have varied by country, shedding further light on how UK experience has compared.
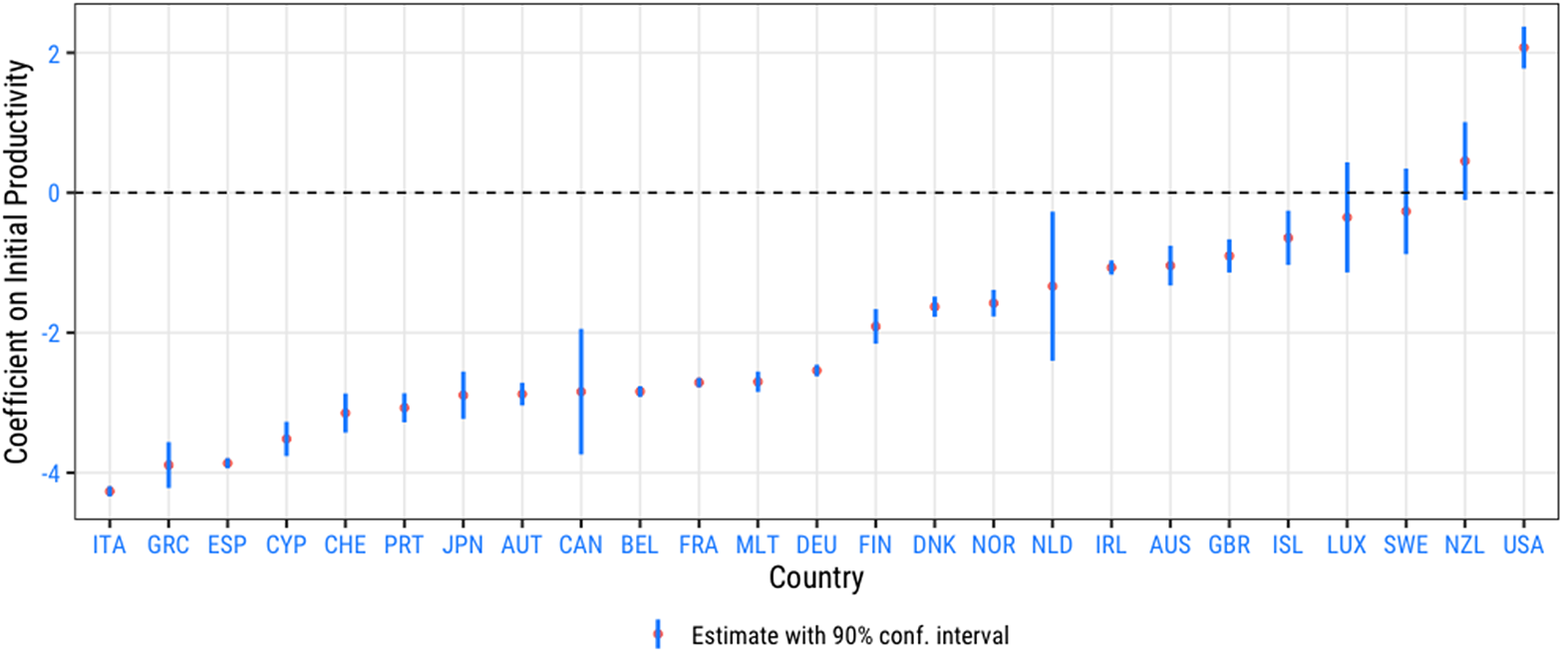
Figure 10 shows that UK productivity growth was in a minority of countries for which productivity growth varied inversely with population growth over the whole period. This retains the approach of looking at productivity growth over a 20-year interval with its population growth in that 20-year window. In the UK, we estimate a coefficient (standard error) of −1.42 (0.24). UK experience has in general seen higher population growth associate with weaker productivity growth. In our sample of countries, about as many countries saw their productivity growth vary positively with population growth, including the United States.
UK productivity growth has moved inversely with its population growth.

The fact that we found cross-country evidence that higher productivity growth countries tended to have higher population growth by the end of the period might have posed a puzzle for understanding UK experience. Our finding that the UK has in general been in a minority of countries with a more negative relation between its productivity growth and population growth may help account for some of this. There is clearly a need for further work to understand these evolving links.
What of the UK’s estimated convergence speed? Our results summarised by the range of country-level coefficients (Figure 11) indicate that the UK witnessed a more modest pace of convergence, estimate at −0.90% p.a. (standard error = 0.14). This may also be a factor that has weighed on UK productivity growth. Our data do not realistically allow us to explore how these links evolved separately for each country and over time.
The UK’s estimated rate of productivity convergence has been slower than most.

Our cross-country evidence together with our assessment of UK-specific performance suggests: (i) Over time, and across countries in general, the tendency for population growth to weigh on productivity growth that was evident in the 1980s and 1990s has since weakened. (ii) Yet, the UK has had a stronger tendency than most advanced economies for population growth to go hand in hand with weaker productivity growth; (iii) a slower pace of cross-country convergence followed the financial crisis and may have slowed productivity growth; and (iv) slower convergence also applies in the UK, in a feature could have owed to impaired capital markets slowing adjustment of its capital stock to an increase in its labour force.
The natural explanation for these findings is that there is no general relationship between a country’s productivity and population growth, as would be consistent with long-run theory. But in the medium term, the relationship will depend on the causes and nature of population change. Countries at the technological frontier that have a high demand for labour that is met partly from highly-skilled workers from the rest of the world are likely to see faster productivity growth than countries that experience a positive labour supply shock that is accommodated by slow wage and productivity growth.
5. Conclusions
Reduced capital deepening accounts for around a fifth of the UK’s large productivity shortfall since 2008. That means that around 4 log points of the 21 log point shortfall in labour productivity that had emerged by 2019 is due to capital shallowing. The evidence we have presented suggests that part of this temporary shift could have been caused by the slow adjustment of the economy to a pronounced increase in labour supply.
Our perspective has been both sectoral and aggregate (and cross-country). The macro perspective suggests that while micro-based evidence of the impact of immigration on local labour markets point to small long-run effects, this may understate macro effects in the medium-run that owe to reduced capital deepening. Our macroeconomic simulation evidence suggests that 4 log points of the productivity shortfall could be attributed to stronger labour supply, and we speculate that this effect could be even stronger in a period of impaired capital markets and weak international demand.
How quickly the capital stock adjusts becomes critical for this macro channel. It is plausible to believe that this pace of adjustment slowed down after the financial crisis and the aggregate impact on productivity of stronger labour supply increased through credit market imperfections and heightened risk aversion.
Capital shallowing was broad based across sectors and also occurred in sectors that benefited from higher TFP growth, post financial crisis. While some sectors experienced an outsized negative TFP shock, capital shallowing across sectors is consistent with a common labour supply shock.
Nonetheless, other shocks have clearly been central to the productivity slowdown accounting quantitatively for most of the shortfall. Some idiosyncratic shocks have applied in the finance and energy sectors. In manufacturing, weak international demand may have also played a role. To some extent, these show up in TFP and in relative prices. We leave for future research to address whether some of these factors are reversed or intensified by Covid-19 and the policy responses to it.
Acknowledgements
We are grateful to Charlie Bean, Gertjan Vlieghe and three anonymous referees for comments. All views, errors and omissions are our own.
Appendix: The macroeconomic model
The underlying macroeconomic structure is a standard (but non-DSGE) open-economy, New Keynesian model based around an IS curve, a Phillips curve and a description of monetary policy behaviour. The model includes the following features:
-
• A well-specified production function linking factor demands and aggregate potential output to the net capital stock, labour supply and labour augmenting technical progress. The model disaggregates production into eight industrial sectors.Footnote 14 Each sector has its own production function and differs in terms of the estimated factor shares, underlying productivity trends, exposure to international competition and its use and consumption of intermediate goods.
-
• A forward-looking investment function that relates the investment rate to the difference between the marginal product of capital (determined by the production function) and the cost of capital. The equation used in each sector is:
 $$ {I}_{it}/{K}_{it-1}={\beta}_{i0}+{\beta}_{i1}\left(\partial {Y_i}^v/\partial Y-{u}_{it}-{\varphi}_{it}\right)+{\beta}_{i2}{I}_{it+1}/{K}_{it} $$
In theory, $ {\beta}_{i1} $
is determined by the cost of adjusting the capital stock the larger the adjustment cost the smaller is
$ {\beta}_{i1} $
is determined by the cost of adjusting the capital stock the larger the adjustment cost the smaller is $ {\beta}_{i1} $
and
$ {\beta}_{i1} $
and $ {\beta}_{i2}\approx 1-{\delta}_i $
, the proportion of the capital stock that survives from one period to the next. The term
$ {\beta}_{i2}\approx 1-{\delta}_i $
, the proportion of the capital stock that survives from one period to the next. The term $ \partial {Y_i}^V/\partial {K}_i-{u}_{it}-{\phi}_{it} $
is the marginal product of capital less the user cost adjusted for a time-varying premium reflecting uncertainty and borrowing restrictions not already included in the user cost. The values
$ \partial {Y_i}^V/\partial {K}_i-{u}_{it}-{\phi}_{it} $
is the marginal product of capital less the user cost adjusted for a time-varying premium reflecting uncertainty and borrowing restrictions not already included in the user cost. The values $ {\beta}_{i1}=0.013 $
and
$ {\beta}_{i1}=0.013 $
and $ {\beta}_{i2}=0.9 $
are imposed in each sector. These values are based on estimation results for the manufacturing sector.
$ {\beta}_{i2}=0.9 $
are imposed in each sector. These values are based on estimation results for the manufacturing sector.
-
• A forward-looking consumption function that relates spending to expected permanent non-property income, net financial wealth and real interest rates. Expected permanent non-property income is determined by the discounted value of expected future non-property income adjusted for population growth.
-
• A wage and price system that ensures that unemployment and the output gap settle at equilibrium values in the medium term. Domestic prices (the GDP deflator) are determined in the long run by unit labour costs, average earnings are determined by productivity and expected producer prices (GDP deflator). Consumer prices are determined by producer prices and import prices, with lagged pass-through.
-
• Exports and imports are determined by international and domestic demand and by prices in the UK relative to other countries. The nominal exchange rate is determined by uncovered interest parity.
-
• Monetary policy determines the nominal interest rate which is set to follow a backward-looking feedback rule that targets consumer price inflation.
-
• Balance sheet equilibrium is ensured by feedback within different sectors. In particular, excess government debt leads to higher household taxes, excess company debt leads to lower dividend distributions and so lower household receipts, lower household net wealth leads to lower consumption.