

Introduction
The European Turtle-dove Streptopelia turtur (Turtle-dove hereafter) is a long-distance migrant breeding across Europe (except Scandinavia), parts of Asia, and North Africa, while its wintering grounds are located along the Sahel region. Four subspecies of Streptopelia turtur are recognised (Clements et al. Reference Clements, Rasmussen, Schulenberg, Iliff, Fredericks and Gerbracht2024): the nominal subspecies S. t. turtur (Linnaeus, 1758) is widely distributed from Eastern Europe to Kazakhstan and Macaronesia; S. t. arenicola (Hartert, Reference Hartert1894) ranges from North Africa to western China; S. t. rufescens (Brehm, 1845), Egypt and northern Sudan; S. t. hoggara (Geyr von Schweppenburg, 1916) in the southern Sahara. Streptopelia turtur is predominantly migratory, particularly S. t. turtur (Marx et al. Reference Marx, Korner-Nievergelt and Quillfeldt2016) and S. t. arenicola, which seem to co-occur in wintering grounds (with the exception of some populations in Morocco and Algeria reported as resident (Chedad et al. Reference Chedad, Bendjoudi and Guezoul2020; Mansouri et al. Reference Mansouri, Squalli, Agy, Salai, Bouayad and Benhichou2022). In contrast, S. t. hoggara and S. t. rufescens are largely sedentary.
The subspecies S. t. arenicola (Hartert, Reference Hartert1894) has traditionally been regarded as a desert form of the nominate subspecies, being paler and smaller in size (Cramp and Simmons Reference Cramp and Simmons1994). In the western Mediterranean region – containing populations from Morocco, Algeria, and the Iberian Peninsula – both S. t. turtur and S. t. arenicola are reported to be present, with their geographical ranges occurring in close proximity and showing wide overlap in their ecological niches (Tellería et al. Reference Tellería, Carbonell, Fandos, Tena, Onrubia and Qninba2020). For instance, Turtle-doves occurring in the Iberian Peninsula are classified as S. t. turtur, while those inhabiting the nearby Balearic Islands are assigned to S. t. arenicola (Balmori 2023). Conversely, Morocco is also occupied by S. t. arenicola while populations in the geographically closer Canary Islands are classified as S. t. turtur (Martín and Lorenzo Reference Martín and Lorenzo2001).
Available information on these subspecies is limited, fragmentary, and largely based on historical observational data, with a notable absence of recent studies employing molecular approaches. For instance, Hanane (Reference Hanane2010) compared morphological measures of Turtle-doves from Morocco, considered to be S. t. arenicola, with biometric means of populations from the UK (Browne and Aebischer Reference Browne and Aebischer2003;) and France (Lormée Reference Lormée2004), attributed to S. t. turtur. His results showed that Turtle-doves breeding in Morocco were generally smaller in wing, head+bill, and bill lengths than those breeding further north in Europe, which was interpreted as confirmation of the subspecific status of Moroccan Turtle-doves.
While morphometric data suggest potential differences between subspecies, genetic studies have provided mixed results. Although no clear structure among S. t. turtur populations was found along distinct migratory flyways (Calderón et al. Reference Calderón, Campagna, Wilke, Lormée, Eraud and Dunn2016), more recent mitochondrial DNA (mtDNA hereafter) analyses found a moderate and significant genetic divergence between birds sampled in Spain, Morocco, and Ukraine (Prakas et al. Reference Prakas, Butkauskas, Švažas, Bea, Yanenko and Ragauskas2021). The latter study identified two genetic clusters: one formed of Spanish samples and a second cluster formed by both Ukrainian and Moroccan samples. This pattern indicates an unexpected genetic affinity between geographically distant populations. However, a key limitation of the aforementioned studies lies in the sampling strategy as most samples were collected from birds hunted during peak migration (late August), which introduces uncertainty regarding their true breeding origin. Consequently, the inclusion of migratory individuals may obscure the underlying genetic structure of the breeding populations and complicate the interpretation of spatial genetic patterns (Barr et al. Reference Barr, Bossu, Bay, Anderson, Belthoff and Trulio2023; Quillfeldt et al. Reference Quillfeldt, Moodley, Weimerskirch, Cherel, Delord and Phillips2017).
Subspecies designation in birds has traditionally relied on phenotypic characters (e.g. morphology, coloration), but genetic data can provide resolution beyond that obtained from phenotypic data (Hebert et al. Reference Hebert, Ratnasingham and de Waard2003) and are essential to distinguish true evolutionary divergence from phenotypic plasticity or environmental variation (Phillimore and Owens Reference Phillimore and Owens2006; Zink Reference Zink2004). Among the molecular markers currently available, mtDNA has been traditionally employed in phylogeographical studies (Avise Reference Avise2000; Zink and Barrowclough Reference Zink and Barrowclough2008) and for subspecies recognition (Capainolo et al. Reference Capainolo, Perktaş, Elverici and Fellowes2023). Due to its high mutation rate, maternal inheritance, and lack of recombination, mtDNA is particularly effective at detecting population structure and historical divergences, even in cases of subtle structure. These properties make mtDNA useful for identifying distinct evolutionary lineages within species, which may warrant subspecies status.
Although taxonomic differentiation among neighbouring populations can reflect ecological and behavioural divergence, phenotypic traits often fail to align with underlying phylogenetic patterns (Keating et al. Reference Keating, Garwood and Sansom2023; Zamudio et al. Reference Zamudio, Bell and Mason2016). For instance, Semenov et al. (Reference Semenov, Koblik, Red’kin and Badyaev2018) documented marked phenotypic diversification with minimal genetic differentiation and no clear population structure within the Motacilla alba subspecies complex. Conversely, the Empidonax flycatchers provide a classic example of cryptic speciation, where two morphologically similar species exhibit distinct vocalisations, breeding behaviours, and are reproductively isolated and genetically divergent (Johnson and Cicero Reference Johnson and Cicero2002). These contrasting cases highlight the limitations of relying on a single line of evidence for taxonomic decisions. In response, several authors have proposed quantitative criteria for species delimitation in birds, emphasising the need for integrative approaches that incorporate multiple data types (Helbig et al. Reference Helbig, Knox, Parkin, Sangster and Collinson2002; Remsen Reference Remsen2010; Tobias et al. Reference Tobias, Seddon, Spottiswoode, Pilgrim, Fishpool and Collar2010). Since subspecies often function as Evolutionarily Significant Units (ESUs) in conservation planning, combining genetic and morphological data is essential to accurately represent evolutionary relationships and inform effective biodiversity conservation strategies (Moritz Reference Moritz1994).
In the case of the European Turtle-dove this issue is particularly relevant due to its current unfavourable conservation status (BirdLife International 2022). The species declined by 83% between 1980 and 2023, particularly in western Europe (PECBMS, https://pecbms.info/). In 2018, an International Species Action Plan for Turtle-doves was approved, and the loss of nesting and foraging habitats, as well as unsustainable levels of hunting were identified as the main drivers of the population decline (Bacon et al. Reference Bacon, Guillemain, Arroyo, Carboneras, Fay and Sauser2023; Fisher et al. Reference Fisher, Ashpole, Scallan, Proud and Carboneras2018; Lormee et al. Reference Lormée, Barbraud, Peach, Carboneras, Moreno-Zárate and Eraud2020). This plan also recognises the four subspecies but focuses on S. t. turtur, treating the subspecies separately. Similarly, the current adaptive harvest management plan for the species, led by the European Commission, is defined at the flyway level (eastern and western) for S. t. turtur. This approach has significant spatial implications for management and conservation, for example, the need for transboundary coordination. Across its range, Turtle-doves are managed under two/three main migratory flyways: the western and central/eastern flyways, as defined by the Species Action Plan and the European Commission’s Adaptive Harvest Management framework (Bacon et al. Reference Bacon, Guillemain, Arroyo, Carboneras, Fay and Sauser2023; Carboneras et al. Reference Carboneras, Šilarová, Škorpilová and Arroyo2024; Fisher et al. Reference Fisher, Ashpole, Scallan, Proud and Carboneras2018). However, the current subspecies delimitation creates challenges. For instance, breeding populations in Morocco and Algeria, typically classified as S. t. arenicola, are excluded from the western flyway framework (Fisher et al. Reference Fisher, Ashpole, Scallan, Proud and Carboneras2018). Therefore, the presence or absence of distinct subspecies may have direct implications for management strategies, as it could influence the definition of conservation units and the prioritisation of actions at both national and international levels.
In the present study, we collected samples from both insular and mainland breeding populations of Turtle-doves across Spain and Morocco. Our aims were: (1) to compare the morphometric variation between the subspecies S. t. arenicola and the nominal subspecies S. t. turtur; (2) to assess their genetic diversity and population structure; (3) to evaluate the congruence of the traditional arenicola–turtur designation based on both morphometric data and mtDNA) and consider their possible implications for the species conservation status.
Methods
Study areas and sampling
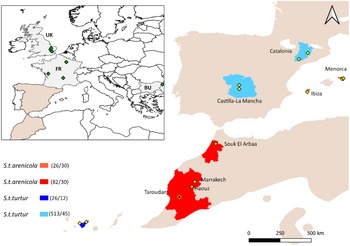
Fieldwork was conducted between 2018 and 2024 in Spain and in 2023 in Morocco, both in mainland and insular breeding populations. Populations a priori attributable to S. t. turtur were sampled in Spain in two mainland areas: Castilla-La Mancha (n = 513, two sampling sites) and Catalonia (n = 121, two sampling sites) and one insular sampling area (Tenerife) in the Canary Islands (n = 26, two sampling sites). Populations belonging to S. t. arenicola subspecies were sampled in mainland Morocco: Marrakech (n = 10, two sampling sites) and Souk El Arbaa (n = 72, one sampling site) and in the Balearic Islands: Menorca (n = 21, three sampling sites) and Ibiza (n = 5, one sampling site) (Figure 1).
Distribution range of European Turtle-dove in the western Mediterranean (BirdLife International 2022), highlighting the sampling regions (in colour) and sampling sites (yellow dots) in mainland Spain, Morocco, and the Balearic and Canary Islands. Areas shaded in reddish tones correspond to regions reported to host S. t. arenicola, while those in blue indicate regions associated with S. t. turtur. The black dot marks the location of samples from the Taroudant region (Hanane Reference Hanane2010) used here for comparison. Numbers in parentheses next to legend elements (xx/yy) indicate sample sizes used for morphometric (xx) and genetic (yy) analyses. The inset shows an additional sampling site from Calderón et al. (Reference Calderón, Campagna, Wilke, Lormée, Eraud and Dunn2016), included in the genetic analysis.
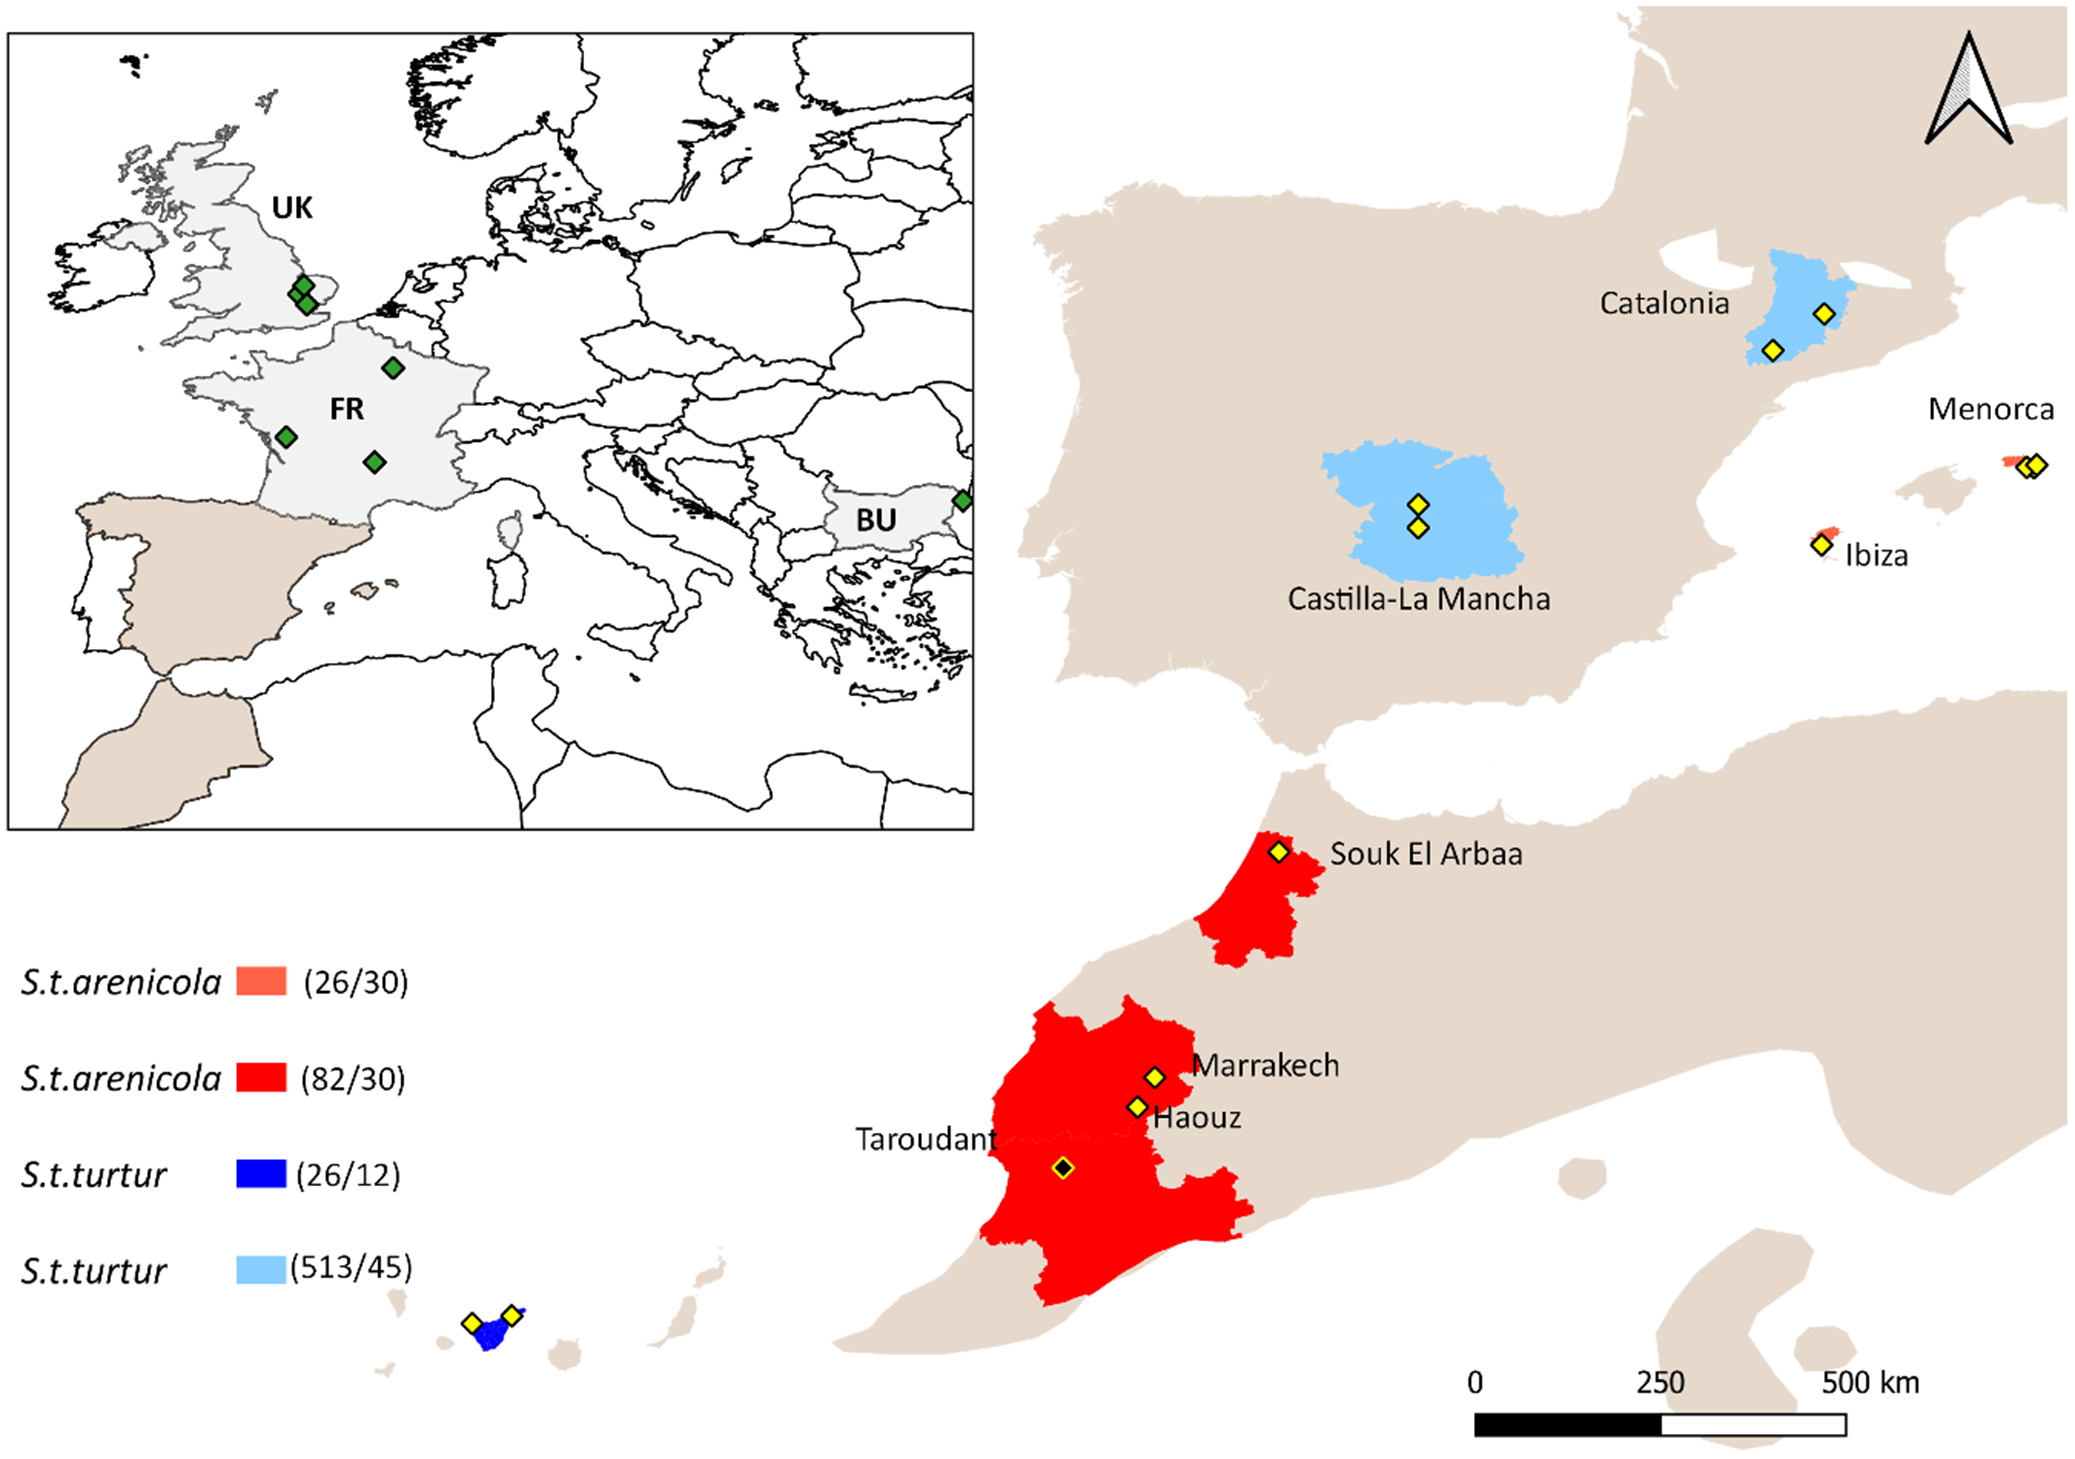
Figure 1. Long description
At the top left, an inset map displays Europe with green diamonds marking sampling locations in the U K, F R, and BU. The main map centers on the western Mediterranean, with mainland Spain, Morocco, and the Balearic and Canary Islands. Colored regions indicate subspecies: reddish for S t arenicola and blue for S t turtur. In Morocco, red-shaded areas cover Souk El Arbaa, Marrakech, Haouz, and Taroudant, with yellow diamonds marking sampling sites. In Spain, blue-shaded regions cover Catalonia and Castilla-La Mancha, each with yellow diamonds. The Balearic Islands (Ibiza and Menorca) and the Canary Islands also have yellow diamonds. The black dot in Taroudant marks a comparative sample. The legend at the bottom links colors to subspecies and provides sample sizes for morphometric and genetic analyses: S t arenicola (26 all over 30 and 82 all over 30), S t turtur (26 all over 12 and 513 all over 45). The scale bar indicates distances up to 500 kilometers.
Birds were captured using drop traps baited with seeds (in all sites) and mist-nests (in Catalonia and Morocco) during the breeding period (May–July) to avoid capturing migrating individuals. Age was determined for each bird using moult criteria based on the presence of juvenile feathers following Demongin (Reference Demongin2016). Birds were ringed with a numbered metal ring, weighed, measured, and blood samples taken. The following morphometric samples were taken: wing length, skull length to bill tip, tarsus length, length of eighth primary, tail length, weight, fat, and moult status (Svensson Reference Svensson1992). However, not all variables were taken from all captured individuals (see below). To increase the sample of morphometric measurements from Morocco, measurements of 72 adult birds published by Hanane (Reference Hanane2010) were added to the morphometric sample pool. These samples were taken in the region of Taroudant in 2009 (between 26 June and 3 August, before the migrations start). Blood samples were obtained from the brachial vein and stored in eppendorfs with 99% ethanol.
Laboratory procedures
We digested blood samples overnight in 250 μl of lysis buffer (0.1 M Tris-HCl, 0.5M EDTA, 2% SDS, 0.2M NaCl, pH 8.5) and Proteinase K (10 ng/μl) and extracted total genomic DNA using a standard AcNH4 protocol (Strauss Reference Strauss1998). We quantified DNA extractions using a Nanodrop spectrophotometer (ND1000, Thermo Fisher Scientific, Brisbane) and normalised them to 25 ng/μl.
We amplified fragments of three mitochondrial genes. For cytochrome b (CYTB, hereafter), a 918-base pair (bp) fragment was amplified using the primers and Polymerase Chain Reaction (PCR) conditions described in Guillaumet et al. (Reference Guillaumet, Crochet and Godelle2005) adjusting total reaction volume to 10 μl. For the cytochrome oxidase I (COI) gene, a 662 bp fragment was amplified following the primers and PCR conditions described in Kerr et al. (Reference Kerr, Stoeckle, Dove, Weigt, Francis and Hebert2007). Finally, for the NADH dehydrogenase subunit II (ND2) gene, a 524 bp fragment was amplified using the primers and conditions outlined in García et al. (Reference García, Suárez, Garza, Calero-Riestra, Hernández and Pérez-Tris2008). Following PCR, we cleaned up the PCR products using Exonuclease I and Shrimp Alkaline Phosphatase (Fermentas), and Capillary Electrophoresis Sequencing was performed with the same PCR primers on an ABI 3730xl System.
Statistical analysis
For both the comparative morphometric analysis and the assessment of genetic structure and differentiation among individuals, we assigned each individual to subspecies on the basis of its capture location and classified it into island and mainland populations. This distinction was made considering that evolutionary processes may operate differently in insular versus mainland bird populations, depending on their degree of ecological and geographical isolation, as well as the distinct selective pressures experienced on islands compared with their continental counterparts (e.g. Dudaniec et al. Reference Dudaniec, Schlotfeldt, Bertozzi, Donnellan and Kleindorfer2011). The categorisation (hereafter referred to as populations) was made as follows: insular arenicola (ARE_INS): individuals sampled in Menorca and Ibiza; mainland arenicola (ARE_MLD): individuals sampled in central and northern Morocco; insular turtur (TUR_INS): individuals sampled in Tenerife; mainland turtur (TUR_MLD): individuals sampled in central and north-eastern Spain (Figure1).
Morphometric analysis
In order to maximise the number of individuals from different sites included in the analysis, we limited the number of morphometric variables to three (wing length, tail length, and tarsus length). We first examined the linear relationship between variables by calculating Pearson’s correlation coefficients. None of them exceeded 0.6 with the highest observed between wing and tail length (r = 0.56). Given the absence of strong collinearity, all three variables were retained in the analysis (Zuur et al. Reference Zuur, Ieno, Walker, Saveliev and Smith2009). Then, we standardised the variables by centring them to a mean of zero and scaling to unit variance to ensure comparability across measurements.
To explore morphological differences among individuals, we performed a Principal Component Analysis (PCA) using the function ‘prcomp’ with the three morphometric measurements to obtain a multidimensional morphospace with orthogonal (i.e. uncorrelated) variables. To test whether morphological variation differed among populations, we conducted separate one-way analysis of variance (ANOVA) using the scores of the principal components (PC1 and PC2) as response variables, and population (ARE_INS, ARE_MLD, TUR_INS, TUR_MLD) as a fixed factor. Additionally, to assess whether morphological differences also exist between insular and mainland populations within each subspecies (turtur and arenicola), we performed additional one-way ANOVA tests using the scores of the principal components as the response variable, and subspecies as a fixed factor. Moreover, we performed a Linear Discriminant Analysis (LDA) to assess whether the predefined groups could be distinguished based on morphometric traits. The LDA was carried out using the ‘lda’ function using the same standardised variables as predictors and groups. All analyses were performed with the software R version 4.2.1 (R Core Team 2022).
Population genetic diversity, structure, and differentiation
After concatenating the three partial gene fragments, we obtained a 2,058 bp mtDNA fragment, which was aligned across all sampled populations using Geneious and the ‘MUSCLE’ algorithm. Genetic analyses were conducted using this fragment for all our sampled populations from Morocco and Spain. For each population (ARE_INS, ARE_MLD, TUR_INS, TUR_MLD), we calculated population genetic diversity using indices of haplotype diversity (Hd) and nucleotide diversity (π) using DNAsp 5.0.1 (Rozas et al. Reference Rozas, Ferrer-Mata, Sánchez-DelBarrio, Guirao-Rico, Librado and Ramos-Onsins2017).
Since one of the main objectives of this study was to estimate potential genetic divergences between the analysed populations, we performed an analysis of molecular variance (AMOVA) to evaluate the genetic structure and to quantify the partitioning of genetic variation, both between the two putative subspecies and between island and mainland population groups. We also performed a principal coordinate analysis (PCoA), a multivariate method that visualises how populations cluster along discriminant axes based on Nei’s genetic distance (Nei Reference Nei1972). Furthermore, to obtain a graphical representation of genetic structure without prior assumptions, we conducted a discriminant analysis of principal components (DAPC). This method was applied using prior grouping by populations to assess the probability of sequence assignment to specific population. We used the ‘xvalDapc’ function to perform cross-validation for different numbers of p axes, inferring the optimal p’ axes as the one that produces the lowest mean squared error term. Both multivariate analyses were performed using the adegenet package in R (Jombart Reference Jombart2008). Finally, to test for genetic differentiation, we calculated the standardised fixation index (Fst) for population pairs using Arlequin 3.5.2.2 (Escoffier and Lischer Reference Excoffier and Lischer2010) and statistical significance was determined through Fisher’s exact test (10,000 permutations). We used the Tamura–Nei evolutionary model for this computation, since this was the chosen model by corrected Akaike information criterion (AICc) criteria in jModelTest 2.1.10 (Darriba et al. Reference Darriba, Taboada, Doallo and Posada2012).
Finally, to obtain a graphical representation of the relationships between the different haplotypes, we computed a haplotype network using POPART (https://popart.maths.otago.ac.nz) with the ‘Median-Joining (MJ)’ method. We performed this analysis for concatenated sequences (CYTB + COI + ND2) and the CYTB gene separately, in order to include the cytochrome b sequences of European breeding populations of S. t. turtur generated by Calderón et al. (Reference Calderón, Campagna, Wilke, Lormée, Eraud and Dunn2016)
Comparison with other European populations
Theoretically, genetic divergence among subspecies is expected to exceed that observed among geographical populations within subspecies (Wang et al. Reference Wang, Guo, Zhong, Lyu, Li and Duke2022). Consequently, if the genetic differentiation within the subspecies turtur, i.e. between Spanish Turtle-doves and their European counterparts, exceeded that reported between turtur and arenicola, the current subspecies classification could not be supported by mtDNA evidence. To test this, we used available CYTB sequences for breeding S. t. turtur in other European countries (Calderon et al. Reference Calderón, Campagna, Wilke, Lormée, Eraud and Dunn2016), including sequences from France (n = 15), UK (n = 14), and Bulgaria (n = 14) (see GenBank references, Supplementary material Table S8) and compared them with our newly obtained turtur CYTB sequences. We repeated all previous genetic analyses: genetic differentiation tests, AMOVA, DAPC, PcOA, and haplotype network now including the aforementioned European samples.
Results
Morphometric differences among subspecies
A total of 971 birds were captured in the field. However, we used a final set of 647 adult birds that contained a complete pool of wing, tarsus, and tail length measurements (including the measures from Hanane Reference Hanane2010) (Figure 2, Tables S1 and S2).
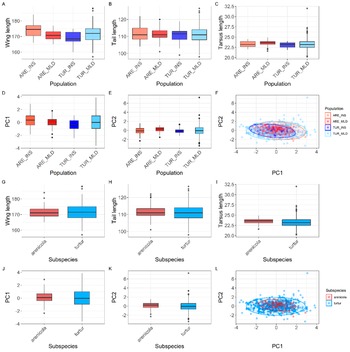
Morphological variation (adult birds) among the four populations and the two subspecies. Boxplots show variation in wing length (A, G), tail length (B, H), tarsus length (C, I), and the distribution of principal component PC1 and PC2 scores by population (D, E) and subspecies (J, K). Boxes represent the interquartile range (IQR), the horizontal line indicates the median, and the whiskers extend to 1.5 × IQR. Dots beyond the whiskers indicate individual outliers. Scatterplots show the two first PCs; each point represents an individual coloured by population (F) and subspecies (L). The ellipses indicate the 95% confidence interval for each population.
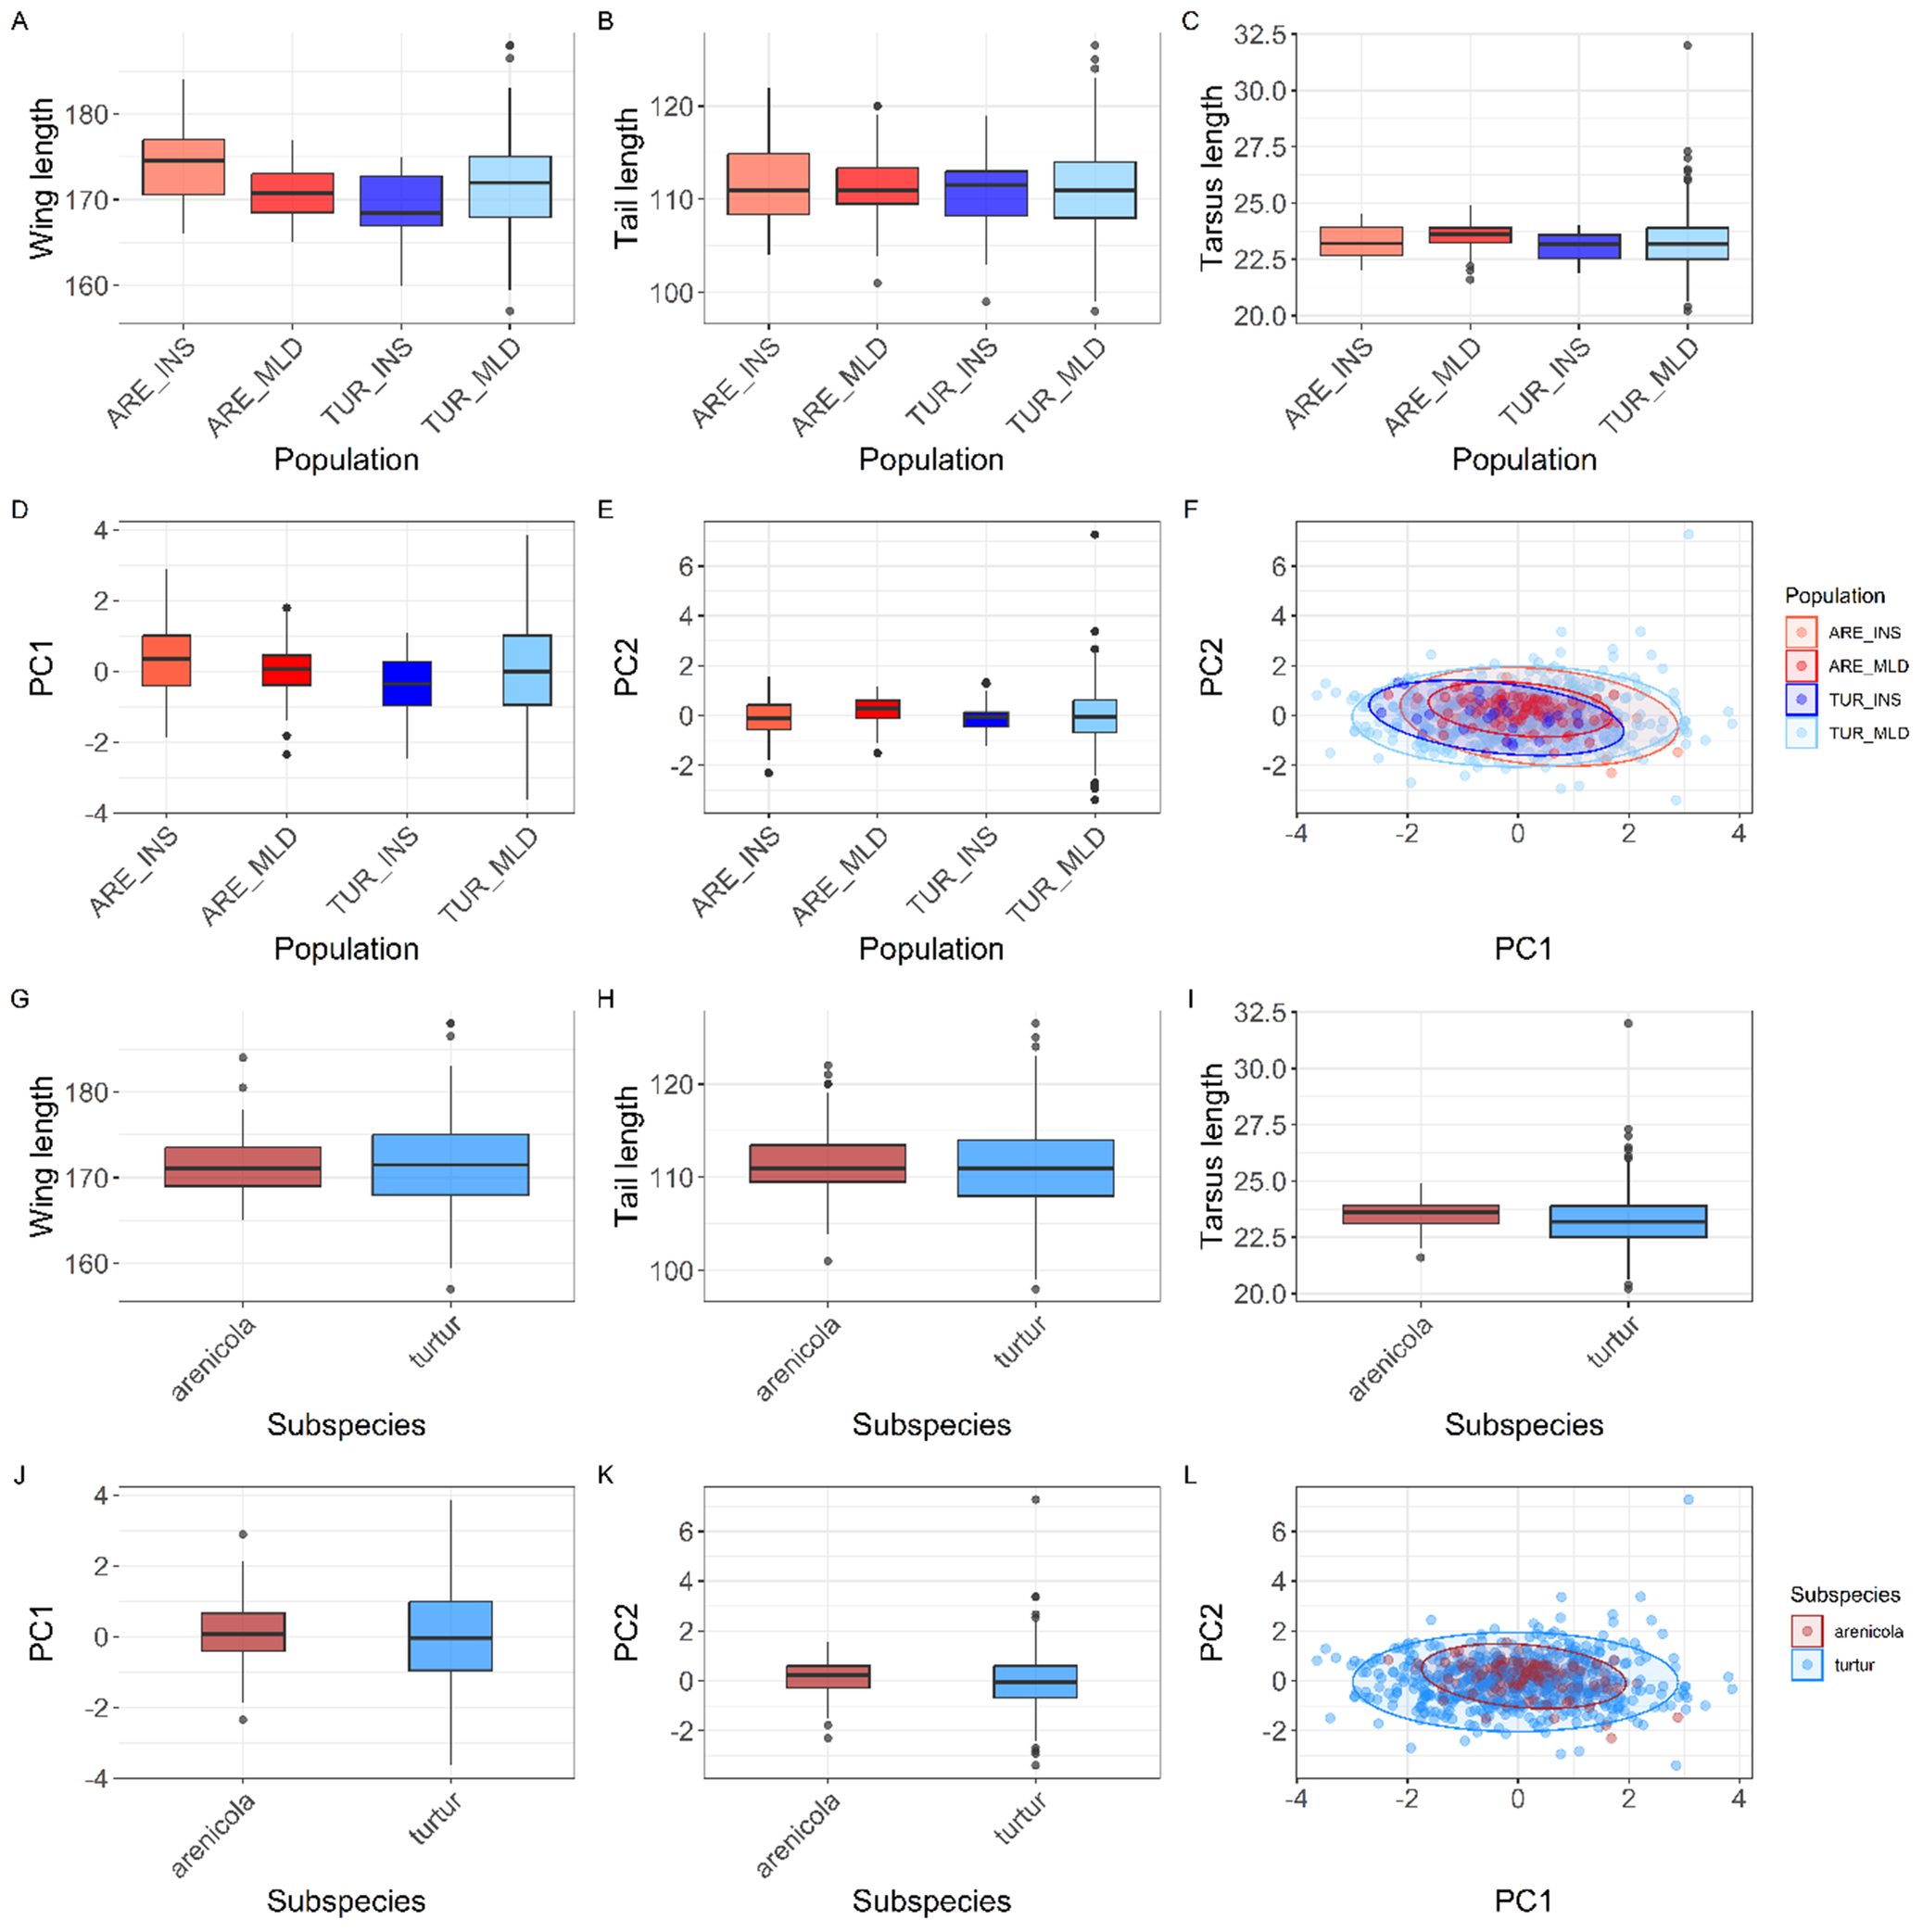
Figure 2. Long description
Top row, panels A to C: Boxplots display wing length, tail length, and tarsus length on the y-axis, with population (A R E underscore I N S, A R E underscore M L D, T U R underscore I N S, T U R underscore M L D) on the x-axis. Medians decrease from left to right for wing and tail length, while tarsus length increases. Panel D: Boxplot of P C 1 scores by population, showing higher medians for A R E populations. Panel E: Boxplot of P C 2 scores by population, with T U R underscore M L D showing the highest median. Panel F: Scatterplot of P C 2 versus P C 1, points colored by population, with 95 percent confidence ellipses for each. Second row, panels G to I: Boxplots of wing length, tail length, and tarsus length by subspecies (arenicola, turtur), with turtur generally showing higher values. Panels J and K: Boxplots of P C 1 and P C 2 by subspecies, turtur has higher medians. Panel L: Scatterplot of P C 2 versus P C 1, points colored by subspecies, ellipses show overlap. Outliers are marked as dots beyond whiskers in all boxplots.
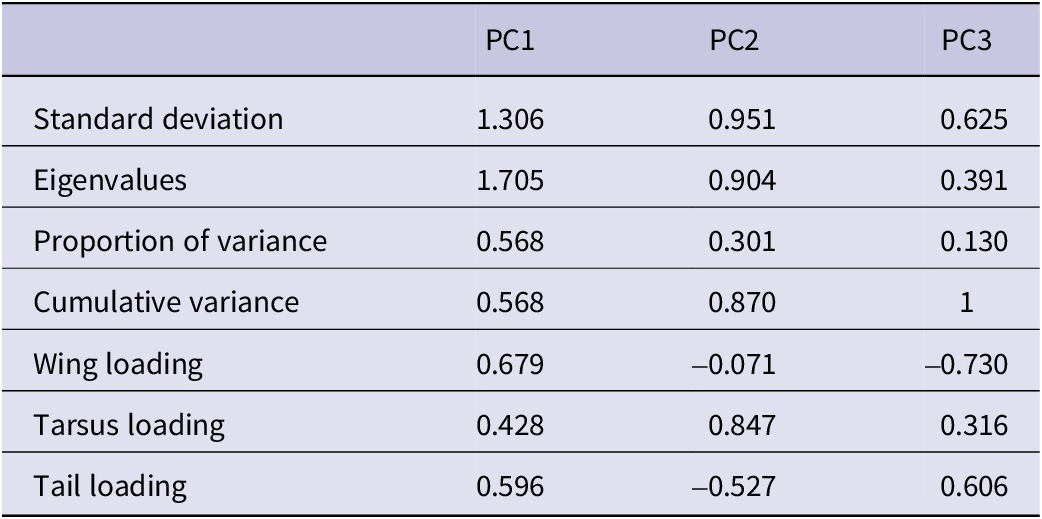
The results from the PCA showed that the two first principal components (PC1 and PC2) explained 56.83% and 30.14% of the variance, accounting for 87% of the cumulative variance. The third component (PC3) contributed only 13.03% of the variance, making it less relevant for interpretation. PC1 was positively associated with all three variables and can be interpreted as an overall indicator of size. PC2 was mainly positively associated with tarsus length and negatively correlated with tail length (Table 1). The PCA scatterplot of individuals did not reveal a clear separation between populations (Figure 2). The 95% confidence ellipses for each group showed a clear overlap, indicating that morphological variation is continuous rather than clustered by population or subspecies. Neither of the one-way ANOVA tests on PC1 or PC2 scores among populations showed a significant effect (PC1:
$ {F}_{\left(\mathrm{3,643}\right)} $
 = 2.16, P = 0.092; PC2:
$ {F}_{\left(\mathrm{3,643}\right)} $
= 2.16, P = 0.092; PC2:
$ {F}_{\left(\mathrm{3,643}\right)} $
 = 1.24, P = 0.294; Figure2). Similarly, no significant differences were detected between subspecies (PC1:
$ {F}_{\left(\mathrm{1,645}\right)} $
= 1.24, P = 0.294; Figure2). Similarly, no significant differences were detected between subspecies (PC1:
$ {F}_{\left(\mathrm{1,645}\right)} $
 = 1.97, P = 0.274; PC2 =
$ {F}_{\left(\mathrm{1,645}\right)} $
= 1.97, P = 0.274; PC2 =
$ {F}_{\left(\mathrm{1,645}\right)} $
 = 1.608, P = 0.205; Figure 2). The LDA returned three discriminant functions, with LD1 accounting for 83.9%, LD2 for 15.2%, and LD3 for 0.009% of the between-group variance. Group means and discriminant coefficients are provided in Table S3. However, the model failed to differentiate between individuals according to their assigned groups. Almost all individuals were classified into a single group (TUR_MLD) regardless of their original population label, and only one individual was assigned to an alternative group (Table S4).
Summary of the principal component (PC) analysis results: standard deviations, proportion of variance explained, and principal component loadings for the first three principal components derived from morphological traits (wing, tarsus, and tail length)
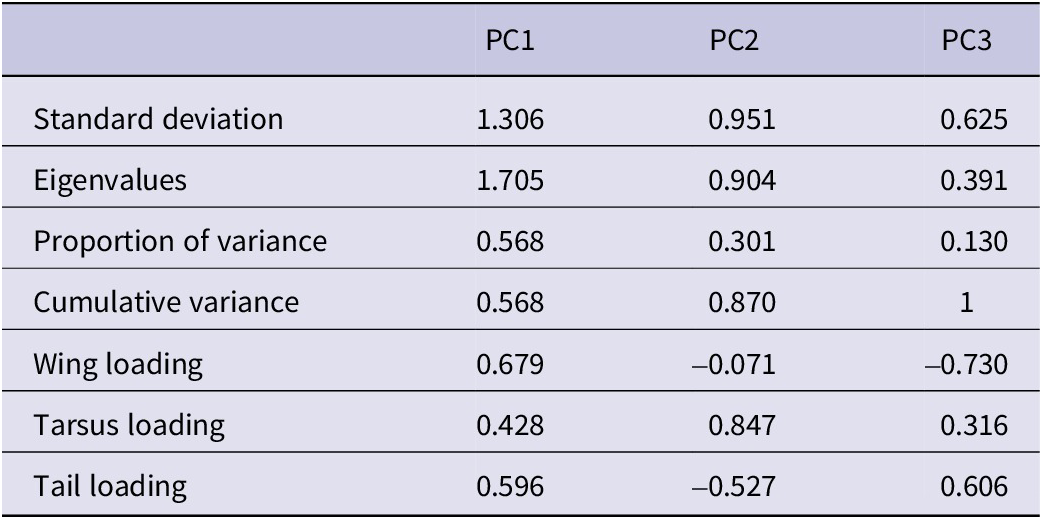
Table 1. Long description
Starting from the top row, the table lists metrics for P C 1, P C 2, and P C 3. Standard deviations are 1.306, 0.951, and 0.625. Eigenvalues are 1.705, 0.904, and 0.391. Proportion of variance explained is 0.568 for P C 1, 0.301 for P C 2, and 0.130 for P C 3. Cumulative variance is 0.568 for P C 1, 0.870 for P C 2, and 1 for P C 3. Wing loading values are 0.679 for P C 1, negative 0.071 for P C 2, and negative 0.730 for P C 3. Tarsus loading values are 0.428 for P C 1, 0.847 for P C 2, and 0.316 for P C 3. Tail loading values are 0.596 for P C 1, negative 0.527 for P C 2, and 0.606 for P C 3. Each metric is aligned horizontally across the three principal components.
Genetic diversity, structure, and differentiation
We successfully amplified 117 individuals at the three mitochondrial genes, which were concatenated into an alignment of 2,058 bp. In the case of the CYTB data set (883 bp), we successfully sequenced 128 samples that joined the 43 available sequences from Calderón et al. (Reference Calderón, Campagna, Wilke, Lormée, Eraud and Dunn2016) giving a total of 171 individuals. We identified a total of 64 haplotypes in the concatenated alignment and 49 haplotypes in the CYTB data set. The mean haplotype diversity was Hd = 0.971 for the concatenated sequence and Hd = 0.896 for the CYTB gene. The highest haplotype diversity values were observed in individuals of S. t. turtur. For the concatenated sequence, the highest diversity was found in individuals sampled in mainland Spanish populations, while for CYTB, the highest diversity was reported in French populations (Calderón et al. Reference Calderón, Campagna, Wilke, Lormée, Eraud and Dunn2016). Conversely, the lowest haplotype diversity, for both the concatenated sequence and CYTB data sets, was also detected within S. t. turtur populations, specifically those from the UK and Canary Islands. However, it is important to note that the sample size for the Canary Islands population was the smallest in the study, which could have influenced these results (Table S5).
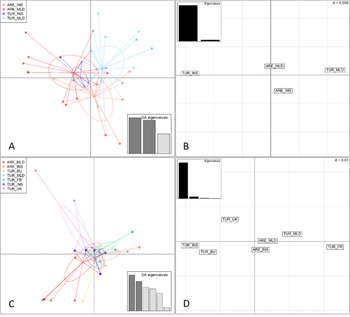
Regarding population structure, the highest percentage of variance explained in the AMOVA occurred ‘within populations’ for both data sets. The variance attributable to the predefined categories (among groups) was negative in both cases, and none of the fixation indexes were statistically significant (Table S6). Summarising, the a priori grouping specified in the AMOVA based on the subspecies categorisation explained none of the genetic variance (Table S6). Genetic differentiation tests were consistent with the AMOVA results, with Fst values generally low or negative. For both data sets, the highest differentiation was observed between mainland and insular populations of S. turtur (TUR_MLD vs TUR_INS in the concatenated data set and TUR_UK vs TUR_BU in the CYTB data set). Genetic differentiation between European populations of S. turtur was on average higher than the differentiation observed between the nominate subspecies and S. t. arenicola, with the exception ARE_INS vs TUR_BU and TUR_BU populations. Nonetheless, all Fisher’s exact tests were non-significant, indicating an absence of statistically significant genetic differentiation between the compared populations (Table S7). In the DAPC, the first two axes accounted for most of the variance for both data sets; PC1 = 67.82%, PC2 = 13.35% for the concatenated sequence, and PC1 = 27.04%, PC2 = 23.39% for the CYTB gene. In both cases the results support a single cluster, with individuals from all populations grouped closely together. On the other hand, the PCoA results revealed an apparent genetic structure, with individuals sampled on Canary Islands (TUR_INS) appearing more isolated from the other categories. However, Nei’s (Reference Nei1972) genetic distances were low (e.g. ARE_INS–TUR_MLD: Nei’s D= 0.008; TUR_INS–TUR_MLD: Nei’s D= 0.026 in the case of the concatenated sequence; Figure 3B), and the subtle structure observed did not align with the geographical location of populations. Overall, the findings indicate a lack of genetic differentiation between individuals classified as S. t. arenicola and S. t. turtur, as well as between those sampled on islands and mainland areas.
Multivariate analyses based on the concatenated data set (A, B) and the CYTB gene (C, D). Discriminant analysis of principal components (DAPC) (axes 1–2) of individuals assigned to predefined populations (A, C). Principal coordinate analysis (PCoA) of the same populations (B, D) where each grid square represents Nei’s (Reference Nei1972) genetic distance d = 0.005. Populations: insular arenicola (ARE_INS, Menorca and Ibiza), mainland arenicola (ARE_MLD, Morocco), insular turtur (TUR_INS, Tenerife), mainland turtur (TUR_MLD, central and north-eastern Spain), and turtur from the UK (TUR_UK), France (TUR_FR), and Bulgaria (TUR_BU).
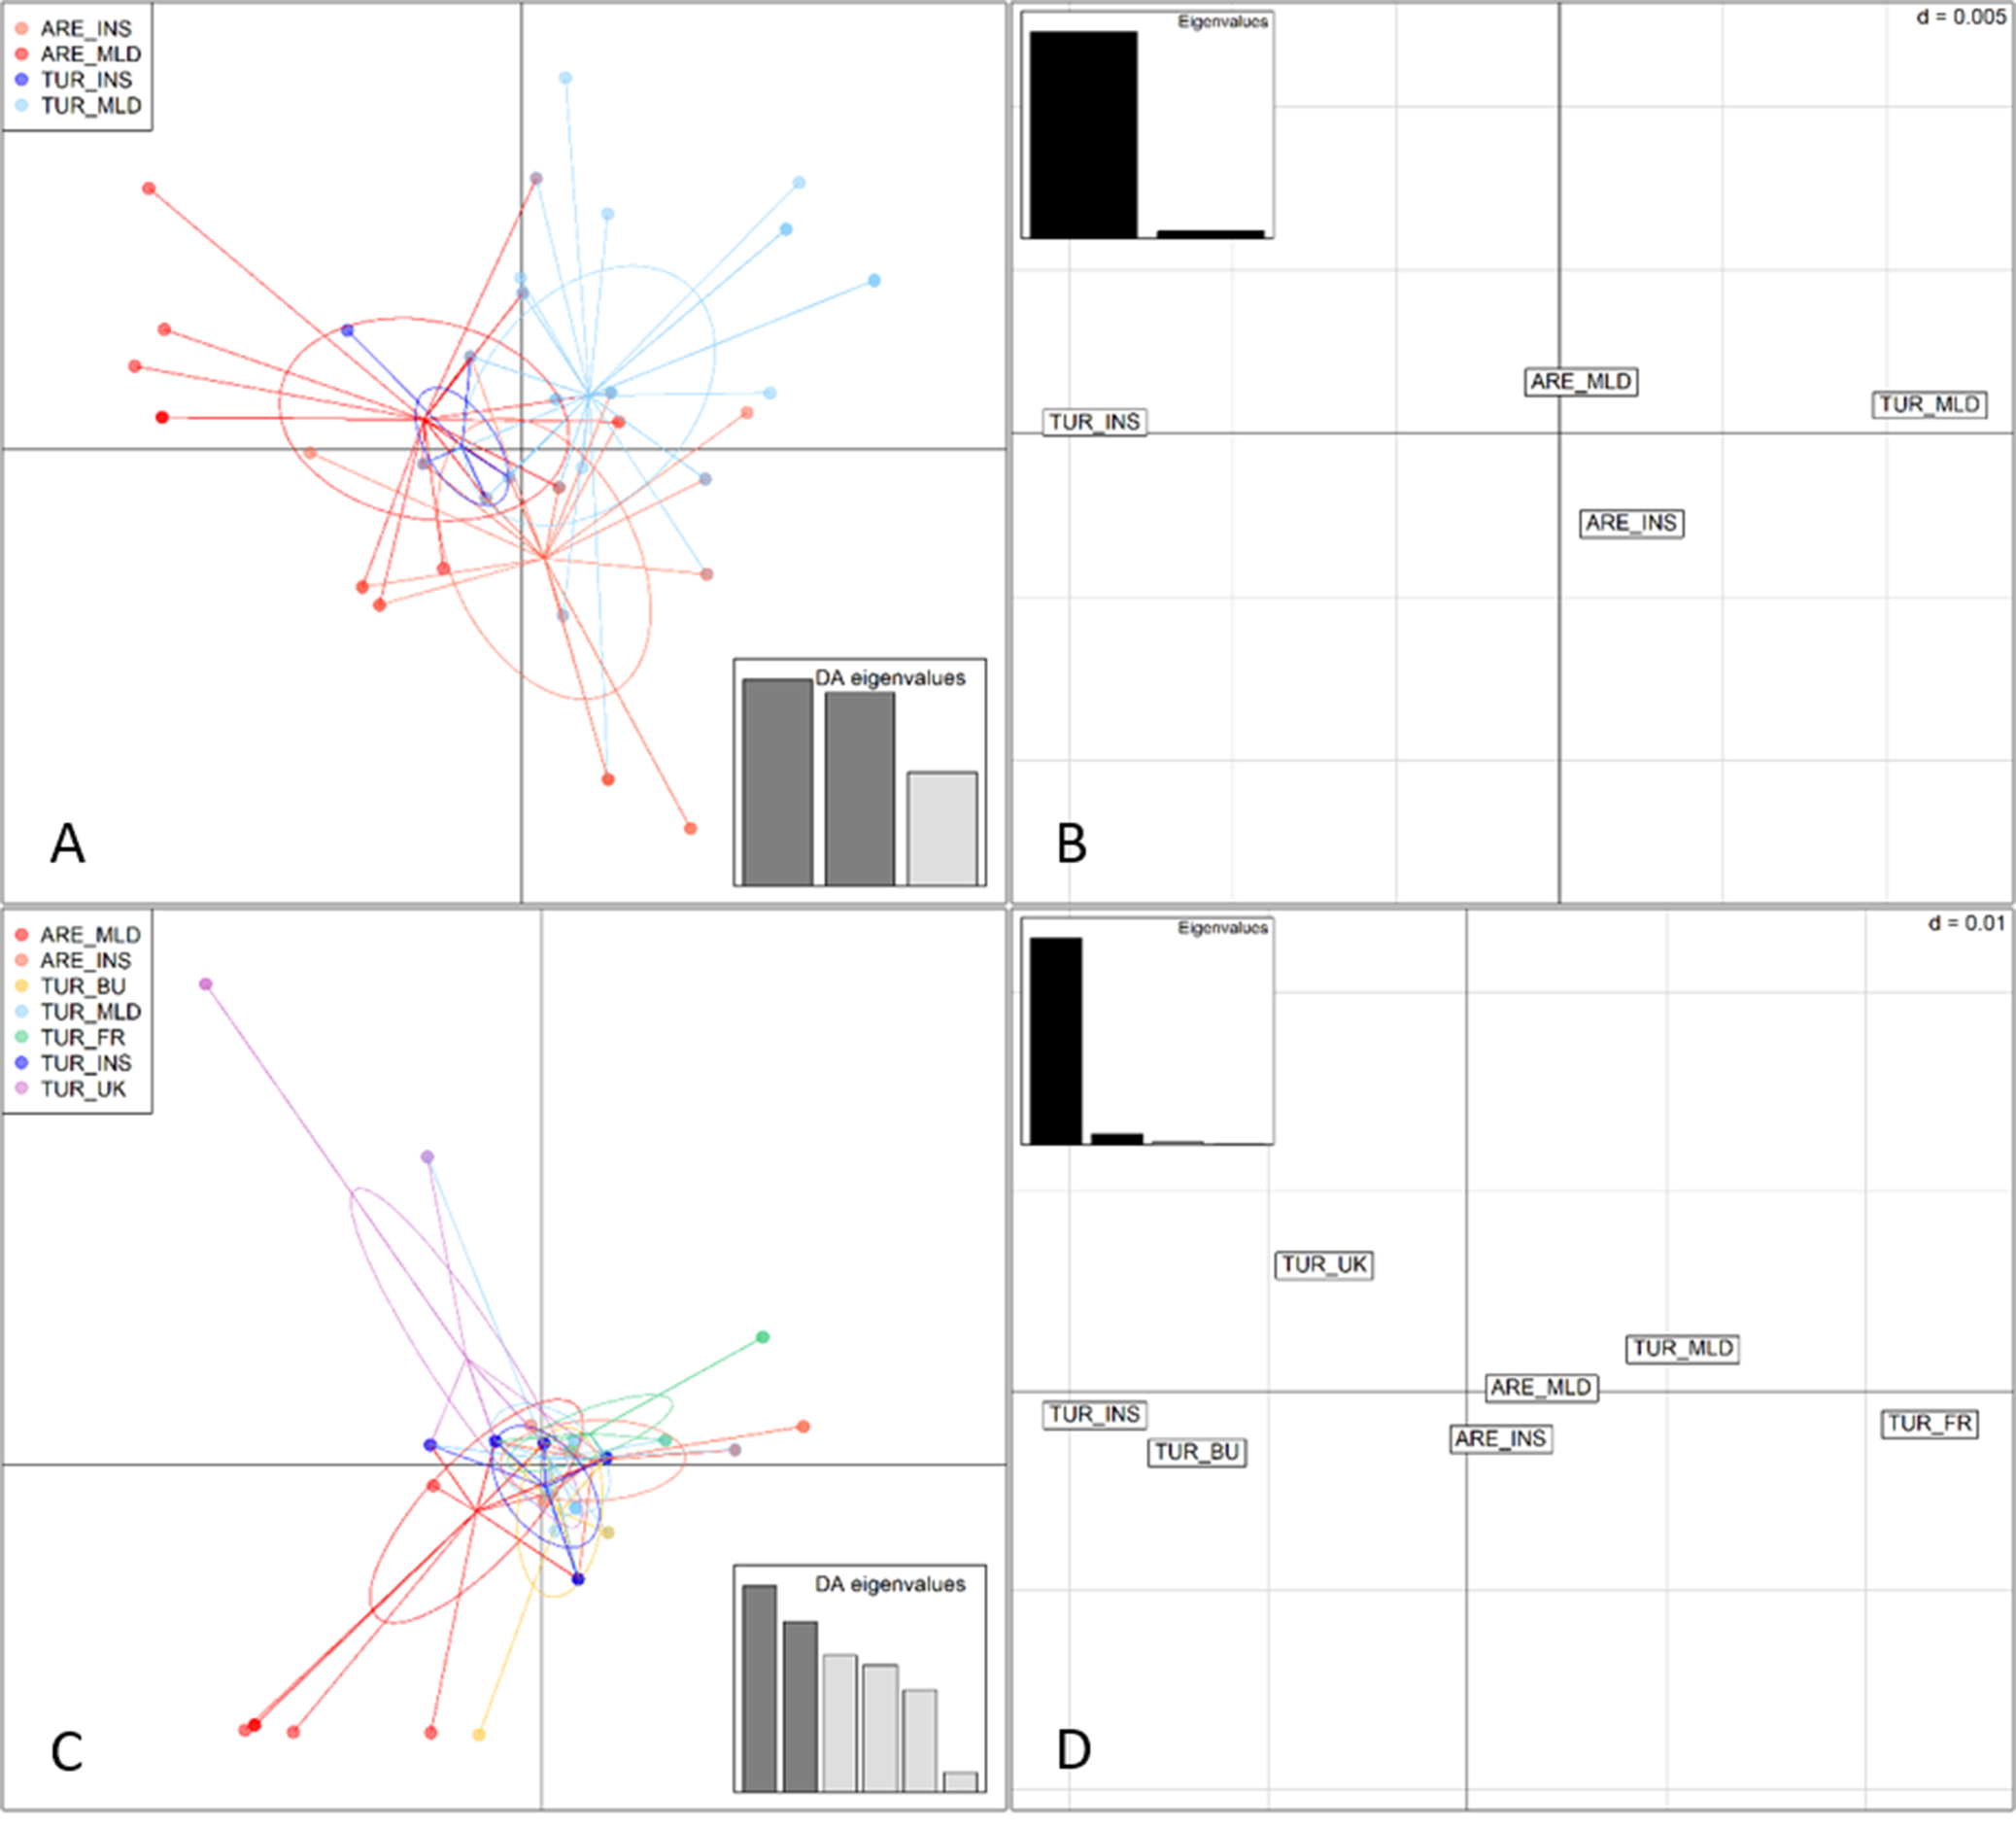
Figure 3. Long description
Panel A at top left shows a D A P C scatterplot for four populations: A R E underscore I N S (red), A R E underscore M L D (orange), T U R underscore I N S (blue), and T U R underscore M L D (light blue). Each point represents an individual, with ellipses outlining group clusters. Arrows radiate from cluster centers to individuals. A legend at top left matches colors to population codes. At bottom right, a bar chart labeled D A eigenvalues displays three bars of decreasing height. Panel B at top right is a P C o A plot with labeled grid squares for A R E underscore M L D, T U R underscore M L D, T U R underscore I N S, and A R E underscore I N S. Each square is separated by Nei’s genetic distance d equals 0.005. An inset bar chart labeled Eigenvalues shows one tall and one short bar. Panel C at bottom left is a D A P C scatterplot for six populations: A R E underscore M L D (red), A R E underscore I N S (orange), T U R underscore B U (yellow), T U R underscore M L D (green), T U R underscore F R (purple), T U R underscore I N S (blue), and T U R underscore U K (pink). Points and ellipses show clustering, with arrows from cluster centers to individuals. The legend at top left matches colors to codes. At bottom right, a D A eigenvalues bar chart shows five descending bars. Panel D at bottom right is a P C o A plot with labeled grid squares for T U R underscore U K, T U R underscore B U, T U R underscore I N S, T U R underscore F R, A R E underscore M L D, T U R underscore M L D, and A R E underscore I N S, separated by Nei’s genetic distance d equals 0.01. An inset bar chart labeled Eigenvalues shows one tall and one short bar. All axes are unlabelled. The panels compare clustering and genetic distances among populations using concatenated data (A, B) and C Y T B gene (C, D).
Haplotype network
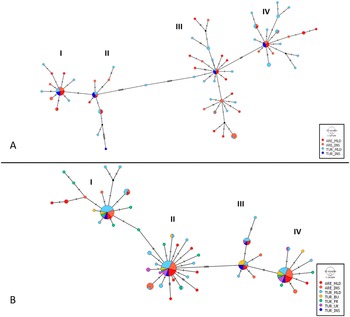
The network showed a complex star topology (Jenkins et al. Reference Jenkins, Castilho and Stevens2018) and revealed the existence of at least four separate haplogroups (haplotype clusters), which had a presumably dominant ancestral haplotype at the centre of each star (Figure 4A). Each haplogroup contained at least one relatively common haplotype, with frequencies ranging from six individuals in haplogroup II to 14 in haplogroup IV; however, most haplotypes were singletons (i.e. detected in only one individual). Overall, no association was found between the haplotype network structure and sampling locations. For CYTB, none of the identified haplogroups correspond to the recognised subspecies boundaries, nor is there any apparent association between genetic structure and the geographical origin of the samples. Regarding the CYTB gene haplotype network (Figure 4B), its overall structure closely mirrors that observed in the concatenated data set, with four main haplogroups each characterised by one predominant haplotype. However, in this case, the most common haplotypes were found at higher frequencies, with 32 and 33 individuals in clusters II and IV, respectively. As before, no relationship was detected between haplogroups and subspecies or geography.
Haplotype network based on the three genes concatenated sequences (A) and based on the CYTB gene (B) for the two known subspecies sampled across Morocco and Europe. Each chart represents a unique haplotype, with its size proportional to the number of individuals sharing that haplotype. Haplotype colours indicate predefined populations (see Methods). Populations: insular arenicola (ARE_INS, Menorca and Ibiza), mainland arenicola (ARE_MLD, Morocco), insular turtur (TUR_INS, Tenerife), mainland turtur (TUR_MLD, central and north-eastern Spain), and turtur from the UK (TUR_UK), France (TUR_FR), and Bulgaria (TUR_BU). Each line represents a single mutational step. Black nodes denote extinct or unsampled haplotypes.
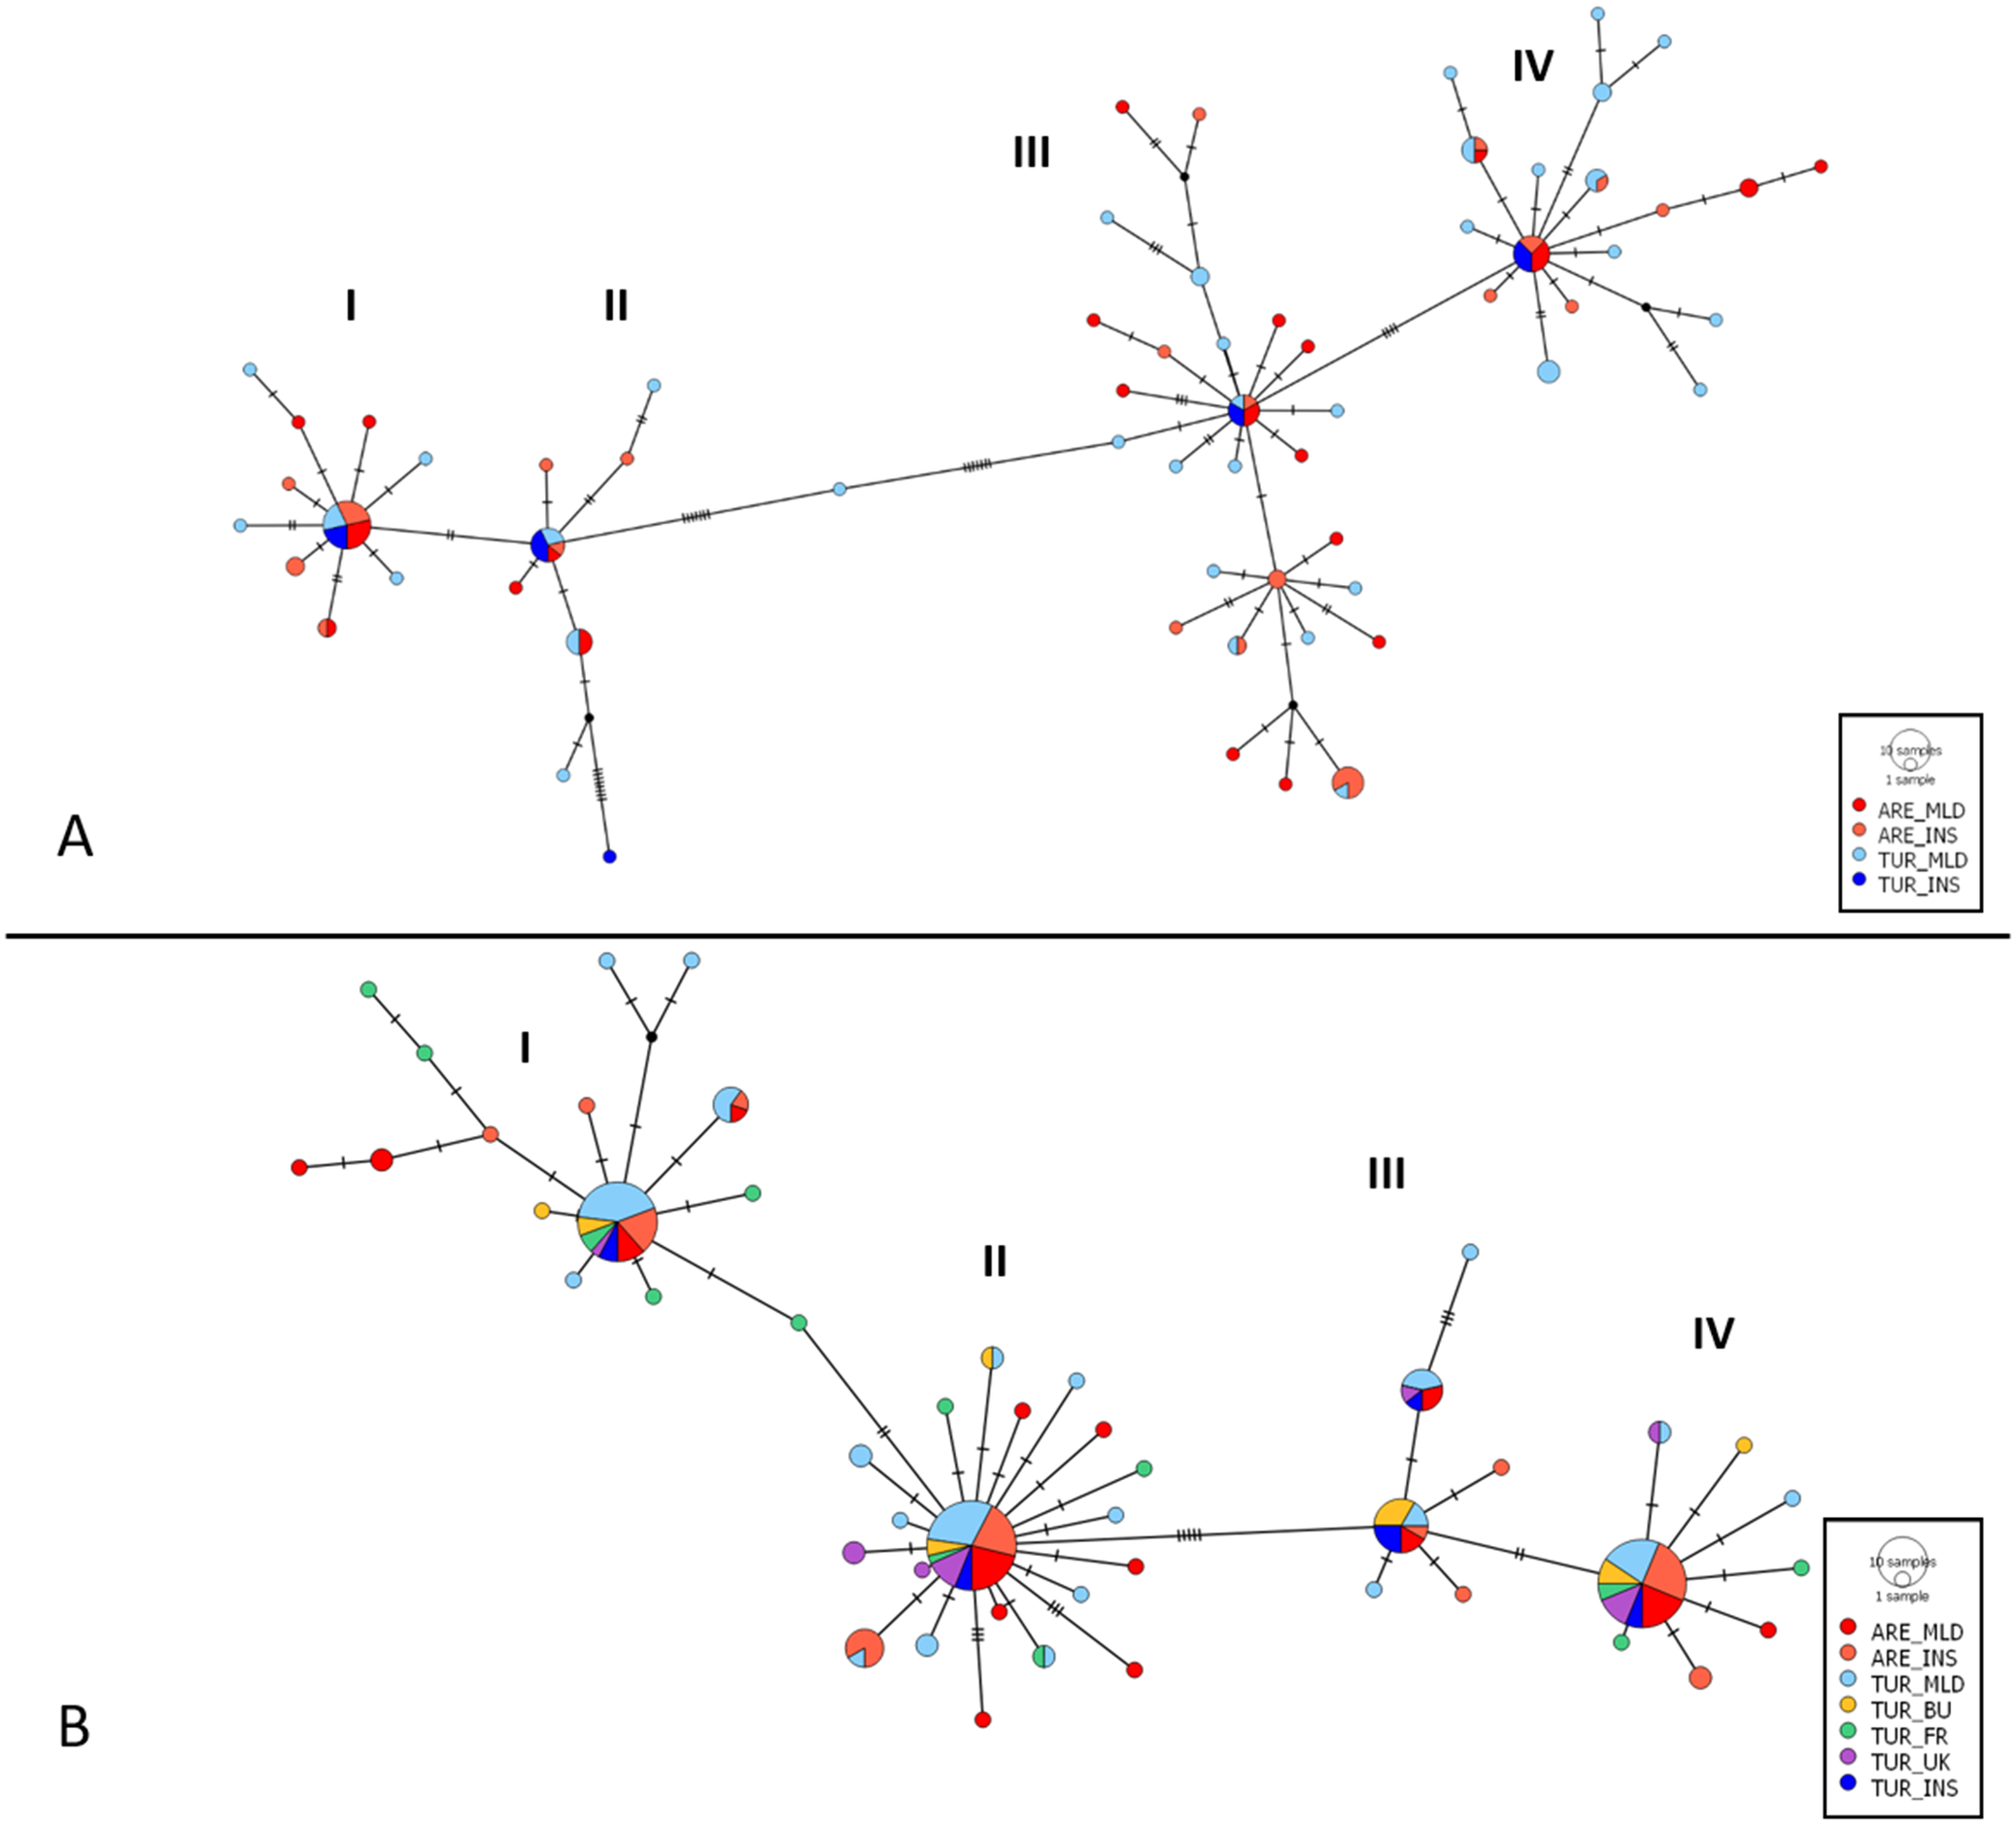
Figure 4. Long description
Panel A at the top shows a haplotype network based on concatenated sequences of three genes. Four main clusters labeled I, II, III, and IV are connected by lines representing mutational steps. Each node is a circle sized by the number of individuals sharing that haplotype, with colors red for A R E underscore M L D, orange for A R E underscore I N S, blue for T U R underscore M L D, and light blue for T U R underscore I N S. Black nodes indicate extinct or unsampled haplotypes. The largest nodes are in clusters I and IV, with cluster I dominated by red and orange, and cluster IV by blue and light blue. Panel B at the bottom shows the haplotype network based on the C Y T B gene, with the same four clusters. Here, nodes are often multicolored, reflecting additional populations: green for T U R underscore B U, yellow for T U R underscore F R, purple for T U R underscore U K, and turquoise for T U R underscore I N S. The legend at the lower right of each panel explains the color coding and node size. Connections between clusters are marked by short black lines, each representing a single mutational step. The overall structure shows more haplotype sharing and admixture in panel B, especially in clusters I and II, compared to panel A.
Discussion
In this study, we investigated morphometric differences together with mtDNA variation in two described Turtle-dove subspecies, S. t. turtur and S. t. arenicola, from breeding populations in Spain and Morocco, to assess the extent to which empirical data support the current subspecies classification. Overall, our findings revealed an absence of statistically significant morphometric differentiation and no detectable genetic differences between the two subspecies within the populations studied, suggesting limited support for their current taxonomic separation based on the analysed traits.
Morphological and genetic homogeneity
Our study found no evidence of morphometric differentiation between Turtle-dove subspecies. Both PCA and LDA showed substantial overlap in wing, tail, and tarsus lengths across subspecies, with no clear geographical separation. These results suggest that morphometric variation within the study area is continuous and does not support the distinction of the arenicola subspecies based on these traits. Given that subspecies designations in S. turtur have historically relied on morphology and coloration, our analysis directly tests the empirical basis for that traditional classification within the study area.
Our study also provides no evidence that the current subspecies classification of S. turtur reflects two independently diverging evolutionary lineages that can be genetically distinguished. Nor did we find evidence supporting differences between island and mainland populations within each subspecies. AMOVA results revealed that none of the explained variance was attributable to the predefined populations and genetic differentiation values (Fst) were negative or close to zero. In addition, when we grouped samples from other European breeding populations such as those sampled in UK, France or Bulgaria and compared them with our European populations from Spain, the observed genetic differentiation was greater between these two European data sets, all described as S. turtur, than between populations of both subspecies. The mtDNA haplotype network for the concatenated sequence of our samples recovered star-shaped groups of haplotypes, with four haplogroups of the most abundant haplotypes. These haplotypes had a broad geographical distribution at the centre of the star from which more evolved genetic variants radiate. These variants were generally unique and separated by one or two mutational events. Overall, none of the haplotypes was exclusive to a certain location. Again, the haplotype network does not support the subspecies categorisation under mtDNA criteria.
Comparison with previous studies
The presence of a different Streptopelia subspecies in the Balearic Islands was first described in 1923 by Von Jordans, who assigned the name Streptopelia turtur loei to birds from the island of Mallorca. This subspecies was also mentioned by Bernis et al. (Reference Bernis, Díez and Tato1958). However, it was not until 1961 that S. t. loei was first reported as a synonym of S. t. arenicola (Vaurie Reference Vaurie1961). This distinction between populations from the Iberian Peninsula and Balearic Islands and those of North Africa has persisted, appearing in, for example, Balmori et al. (Reference Balmori, Martí and del Moral2003) and Clements et al. (Reference Clements, Rasmussen, Schulenberg, Iliff, Fredericks and Gerbracht2024), as well as the International Species Action (Fisher et al. Reference Fisher, Ashpole, Scallan, Proud and Carboneras2018). One of the main purported characteristics of arenicola compared with turtur is that the former is considered to be smaller (Hartert Reference Hartert1894). The results obtained from this work are the most comprehensive analysed to date by direct comparison of measurements between populations of these two subspecies, and none of the size measurements considered here support this hypothesis, which had been hitherto based on a qualitative morphological assessment only.
As the Turtle-dove is a migratory species, morphological variation, particularly in wing length or wing shape, could reflect adaptations to migratory distance rather than true subspecific differentiation (Cabodevilla et al. Reference Cabodevilla, Moreno-Zarate and Arroyo2018). It is well documented that long-distance migrants tend to exhibit longer wings and more aerodynamic body shapes to optimise flight efficiency (Fiedler Reference Fiedler2005; Macpherson et al. Reference Macpherson, Jahn and Mason2022; Matyjasiak et al. Reference Matyjasiak, López-Calderón, Ambrosini, Balbontín, Costanzo and Kiat2023). An alternative and ecologically grounded explanation for variations in body size may be provided by Bergmann’s rule which states that animals from higher latitudes tend to exhibit larger body sizes as a thermoregulatory adaptation to colder climates (Meiri and Dayan Reference Meiri and Dayan2003). This ecogeographical pattern has been widely documented across avian taxa (e.g. Meiri and Dayan Reference Meiri and Dayan2003), including within the Columbiformes (Ashton Reference Ashton2002; Johnston Reference Johnston1990), and is generally attributed to the reduced surface area-to-volume ratio in larger individuals, which enhances heat conservation. Consequently, the observed morphometric differences could reflect local adaptation to climatic gradients rather than a signal of phylogenetic divergence between populations or subspecies as an adaptation to colder climates.
Regarding the genetic data set, our results differ from those of Prakas et al. (Reference Prakas, Butkauskas, Švažas, Bea, Yanenko and Ragauskas2021), who reported genetic differentiation between mainland Spanish (central and eastern) and Moroccan populations using mtDNA (CYTB and D-LOOP). They also showed genetic differentiation between Balearic and Moroccan populations. They identified two major haplogroups, one predominantly found in Spain and another in Morocco and Ukraine. However, one limitation recognised by the authors of that study was the inclusion of both breeders and migrant individuals in certain data sets, such as those sampled in Spain, south-western Morocco, and Ukraine. This mixture may have introduced a confounding genetic signal, undermining the ability to accurately assess population structure or assign geographical origin. Conversely, our findings align with those of Calderón et al. (Reference Calderón, Campagna, Wilke, Lormée, Eraud and Dunn2016), who reported congruent results, and a lack of genetic structure across the three different flyways, using both mtDNA and nuclear single nucleotide polymorphism (SNP) markers (RAD-seq). This consistency indicates that the lack of differentiation observed is unlikely to be an artefact of relying on mitochondrial markers.
Potential explanations for the lack of subspecific structure
No genetic evidence was found to support the taxonomic distinction between S. t. turtur and S. t. arenicola, the two being indistinguishable using mitochondrial DNA. This may be due to the lack of a large-scale geographical feature that could act as an isolation barrier in south-western Europe, where the distributions of the two putative subspecies overlap. Moreover, extensive gene flow – likely driven by frequent dispersal events – may further contribute to genetic homogenisation across populations, thereby preventing significant differentiation. A previous study employing satellite telemetry on 13 Turtle-doves breeding in Central and Eastern Europe provided preliminary evidence indicating that the observed population structure may be influenced, at least in part, by the degree of connectivity – and consequently gene flow – along migratory routes (Schumm et al. Reference Schumm, Metzger, Neuling, Austad, Galea and Barbara2021). The study confirmed low levels of migratory connectivity (high spread), which is in line with the non-existent genetic structuring across flyways (Calderón et al. Reference Calderón, Campagna, Wilke, Lormée, Eraud and Dunn2016). Pronounced genetic structuring is unlikely to emerge under conditions of low migratory connectivity, where extensive gene flow among breeding populations tends to homogenise genetic variation (Quillfeldt et al. Reference Quillfeldt, Moodley, Weimerskirch, Cherel, Delord and Phillips2017). This may arise from several factors: (1) the aggregation of individuals originating from different breeding populations in shared wintering areas; (2) the presence of individuals that winter in distinct regions but converge at common breeding sites (Hällfors et al. Reference Hällfors, Pöyry, Heliölä, Kohonen, Kuussaari and Leinonen2021); (3) the admixture of populations during migratory transit (Gu et al. Reference Gu, Pan, Lin, Hu, Dai and Chang2021). Such overlaps in migratory pathways and/or wintering grounds may facilitate social interactions and mating opportunities among individuals from genetically distinct breeding origins (Quillfeldt et al. Reference Quillfeldt, Moodley, Weimerskirch, Cherel, Delord and Phillips2017). In contrast to species whose migratory flyways are delineated by strong migratory divides – barriers that can promote reproductive isolation and genetic divergence – species with weaker migratory connectivity tend to exhibit higher gene flow and allele sharing across breeding populations. As a consequence, genetic differentiation is often reduced, resulting in weak or undetectable population structure (Medina et al. Reference Medina, Thornlow, Nielsen and Corbett-Detig2018; Slatkin Reference Slatkin1987). Schumm et al. (Reference Schumm, Metzger, Neuling, Austad, Galea and Barbara2021) documented notable variation in migratory behaviour among Turtle-doves, including different autumn migratory routes for individuals sharing a common breeding site and arriving at a different wintering site. Additionally, the study reported prolonged stop-overs during spring migration and the convergence of individuals from shared wintering grounds to the same breeding sites. Therefore, the migratory divides among the south-western, central, and eastern flyways, as inferred from ringing data (Dimaki and Alivizatos Reference Dimaki and Alivizatos2015; Marx et al. Reference Marx, Korner-Nievergelt and Quillfeldt2016) do not seem to act as effective barriers to gene flow. As a result, they are unlikely to promote sufficient reproductive isolation to underpin genetic differentiation among European Turtle-dove populations or to promote subspecific divergence – particularly given that both putative subspecies share the same migratory (south-western) flyway. This aligns with ecological studies that have found no significant differences (high overlap) in the realised ecological niches of the two putative subspecies across their respective ranges in Spain and Morocco (Tellería et al. Reference Tellería, Carbonell, Fandos, Tena, Onrubia and Qninba2020).
Limitations and future research
First, while mtDNA allowed us to compare our results with previous research (Calderón et al. Reference Calderón, Campagna, Wilke, Lormée, Eraud and Dunn2016; Prakas et al. Reference Prakas, Butkauskas, Švažas, Bea, Yanenko and Ragauskas2021), the inclusion of nuclear markers – or ideally, complete genomic data – might enrich future work, offering a more comprehensive and balanced view of population structure, gene flow, and the evolutionary history of the species. Although mtDNA provides valuable information on historical lineage divergence, it represents only the maternal lineage and may not capture finer-scale population structure detectable with biparentally inherited nuclear markers. Explicitly acknowledging this limitation, we emphasise that future genomic data will be essential to confirm whether the lack of differentiation observed here is consistent across the nuclear genome.
Second, one of the main characteristics historically used to distinguish S. t. arenicola is its paler plumage compared with the nominate form (Hartert Reference Hartert1894). Our study did not assess plumage coloration, and we acknowledge this could be a limitation that should be addressed in future work. Furthermore, considering the absence of both genetic and morphometric differentiation in our data, we argue that coloration alone does not provide a sufficient basis to support the recognition of a distinct subspecies. While plumage coloration can inform subspecies delineation (Doucet et al. Reference Doucet, Shawkey, Rathburn, Mays and Montgomerie2004; Paxton et al. Reference Paxton2009, Reference Paxton, Sogge, Koronkiewicz, McLeod and Theimer2010), it must meet stringent criteria of diagnosability and consistency and should preferably be supported by additional data to ensure taxonomic validity (Remsen Jr Reference Remsen2010; Tobias et al. Reference Tobias, Seddon, Spottiswoode, Pilgrim, Fishpool and Collar2010). Beyond morphology and mtDNA, other ecological and behavioural aspects could also be examined when evaluating subspecies boundaries, such as habitat selection, movement strategies (e.g. migratory vs sedentary behaviour; Uy et al. Reference Uy, Irwin and Webster2018; Ruegg et al. Reference Ruegg, Anderson, Boone, Pouls and Smith2014), or vocal behaviour (Päckert et al. Reference Päckert, Martens, Eck, Nazarenko, Valchuk and Petri2005; Slabbekoorn and Smith Reference Slabbekoorn and Smith2002), as these may reveal ecological divergence potentially relevant to subspecies designation.
Our conclusions should be interpreted within the spatial and evidential scope of this study, which focused on breeding populations from Spain and Morocco, representing the main western Mediterranean range of the species, and examined morphometric and mitochondrial DNA data. While these two lines of evidence directly address the traditional, morphology-based definition of S. t. turtur and S. t. arenicola, they do not encompass the full range of potential factors of divergence. Moreover, additional sampling from other parts of the western Mediterranean, such as Algeria, would help to verify whether the patterns observed between Spanish and Moroccan populations are consistent across the region. Moreover, broader approaches, combining coloration, genomic, and key ecological aspects, will be essential to fully evaluate whether any consistent differentiation exists between the putative subspecies.
Conservation implications
From a conservation perspective, the European Turtle-dove is listed as globally threatened (BirdLife International 2022) and has traditionally been hunted across Spain and North Africa for centuries (Irby Reference Irby1875). Beyond the phylogeographical and taxonomic implications, our findings carry important consequences for both conservation and hunting management in the western flyway population. In particular, the genetic homogeneity observed suggests that Turtle-doves hunted in Morocco likely belong to the same genetic population as those breeding in Spain. This challenges the validity of managing these populations as distinct subspecies. Accurate subspecies delimitation is crucial for effective conservation planning, as misclassifying populations may lead to misguided or inefficient management actions. If S. t. turtur and S. t. arenicola represent a single, genetically cohesive unit, conservation strategies should prioritise maintaining gene flow and habitat connectivity across the species’ full range, rather than focusing on geographically defined units unsupported by genetic or ecological evidence. Our findings highlight the importance of increasing knowledge about Turtle-dove populations in North Africa, especially in Morocco, where, to our knowledge, there is no available information on population status and trends. Furthermore, the coordinated approach implemented until now for species management and conservation should be extended to include Moroccan populations, emphasising the need for more transboundary approaches that also include non-European countries. This is essential due to the genetic continuity across regions and to ensure that management actions reflect the biological unity of the species.
This issue is not unique to the Turtle-dove. Extensive research across birds and other taxa has shown that while morphological subspecies sometimes align with evolutionary units defined by molecular data (Lautenbach et al. Reference Lautenbach, Gregory, Galla, Pratt, Schroeder and Beck2025), in many cases they do not (Braby et al. Reference Braby, Eastwood and Murray2012; Phillimore and Owens Reference Phillimore and Owens2006). The ‘subspecies inflation phenomenon’ is particularly problematic in conservation, where legal frameworks often rely on unclear intraspecific taxonomy. These classifications, which frequently rely on outdated taxonomies based solely on morphological traits, are rarely re-evaluated, even when they are used to guide the selection of conservation targets (Berrilli et al. Reference Berrilli, Gambioli, Bombi, Garzia, Muraro and Pardo2024; Gippoliti and Amori Reference Gippoliti and Amori2007). Although the growing availability of genomic data has helped reduce the over-recognition of subspecies, there is still debate over which classifications – based on a combination of morphological and genetic evidence – are most appropriate and useful for conservation planning (Molinari Reference Molinari2023). Summarising, despite the abundance of intraspecific names that have helped guide conservation efforts in the past, there is increasing evidence that many of them seldom serve as reliable indicators for conservation units. Instead, we argue that the most effective approach to define conservation targets lies in the integration of phenotypic, ecological, and population genomic data. As genomic resources become increasingly available for non-model organisms (Formenti et al. Reference Formenti, Theissinger, Fernandes, Bista, Bombarely and Bleidorn2022; Schell et al. Reference Schell, Greve and Podsiadlowski2025), this integrative framework is becoming both more feasible and more widely applicable across taxa.
Conclusions
Taken together, our results provide no compelling genetic or morphological evidence to support the taxonomic separation of S. t. turtur and S. t. arenicola as distinct in the western Mediterranean region. The observed genetic homogeneity, likely resulting from on-going gene flow and past population expansion, challenges the validity of the subspecific categorisation under current criteria. Similarly, available evidence on the ecological niches of the two subspecies reveals no significant differences, while migratory flyway studies indicate weak migratory connectivity.
Supplementary material
The supplementary material for this article can be found at http://doi.org/10.1017/S0959270926100525.
Acknowledgements
We thank all the field technicians who have captured and collected samples of the Turtle-doves: Lara Abascal Fernández, Guillem Alfocea, Roberto Bustamante Rodríguez, Sergi Caules, Mario Fernandez Tizón, Lluriac Ferrer, Borja Pérez González, Sara Puche, Juan Lorente Rejano, Helena Navalpotro, Carlos Santisteban, Adrià Verger, Santiago Catchot, Rafael Villalonga, José Francisco Lima, and Roxana Triguero. We thank Alba García Ladrón de Guevara for laboratory help. This study was partially funded by Fundación Zoo de Barcelona grant and by Research Projects: ref. 022-GRIN-34462 awarded by the University of Castilla-La Mancha & Fondo Europeo de Desarrollo Regional (FEDER) and ref. PIE-202230E022 “GenEcol: estudios genéticos en poblaciones naturales” (CSIC-IREC). We also thank the scientific-technical service ‘Servicio de Ecología Molecular’ (ref. 823975) at IREC (CSIC) for providing laboratory resources, instrumentation, and reagents, as well as for funding the genetic analysis of a part of the samples. JCD and LMZ were supported by a Margarita Salas fellowship funded by European Union-NextGenerationEU, Ministry of Universities and Recovery, Transformation and Resilience Plan, through a call from Castilla-La Mancha University.
Author contributions
JCD, GB, JTG, BA, and LMZ conceived the study. GB, JTG, BA, SH, RE, FSP, AI, and LMZ collected samples. JCD performed the laboratory work and analysed genetic data. LMZ analysed morphometric data. JCD and LMZ led the writing, and the rest of authors contributed to editing and reviewing the manuscript.