


I. INTRODUCTION
Powder diffraction has become an indispensable tool in materials characterization owing to its wide variety of applications, from materials identification, quantification, and structure elucidation to texture analysis. Powder X-ray diffraction (PXRD) is one of the most widely used techniques in solid-state materials research, as the PXRD pattern is often considered a fingerprint of the material under study. PXRD is a vital characterization tool for phases where growing a single crystal is difficult or not attainable in practice or the phase of interest is an one member of a mixture of two or more polycrystalline materials.
The origin of the method for identifying the phase(s) present in a given sample using X-ray diffraction dates back to 1938 (Hanawalt et al., Reference Hanawalt, Rinn and Frevel1938). In this paper, using approximately a thousand PXRD patterns of crystalline phases, the authors presented a technique for identifying phases leading to the genesis of phase identification (Phase ID) using PXRD. The method, popularly known as Hanawalt search involves developing an index using the 3 strongest lines (peaks) of a diffraction pattern and grouping them into 77 subdivisions (Hanawalt et al., Reference Hanawalt, Rinn and Frevel1938; Hanawalt, Reference Hanawalt1986). Strong PXRD lines of the unknown phases can be compared against the Hanawalt index to identify the phase. The importance of diffraction information was central to forming the Joint Committee for Chemical Analysis by Powder Diffraction Methods in 1941, co-sponsored by ASTM Committee E-4, the Crystallographic Society of America, and the British Institute of Physics (Faber and Fawcett, Reference Faber and Fawcett2002). The first powder diffraction database collection was published in 1941 as Set 1 of the Powder Diffraction File (PDF) (Faber and Fawcett, Reference Faber and Fawcett2002). By 1969, the ASTM Committee was constituted as a Pennsylvania nonprofit cooperation under the title of the Joint Committee on Powder Diffraction Standards (JCPDS). In 1978, the current name, International Centre for Diffraction Data (ICDD), was adopted. A summary of the formative years of the PDF was subsequently summarized by Messick, Reference Messick2012. The PDF continues to be managed and maintained by the International Center for Diffraction Data (ICDD, www.icdd.com), a nonprofit scientific organization dedicated to collecting, editing, publishing, and distributing powder diffraction data to identify materials. The membership of the ICDD consists of worldwide representation from academe, government, and industry. This paper is an update of a previously published paper (Gates-Rector and Blanton, Reference Gates-Rector and Blanton2019) on the PDF®. In this paper, we attempt to focus on the recent changes to the PDF database and relational database software and to minimize the duplication of features that were presented in the Gates-Rector and Blanton paper of 2019.
II. DATABASE DEVELOPMENT: PDF
In Set 1 of the PDF published in 1941, powder diffraction data were published on a 3 in × 5 in paper card (Figure 1(a)) listing interplanar spacings (d spacings) and relative intensities (I/I 0) characteristic of the compound (Jenkins et al., Reference Jenkins, Holomany and Wong-Ng1987). The original handwritten index book by Hanawalt et al. (Reference Hanawalt, Rinn and Frevel1938) is shown in Figure 1(b). The first electronic version of PDF was introduced in the year 1967 in a flat file format enabling automated search/match (Johnson and Vand, Reference Johnson and Vand1967). This was the first electronic version of a crystallographic database. Over the years, ICDD has collaborated with various database organizations to expand the scope of materials coverage in the PDF to facilitate materials characterization using PXRD. A collaborative project with the National Bureau of Standards was started in 1953 and lasted more than 30 years (Wong-Ng et al., Reference Wong-Ng, McMurdie, Hubbard and Mighell2001). The growth of the PDF since its inception in 1941 to 2023 is shown in Figure 2. As seen in Figure 2, data spikes in the years 1998, 2002, and 2005 are due to the onset of collaborations with ICSD (Inorganic Crystal Structure Data, FIZ Karlsruhe; Zagorac et al., Reference Zagorac, Müller, Ruehl, Zagorac and Rehme2019), CSD (Cambridge Structural Data, Cambridge Crystallographic Data Centre; Groom et al., Reference Groom, Bruno, Lightfoot and Ward2016; Bruno et al., Reference Bruno, Gražulis, Helliwell, Kabekkodu, McMahon and Westbrook2017), and LPF (Linus Pauling File, Materials Phases Data System; Villars and Cenzual, Reference Villars and Cenzual2018) respectively. ICDD has responded to the growing need for database requirements in materials characterization using powder X-ray diffraction by implementing a unique project targeting data acquisition, including raw data, and customized subfiles. The ICDD has a Grant-in-Aid program to acquire diffraction data on targeted materials and information about this grant is available on the ICDD website (https://www.icdd.com/grant-in-aid/).
(a) Early PDF card and (b) original Hanawalt numerical index book (courtesy dow chemical).

Growth of entries in the powder diffraction file (note: for a better clarity, only selected years during the period 1941–1993 are shown to illustrate the trend).

The data management system for the PDF underwent a significant change in 2005 by adopting a relational database management system (RDBMS). The PDF in relational database format (RDB) contains extensive chemical, physical, bibliographic, and crystallographic data, including atomic coordinates enabling characterization and computational analysis. The RDB construct provides pliable access to the database for data mining studies and enhances the PDF materials characterization capabilities (Faber and Fawcett, Reference Faber and Fawcett2002; Kabekkodu et al., Reference Kabekkodu, Faber and Fawcett2002). One of the profound benefits of RDB is the more straightforward implementation of FAIR (Findability, Accessibility, Interoperability, and Reusability) principles (Wilkinson et al., Reference Wilkinson, Dumontier, Aalbersberg, Appleton, Axton, Baak and Blomberg2016) and better data interoperability. This type of construct is vital from an interoperability perspective, given the existence of multiple automated software routines (by various diffractometer manufacturers or software developers) used for phase identification and quantification.
Until the release of 2024, PDF database products were separated as PDF-4+ and PDF-4/Organics to focus on inorganic and organic phase identifications. With the growing number of crossover entries involving both inorganic and organic phases, the community using the PDF more often need both the inorganic and organic PDF content to successfully complete a characterization of the phases in the sample. To meet this growing challenge the new PDF-5+ combines the former inorganic and organic files into one single database containing 1 061 898 entries. There are many useful database filters (Figure 3, labels 1, 2, and 3) to optimize search mechanisms. In other words, if a user desires, it can mimic the function of PDF-4+ or PDF-4/Organics.
PDF-5+ tool bar with descriptions listed in Table I.

PDF-5+ tool bar descriptions.

III. DATA CURATION
In phase identification or related characterizations, a user's powder pattern is compared against the database. A well-curated database is essential for such analysis to be efficient and reliable. In addition to diffraction patterns and crystallographic parameters, metadata curation plays a vital role in phase identification as one tries to associate all the peaks in a measured diffraction pattern with one or multiple entries in PDF-5+ database phase. Figure 4 depicts a general overview of the curated data in the PDF. Many of the metadata in Figure 4 are self-explanatory; the following section will briefly describe some key features in phase identification and data mining studies. All of these data fields can be searched, and multiple searches can be combined using Boolean operators to expedite search/match and data mining studies.
General overview of curated data in the powder diffraction file.

A. Quality mark and database status
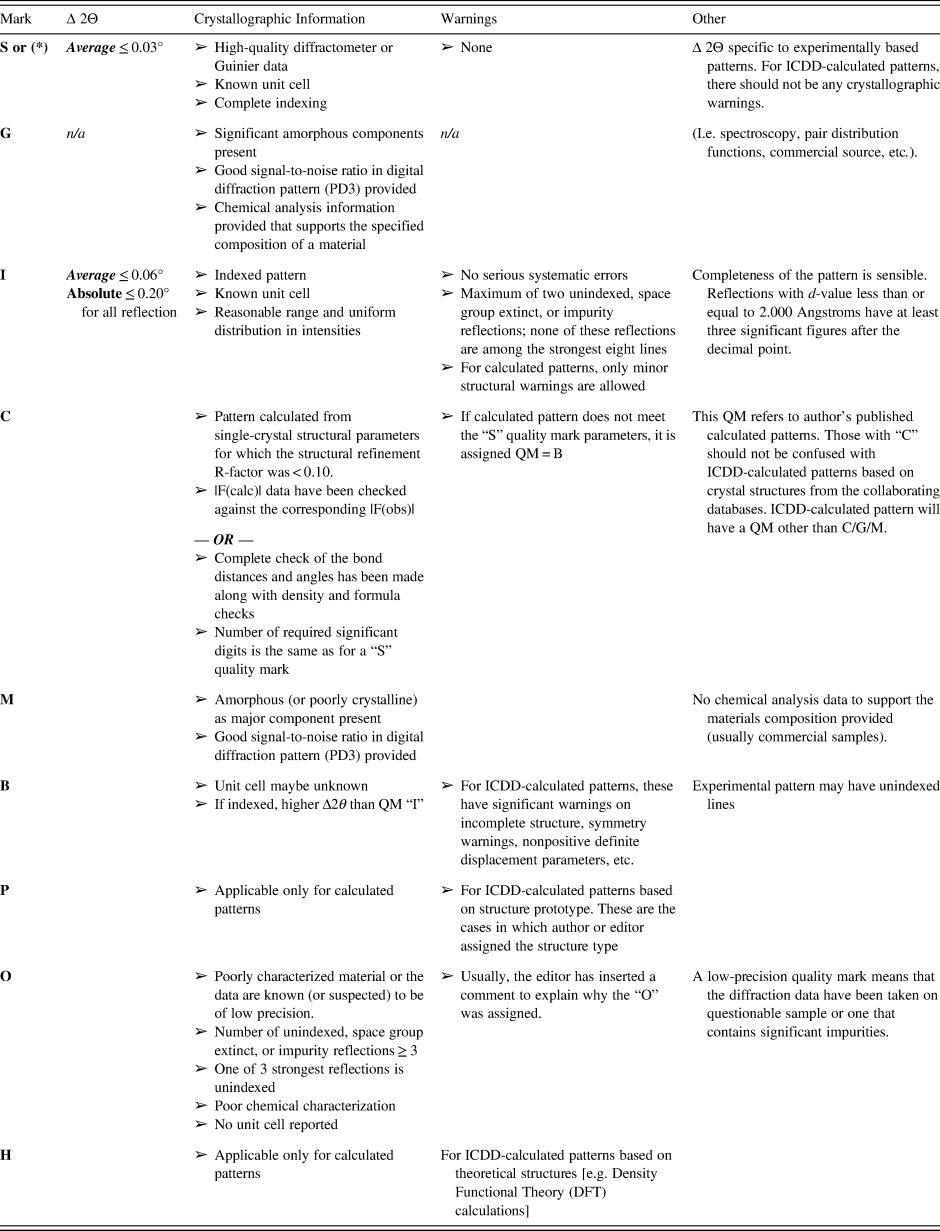
The ICDD PDF is a curated database with each entry evaluated using a combination of computer and human editorial review and presented using a quality mark (QM) nomenclature (Hubbard et al., Reference Hubbard, Stalick and Mighell1980; Jenkins and Smith, Reference Jenkins, Smith, Allen, Bergerhoff and Sievers1987; Bruno et al., Reference Bruno, Gražulis, Helliwell, Kabekkodu, McMahon and Westbrook2017; Gates-Rector and Blanton, Reference Gates-Rector and Blanton2019; Kaduk, Reference Kaduk, Gilmore and Schenk2019) that provides the user with a systematic process for understanding data entry quality and a consistent approach in assessing the goodness-of-match (GOM) for phase identification. All of the data in the PDF has gone through a multi-tier editorial process. The ICDD quality management system is certified by the International Organization for Standardization (ISO 9001:2015, Certificate Number: 110409.01). Figure 5 briefly summarizes the QM evaluation criteria that are checked by computer routines and then reviewed by one of the PDF editors before the QM is assigned.
A schematic view of the quality mark (QM) assignment process. The top row corresponds to the breadth of checks while the second row of boxes provide an outline of the checks that are made. The assigned QM indicates high-quality (QM = * or G), medium-quality (QM = I, C, P, or M), low-quality (QM = B or O), or hypothetical (QM = H) patterns.

Every entry in the PDF has an editorially assigned QM. An editorial comment will describe the reason an entry does not meet the top-quality mark. The PDF has two types of PXRD patterns, experimental and calculated from published crystal structures. QM assignment considers them separately after going through more than 100 data validation checks as shown in Figure 5. It is important to note here that the QM assignment is strictly from the phase identification point of view. For example, PXRD calculated patterns using crystal structure data with missing atom(s), disorder, improper site occupation factor, or questionable displacement parameters can have a significant impact on phase identification and thus would have a lower QM. Experimental PXRD patterns require a different type of treatment by considering phase purity, quality of the diffraction pattern, and indexing. QMs G and M are applicable only for poorly crystalline, nano material, and amorphous patterns. In this case, QM criteria emphasizes the chemical, data quality, and other characterizations (spectroscopy, pair distribution function, and microscopy). Table II describes the QMs used in the PDF.
Major criteria for PDF quality mark assignment.
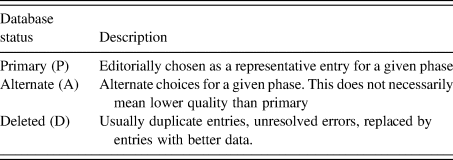
It is common in chemical crystallographic databases to have multiple entries for a given phase, especially in the case of widely studied structures. The PDF uses the Database Status flag to categorize multiple entries as Primary, Alternate, or Deleted. Table III describes the meaning of these notations. The combination of quality marks with database status is extremely useful as a filter in searching the database, especially in cases where several entries exist for a given phase. For example, in release 2024 of the PDF, there are 77 quartz patterns, but if one uses the primary star quality pattern as a filter, the search result set will have one pattern.
Description of database status.
B. Raw data archival
The interest in depositing to an archive the raw data associated with the reporting in a journal article has many positive aspects. First, is then data centers can retrieve the raw data and if desired archive it in a database. The IUCr has been promoting this initiative as has ICDD for many years. The review paper aptly titled Science in the Data (Helliwell et al., Reference Helliwell, McMahon, Mitchell Guss and Kroon-Batenburg2017 and references therein) elegantly encapsulates the need for raw data in crystallography. The challenges in archiving raw powder diffraction patterns are manifold due to phase impurities, data collection strategies, diffractometer geometry, sample preparation, systematic errors, and preferred orientation. In a traditional search/match algorithm, the user's d-I pairs are compared against the database (Fawcett et al., Reference Fawcett, Kabekkodu, Blanton and Blanton2017, Reference Fawcett, Gates-Rector, Gindhart, Rost, Kabekkodu, Blanton and Blanton2020), which works well for crystalline phases due to their sharp (narrow) peaks. It is evident from Figure 6 that having raw data is essential to carry out phase identification in the case of poorly crystalline or amorphous patterns as they cannot be represented satisfactorily as a list of interplanar spacing (d values) and relative intensity (I values) due to broad peaks containing several d values. Matching the raw data using a similarity index (Hofmann and Kuleshova, Reference Hofmann and Kuleshova2005) is one of the best methods to perform search/match, particularly for cases where diffraction peaks are broad.
PXRD pattern of cellulose triacetate I with reported peak positions PDF entry 00-064-1453.

As of release 2024, more than 19,000 raw powder diffraction patterns (1D) in the PDF are available for users to analyze powder diffraction data. In an extended application, the crystal structure of Trandolapril was solved (Reid et al., Reference Reid, Kaduk and Vickers2016) using deposited raw data from the PDF. There is a growing number of examples where raw data is essential in characterizing pharmaceutical samples (Fawcett et al., Reference Fawcett, Gates-Rector, Gindhart, Rost, Kabekkodu, Blanton and Blanton2019) and polymers (Gates et al., Reference Gates, Blanton and Fawcett2014).
C. Structural classifications
Structural classifications (Figure 7) play a seminal role in validating the quality of the published structure or powder diffraction patterns. It is an excellent tool for identifying similar phases that are otherwise not easily recognizable. It is also a good editorial tool to identify outliers in a supposedly related phase in a cluster. From the application point of view, structure prototypes are extremely useful in deriving a starting model for Rietveld refinement when the database is missing the exact chemistry [i.e. element(s)]. ICDD uses several structural classification symbols to meet the requirements of scientists from various fields who use X-ray diffraction for materials characterization. Each of these has a specific usage in structural chemistry. The structural classifications currently used in the PDF are listed below.
a. Traditional structure type notation is based on standardized unit cell, axial ratios, space group, Pearson symbol code (Pearson, Reference Pearson1967), and chemistry (Wallace et al., Reference Wallace, Weissmanna, Mueller, Calveit and Jenkins1994). These descriptors are usually assigned manually, for example, the CaF2 type structure. They are helpful in comparisons of phase-diagrams of systems that are expected to be similar (for example, Pb–Pu vs Pu–Sn) (Wallace et al., Reference Wallace, Weissmanna, Mueller, Calveit and Jenkins1994), axial ratios and lattice parameters, which are extremely useful in controlling the quality of the database entries.
b. ANX type is based on the type of ion and site occupancy. For example, CaTiO3 is of ABX3 type and Fe3O4 is of AB2X4 type.
c. Structure prototyping is based on the standardization method described by Gelato and Parthé, Reference Gelato and Parthé1987, followed by a detailed crystallographic analysis of the atomic environment (Villars et al., Reference Villars, Onodera and Iwata1998; Allmann and Hinek, Reference Allmann and Hinek2007). For example, Cu3As,cI64,220 (structure type formula, Pearson symbol code, space group number). Standardization is crucial in maintaining the quality of the crystallographic data as some structures with the same space group and Pearson symbol code were erroneously considered as isotypic because their reported unit cell parameters are similar (Allmann and Hinek, Reference Allmann and Hinek2007).
d. Zeolite classification is based on framework type (Baerlocher et al., Reference Baerlocher, McCusker, Olson and Meier2007). These are usually noted by a three-capital letter code describing a network of corner-sharing tetrahedrally coordinated framework atoms. The International Zeolite Association (IZA) publishes these codes and the codes are listed on their website (https://america.iza-structure.org/IZA-SC/ftc_table.php)
e. Mineral classification is based on the crystal chemistry characteristics (Smith et al., Reference Smith, Bayliss and Roberts1997). The classification aims to exploit the crystal chemistry characteristics and similarity of the powder diffraction pattern among isostructural group members to enhance the quality of the mineral phases in the PDF.
f. Topology: Unlike geometrical analysis, topological analysis provides a tool to use crystallographic data and explore the topological structure and the similarities in the crystal space (Blatov et al., Reference Blatov, Shevchenko and Proserpio2014). From the database point of view, it is advantageous to look for isostructural or isoreticular series. Topological analyses can also be used to improve the quality of the database.
Structural classifications in the powder diffraction file.

D. Subfiles
In phase identification, there are possibilities of having false positives due to similarity in diffraction patterns, often the case with isostructural entries. For example, with space group  $Fm\bar{3}m$ and a = 5.39(2) Å, there are 577 entries in release 2024. Subfiles, a curated category based on chemistry, properties, or application, efficiently reduce the occurrence of such false positives. For example, a user interested in mineral analysis can limit their search/match to only minerals to eliminate unwanted result sets. To ensure the subfiles quality, field experts continuously review the subfiles. These experts are usually members of a designated ICDD Subcommittee (https://www.icdd.com/technical-subcommittees/).
IV. THE PDF ENTRY
As shown in Figure 3, the exponential growth of PDF has long made it difficult to publish data in printed book format along with a digital version. The last printed book format was set 67 which was Release 2017. However, the historical nomenclature of cards still exists, and PDF entries are still referred to as PDF cards. These entries are identified by a numbering system AA-BBB-XXXX implemented in the PDF in 2003. The first two digits (AA) identify the data source: 00 = ICDD; 01 = ICSD (Inorganic Crystal Structure Database); 02 = CSD (Cambridge Structural Database); 03 = NIST (National Institute of Standards and Technology); 04 = LPF (Linus Pauling File); and 05 = ICDD (abstracted crystal data, including modulated structures). The remaining part, BBB-XXXX, corresponds to set and pattern numbers, respectively. The mineral Kaliophilite (Entry 00-071-0879) is used as an example in Figure 8 to illustrate a PDF entry.

Contents of a PDF entry.

Details for fields on the “PDF” supplemental information tab (Tab A in Figure 8).

Within a PDF entry, there are different types of data content and simulation features to explore, and these are summarized in Figures 9 and 10. In addition to these features, PDF-5+ offers JADE toolkit extensions and these can be launched from a PDF entry as shown in Figure 11.
Overview of PDF entry data content.

Simulation features on a PDF entry.

Launching JADE toolkit extension from a PDF entry using the dropdown arrow next to 3D structure, bonds, SAED pattern, and EBSD pattern icons. The PDF number of the entry used in each example is within parenthesis.

A. Bravais–Friedel–Donnay–Harker (BFDH)
This toolkit is for crystal morphology prediction. The BFDH model is based on the lattice geometry and symmetry and was proposed by Bravais, Friedel, Donnay, and Harker (Donnay and Harker, Reference Donnay and Harker1937). This model assumes that the energetically most stable and slowest growing faces are the ones with the highest density and largest spacing between adjacent layers and that the rate of growth of a particular surface is inversely proportional to the interplanar d spacing (D ~ 1/d). One can also choose methods for supersaturation/rapid growth with D ~ Exp(−kd) (Dowty, Reference Dowty1976). Users can change the value of k if needed to obtain the growth rate curve (k is inversely proportional to the supersaturation). As an illustration, Figure 12 shows the correctly predicted (confirmed by the comment under “habit” on the PDF card) needle morphology using this BFDH module for a pharmaceutical PDF entry Eupatorin (PDF# 02-076-2266). The BFDH module can also be used to predict possible preferred orientations.
Crystal morphology prediction of Eupatorin (PDF# 02-076-2266) using the BFDH extension.

B. Selected aerea electron diffraction (SAED)
This module simulates SAED (Goehner and Michael, Reference Goehner and Michael1996) and offers a feature to import SAED images for comparison. The SAED extension feature offers kinematic simulations based on the crystal structure, SAED image import, processing, measurement tools, and grid indexing. This module offers powerful graphical features like synchronized structure viewing (Vector Graphics) and stereographic projections on a Wulff net. One of the strong features of this module is searching PDF-5+ database for 2D cells using an imported SAED image.
C. Electron back scattering diffraction
This simulation tool displays backscattered electron Kikuchi patterns (Goehner and Michael, Reference Goehner and Michael1996). The EBSD toolkit extension provides an interactive mode of displaying k-patterns (Kikuchi or Kossel) and their corresponding stereographic projections.
D. Bond histogram
The bond histogram module can be used to see the bond length distribution for a user-defined pair of atoms. Figure 13 shows the Al–O bond length distribution using 8180 PDF-5+ entries with Al–O bonds. It is clear from the histogram that the distribution is bimodal corresponding to tetrahedral and octahedral coordination. This module also has a feature to filter by coordination number. This information is useful in crystal structure validation as well as in setting up bond length restraints during Rietveld refinements.
Al–O bond length histogram generated using crystal structures in PDF-5+ with Al–O bonds.

The PDF-5+ database also comes with integrated data mining features and a search/match program (SIeve+) for phase identification. The recent development among many in SIeve+ is the capability of performing phase identification using 2D diffraction images/data (supports several formats). SIeve+ can process, integrate, and perform search/match seamlessly using 2D diffraction image/data as shown in Figure 14. One of the most used features of SIeve+ is quantitative phase analysis using Reference Intensity Ratio method (Hubbard and Snyder, Reference Hubbard and Snyder1988).
Example of phase identification using 2D diffraction data.

PDF-5+ has an extensive data mining capability facilitated with 137 display fields coupled with 83 searches. A very important distinction of PDF-5+ 2024 is that out of 1,061,800+ entries, 586 700+ entries have atomic coordinates to enable quantitative phase analysis using the Rietveld method. ICDD's PDF goes through the continuous addition of significant data and classifications each year and it is important in any research or analytical laboratory to have the most up-to-date database.
V. AVAILABILITY
ICDD offers various database products at different levels to meet user's requirements. Product summaries, licensing info, and operating specifications for each member of the PDF product line are available on the ICDD website (www.icdd.com).
Over the years, ICDD has been closely collaborating with licensed software developers, including equipment manufacturers and independent developers, and works diligently to cultivate commercial data analysis programs that work impeccably with our databases.
VI. CONCLUSION
Well-curated databases play a pivotal role in any successful material characterization or any data-driven studies. The exponential growth and interest in data-driven research based on machine learning (ML) and artificial intelligence (AI) make it critical to have a database one would trust. ICDD, a nonprofit scientific organization founded by scientists has responded to the growing need for database requirements in materials characterization by providing a curated, quality database, the PDF. The advances in computer speed and digital storage media size and retrieval speed have enabled combining the PDF inorganic and organic subfiles into a comprehensive database product PDF-5+ designated Release 2024.
ACKNOWLEDGEMENTS
Editing, curating, and producing a quality database and software requires a significant team effort by the ICDD staff, ICDD members and the ICDD Board of Directors. We thank hundreds of researchers and scientists who have contributed to the Powder Diffraction File and ICDD organization over the past 80+ years.


 Open access