


1. Introduction
Brown dwarfs are very low-mass objects (13–75 Jupiter mass) (Osorio et al. Reference Osorio, Béjar, Martn, Rebolo, Barrado y Navascués, Bailer-Jones and Mundt2000; Peña Ramírez et al. 2012; Martın et al. 2024) with an effective temperature lower than 2 500 K (Hainline et al. Reference Hainline2024b). Their mass range is between Jupiter and red dwarfs. Thus, they are vital to understanding the gap in mass function between stars and planets. Based on their spectral types, brown dwarfs are classified as L-dwarf ( $T_{\text{eff}} \sim $
1 300–2 000 K), T-dwarfs (
$T_{\text{eff}} \sim $
1 300–2 000 K), T-dwarfs ( $T_{\text{eff}} \sim $
700–1 300 K), and Y-dwarfs (
$T_{\text{eff}} \sim $
700–1 300 K), and Y-dwarfs ( $T_{\text{eff}} \lt $
700 K) (e.g. Kirkpatrick et al. Reference Kirkpatrick1999, Reference Kirkpatrick2021; Cushing et al. Reference Cushing2011; Hainline et al. Reference Hainline2024b). However, brown dwarfs younger than 200 Myr can have late-M spectral type (Rebolo et al. Reference Rebolo, Zapatero Osorio and Martn1995, Reference Rebolo, Martn, Basri, Marcy and Zapatero-Osorio1996). L dwarfs can be brown dwarfs or not, depending on their age (Martín et al. 1998, 1999). Due to the low effective temperature, brown dwarfs are faint in optical and bright in infrared (IR). During the past decades, hundreds of brown dwarfs have been found by all-sky infrared surveys (e.g. Yamamura et al. Reference Yamamura, Tsuji, Tanabé, Nakajima, Onaka, White, Nakagawa and Yamamura2009; Cushing et al. Reference Cushing2011; Kirkpatrick et al. Reference Kirkpatrick1999, Reference Kirkpatrick2021), whereas these brown dwarfs mainly were found near to (
$T_{\text{eff}} \lt $
700 K) (e.g. Kirkpatrick et al. Reference Kirkpatrick1999, Reference Kirkpatrick2021; Cushing et al. Reference Cushing2011; Hainline et al. Reference Hainline2024b). However, brown dwarfs younger than 200 Myr can have late-M spectral type (Rebolo et al. Reference Rebolo, Zapatero Osorio and Martn1995, Reference Rebolo, Martn, Basri, Marcy and Zapatero-Osorio1996). L dwarfs can be brown dwarfs or not, depending on their age (Martín et al. 1998, 1999). Due to the low effective temperature, brown dwarfs are faint in optical and bright in infrared (IR). During the past decades, hundreds of brown dwarfs have been found by all-sky infrared surveys (e.g. Yamamura et al. Reference Yamamura, Tsuji, Tanabé, Nakajima, Onaka, White, Nakagawa and Yamamura2009; Cushing et al. Reference Cushing2011; Kirkpatrick et al. Reference Kirkpatrick1999, Reference Kirkpatrick2021), whereas these brown dwarfs mainly were found near to ( $\sim$
20 pc) the Sun. Identifying more brown dwarfs at kiloparsec (kpc) distances helps investigate the mass function and extend its analysis to further reaches. This also offers a chance to comprehend the physical characteristics of distant brown dwarfs and their number density (Ryan & Reid Reference Ryan2016). However, owing to their low temperatures, brown dwarfs are very faint, making them difficult to detect at such distances with the previous IR space telescopes.
$\sim$
20 pc) the Sun. Identifying more brown dwarfs at kiloparsec (kpc) distances helps investigate the mass function and extend its analysis to further reaches. This also offers a chance to comprehend the physical characteristics of distant brown dwarfs and their number density (Ryan & Reid Reference Ryan2016). However, owing to their low temperatures, brown dwarfs are very faint, making them difficult to detect at such distances with the previous IR space telescopes.
The revolutionary James Webb Space Telescope (JWST, Gardner et al. Reference Gardner2006; Kalirai Reference Kalirai2018) is a state-of-the-art IR space telescope featuring a 6.5-m mirror (McElwain et al. Reference McElwain2023; Gardner et al. Reference Gardner2023) that offers remarkable sensitivity and spatial resolution. The utmost sensitivity of JWST enables the detection of extremely distant brown dwarfs in the galactic thick disk (e.g. Nonino et al. Reference Nonino2023; Wang et al. Reference Wang2023; Hainline et al. Reference Hainline2024b), which have never been seen with previous generation space telescopes such as AKARI and the Hubble Space Telescope (HST). The molecular absorption (H $_2$
O, CH
$_2$
O, CH $_4$
, NH
$_4$
, NH $_3$
, etc.) features of brown dwarfs at 1–5
$_3$
, etc.) features of brown dwarfs at 1–5 ${\unicode{x03BC}}$
m align with the bandwidth range of NIRCam, making it well-suited for identifying brown dwarfs. Since the launch of JWST, distant brown dwarfs have been found through JWST’s deep-field surveys, including the CEERS, JADES, and GOODS (e.g. Langeroodi & Jens Reference Langeroodi and Hjorth2023; Wang et al. Reference Wang2023; Nonino et al. Reference Nonino2023; Hainline et al. Reference Hainline2024b). Therefore, expanding our search to a much larger area, such as the COSMOS-Web survey field with four NIRCam filters, greatly increases our chance of discovering even more distant brown dwarfs.
${\unicode{x03BC}}$
m align with the bandwidth range of NIRCam, making it well-suited for identifying brown dwarfs. Since the launch of JWST, distant brown dwarfs have been found through JWST’s deep-field surveys, including the CEERS, JADES, and GOODS (e.g. Langeroodi & Jens Reference Langeroodi and Hjorth2023; Wang et al. Reference Wang2023; Nonino et al. Reference Nonino2023; Hainline et al. Reference Hainline2024b). Therefore, expanding our search to a much larger area, such as the COSMOS-Web survey field with four NIRCam filters, greatly increases our chance of discovering even more distant brown dwarfs.
In this work, we search for brown dwarf candidates in the COSMOS-Web field and show their best-fit temperature, surface gravity, and metallicity from the Spectral Energy Distribution (SED) fitting results. By finding more distant brown dwarfs in our Milky Way, we are able to probe the initial mass function of these low-mass stars and the star formation history in our Milky Way.
This paper is structured as follows. We describe the data and filters in Section 2, candidate selection and SED fitting in Section 3, results in Section 4, discussion of transverse velocity and number density in Section 5, and conclusions in Section 5.
2. Data
2.1 Images
The JWST Cosmic Evolution Survey (COSMOS-Web) survey (Casey et al. Reference Casey2023) spans 0.54 deg $^2$
in the COSMOS field (Scoville et al. Reference Scoville2007b) utilising the Near-Infrared Camera (NIRCam Rieke et al. Reference Rieke2023), making it the largest JWST survey field to date. The survey covered an area 18 times greater than the previous CEERS survey. Ryan & Reid (Reference Ryan2016) estimated that there are 21.4 T0-T5 dwarfs within the COSMOS-Web field, which is seven times more than those T0-T5 dwarfs found in the CEERS field (Hainline et al. Reference Hainline2024b). Thus, we search for brown dwarfs in the COSMOS-Web field and anticipate discovering numerous instances.
$^2$
in the COSMOS field (Scoville et al. Reference Scoville2007b) utilising the Near-Infrared Camera (NIRCam Rieke et al. Reference Rieke2023), making it the largest JWST survey field to date. The survey covered an area 18 times greater than the previous CEERS survey. Ryan & Reid (Reference Ryan2016) estimated that there are 21.4 T0-T5 dwarfs within the COSMOS-Web field, which is seven times more than those T0-T5 dwarfs found in the CEERS field (Hainline et al. Reference Hainline2024b). Thus, we search for brown dwarfs in the COSMOS-Web field and anticipate discovering numerous instances.
We download the NIRCam mosaic images of the data release 0.5 (DR0.5) from the COSMOS-Web website.Footnote
a
The DR0.5 includes observations carried out in April/May 2024 (observation numbers 043-048 and 078-153), spanning a total area of 0.27 deg $^{2}$
. The COSMOS-Web team (Franco et al. Reference Franco2023; Casey et al. Reference Casey2023) processed the raw image data using the JWST calibration pipeline v1.10.0 (Bushouse et al. Reference Bushouse2023). The data comprised ten smaller mosaic images of rectangular tiles (A1–A10) and were covered by four NIRCam filters: F115W, F150W, F277W, and F444W. Due to a possible file collapse, F444W was missing in the A8 field, resulting in an effective area of 0.243 deg
$^{2}$
. The COSMOS-Web team (Franco et al. Reference Franco2023; Casey et al. Reference Casey2023) processed the raw image data using the JWST calibration pipeline v1.10.0 (Bushouse et al. Reference Bushouse2023). The data comprised ten smaller mosaic images of rectangular tiles (A1–A10) and were covered by four NIRCam filters: F115W, F150W, F277W, and F444W. Due to a possible file collapse, F444W was missing in the A8 field, resulting in an effective area of 0.243 deg $^2$
. This survey area is still nine times larger than the early CEERS survey.
$^2$
. This survey area is still nine times larger than the early CEERS survey.
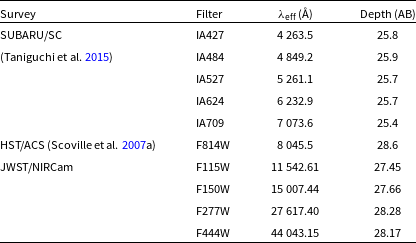
To increase the photometric data points of our candidates, we also check the images at six shorter wavelengths from HST/Advanced Camera for Surveys (ACS) (Koekemoer et al. Reference Koekemoer2007) and SUBARU/Suprime-Cam (SC) (Taniguchi et al. Reference Taniguchi2015) and cross-match our candidates with the COSMOS2020 catalogue. We utilise the cutout imagesFootnote
b
of filter F814W from HST/ACS, cutout images of filters IA427, IA484, IA527, IA624, and IA709 from SUBARU/SC to scrutinise the possible detection at shorter wavelengths. 3 $\sigma$
detection limits of SUBARU/SC filters and 5
$\sigma$
detection limits of SUBARU/SC filters and 5 $\sigma$
detection limits of the HST/ACS filter are listed in Table 1.
$\sigma$
detection limits of the HST/ACS filter are listed in Table 1.
Table of the filters used in this search and their depth. The depths of SUBARU/SC filters is 3 $\sigma$
. The depth of the HST/ACS F814W filter and JWST/NIRCam filters are 5
$\sigma$
. The depth of the HST/ACS F814W filter and JWST/NIRCam filters are 5 $\sigma$
.
$\sigma$
.
2.2 Photometry
We perform source extraction and photometry on JWST data with the photometry software SExtractor (Bertin & Arnouts Reference Bertin and Arnouts1996). The details of this process will be written in Wu et al. (in preparation). The 5 $\sigma$
detection limits and transmissions of four JWST/NIRCam filters are listed in Table 1 and Fig. 1.
$\sigma$
detection limits and transmissions of four JWST/NIRCam filters are listed in Table 1 and Fig. 1.
A brown dwarf model and transmission of NIRCam filters used in the COSMOS-Web survey. The black solid curve is the best-fit SED model for our brown dwarf candidate BD01. Coloured curves are transmission curves for four NIRCam filters. The dashed, dash-dotted, and dotted lines indicate the absorption region of H $_2$
O, CH
$_2$
O, CH $_4$
, and NH
$_4$
, and NH $_3$
.
$_3$
.

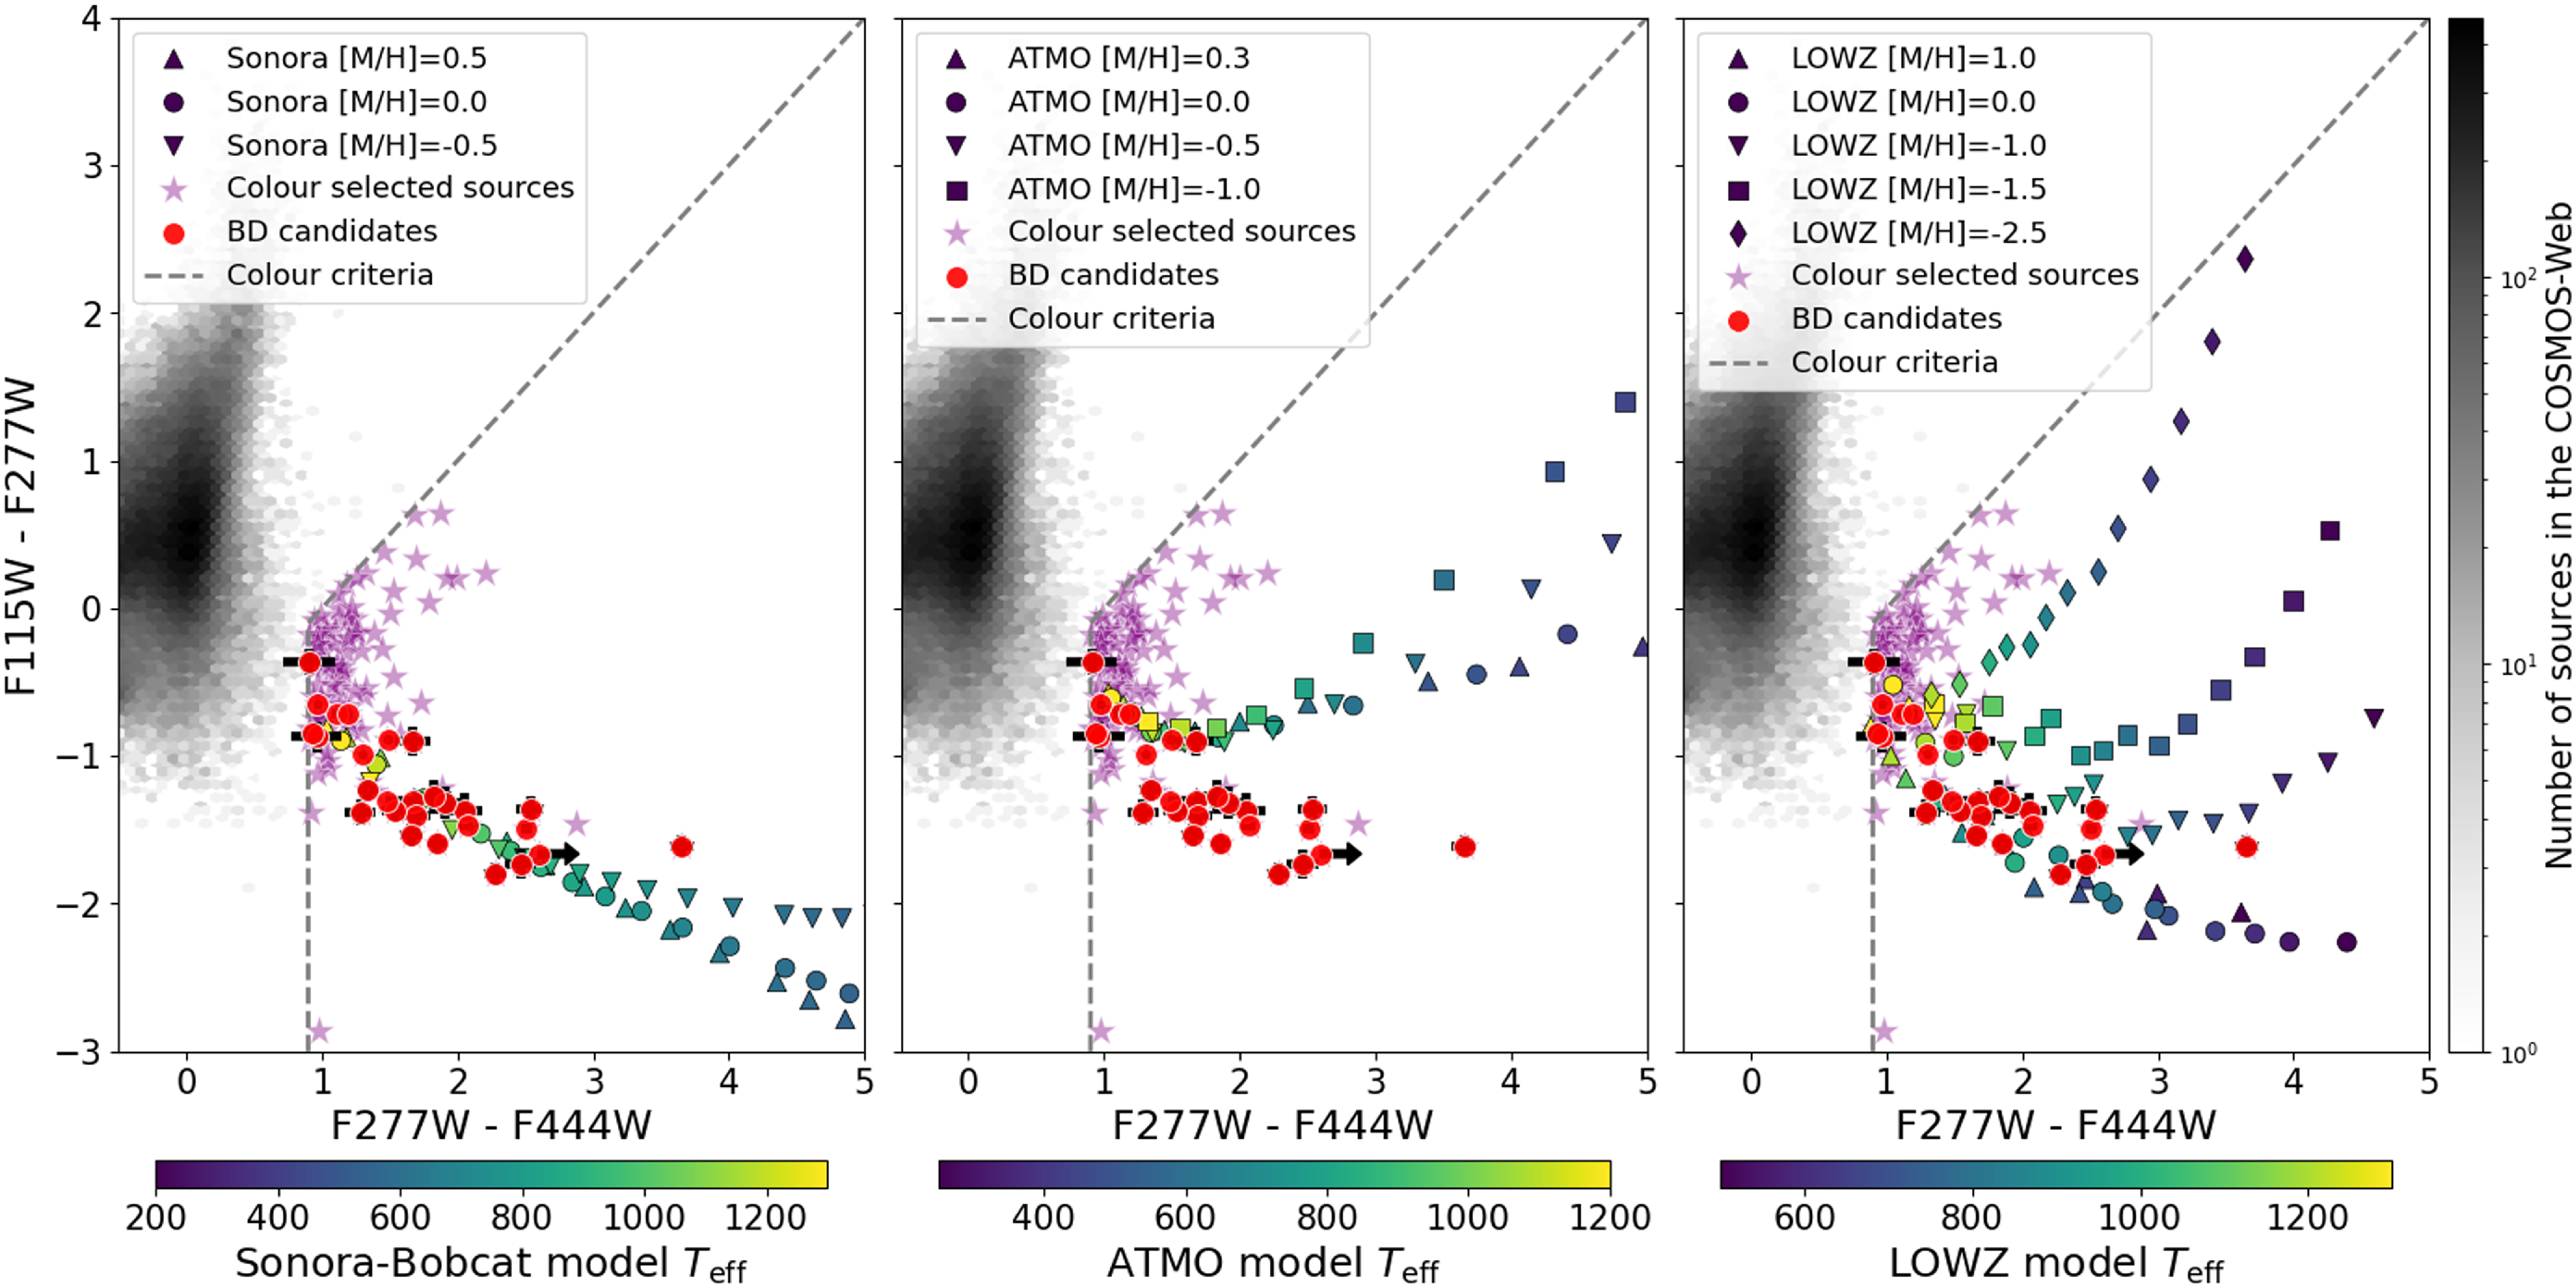
F277W-F444W vs F115W-F277W colour-colour plot. Grey hexagonal bins are all sources in the search area. Purple stars are sources selected by the colour criteria (Equations 1 and 2). Red circles with black error bars are 27 brown dwarf candidates. Black arrows show the non-detection in the F277W band. We plot the colours of Sonora-Bobcat, ATMO2020++, and LOWZ models in the left, middle, and right panels. Different markers represent different metallicities, and they are coloured by temperature. The surface gravity $\log{g}$
(cgs) is fixed at 4.5 for three models. C/O is fixed at 0.55 and
$\log{g}$
(cgs) is fixed at 4.5 for three models. C/O is fixed at 0.55 and $\log K_{zz}$
is fixed at 2 for LOWZ model.
$\log K_{zz}$
is fixed at 2 for LOWZ model.
3 Methods
3.1 Cross-match COSMOS-web catalogues
We compile a catalogue by cross-matching the catalogues of four JWST/NIRCam bands. Since brown dwarfs are brighter in the F444W band than in the F277W band, F444W is used as the detection band and cross-matched with the other three bands. We fit the separation of matched sources with the Gaussian distribution and use 5 $\sigma$
radii to merge F444W sources with sources from the other three bands.
$\sigma$
radii to merge F444W sources with sources from the other three bands.
5 $\sigma$
cross-matching radii are 0,043′′, 0,070′′, and
$\sigma$
cross-matching radii are 0,043′′, 0,070′′, and $0.080''$
for F444W detected sources merged with F277W, F150W, and F115W detected sources. We select brown dwarf candidates from this band-merged catalogue. There are 113 456 sources in this band-merged catalogue. During the cross-match process, 180 F444W detected sources matched with multiple F115W sources. We apply the same colour criteria to those 180 pairs, and one pair of sources passes through the criteria. This source was rejected because it is extended in F444W, so this multiple match does not affect our results.
$0.080''$
for F444W detected sources merged with F277W, F150W, and F115W detected sources. We select brown dwarf candidates from this band-merged catalogue. There are 113 456 sources in this band-merged catalogue. During the cross-match process, 180 F444W detected sources matched with multiple F115W sources. We apply the same colour criteria to those 180 pairs, and one pair of sources passes through the criteria. This source was rejected because it is extended in F444W, so this multiple match does not affect our results.
3.2 Colour criteria
Brown dwarfs exhibit prominent absorption near 2.7 ${\unicode{x03BC}}$
m due to water and methane molecules (Marley & Robinson Reference Marley and Robinson2015). These objects exhibit ‘V’-shaped SED and point-source morphology (Wang et al. Reference Wang2023; Hainline et al. Reference Hainline2024b). We use two colour criteria to select these ‘V’-shaped SED objects:
${\unicode{x03BC}}$
m due to water and methane molecules (Marley & Robinson Reference Marley and Robinson2015). These objects exhibit ‘V’-shaped SED and point-source morphology (Wang et al. Reference Wang2023; Hainline et al. Reference Hainline2024b). We use two colour criteria to select these ‘V’-shaped SED objects:
 \begin{align} \text{F115W}&-\text{F277W}+1 \lt \text{F277W}-\text{F444W} \end{align}
 \begin{align} &\text{F277W}-\text{F444W}\gt0.9\\[8pt]\nonumber \end{align}
These criteria are designed to capture the absorption feature of brown dwarfs cooler than 1 300 K, according to three brown dwarf models: Sonora-Bobcat (Marley et al. Reference Marley2021b), ATMO2020++ (Meisner et al. Reference Meisner, Leggett, Logsdon, Schneider, Tremblin and Phillips2023), and LOWZ (Meisner et al. Reference Meisner, Leggett, Logsdon, Schneider, Tremblin and Phillips2023). By utilising three distinct brown dwarf models, we aim to uncover diverse brown dwarfs in the thick disk and galactic halo. Distant brown dwarfs that belong to the thick disk or halo are expected to have subsolar metallicities (Hallakoun & Maoz Reference Hallakoun and Maoz2021; Meisner et al. Reference Meisner, Leggett, Logsdon, Schneider, Tremblin and Phillips2023). Recent spectroscopically confirmed brown dwarfs at kpc scales also show subsolar metallicities (Burgasser et al. Reference Burgasser2024; Hainline et al. Reference Hainline2024a). Therefore, we include ATMO2020++ and LOWZ models, which extend the metallicity down to $-1$
and
$-1$
and $-2.5$
dex.
$-2.5$
dex.
In Fig. 2, we present three colour-colour plots to show the colours of three models and brown dwarf candidates in the field we used. In the plot, we fix the surface gravity $\log{g}$
(cgs)
$\log{g}$
(cgs) $=4.5$
for all models and fix the carbon-to-oxygen (C/O) ratio 0.55, vertical eddy diffusion coefficient
$=4.5$
for all models and fix the carbon-to-oxygen (C/O) ratio 0.55, vertical eddy diffusion coefficient $\log K_{zz}=2$
for LOWZ model to avoid a cluttered image. Out of 113 456 sources, 120 sources pass these colour selections.
$\log K_{zz}=2$
for LOWZ model to avoid a cluttered image. Out of 113 456 sources, 120 sources pass these colour selections.
3.3 Selecting point sources
To differentiate galaxies from stars, Wang et al. (Reference Wang2023) utilised the CLASS_STAR parameter from the output of the SExtractor as a selection criterion. They selected sources with ${\tt CLASS\_STAR}\gt0.9$
as stars. We also apply the CLASS_STAR criteria but with a lower threshold of 0.86. We decide to lower the threshold since we find 2 moving sources that have CLASS_STAR
${\tt CLASS\_STAR}\gt0.9$
as stars. We also apply the CLASS_STAR criteria but with a lower threshold of 0.86. We decide to lower the threshold since we find 2 moving sources that have CLASS_STAR $\lt0.9$
in one band. BD27 is a moving source with
$\lt0.9$
in one band. BD27 is a moving source with ${\tt CLASS\_STAR_{F115W}}=0.09$
, and CLASS_STAR
${\tt CLASS\_STAR_{F115W}}=0.09$
, and CLASS_STAR $\gt0.94$
for the other three bands. It looks a little extended in F115W, so the
$\gt0.94$
for the other three bands. It looks a little extended in F115W, so the ${\tt CLASS\_STAR_{F115W}}$
is not high. We still include this source as it is a moving source with CLASS_STAR
${\tt CLASS\_STAR_{F115W}}$
is not high. We still include this source as it is a moving source with CLASS_STAR $\gt0.94$
in other bands. BD26 is another moving source with
$\gt0.94$
in other bands. BD26 is another moving source with ${\tt CLASS\_STAR_{F277W}}=0.86$
. BD26 is not extended in F277W, and CLASS_STAR
${\tt CLASS\_STAR_{F277W}}=0.86$
. BD26 is not extended in F277W, and CLASS_STAR $\gt0.99$
for the other three bands. Thus, we lower the criteria to find possible missing stars. If any band of a source meets the Equations 3–6, we remove that source.
$\gt0.99$
for the other three bands. Thus, we lower the criteria to find possible missing stars. If any band of a source meets the Equations 3–6, we remove that source.
 \begin{align} {\tt CLASS\_STAR_{F115W}}\lt0.86 \cap F115W\lt24.5 \end{align}
 \begin{align} {\tt CLASS\_STAR_{F150W}}\lt0.86 \cap F150W\lt25 \end{align}
 \begin{align} {\tt CLASS\_STAR_{F277W}}\lt0.86 \cap F277W\lt25 \end{align}
 \begin{align} {\tt CLASS\_STAR_{F444W}}\lt0.86 \cap F444W\lt24.5 \\[8pt]\nonumber\end{align}
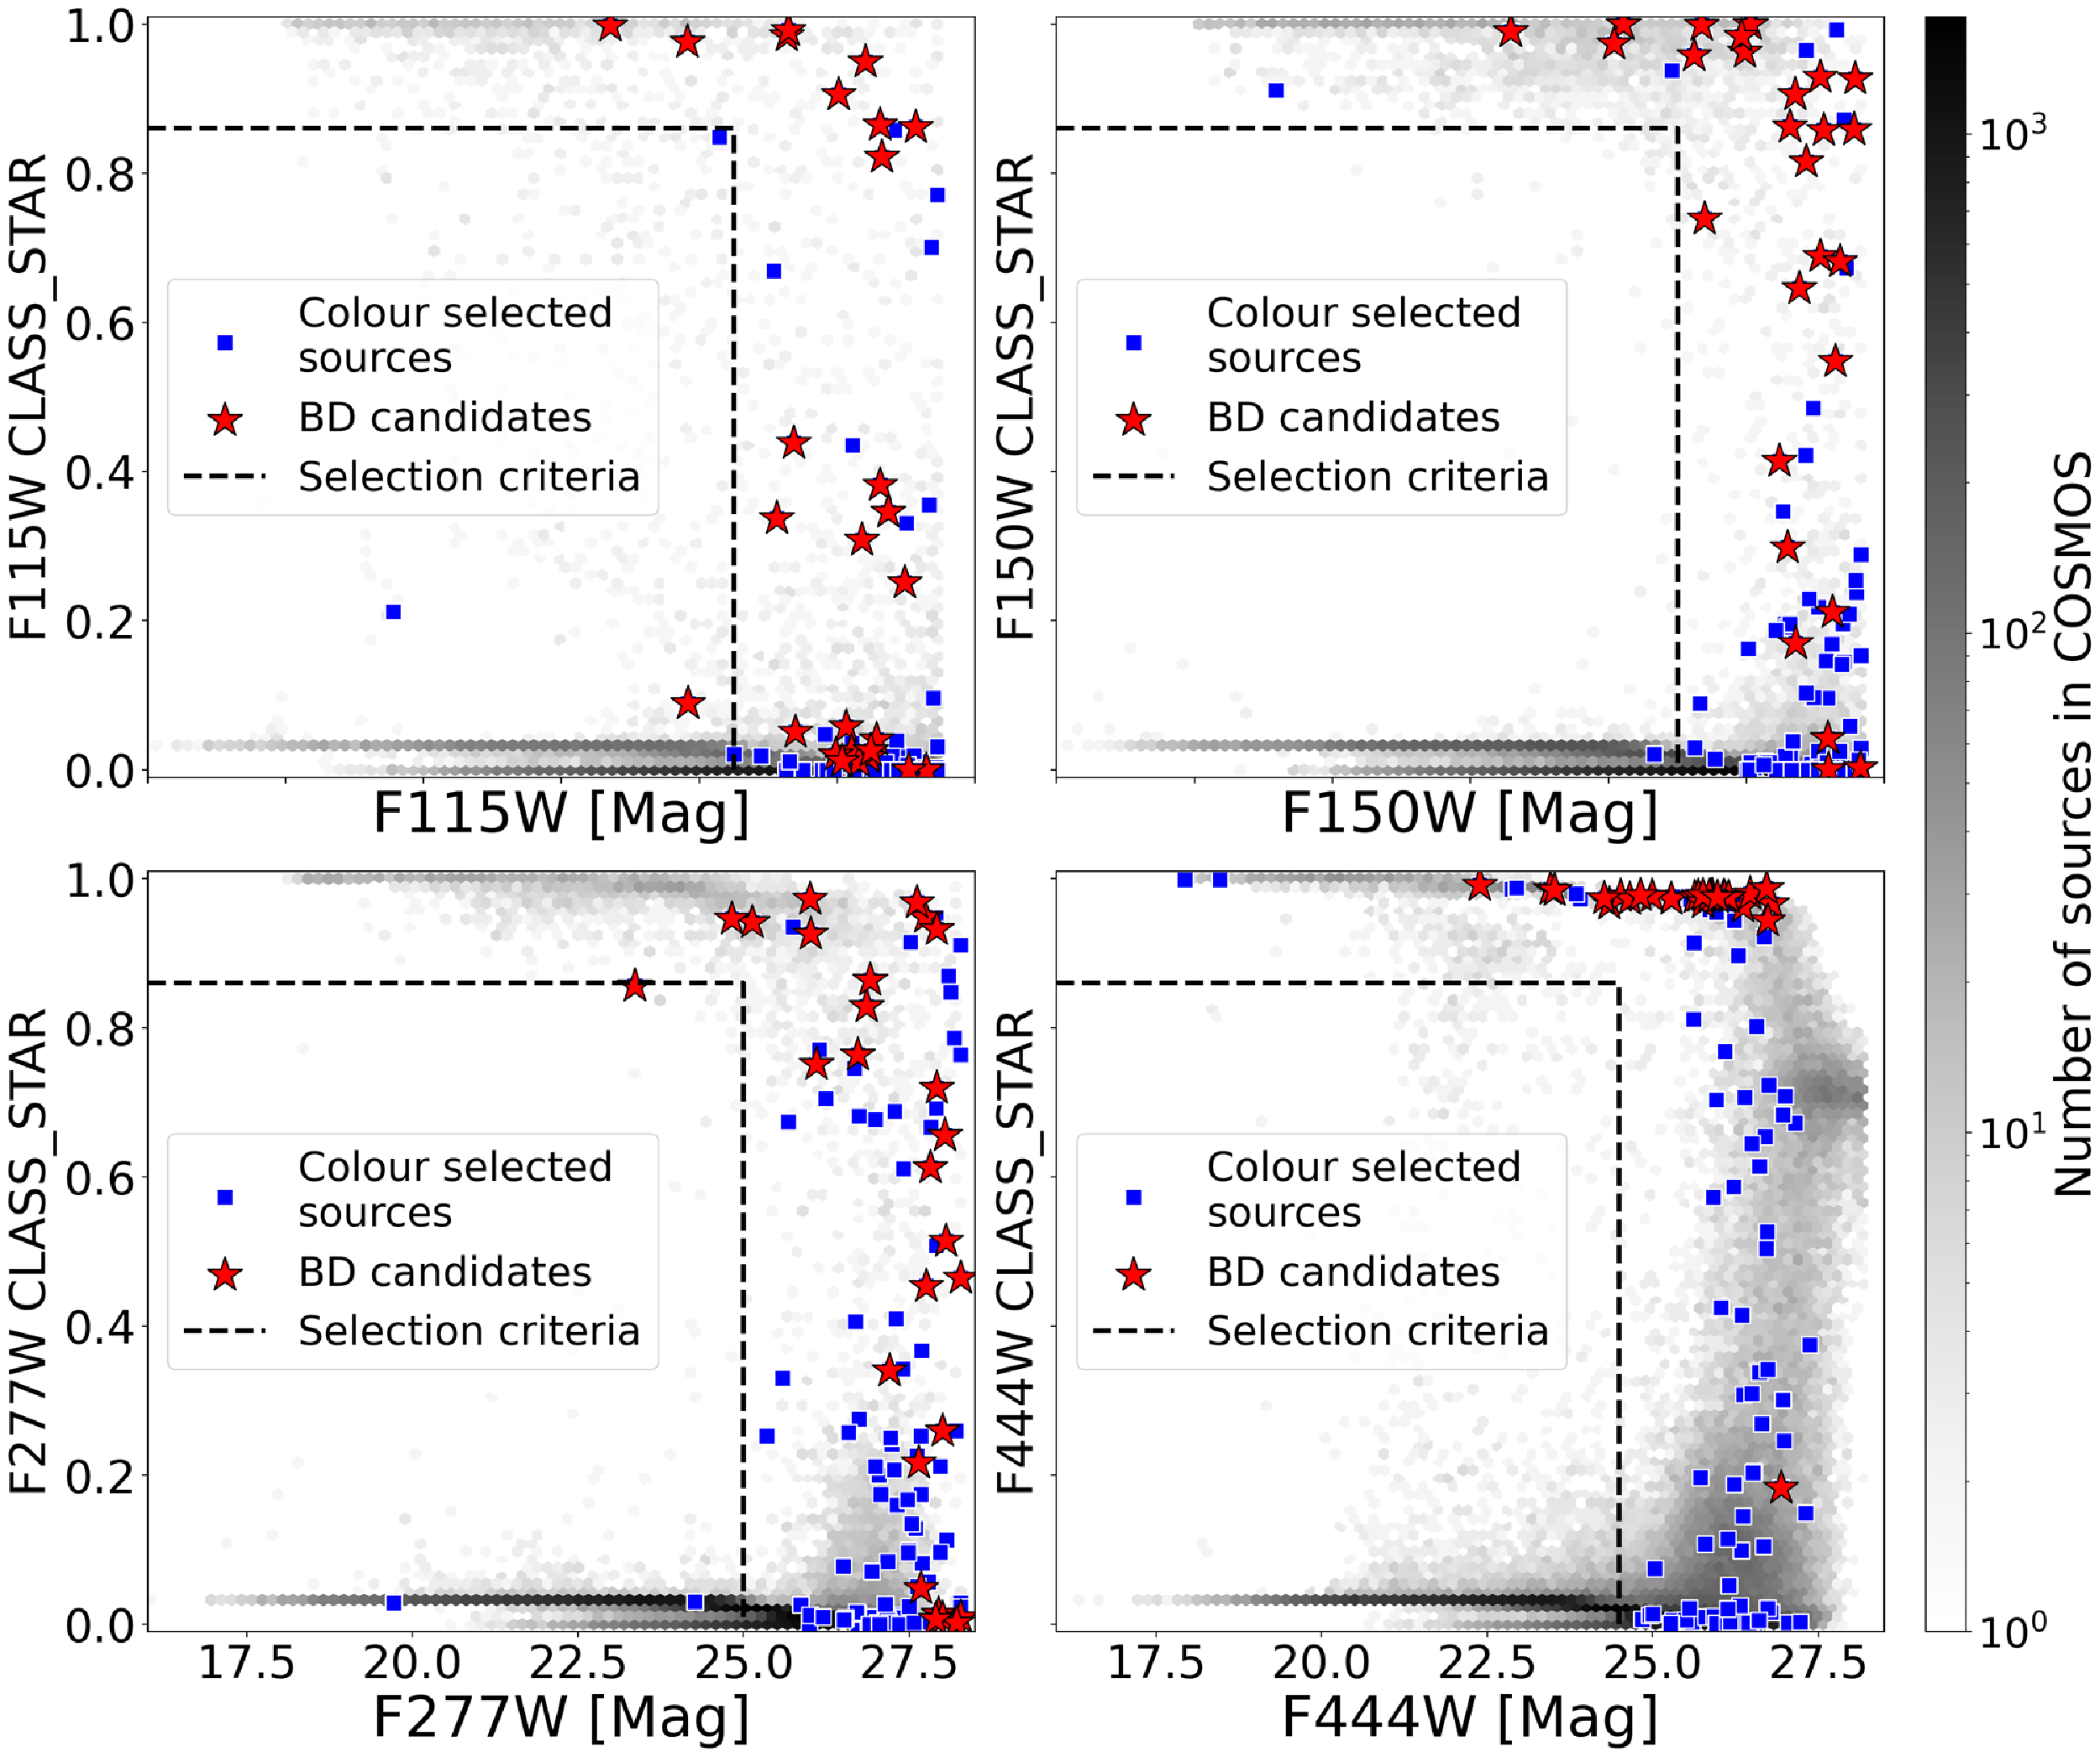
We classify faint detections that fall outside the bimodal zone by visual inspection. Out of 120 colour-selected sources, five are rejected by these criteria. Only BD26 is affected by the lowered criteria. However, most of our sources are not bright enough to apply this method. In Fig. 3, we show the CLASS_STAR against AB magnitude distribution of colour-selected sources and all sources in the field. The 27 final brown dwarf candidates are also shown in the figure. Most colour-selected sources do not fall within the bright region where the classification is reliable. Therefore, they cannot be classified by the CLASS_STAR.
CLASS_STAR distribution against AB magnitude in each JWST band. Grey hexagonal bins show CLASS_STAR of all sources in the search area. Blue squares show the sources selected by colour criteria (Equations 1 and 2), which include extended sources and galaxies. Red stars are the 27 final brown dwarf candidates. Dash lines are the selection criteria.
FLUX_RADIUS distribution against AB magnitude in each JWST band. Grey hexagonal bins show FLUX_RADIUS of all sources in the search area. The dashed line is the FLUX_RADIUS criterion for selecting point sources (Equations 7–10). The dash-dotted line is the magnitude limit to apply the FLUX_RADIUS criterion. Light blue squares show the colour-selected sources. Red stars are the final 27 brown dwarf candidates.
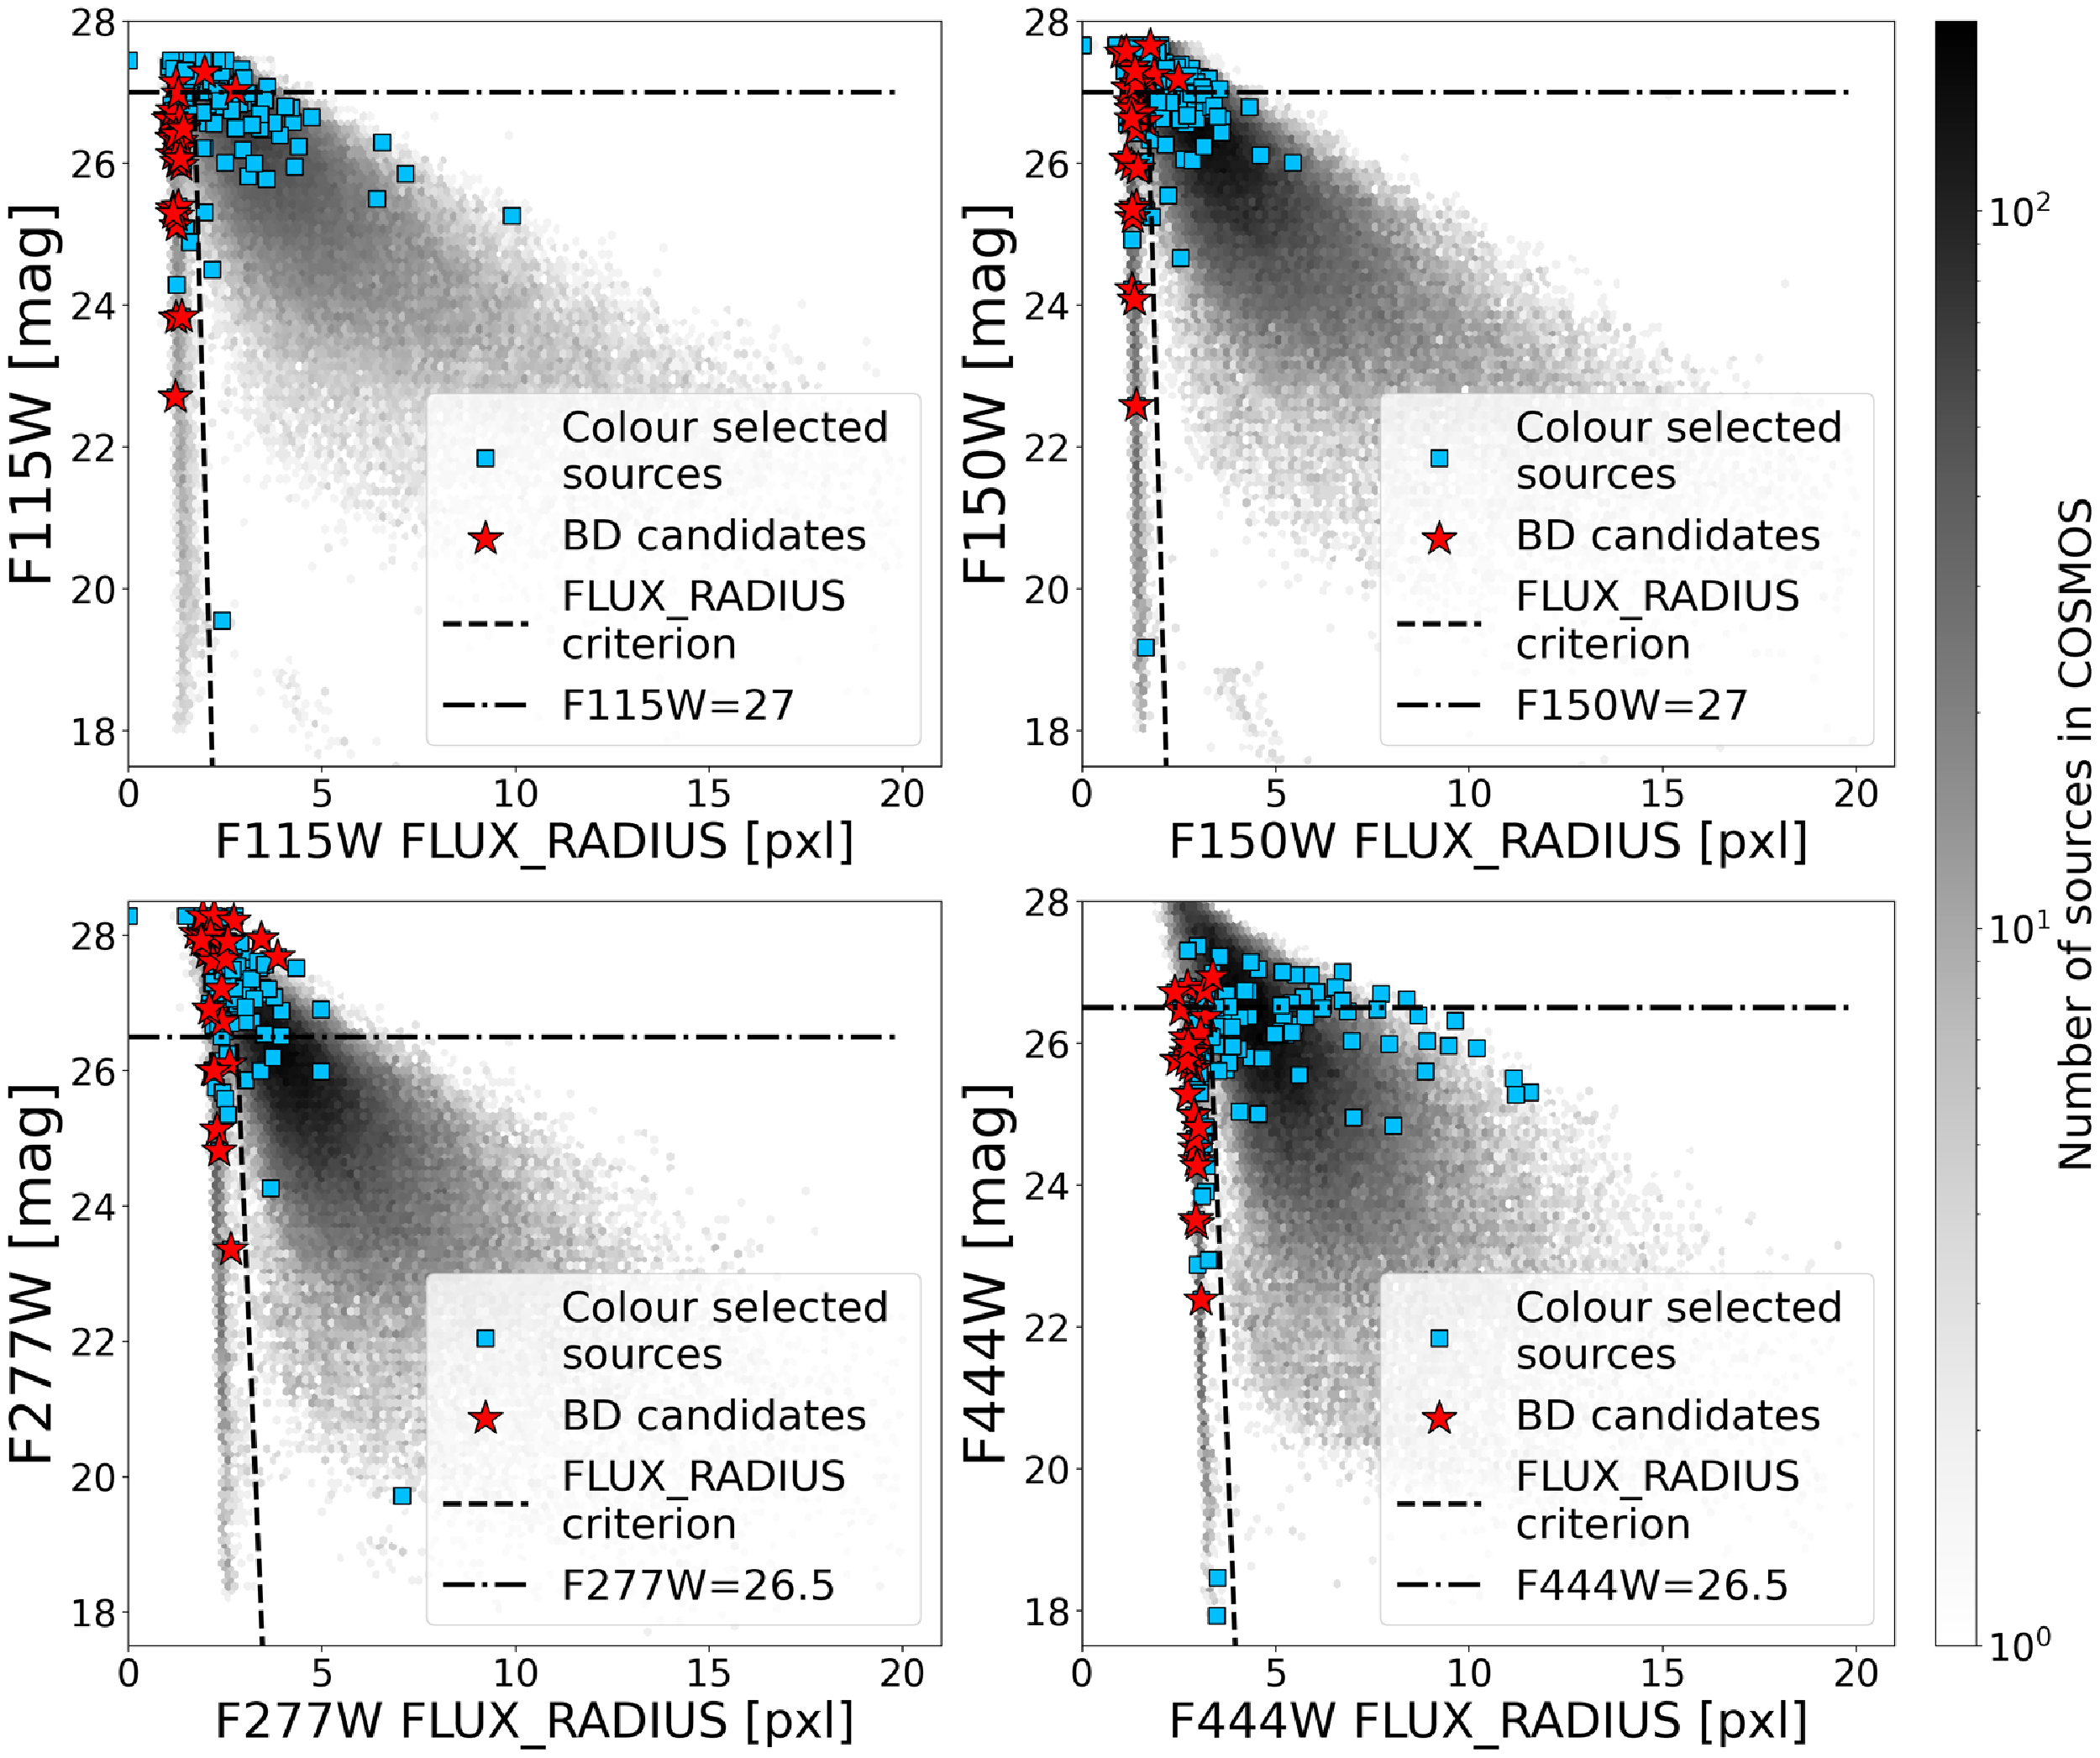
We utilise another parameter FLUX_RADIUS to establish efficient criteria. SExtractor provides a FLUX_RADIUS parameter for each source to measure its size in units of pixels. The FLUX_RADIUS-AB magnitude plot (see Fig. 4) shows a bimodality that distinguishes point sources and extended sources up to $26.5\ 27$
magnitudes. Therefore, we can use the following equations to remove extended sources.
$26.5\ 27$
magnitudes. Therefore, we can use the following equations to remove extended sources.
 \begin{align} 20\,{\tt FLUX\_RADIUS_{F115W}} + 61 \gt F115W \cap F115W\lt27 \end{align}
 \begin{align} 20\,{\tt FLUX\_RADIUS_{F150W}} + 61 \gt F150W \cap F150W\lt27 \end{align}
 \begin{align} 12.1\,{\tt FLUX\_RADIUS_{F277W}} + 60.4 \gt F277W \cap F277W\lt26.5 \end{align}
 \begin{align} 12.1\,{\tt FLUX\_RADIUS_{F444W}} + 65.4 \gt F444W \cap F444W\lt26.5 \\[12pt]\nonumber\end{align}
The unit of FLUX_RADIUS is in pixels, and the size of a pixel is $0.03''$
. If any band of a source meets the Equations 7–10, we remove that source. We classify faint detections that fall outside the bimodal zone by visual inspection. 72 extended sources are excluded from 115 sources. We further reject four sources that are contaminated by starlight during image inspection. There are 39 candidates in total.
$0.03''$
. If any band of a source meets the Equations 7–10, we remove that source. We classify faint detections that fall outside the bimodal zone by visual inspection. 72 extended sources are excluded from 115 sources. We further reject four sources that are contaminated by starlight during image inspection. There are 39 candidates in total.
SPREAD_MODEL against S/N distribution for each JWST bands. The red stars are the final 27 brown dwarf candidates. The grey hexagonal bins are comparison sources.

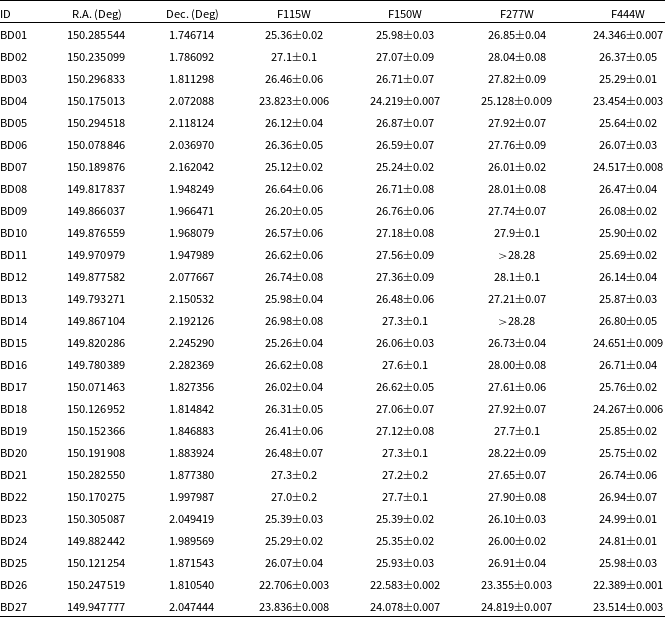
Observed AB magnitudes of brown dwarf candidates.
Another SExtractor parameter, SPREAD_MODEL, also can be used to separate stars and galaxies (Bouy et al. Reference Bouy, Bertin, Moraux, Cuillandre, Bouvier, Barrado, Solano and Bayo2013). SPREAD_MODEL compares the best-fitting local PSF model (representing a point source) with a slightly fuzzier model (representing a galaxy) to determine which matches the image data better. SPREAD_MODEL is close to zero for point sources, positive for extended sources (galaxies), and negative for detections smaller than the PSF, such as cosmic ray hits. We use PSFEx to extract PSF models from official PSFs,Footnote c then measure SPREAD_MODEL of our brown dwarf candidates and comparison sources (10% of the sources in the COSMOS-Web DR0.5 field). The SPREAD_MODEL against signal-to-noise ratio (S/N) plots are shown in Fig. 5. Although there is a clear separation between point sources and extended sources, SPREAD_MODEL of point sources at F115W, F150W, and F277W bands slightly deviate from the zero. The deviation might result from employing official PSF models instead of deriving PSF models directly from actual images. All of our brown dwarf candidates with high S/N photometry are located in the point source group, which gives us more confidence in our candidates.
3.4 SED fitting
As mentioned in Langeroodi & Jens (Reference Langeroodi and Hjorth2023), the colour of brown dwarfs resembles that of active galactic nuclei (AGNs). There may be AGN contaminants among our colour-selected candidates. To confirm the brown dwarf nature of these candidates and accurately determine their physical properties, we perform SED fitting using the software LePhare (Arnouts et al. Reference Arnouts, Cristiani, Moscardini, Matarrese, Lucchin, Fontana and Giallongo1999; Ilbert et al. Reference Ilbert2006). LePhare includes three categories of templates: galaxy, quasi-stellar object (QSO), and stars. For galaxies, we adopt the CWW_Kinney spectra (Coleman, Wu, &Weedman Reference Coleman, Wu and Weedman1980; Calzetti, Kinney, &Storchi-Bergmann Reference Calzetti, Kinney and Storchi-Bergmann1994) and include all QSO spectra (Rowan-Robinson et al. Reference Rowan-Robinson2008; Netzer et al. Reference Netzer2007; Silva et al. Reference Silva, Granato, Bressan and Danese1998), encompassing both observed and synthetic spectra. For stellar SEDs, in addition to the library provided in LePhare (Pickles Reference Pickles1998; Chabrier et al. Reference Chabrier, Baraffe, Allard and Hauschildt2000; Hamuy et al. Reference Hamuy, Suntzeff, Heathcote, Walker, Gigoux and Phillips1994), we manually incorporated the Sonora-Bobcat (Marley & Robinson Reference Marley and Robinson2015), ATMO2020++ (Meisner et al. Reference Meisner, Leggett, Logsdon, Schneider, Tremblin and Phillips2023), and LOWZ(Meisner et al. Reference Meisner, Leggett, Logsdon, Schneider, Tremblin and Phillips2023) brown dwarf models. We fit each source three times with these brown dwarf models separately.
Sonora-Bobcat model provides brown dwarf SEDs with effective temperature ( $T_{\text{eff}}$
) 200 K
$T_{\text{eff}}$
) 200 K $\leq$ $T_{\text{eff}} \leq$
2 400 K, gravity (g) 3
$T_{\text{eff}} \leq$
2 400 K, gravity (g) 3 $\leq$ $\log{g}$
(cgs)
$\log{g}$
(cgs) $\leq$
5.5 and three metallicities ([M/H]) = −0.5, 0.0, and 0.5. The temperature steps are 25, 50, and 100 K, depending on the temperature. The surface gravity
$\leq$
5.5 and three metallicities ([M/H]) = −0.5, 0.0, and 0.5. The temperature steps are 25, 50, and 100 K, depending on the temperature. The surface gravity $\log{g}$
step is 0.25. The model spectra cover from 0.66 to 5.26
$\log{g}$
step is 0.25. The model spectra cover from 0.66 to 5.26 ${\unicode{x03BC}}$
m. We use one specific ATMO2020++ model (Leggett et al. Reference Leggett2021) that provides the subsolar metallicity parameter down to
${\unicode{x03BC}}$
m. We use one specific ATMO2020++ model (Leggett et al. Reference Leggett2021) that provides the subsolar metallicity parameter down to $-1.0$
dex to find metal-poor brown dwarfs. This model provides SEDs with 250 K
$-1.0$
dex to find metal-poor brown dwarfs. This model provides SEDs with 250 K $\leq$ $T_{\text{eff}} \leq$
1 200 K, 2.5
$T_{\text{eff}} \leq$
1 200 K, 2.5 $\leq$ $\log{g}$
(cgs)
$\log{g}$
(cgs) $\leq$
5.5, and four metallicity options: −1.0, −0.5, 0.0, and 0.3. The temperature steps are 25, 50, and 100 K, depending on the temperature. The surface gravity
$\leq$
5.5, and four metallicity options: −1.0, −0.5, 0.0, and 0.3. The temperature steps are 25, 50, and 100 K, depending on the temperature. The surface gravity $\log{g}$
step is 0.5. LOWZ model provides SEDs with 500 K
$\log{g}$
step is 0.5. LOWZ model provides SEDs with 500 K $\leq$ $T_{\text{eff}} \leq$
1 600 K with temperature steps 50 and 100 K, five
$T_{\text{eff}} \leq$
1 600 K with temperature steps 50 and 100 K, five $\log{g}$
(cgs) options: 3.5, 4.0, 4.5, 5.0, and 5.25, three carbon-to-oxygen (C/O) ratio: 0.1, 0.55, and 0.85, three vertical eddy diffusion coefficient
$\log{g}$
(cgs) options: 3.5, 4.0, 4.5, 5.0, and 5.25, three carbon-to-oxygen (C/O) ratio: 0.1, 0.55, and 0.85, three vertical eddy diffusion coefficient $\log K_{zz}$
(cgs): −1.0, 2.0, 10.0, and −2.5
$\log K_{zz}$
(cgs): −1.0, 2.0, 10.0, and −2.5 $\leq$
[M/H]
$\leq$
[M/H] $\leq$
1.0 with step sizes 0.25 and 0.5.
$\leq$
1.0 with step sizes 0.25 and 0.5.
To check the proper motion and increase photometric data points, we cross-match our brown dwarf candidates with the COSMOS2020 catalogue (Weaver et al. Reference Weaver2022). Considering the potential proper motion of these stars, we choose a wide cross-match radius of 1.5 arcsec based on the result of Hainline et al. (Reference Hainline2024b). The average time gap between the HST COSMOS and JWST images is 20 yr. By scaling the proper motion of the brown dwarf candidates using the highest proper motion from Hainline et al. (Reference Hainline2024b) ( $0.75''$
over 10 yr), we estimate the largest proper motion to be
$0.75''$
over 10 yr), we estimate the largest proper motion to be $1.5''$
. This corresponds to a velocity of 178 km/s at 500 pc.
$1.5''$
. This corresponds to a velocity of 178 km/s at 500 pc.
4. Results
Among 120 colour-selected sources, CLASS_STAR criteria rejected 5 of them, and 72 were rejected by the FLUX_RADIUS criteria (Section 3.2). No sources were rejected by SPREAD_MODEL. 4 out of the remaining 43 sources were contaminated with nearby starlight. 17 out of 39 sources matched with COSMOS2020 sources. Only one COSMOS2020 source that matched with BD26 was labeled as a star. Although 16 matched COSMOS2020 sources were labelled as galaxies, we found 14 of them were only detected in a few IR bands and had no detections in optical. Only 2 matched COSMOS2020 sources were detected by SUBARU/SC filters, which are definitely galaxies. We removed those 2 brown dwarf candidates that matched with these two galaxies. Considering that brown dwarf models were published after 2021, we believe those 14 COSMOS2020 sources are misclassified as galaxies.
27 out of 37 sources best fit with 3 brown dwarf models simultaneously, showing a large discrepancy with galaxy SEDs. 8 sources have the smallest chi-square ( $\chi^2$
) with neither of the three models, so they are classified as galaxies and removed. 2 sources best fit with one or two brown dwarf models. As they were only detected in 3 bands and did not best fit with all brown dwarf models, we removed these two candidates. Three moving sources, BD04, BD26, and BD27, were detected clearly by HST/ACS F814W and 4 UltraVISTA bands. Their angular separation and transverse velocities are discussed in Section 5.3. These three brown dwarfs have 9 band detections, so we use 9 photometry bands in the SED fitting. There are 27 brown dwarf candidates in total. Their coordinates and colours are shown in Table 2. All fitting results are shown in Figs. 6–7.
$\chi^2$
) with neither of the three models, so they are classified as galaxies and removed. 2 sources best fit with one or two brown dwarf models. As they were only detected in 3 bands and did not best fit with all brown dwarf models, we removed these two candidates. Three moving sources, BD04, BD26, and BD27, were detected clearly by HST/ACS F814W and 4 UltraVISTA bands. Their angular separation and transverse velocities are discussed in Section 5.3. These three brown dwarfs have 9 band detections, so we use 9 photometry bands in the SED fitting. There are 27 brown dwarf candidates in total. Their coordinates and colours are shown in Table 2. All fitting results are shown in Figs. 6–7.
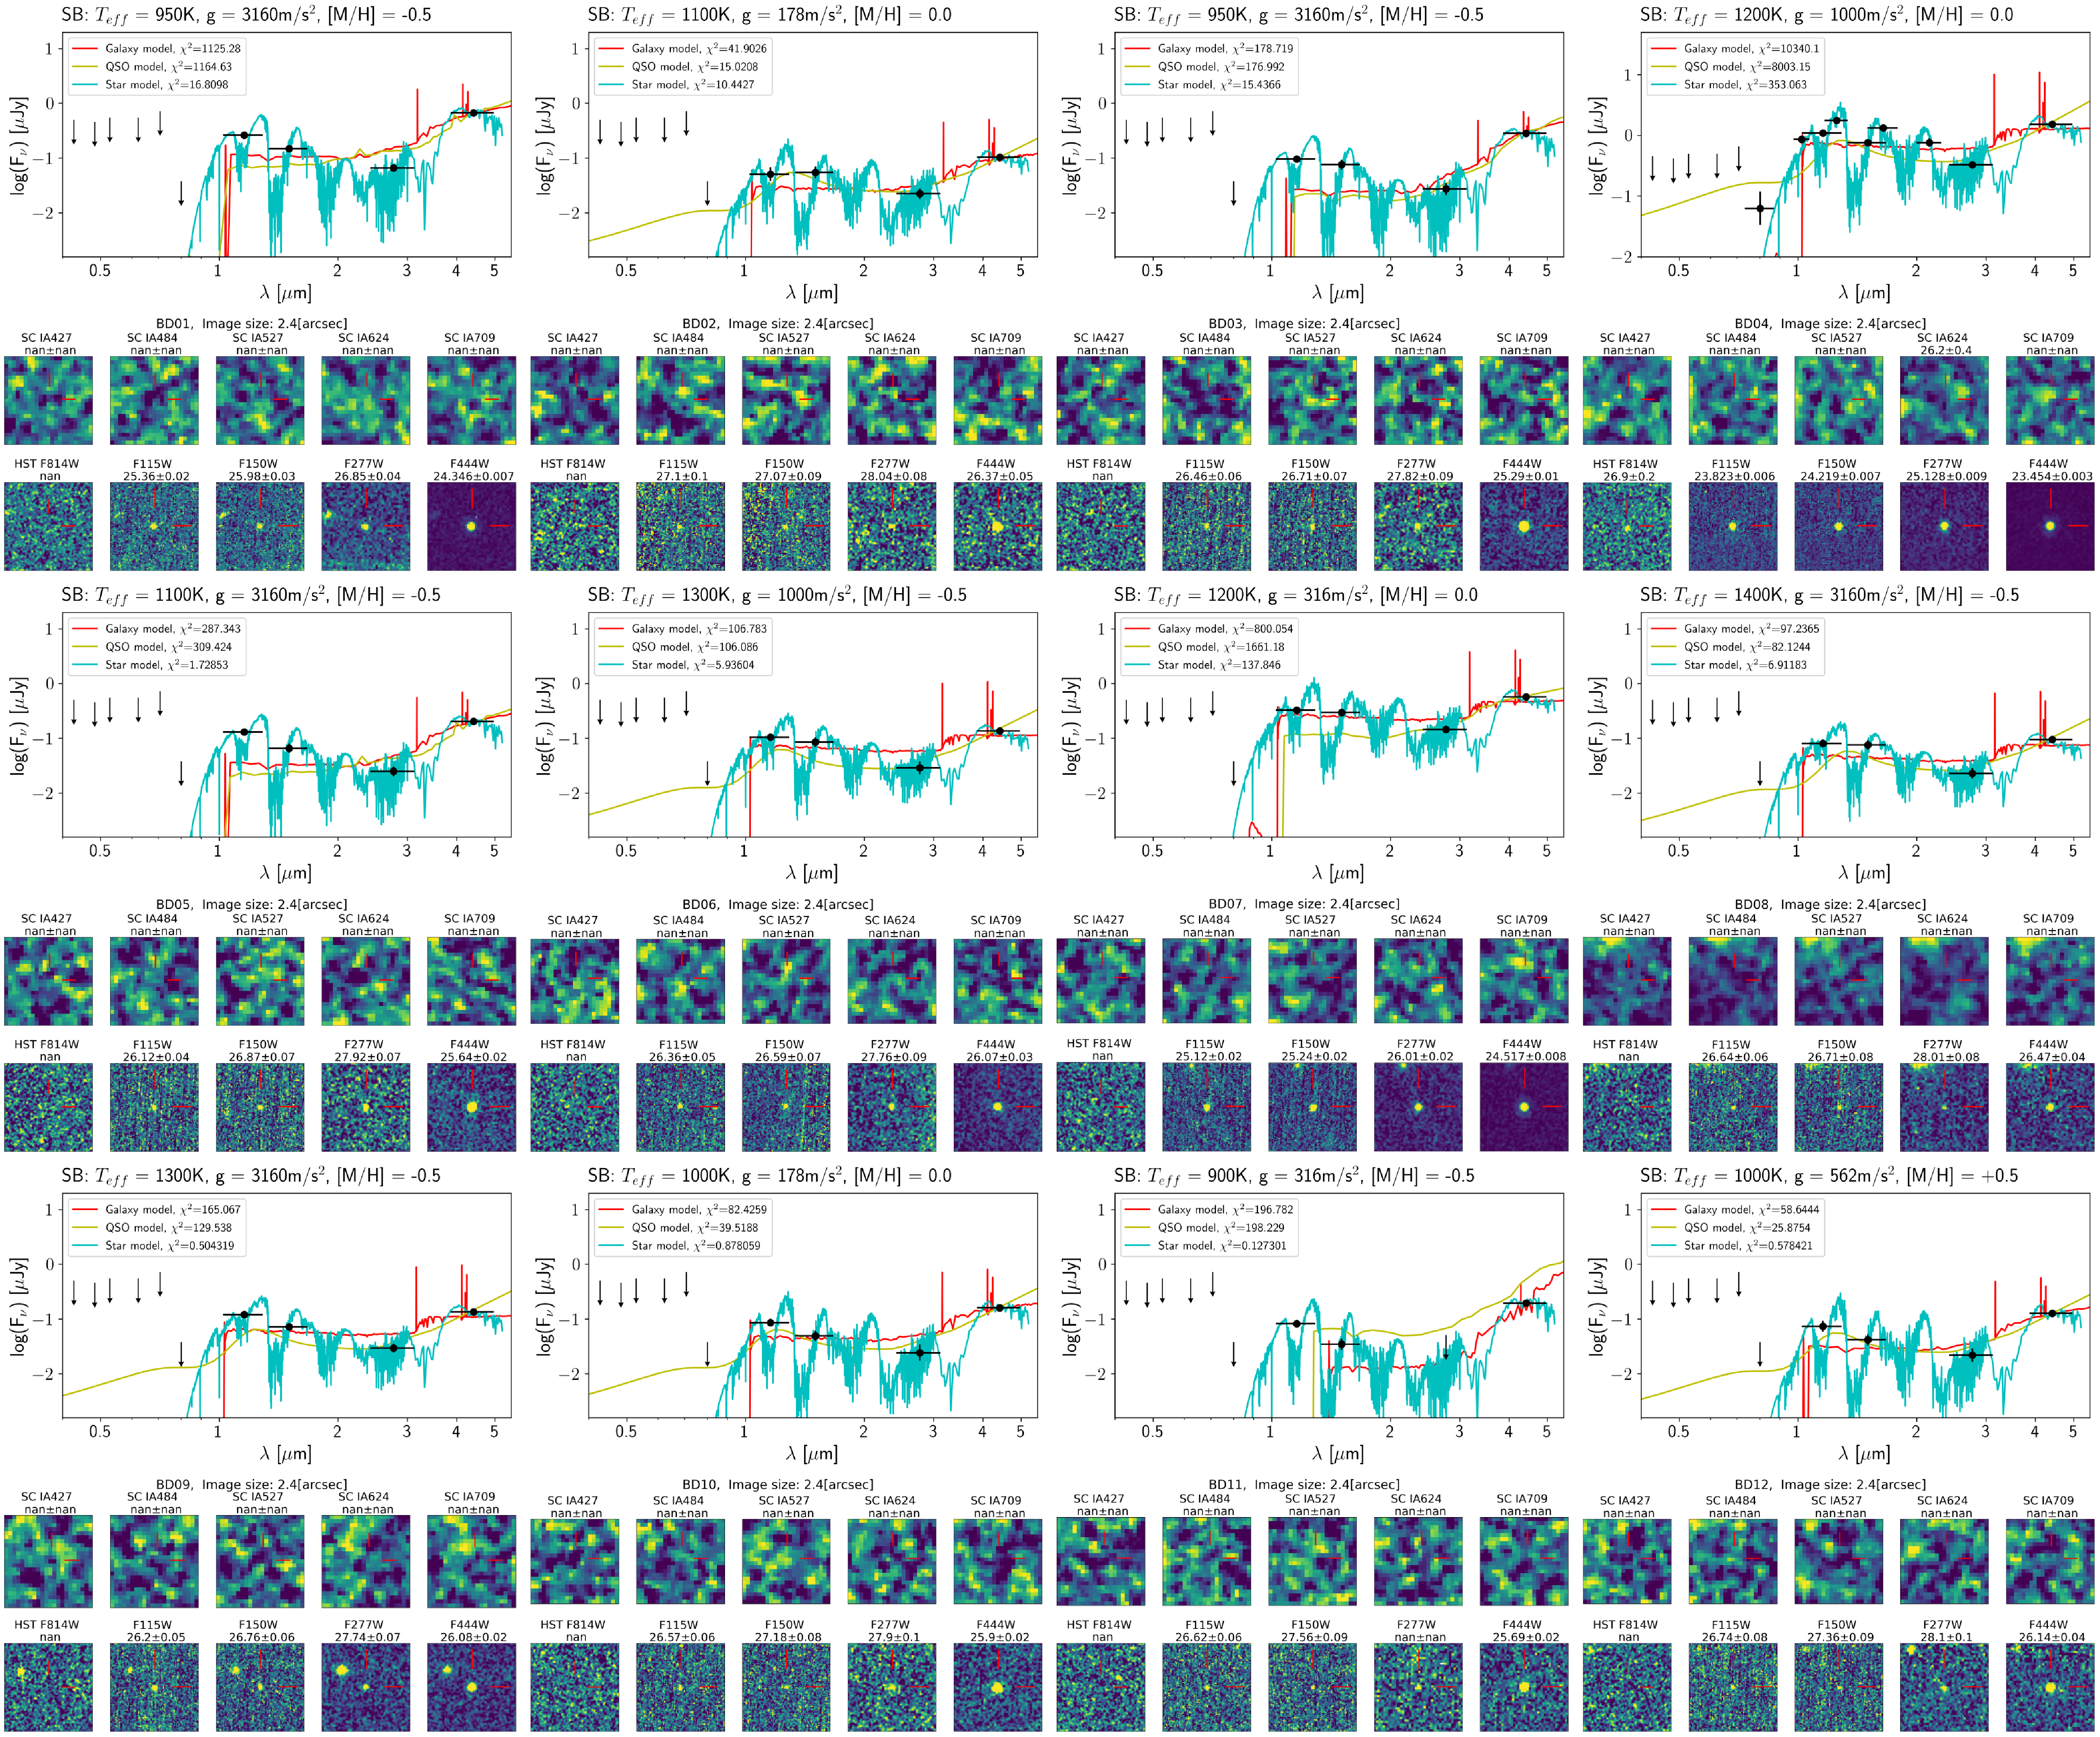
SED fitting results and images of brown dwarf candidates. The title of each figure shows the temperature, surface gravity, and metallicity of the best-fit Sonora-Bobcat model. Black dots with error bars are the photometric data points, and arrows represent the upper limit of that band. The red line is the spectrum of the best-fit galaxy model, the yellow line is the best-fit QSO model, and the cyan line is the best-fit Sonora-Bobcat template. Parameters of the best-fit brown dwarf model are shown at the top of the figure. The $\chi^2$
of each template is listed in the caption. The lower panel is the cutout images of SUBARU/SC, HST/ACS, and JWST/NIRCam at the brown dwarf position. The image size is
$\chi^2$
of each template is listed in the caption. The lower panel is the cutout images of SUBARU/SC, HST/ACS, and JWST/NIRCam at the brown dwarf position. The image size is $2.4''\times2.4''$
. The number in each cutout image represents the measured photometry along with its error expressed in AB magnitude units. Nan represents no detection or is lower than the detection limit in that filter. The F277W photometry results of BD11 and BD14 are fainter than the F277W
$2.4''\times2.4''$
. The number in each cutout image represents the measured photometry along with its error expressed in AB magnitude units. Nan represents no detection or is lower than the detection limit in that filter. The F277W photometry results of BD11 and BD14 are fainter than the F277W $5\sigma$
detection limit, so they are labelled as no detection in the F277W band.
$5\sigma$
detection limit, so they are labelled as no detection in the F277W band.
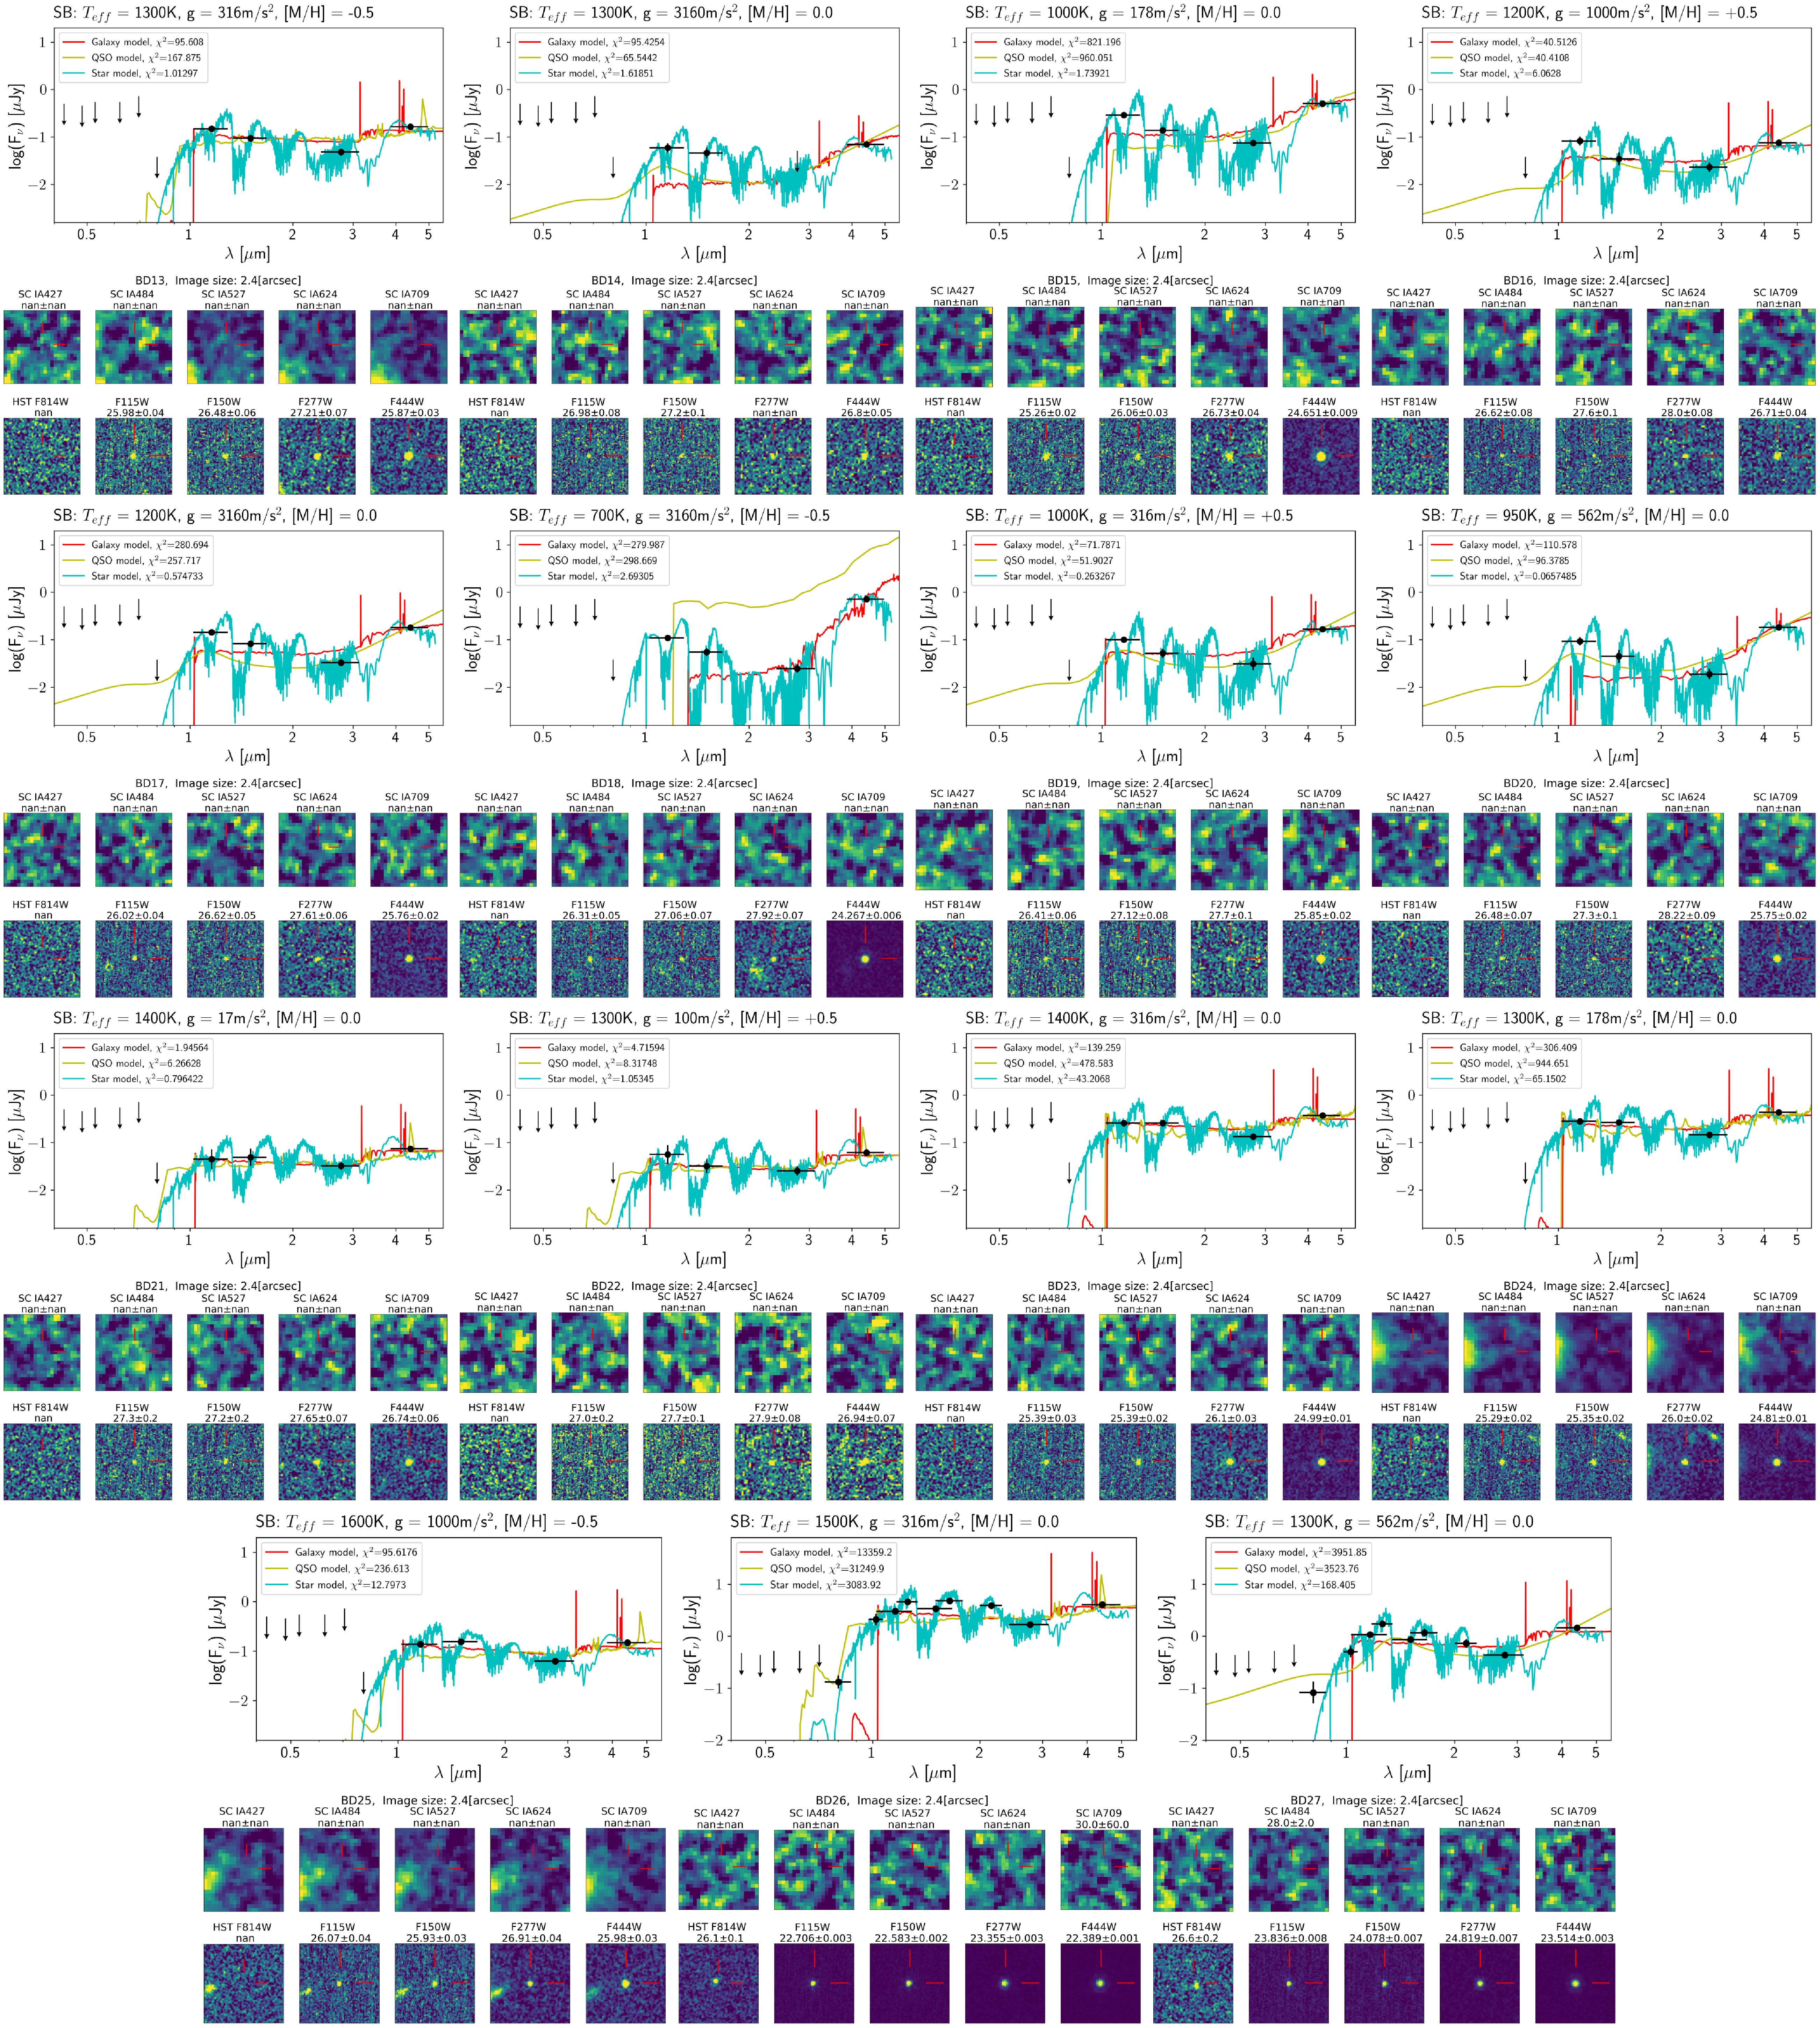
SED fitting results and images of brown dwarf candidates (continued from Fig. 6).
To estimate the uncertainty of the fitting parameters and the estimated distance, we perform a Markov chain Monte Carlo (MCMC) analysis with Python package emcee. We linearly interpolate the model magnitude table with step size 5 K for $T_{\text{eff}}$
, 0.1 for
$T_{\text{eff}}$
, 0.1 for $\log{g}$
, and 0.1 for Z. LOWZ’s C/O and
$\log{g}$
, and 0.1 for Z. LOWZ’s C/O and $\log K_{zz}$
parameter are not interpolated to save the computation time. In addition, the observed photometry was fitted to the interpolated models, and the likelihood function was maximised. We set the prior probability uniformly within the three models’ parameter space and zero beyond it. In addition to the three (five) parameters for Sonora-Bobcat and ATMO2020++ (LOWZ), a new parameter, distance (D), is included in the MCMC analysis. Since the authors of the Sonora-Bobcat model provide the magnitude of brown dwarf models at 10 pc for JWST filters (Marley et al. Reference Marley, Saumon, Morley, Fortney, Visscher, Freedman and Lupu2021a), we are able to fit the observed magnitude to the 10 pc model magnitude and derive their distances. Distance can also be directly derived from ATMO2020++ fitting as the SEDs are provided at 10 pc. LOWZ provides SEDs with surface fluxes, so we fit the scale factor
$\log K_{zz}$
parameter are not interpolated to save the computation time. In addition, the observed photometry was fitted to the interpolated models, and the likelihood function was maximised. We set the prior probability uniformly within the three models’ parameter space and zero beyond it. In addition to the three (five) parameters for Sonora-Bobcat and ATMO2020++ (LOWZ), a new parameter, distance (D), is included in the MCMC analysis. Since the authors of the Sonora-Bobcat model provide the magnitude of brown dwarf models at 10 pc for JWST filters (Marley et al. Reference Marley, Saumon, Morley, Fortney, Visscher, Freedman and Lupu2021a), we are able to fit the observed magnitude to the 10 pc model magnitude and derive their distances. Distance can also be directly derived from ATMO2020++ fitting as the SEDs are provided at 10 pc. LOWZ provides SEDs with surface fluxes, so we fit the scale factor $\alpha=(R/D)^2$
to the observed flux densities. R is the radius of the source, and we assume a common radius of one Jupiter radius (Burgasser et al. Reference Burgasser2024; Hainline et al. Reference Hainline2024a) for 27 brown dwarf candidates to derive D. We use 120 walkers and 5 000 steps in the MCMC analysis for 24 sources that were not detected by HST. For those three brightest brown dwarf candidates that have one HST, four UltraVISTA, and four JWST photometry, we run another MCMC fitting with 9ninephotometry bands. In this MCMC fitting, we use 120 walkers and 6 000 steps. The MCMC results for each source are listed in Tables 3–5. Sonora-Bobcat model fitting results peak at one single solution for all sources, while ATMO2020++ and LOWZ’s results have multiple solutions for some candidates. MCMC walkers converge to several peaks, and this degeneracy cannot be resolved by MCMC fitting through doubling the steps. Among the multi-solutions of one brown dwarf candidate, we list one solution with more walkers that converge to it and mark it with a footnote.
$\alpha=(R/D)^2$
to the observed flux densities. R is the radius of the source, and we assume a common radius of one Jupiter radius (Burgasser et al. Reference Burgasser2024; Hainline et al. Reference Hainline2024a) for 27 brown dwarf candidates to derive D. We use 120 walkers and 5 000 steps in the MCMC analysis for 24 sources that were not detected by HST. For those three brightest brown dwarf candidates that have one HST, four UltraVISTA, and four JWST photometry, we run another MCMC fitting with 9ninephotometry bands. In this MCMC fitting, we use 120 walkers and 6 000 steps. The MCMC results for each source are listed in Tables 3–5. Sonora-Bobcat model fitting results peak at one single solution for all sources, while ATMO2020++ and LOWZ’s results have multiple solutions for some candidates. MCMC walkers converge to several peaks, and this degeneracy cannot be resolved by MCMC fitting through doubling the steps. Among the multi-solutions of one brown dwarf candidate, we list one solution with more walkers that converge to it and mark it with a footnote.
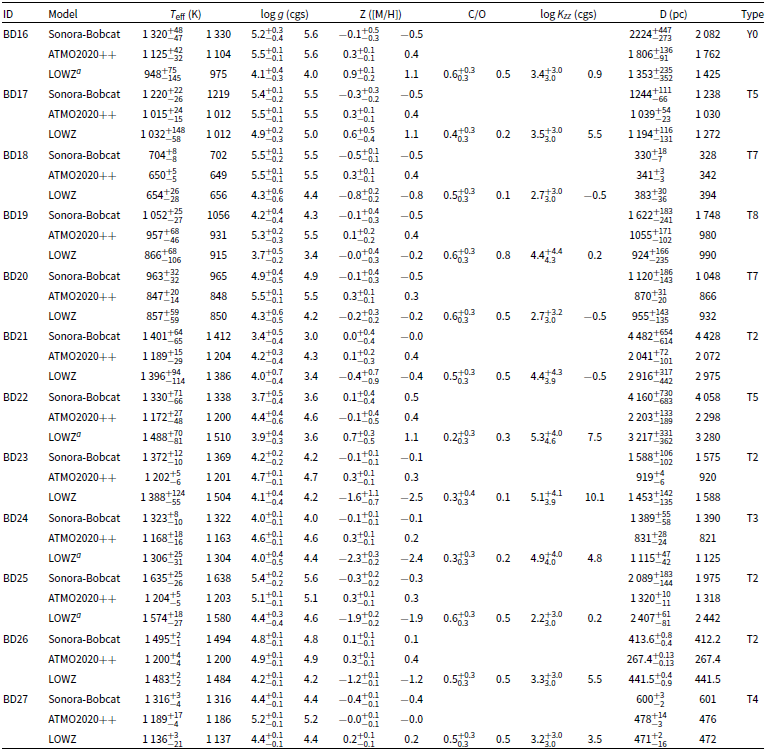
Physical properties derived from MCMC fitting and spectral-type fitting results of the brown dwarf candidates. We show the temperature, surface gravity, and metallicity of brown dwarf candidates for each brown dwarf model. The left column of each parameter is the median of the distribution. The upper-/lower error stands for the 16th and 84th percentiles of the distribution, respectively. The uncertainties that are smaller than the grid size are shown as the grid size of that parameter. The right column of each parameter is the peak value of the distribution. The unit of temperature is kelvin, the unit of gravity is cm s $^{-2}$
, metallicity is relative to that of the Sun, and the candidate’s distance from Earth is in pc. The last column shows the best-fit spectral type of each brown dwarf candidate.
$^{-2}$
, metallicity is relative to that of the Sun, and the candidate’s distance from Earth is in pc. The last column shows the best-fit spectral type of each brown dwarf candidate.

a Exist multiple MCMC solutions. We list the one with more walkers, which means a higher probability.
Physical properties derived from MCMC fitting. (Continued from Table 3)

Physical properties derived from MCMC fitting. (Continued from Table 4)
To identify the type of brown dwarf candidates and compare their number density, we perform another SED fitting to our brown dwarf candidates with spectra of L-dwarf IR standards (Reid et al. Reference Reid, Cruz, Davy Kirkpatrick, Allen, Mungall, Liebert, Lowrance and Sweet2008), T-dwarf IR standards (Burgasser et al. Reference Burgasser, Geballe, Leggett, Davy Kirkpatrick and Golimowski2006), and the NIRSpec PRISM spectrum of a Y0-dwarf WISEPC J205628.90+145953.3 (Beiler et al. Reference Beiler, Mukherjee, Cushing, Davy Kirkpatrick, Schneider, Kothari, Marley and Visscher2024). The spectra for the L and T dwarf standards are taken from the SpeX library,Footnote
d
while the spectrum for the Y0-dwarf is obtained from JWST observations.Footnote
e
Since spectra of L and T type brown dwarfs range from 0.66 to 2.56 ${\unicode{x03BC}}$
m, we only use 0.66 to 2.56
${\unicode{x03BC}}$
m, we only use 0.66 to 2.56 ${\unicode{x03BC}}$
m part of the Y0-dwarf spectrum to have a proper SED fitting. It is important to note that only two photometric data points are within this spectral range. Therefore, additional observations are needed to determine the spectral type of these brown dwarf candidates more precisely. The best-fit type of these brown dwarf candidates is listed in Table 3. We find five T2, three T3, four T4, eight T5, four T7, one T8, and two Y0 dwarf candidates in our survey field.
${\unicode{x03BC}}$
m part of the Y0-dwarf spectrum to have a proper SED fitting. It is important to note that only two photometric data points are within this spectral range. Therefore, additional observations are needed to determine the spectral type of these brown dwarf candidates more precisely. The best-fit type of these brown dwarf candidates is listed in Table 3. We find five T2, three T3, four T4, eight T5, four T7, one T8, and two Y0 dwarf candidates in our survey field.
Our study heralds a new chapter in the exploration of brown dwarfs. The ultimate sensitivity of JWST enables the discovery of brown dwarfs situated several kpc from Earth.
5. Discussion
5.1 Colour degeneracies
In the MCMC fitting, Sonora-Bobcat and LOWZ converge to similar $T_{\text{eff}}$
. Due to the model’s temperature grid limit, ATMO2020++ models converge to similar
$T_{\text{eff}}$
. Due to the model’s temperature grid limit, ATMO2020++ models converge to similar $T_{\text{eff}}$
for
$T_{\text{eff}}$
for $T_{\text{eff}}\lt1\,200$
K. Sonora-Bobcat model tends to fit a higher
$T_{\text{eff}}\lt1\,200$
K. Sonora-Bobcat model tends to fit a higher $T_{\text{eff}}$
than ATMO2020++ and LOWZ, which results in a larger distance. In addition to Sonora-Bobcat, ATMO2020++ and LOWZ both show multiple solutions to some sources (see Tables 3–5, they are marked with footnotes). This may be due to the small number of filters, or because the true solutions are beyond the model’s parameter ranges. We note that one of the multi-solutions, the ATMO2020++ MCMC fitting result of BD02, shows a very low
$T_{\text{eff}}$
than ATMO2020++ and LOWZ, which results in a larger distance. In addition to Sonora-Bobcat, ATMO2020++ and LOWZ both show multiple solutions to some sources (see Tables 3–5, they are marked with footnotes). This may be due to the small number of filters, or because the true solutions are beyond the model’s parameter ranges. We note that one of the multi-solutions, the ATMO2020++ MCMC fitting result of BD02, shows a very low $\log{g}\sim 2.5$
. Such low log g values are atypical for field brown dwarfs, which are older and more compact, generally having surface gravities of
$\log{g}\sim 2.5$
. Such low log g values are atypical for field brown dwarfs, which are older and more compact, generally having surface gravities of $\log{g}\sim 4.5$
(Allers & Liu Reference Allers and Liu2013; Gizis et al. Reference Gizis, Allers, Liu, Harris, Faherty, Burgasser and Davy Kirkpatrick2015). Instead,
$\log{g}\sim 4.5$
(Allers & Liu Reference Allers and Liu2013; Gizis et al. Reference Gizis, Allers, Liu, Harris, Faherty, Burgasser and Davy Kirkpatrick2015). Instead, $\log{g}\sim 2.5$
is more commonly associated with young, low-mass objects (Allers & Liu Reference Allers and Liu2013; Martin et al. Reference Martin2017), which are not likely to be found in the field. For
$\log{g}\sim 2.5$
is more commonly associated with young, low-mass objects (Allers & Liu Reference Allers and Liu2013; Martin et al. Reference Martin2017), which are not likely to be found in the field. For $T_{\text{eff}}\gtrapprox 1\,300$
K candidates, LOWZ’s MCMC fittings often converge to high metallicities (
$T_{\text{eff}}\gtrapprox 1\,300$
K candidates, LOWZ’s MCMC fittings often converge to high metallicities ( $\simeq1$
dex.) and low metallicities (
$\simeq1$
dex.) and low metallicities ( $\simeq-2$
dex.) solutions. We cannot distinguish these solutions with only four JWST filters at 1.1, 1.5, 2.7, and 4.4
$\simeq-2$
dex.) solutions. We cannot distinguish these solutions with only four JWST filters at 1.1, 1.5, 2.7, and 4.4 ${\unicode{x03BC}}$
m. Although the spectrum shape differs, fluxes are similar after convolving with JWST filters. The most significant difference is at 2
${\unicode{x03BC}}$
m. Although the spectrum shape differs, fluxes are similar after convolving with JWST filters. The most significant difference is at 2 ${\unicode{x03BC}}$
m. We fix the C/O
${\unicode{x03BC}}$
m. We fix the C/O $=0.55$
and
$=0.55$
and $\log K_{zz}=2$
, then compare LOWZ models with
$\log K_{zz}=2$
, then compare LOWZ models with $T_{\text{eff}}=1\,300$
K and all
$T_{\text{eff}}=1\,300$
K and all $\log{g}$
. After convolving with UltraVISTA’s Ks filter (2.1
$\log{g}$
. After convolving with UltraVISTA’s Ks filter (2.1 ${\unicode{x03BC}}$
m), we find the colour difference of F150W-Ks of low metallicity solution is
${\unicode{x03BC}}$
m), we find the colour difference of F150W-Ks of low metallicity solution is $\simeq2$
magnitude smaller than the high metallicity solution. Therefore, JWST/NIRCam F200W or F210M photometry is necessary for constraining the metallicity of brown dwarfs.
$\simeq2$
magnitude smaller than the high metallicity solution. Therefore, JWST/NIRCam F200W or F210M photometry is necessary for constraining the metallicity of brown dwarfs.
5.2 Metallicity
We expect to find sub-solar metallicity brown dwarfs at kpc scales (see Section 3.2). However, LOWZ often gives both low metallicity and high metallicity solutions for every low metallicity candidate. Sonora-Bobcat only gives one solution to each source, but the metallicity just ranges from -0.5 to 0.5 dex. As we discussed in Section 5.1, we need observations at 2 ${\unicode{x03BC}}$
m to constrain the metallicities of these brown dwarf candidates. Previous studies of metal-poor brown dwarf candidates have shown strong colour variations with chemical composition (Lodieu et al. Reference Lodieu, Zapatero Osorio, Martn, Rebolo López and Gauza2022; Meisner et al. Reference Meisner, Leggett, Logsdon, Schneider, Tremblin and Phillips2023; Burgasser et al. Reference Burgasser2024; Zhang et al. Reference Zhang, Xiang, Zhang, Ting, Wu and Liu2023). This might also complicate accurately determining the metallicities.
${\unicode{x03BC}}$
m to constrain the metallicities of these brown dwarf candidates. Previous studies of metal-poor brown dwarf candidates have shown strong colour variations with chemical composition (Lodieu et al. Reference Lodieu, Zapatero Osorio, Martn, Rebolo López and Gauza2022; Meisner et al. Reference Meisner, Leggett, Logsdon, Schneider, Tremblin and Phillips2023; Burgasser et al. Reference Burgasser2024; Zhang et al. Reference Zhang, Xiang, Zhang, Ting, Wu and Liu2023). This might also complicate accurately determining the metallicities.
5.3 Transverse velocity
Three brown dwarf candidates, BD04, BD26, and BD27, were detected in both HST and JWST. They are the three brightest candidates in the F115W band. Images from the HST were captured between July 2003 and June 2005, resulting in an average interval of 19 yr prior to the JWST’s images in 2023. We use SExtractor to extract positions of brown dwarf candidates’ HST detections. The astrometry accuracy of our JWST photometry is $0.038''$
(Wu et al. in preparation), which is adopted for both JWST and HST positions. We calculate the errors of the proper motions, which are added in quadrature in the standard way. The proper motion (
$0.038''$
(Wu et al. in preparation), which is adopted for both JWST and HST positions. We calculate the errors of the proper motions, which are added in quadrature in the standard way. The proper motion ( $\mu$
) in R.A. direction (
$\mu$
) in R.A. direction ( $\mu_{ra}$
) and Dec. direction (
$\mu_{ra}$
) and Dec. direction ( $\mu_{dec}$
) for three candidates is:
$\mu_{dec}$
) for three candidates is:
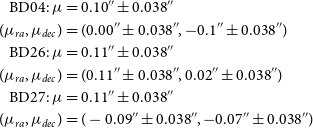 \begin{align*} \text{BD04: } \mu &= 0.10''\pm0.038'' \\ (\mu_{ra},\mu_{dec}) &= (0.00''\pm0.038'', -0.1''\pm0.038'')\\ \text{BD26: } \mu &= 0.11''\pm0.038'' \\ (\mu_{ra},\mu_{dec}) &= (0.11''\pm0.038'', 0.02''\pm0.038'')\\ \text{BD27: } \mu &= 0.11''\pm0.038'' \\ (\mu_{ra},\mu_{dec}) &= (-0.09''\pm0.038'', -0.07''\pm0.038'')\end{align*}
The one-year proper motion for each candidate is: $ 0.005''\pm0.002'', 0.006''\pm0.002'', 0.006''\pm0.002''$
for BD04, BD26, and BD27, respectively. Transverse velocities can be calculated by this equation
$ 0.005''\pm0.002'', 0.006''\pm0.002'', 0.006''\pm0.002''$
for BD04, BD26, and BD27, respectively. Transverse velocities can be calculated by this equation $v_T = 4.74\,{\unicode{x03BC}} D$
, where
$v_T = 4.74\,{\unicode{x03BC}} D$
, where $v_T$
is the transverse velocity in km s
$v_T$
is the transverse velocity in km s $^{-1}$
,
$^{-1}$
, $\mu$
is proper motion in arcsec year
$\mu$
is proper motion in arcsec year $^{-1}$
, and D is the distance in pc. Adopting the distances and uncertainties derived from Sonora-Bobcat’s MCMC fitting results, we derived the transverse velocities for each candidate:
$^{-1}$
, and D is the distance in pc. Adopting the distances and uncertainties derived from Sonora-Bobcat’s MCMC fitting results, we derived the transverse velocities for each candidate: $12\pm 5$
,
$12\pm 5$
, $12\pm 4$
, and
$12\pm 4$
, and $17\pm 6$
km s
$17\pm 6$
km s $^{-1}$
for BD04, BD26, and BD27, respectively. The brown dwarfs at 20 pc have tangential velocities peak at 20 km s
$^{-1}$
for BD04, BD26, and BD27, respectively. The brown dwarfs at 20 pc have tangential velocities peak at 20 km s $^{-1}$
(Kirkpatrick et al. Reference Kirkpatrick2021), which is larger than our candidates. The small transverse velocities imply they are thin disk populations.
$^{-1}$
(Kirkpatrick et al. Reference Kirkpatrick2021), which is larger than our candidates. The small transverse velocities imply they are thin disk populations.
5.4 Number density
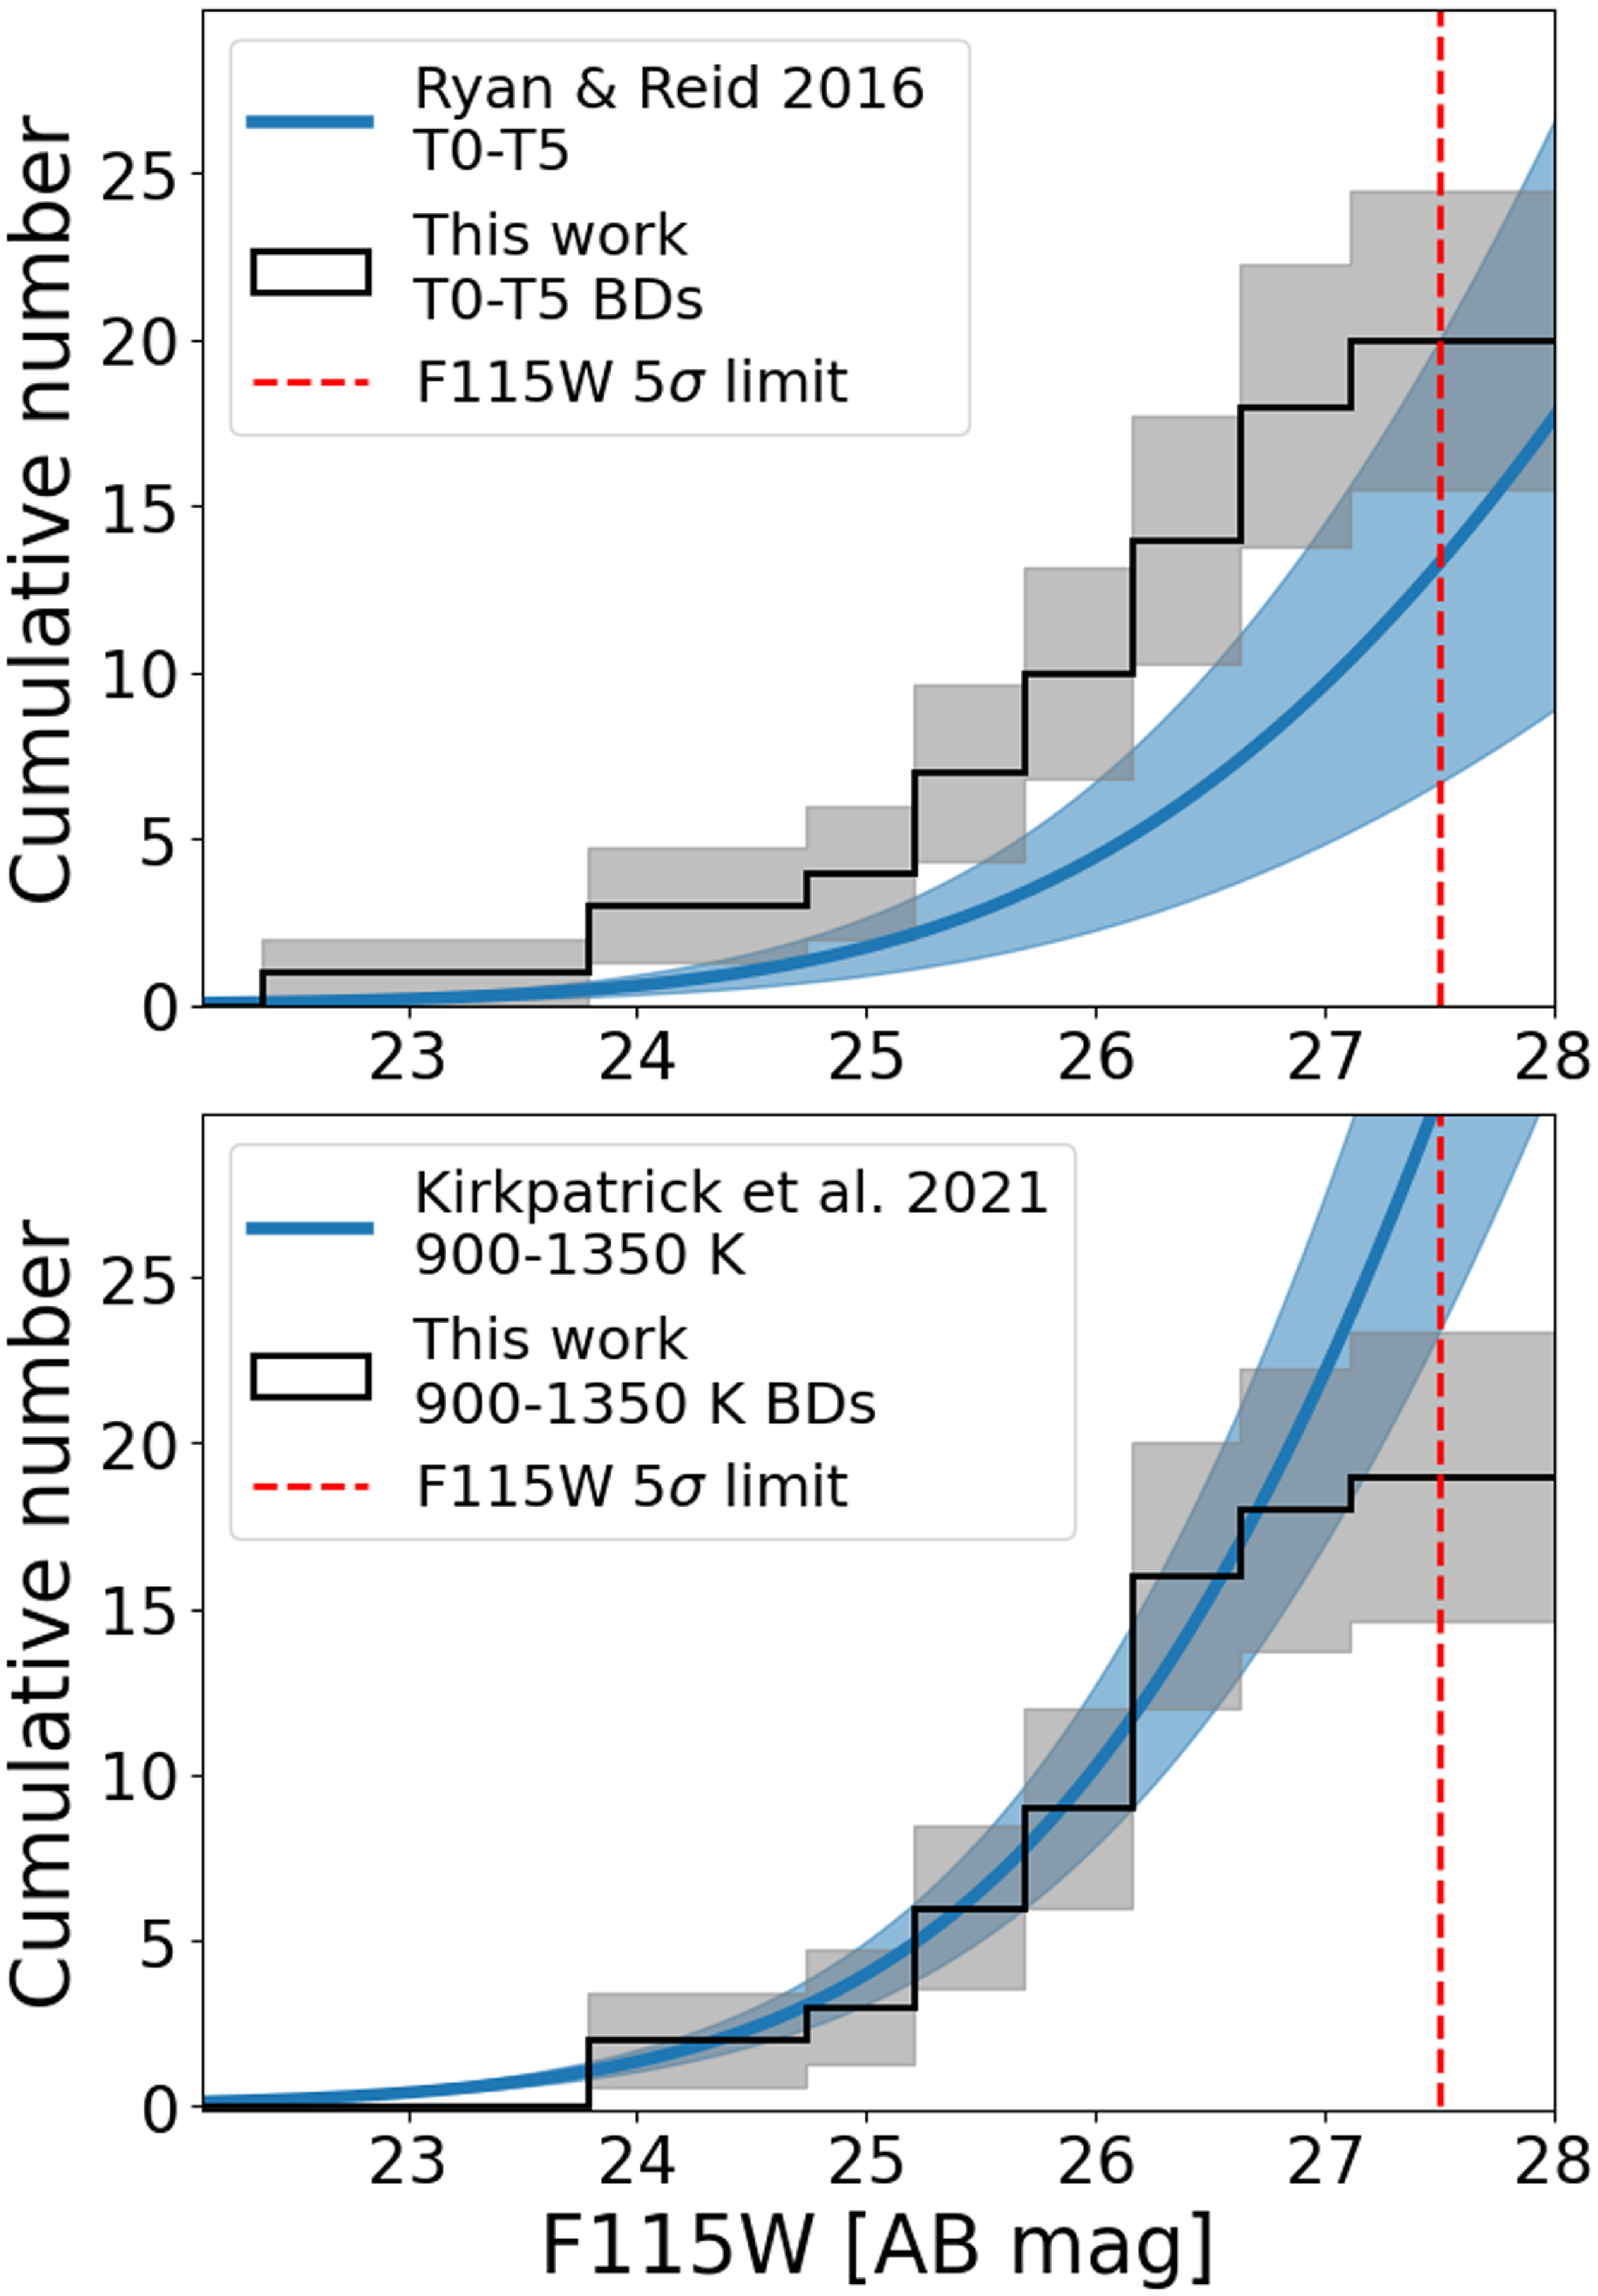
Ryan & Reid (Reference Ryan2016) predicted the number density of T0–T5 dwarf in the COSMOS-Web field based on the brown dwarf luminosity function from Cruz et al. (Reference Cruz2007), Bochanski et al. (Reference Bochanski, Hawley, Covey, West, Neill Reid, Golimowski and Ivezic2010), Metchev et al. (Reference Metchev, Davy Kirkpatrick, Bruce Berriman and Looper2008). They assumed the double exponential model for the spatial distribution of brown dwarfs and derived the predicted number count by integrating the number density and luminosity function. The uncertainty of the number count is not provided; therefore, we directly adopt the errors of the T0–T5 dwarfs’ luminosity function as the number count error. Given the F115W 5 $\sigma$
detection limit 27.45, the expected number is
$\sigma$
detection limit 27.45, the expected number is $0.015\pm0.009$
T0–T5 dwarfs per arcmin
$0.015\pm0.009$
T0–T5 dwarfs per arcmin $^2$
, which is
$^2$
, which is $13.1\pm7.9$
T0–T5 dwarfs in our 0.243 deg
$13.1\pm7.9$
T0–T5 dwarfs in our 0.243 deg $^2$
searching area. If we adopt the spectral fitting results and assume Poisson distribution, the total number of T0–T5 dwarfs will be
$^2$
searching area. If we adopt the spectral fitting results and assume Poisson distribution, the total number of T0–T5 dwarfs will be $20\pm 4.5$
. We also show the cumulative number count histogram in the upper panel of Fig. 8.
$20\pm 4.5$
. We also show the cumulative number count histogram in the upper panel of Fig. 8.
Cumulative number count against F115W magnitude. Upper panel: The black histogram shows the cumulative number count of T0–T5 candidates in this search. The grey region is one $\sigma$
error assuming Poisson distribution. The blue curve is the model prediction from Ryan & Reid (Reference Ryan2016). The red dashed line represents the 5
$\sigma$
error assuming Poisson distribution. The blue curve is the model prediction from Ryan & Reid (Reference Ryan2016). The red dashed line represents the 5 $\sigma$
detection limit of F115W. Lower panel: The black histogram is the cumulative number count of 900–1 350 K brown dwarf candidates in this search. These candidates are selected based on the peak
$\sigma$
detection limit of F115W. Lower panel: The black histogram is the cumulative number count of 900–1 350 K brown dwarf candidates in this search. These candidates are selected based on the peak $T_{\text{eff}}$
value from Sonora-Bobcat’s MCMC fitting results. The blue curve is the prediction scaled from Kirkpatrick et al. (Reference Kirkpatrick2021)’s measurement. The red dashed line represents the 5
$T_{\text{eff}}$
value from Sonora-Bobcat’s MCMC fitting results. The blue curve is the prediction scaled from Kirkpatrick et al. (Reference Kirkpatrick2021)’s measurement. The red dashed line represents the 5 $\sigma$
detection limit of F115W.
$\sigma$
detection limit of F115W.
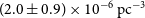
Here, we present another method to compare our results with those of the nearby observation and the model. We calculate the number densities of brown dwarf candidates in 3 effective temperature bins, 900–1 050, 1 050–1 200, and 1 200–1 350 K. There are $5\pm2.2$
dwarfs in
$5\pm2.2$
dwarfs in $T_{\text{eff}}$
range 900–1 050 K,
$T_{\text{eff}}$
range 900–1 050 K, $3\pm 1.7$
dwarfs in
$3\pm 1.7$
dwarfs in $T_{\text{eff}}$
range 1 050–1 200 K, and
$T_{\text{eff}}$
range 1 050–1 200 K, and $11\pm4.3$
dwarfs in
$11\pm4.3$
dwarfs in $T_{\text{eff}}$
range 1 200–1 350 K. Next, we estimate the search volume to calculate the density. Since only the Sonora-Bobcat model does not have multiple solutions in MCMC fitting, we only adopt SEDs and the distances derived from this model. We use
$T_{\text{eff}}$
range 1 200–1 350 K. Next, we estimate the search volume to calculate the density. Since only the Sonora-Bobcat model does not have multiple solutions in MCMC fitting, we only adopt SEDs and the distances derived from this model. We use $T_{\text{eff}}=1\,300$
K Sonora-Bobcat model to calculate detection limits for our search. To match the colour criterion Equation (2), the 5
$T_{\text{eff}}=1\,300$
K Sonora-Bobcat model to calculate detection limits for our search. To match the colour criterion Equation (2), the 5 $\sigma$
detection limit of F227W
$\sigma$
detection limit of F227W $=28.28$
implies the magnitude limit of F444W to find a brown dwarf is 27.38. We convert the F444W magnitude limit to the search limits of the 1 300 K model, which is 4 670 pc. The number densities are:
$=28.28$
implies the magnitude limit of F444W to find a brown dwarf is 27.38. We convert the F444W magnitude limit to the search limits of the 1 300 K model, which is 4 670 pc. The number densities are: $(2.0\pm0.9) \times10^{-6}\text{ pc}^{-3}$
for 900–1 050 K dwarf,
$(2.0\pm0.9) \times10^{-6}\text{ pc}^{-3}$
for 900–1 050 K dwarf,
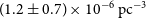
 $(1.2\pm0.7) \times10^{-6}\text{ pc}^{-3}$
for 1 050–1 200 K dwarf, and
$(1.2\pm0.7) \times10^{-6}\text{ pc}^{-3}$
for 1 050–1 200 K dwarf, and
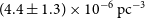
 $(4.4\pm1.3) \times10^{-6}\text{ pc}^{-3}$
for 1 200–1 350 K dwarf. The number densities of brown dwarfs measured by Kirkpatrick et al. (Reference Kirkpatrick2021) at 20 pc are:
$(4.4\pm1.3) \times10^{-6}\text{ pc}^{-3}$
for 1 200–1 350 K dwarf. The number densities of brown dwarfs measured by Kirkpatrick et al. (Reference Kirkpatrick2021) at 20 pc are: $(1.72\pm0.30) \times10^{-3}\text{ pc}^{-3}$
for 900–1 050 K dwarf,
$(1.72\pm0.30) \times10^{-3}\text{ pc}^{-3}$
for 900–1 050 K dwarf, $(1.11\pm0.25) \times10^{-3}\text{ pc}^{-3}$
for 1 050–1 200 K dwarf, and
$(1.11\pm0.25) \times10^{-3}\text{ pc}^{-3}$
for 1 050–1 200 K dwarf, and $(1.95\pm0.30) \times10^{-3}\text{ pc}^{-3}$
for 1 200–1 350 K dwarf. The distribution of brown dwarfs is not uniform among the Milky Way, so densities by Kirkpatrick et al. (Reference Kirkpatrick2021) are 3 orders of magnitude higher than those in this work.
$(1.95\pm0.30) \times10^{-3}\text{ pc}^{-3}$
for 1 200–1 350 K dwarf. The distribution of brown dwarfs is not uniform among the Milky Way, so densities by Kirkpatrick et al. (Reference Kirkpatrick2021) are 3 orders of magnitude higher than those in this work.
To give a reasonable comparison, we replace the number densities that Ryan & Reid (Reference Ryan2016) used with Kirkpatrick et al. (Reference Kirkpatrick2021)’s densities. T0–T5 brown dwarfs have a $T_{\text{eff}}$
range similar to 900–1 350 K (Kirkpatrick et al. Reference Kirkpatrick2021, Figure 22(b)), so we scale the T0–T5 number density with 900–1 350 K number density to get a cumulative number count for 900–1 350 K brown dwarfs. T0–T5 number density is derived by integrating Ryan & Reid (Reference Ryan2016)’s brown dwarf luminosity function in the T0–T5 range. By scaling Ryan & Reid (Reference Ryan2016)’s result with Kirkpatrick et al. (Reference Kirkpatrick2021)’s measurement, we plot the cumulative number count histogram of our 900–1 350 K brown dwarf candidates with the scaled double exponential model in the lower panel of Fig. 8. The brown dwarf candidates in the histogram are selected based on the peak
$T_{\text{eff}}$
range similar to 900–1 350 K (Kirkpatrick et al. Reference Kirkpatrick2021, Figure 22(b)), so we scale the T0–T5 number density with 900–1 350 K number density to get a cumulative number count for 900–1 350 K brown dwarfs. T0–T5 number density is derived by integrating Ryan & Reid (Reference Ryan2016)’s brown dwarf luminosity function in the T0–T5 range. By scaling Ryan & Reid (Reference Ryan2016)’s result with Kirkpatrick et al. (Reference Kirkpatrick2021)’s measurement, we plot the cumulative number count histogram of our 900–1 350 K brown dwarf candidates with the scaled double exponential model in the lower panel of Fig. 8. The brown dwarf candidates in the histogram are selected based on the peak $T_{\text{eff}}$
value from Sonora-Bobcat’s MCMC fitting results. We find the temperature-based selections are more consistent with the model than the spectral type-based selections. The discrepancy in the cumulative number count of T0–T5 from the model might come from the inaccurate spectral type fitting, in which we only use two photometry data points for most of the sources. Four photometry information are used to fit the
$T_{\text{eff}}$
value from Sonora-Bobcat’s MCMC fitting results. We find the temperature-based selections are more consistent with the model than the spectral type-based selections. The discrepancy in the cumulative number count of T0–T5 from the model might come from the inaccurate spectral type fitting, in which we only use two photometry data points for most of the sources. Four photometry information are used to fit the $T_{\text{eff}}$
, so the 900–1 350 K cumulative number count is more precise. The lower panel of Fig. 8 also shows that our brown dwarf distribution is consistent with the double exponential model. However, both comparisons we present in Fig. 8 suffer from small number statistics. Larger survey data are needed to confirm this result.
$T_{\text{eff}}$
, so the 900–1 350 K cumulative number count is more precise. The lower panel of Fig. 8 also shows that our brown dwarf distribution is consistent with the double exponential model. However, both comparisons we present in Fig. 8 suffer from small number statistics. Larger survey data are needed to confirm this result.
6. Conclusion
Using the JWST COSMOS-Web DR0.5 field (0.243 deg $^2$
), we search for distant, faint brown dwarf candidates. To capture H
$^2$
), we search for distant, faint brown dwarf candidates. To capture H $_2$
O absorption around 2.7
$_2$
O absorption around 2.7 ${\unicode{x03BC}}$
m, we select point sources (CLASS_STAR, FLUX_RADIUS, and SPREAD_MODEL criteria, Equations 3–10) with colours
${\unicode{x03BC}}$
m, we select point sources (CLASS_STAR, FLUX_RADIUS, and SPREAD_MODEL criteria, Equations 3–10) with colours $\text{F115W}-\text{F277W}+1 \lt \text{F277W}-\text{F444W}$
and F277W-F444W>0.9 as brown dwarf candidates. We perform SED fitting and MCMC simulations with three brown dwarf models to determine their physical properties and associated uncertainties. Our main findings are:
$\text{F115W}-\text{F277W}+1 \lt \text{F277W}-\text{F444W}$
and F277W-F444W>0.9 as brown dwarf candidates. We perform SED fitting and MCMC simulations with three brown dwarf models to determine their physical properties and associated uncertainties. Our main findings are:
• Based on the SED fitting results, we found 25 T-dwarf and 2 Y-dwarf candidates.
• The distances of these brown dwarf candidates range from 0.3 to 4 kpc, with an effective temperature range of 700–1 500 K.
• The observed cumulative number counts at kpc scales look consistent with those from the solar neighbourhood in Kirkpatrick et al. (Reference Kirkpatrick2021). However, this is based on the small number statistics and needs to be confirmed with the larger survey data.
• The number densities we measured are $(2.0\pm0.9) \times10^{-6}\text{pc}^{-3}$
for 900–1 050 K dwarf,
$(2.0\pm0.9) \times10^{-6}\text{pc}^{-3}$
for 900–1 050 K dwarf, $(1.2\pm0.7) \times10^{-6}\text{pc}^{-3}$
for 1 050–1 200 K dwarf, and
$(1.2\pm0.7) \times10^{-6}\text{pc}^{-3}$
for 1 050–1 200 K dwarf, and $(4.4\pm1.3) \times10^{-6}\text{pc}^{-3}$
for 1 200–1 350 K dwarf.
$(4.4\pm1.3) \times10^{-6}\text{pc}^{-3}$
for 1 200–1 350 K dwarf.
We discover distant and faint brown dwarfs that have never been seen before, which are located in the Galactic thick disk. By identifying more distant brown dwarfs, their characteristics and the low-mass part of the stellar mass function can be probed at greater distances. These brown dwarf candidates are exciting targets for the JWST NIRSpec spectroscopy. With NIRSpec’s 1–5 ${\unicode{x03BC}}$
m spectra, the physical properties of these brown dwarf candidates can be probed more precisely.
${\unicode{x03BC}}$
m spectra, the physical properties of these brown dwarf candidates can be probed more precisely.
Acknowledgement
We would like to express our deepest appreciation to the anonymous referee for the comprehensive and thoughtful review of our manuscript. Their detailed examination and insightful suggestions have played a crucial role in refining our work, and the constructive feedback has greatly enhanced the overall quality and clarity of the paper. AC acknowledges the Taiwan Astronomical ObserVatory Alliance (TAOvA) grant NSTC113-2740-M008-005 for the summer student internship in partial financial support of this research. TG acknowledges the support of the National Science and Technology Council of Taiwan through grants 108-2628-M-007-004-MY3, 110-2112-M-005-013-MY3, 111-2112-M-007-021, 111-2123-M-001-008-, 112-2112-M-007-013, 112-2123-M-001-004-, 113-2112-M-007 -006 -, 113 -2927-I-007 -501 -, and 113-2123-M-001 -008 -. TH acknowledges the support of the National Science and Technology Council of Taiwan through grants 110-2112-M-005 -013 -MY3, 113-2112-M-005-009-MY3, 110-2112-M-007-034-, and 113-2123-M-001-008-. SH acknowledges the support of the Australian Research Council (ARC) Centre of Excellence (CoE) for Gravitational Wave Discovery (OzGrav) project numbers CE170100004 and CE230100016, and the ARC CoE for All Sky Astrophysics in 3 Dimensions (ASTRO 3D) project number CE170100013.
This research has made use of the SVO Filter Profile Service ‘Carlos Rodrigo’, funded by MCIN/AEI/10.13039/501100011033/ through grant PID2020-112949GB-I00. This work is based on observations made with the NASA/ESA/CSA James Webb Space Telescope. The data were obtained from the Mikulski Archive for Space Telescopes at the Space Telescope Science Institute, which is operated by the Association of Universities for Research in Astronomy, Inc., under NASA contract NAS 5-03127 for JWST. These observations are associated with the program ERO. This research has made use of the NASA/IPAC Infrared Science Archive, which is funded by the National Aeronautics and Space Administration and operated by the California Institute of Technology. This research has benefitted from the SpeX Prism Spectral Libraries, maintained by Adam Burgasser at http://www.browndwarfs.org/spexprism
This work used high-performance computing facilities operated by the Center for Informatics and Computation in Astronomy (CICA) at National Tsing Hua University. This equipment was funded by the Ministry of Education of Taiwan, the National Science and Technology Council of Taiwan, and the National Tsing Hua University.
Data availability statement
The JWST/NIRCam COSMOS-Web DR0.5 are publicly available at https://cosmos.astro.caltech.edu/page/cosmosweb-dr.


 Open access