


Introduction
Women's severe and systematic under‐representation in politics is well documented. However, it is less clear which factors contribute to this pattern (Celis & Erzeel, Reference Celis, Erzeel, Rohrschneider and Thomassen2020). A growing literature focuses on the impact of candidate selection processes on women's under‐representation (e.g., Franceschet, Reference Franceschet2005; Norris & Lovenduski, Reference Norris and Lovenduski1995). Following this research, we explore how political elites influence gendered candidate selection and rank female candidates on party lists in a proportional electoral system using a controlled experimental setting. In doing so, we acknowledge both the central role of party elites in the candidate selection process (Hazan & Rahat, Reference Hazan and Rahat2010) as well as the centrality of electoral institutions for women's political representation (e.g., Krook, Reference Krook, Herron, Pekkanen and Shugart2018). Specifically, we offer a first systematic glance into the preferences of party elites for composing and balancing party lists under proportional representation (PR) by analysing how they select and rank women candidates while accounting for their backgrounds.
Our paper makes several contributions to the existing literature. While most experimental studies on candidate selection and gender focus on the US case or plurality electoral systems (e.g., Doherty et al., Reference Doherty, Dowling and Miller2019; Teele et al., Reference Teele, Kalla and Rosenbluth2018), we examine two distinct mechanisms of and strategic considerations for candidate selection under PR (Krook, Reference Krook2010). Specifically, we explore both channels – the selection and ranking of women on party lists – that may be associated with the greater representation of women in PR systems (Lühiste, Reference Lühiste2015).
Second, our experimental approach addresses an important limitation of observational and prior experimental candidate selection studies.Footnote 1 Most studies merely observe the final list without observing who sought a nomination but failed (Dal Bó et al., Reference Dal Bó, Finan, Folke, Persson and Rickne2017, pp. 1878–1879; Ashe Reference Ashe2019, p. 35). Observational studies, hence, cannot address how the supply of female candidates influences their selection. Our experiment overcomes this by presenting respondents with random variation in the supply of female candidates. Moreover, while the findings of a nomination bonus for women reported in previous experimental studies on candidate selection are at odds with the continuation of real‐world under‐representation (e.g., Teele et al., Reference Teele, Kalla and Rosenbluth2018), our experimental approach allows us to observe a more nuanced picture of party elites' preferences for the nomination of women. This nuanced picture – in conjunction with the electoral system – helps to explain the continuing imbalances in parliament in general and, specifically, why the share of female lawmakers of the Austrian People's Party (ÖVP) in 2019 stands at 36.7 per cent despite having 51 per cent women on their party lists and employing more gender zippa quotas – that is, list positions alternating between the genders – than any other party.
Third, our novel two‐stage conjoint experiment mimics the candidate selection process under PR closer than traditional conjoint experiments. The typical conjoint usually resembles the selection process under plurality where two aspirants compete for a single nomination (e.g., Bansak et al., Reference Bansak, Hainmueller, Hopkins, Yamamoto, Green and Druckman2021b). In contrast, we provide party elites with the profiles of nine aspirants competing for six list positions. In addition, the experiment consists of two stages in which the respondents first deselect three aspirants and then, in the second stage, rank the remaining six candidates to list positions. Although no experiment fully replicates the complexity of the selection process, this design allows for analysing both mechanisms of nominations under PR, that is, the selection and the ranking of candidates. Moreover, it allows us to examine not only individual candidate attributes but also how the pool of potential candidates influences how selectors choose candidates, compose lists and ‘balance the ticket’ (Gallagher, Reference Gallagher, Gallagher and Marsh1988, p. 267). For this balancing, we propose to analyse two distinct list properties, particularly the preference for zipper rankings by our respondents and our female ranking index (FRI), measuring the overall female friendliness of the list composition.
Finally, by simulating the share of women in parliament for each party based on different ranking patterns, we can further show that gender‐zipper quotas may not necessarily lead to parliamentary gender parity, and – applied consistently – may lead to drastic over‐ or under‐performance with respect to women's representation due to many low party magnitude districts. Our proposed solution for the Austrian case would involve alternating male‐led and female‐led zipper quotas across the 49 electoral districts, which would optimize gender representation.
To the best of our knowledge, ours is the first experimental study on the gendered dimension of selection and ranking on party lists from a pool of aspirants under PR. We conducted our experiment with more than 300 party elites from the five major parties in Austria, a proportional system comparable to many other PR systems in its provisions for a weak preference vote – that is, Norway or the Netherlands – and rather low‐ to medium‐magnitude districts – that is, Spain, Hungary or Costa Rica (see also, Carey & Hix, Reference Carey and Hix2011). The usage of personalized party addresses and respondents' answers to open‐ended questions lend credibility that elites and not their staff have answered our survey. Our experiment provides a controlled setting that allows us to analyse party elites' strategies and preferences for balancing list composition and ranking candidates on party lists. Describing these patterns is exploratory. However, we also develop and test a number of hypotheses relating to the supply of women and the impact of party elites' characteristics on the selection of female candidates.
We provide clear evidence of gendered candidate selection and list composition patterns. Consistent with previous research (e.g., Rehmert, Reference Rehmert2022), we too find a female advantage in the selection process. On average, women are more likely to be selected and ranked high on the party list. Moreover, this bonus is amplified when the supply of female candidates is low. However, selectors' same‐sex preferences influence this ranking bonus, which crucially affects the capolista, that is, the top‐ranked candidate. These findings have implications for the study of candidate selection and understanding of the effectiveness of gender quotas. For one, our findings underscore the need to account for the pool of potential candidates when studying candidate selection. Second, it shows how same‐sex preferences sabotage gender zipper quotas when combined with low‐magnitude PR districts that elect only one candidate for a party.
Candidate nomination and electoral systems
Women's descriptive representation tends to be higher in PR systems than in plurality ones (see, e.g., Gallagher, Reference Gallagher, Gallagher and Marsh2005; Matland, Reference Matland2005; Norris, Reference Norris2000; Rosen, Reference Rosen2013). However, scholars also highlight the large variation in the representation of women across PR systems (e.g., Salmond, Reference Salmond2006; see also Online Appendix Section B), pointing towards the relevance of nomination processes for understanding descriptive representation. Below, we first emphasize how the logic of candidate nominations in PR systems differs from plurality systems, before presenting the two distinct mechanisms of nominations under PR and formulating hypotheses on how these mechanisms relate to the nomination of women under PR.
The logic of candidate nominations under proportional and plurality systems
We can distinguish two fundamentally different logics of candidate nomination in plurality and PR electoral systems (Buisseret et al., Reference Buisseret, Folke, Prato and Rickne2022, pp. 714–715). Plurality systems, which are most often studied when party elites' preferences are assessed (Doherty et al., Reference Doherty, Dowling and Miller2019; Teele et al., Reference Teele, Kalla and Rosenbluth2018), incentivize nominating the candidate that party elites consider most capable of winning the district. Typically, candidate suitability is assessed in each electoral district in isolation from nominations in adjacent districts and selectors have the incentive to make their nominations under vote‐maximizing considerations – much more so than in list‐based systems. In other words, the logic of candidate nomination is straightforward and dichotomous under plurality: a potential candidate is either nominated or not, and only one person is nominated.
Under PR, this logic is fundamentally different. Here, party elites have to nominate multiple candidates to their party list. Accordingly, party elites have to make two decisions: they have to select candidates for the party list (selection) and, second, decide on the specific list position (ranking) for each. Furthermore, while party elites under plurality rule make their nomination decision for their electoral district typically in isolation from decisions in neighbouring districts, decisions for the selection and ranking of candidates under PR are typically interdependent and potential candidates are evaluated not in isolation but how well they fit into the overall slate of candidates. Common metaphors for candidate nomination under the proportional rule are ‘running as a team’ (Tremblay, Reference Tremblay2012, p. 7) or ‘balancing the ticket’ (Gallagher, Reference Gallagher, Gallagher and Marsh1988, p. 267).
These different facets of candidate nominations under PR have implications for the nomination of women, allowing us to develop a number of theoretical expectations. As Rule (Reference Rule1994, p. 699; emphasis in original) argues with regard to PR systems, ‘political parties have an incentive to place women on their respective lists to broaden their appeal’. Even when assuming that selectors are biased against women, they would have no incentive to compose a party list consisting only of men; such lists would rarely reflect parties' demographic membership and would be highly unattractive for female voters. While this explains why PR systems might be systematically more favourable for female candidates than plurality systems, it does not directly answer whether women's selection and ranking patterns are systematically different from male candidates in PR systems. Existing theoretical as well as empirical work on gender biases does not offer a clear picture. First, women's observed under‐representation on candidate lists or in parliament might be caused by discrimination of party elites (e.g., Norris & Lovenduski, Reference Norris and Lovenduski1995). In such a case, we would expect party elites to select and rank male candidates to higher list positions. However, much of the recent empirical literature on elite preferences in candidate selection finds no evidence of direct discrimination against women. These studies find that party elites have similar preferences for selecting male and female candidates (Kalla et al., Reference Kalla, Rosenbluth and Teele2018; Rehmert, Reference Rehmert2022; Teele et al., Reference Teele, Kalla and Rosenbluth2018). Some even find that women might be on average preferred to male candidates, potentially for two reasons. First, party elites might overcompensate or overcorrect for past imbalances when given the opportunity and thereby improving the party's image and increasing its appeal to women voters (Clayton et al., Reference Clayton, O'Brien and Piscopo2017; Weeks et al., Reference Weeks, Meguid, Kittilson and Coffé2022). Second, they may subconsciously assume that women who have made it this far in the selection process to be of greater quality when compared to otherwise comparable men (Piscopo, Reference Piscopo2019).Footnote 2 Consequently, one could also expect that party elites do not discriminate against female candidates or even show a preference for them. These arguments apply to both, the selection and ranking of female candidates under PR. In both cases, gender imbalances in selectors' preferences would be consequential. If women are less (or more) likely than men to be selected, gender parity on lists becomes unlikely. However, gender parity on lists is less relevant when ranking patterns systematically benefit one gender. Following these arguments, we can formulate three competing hypotheses regarding women candidates' average selection and ranking probability:
-
• H1a: Female aspirants are on average less likely to be selected and ranked to favourable list positions than male aspirants.
-
• H1b: Female and male aspirants are just as likely to be selected and ranked to favourable list positions.
-
• H1c: Female aspirants are on average more likely to be selected and ranked to favourable list positions than male aspirants.
Formulating a clear theoretical expectation hence is challenging. However, we argue that the selection and ranking of female candidates can be better predicted if certain conditions apply. Specifically, we formulate three conditional hypotheses. First, party elites can only select and rank potential candidates who come forward and seek nominations (e.g., Lawless & Fox, Reference Lawless and Fox2010). Previous studies have highlighted that various factors – including gendered political socialization or institutions, etc. – suppress women's ambition for office (e.g., Norris & Lovenduski, Reference Norris and Lovenduski1993, pp. 390–391). Thus, assuming party elites are willing to select women candidates, they would still fail if women do not come forward. Precisely for this potentially low number of women among the potential candidates, party elites should value the few women seeking nominations higher and rank them high on the party list. In this way, they maximize the likelihood that at least some women are elected to parliament even if they do not reach numerical gender parity. In other words, they minimize the probability of ending up with a candidate list on which women are strongly under‐represented or even completely absent. Therefore, we formulate our second hypothesis as follows:
-
• H2: Female aspirants are more likely to be selected and placed on favourable list positions the fewer women are in the pool of potential candidates.
Second, we focus on the effect of a party elite's own gender. Existing research has identified gender‐homophilic preferences and gendered patterns of recruitment (Bjarnegård, Reference Bjarnegård2013; Verge & Claveria, Reference Verge and Claveria2018) as another important dimension of women's under‐representation – party elites tend to prefer candidates of their own gender. Thus, male selectors should preferably select male, and female selectors, female candidates. Such homophilic preferences can be particularly relevant when it comes to the ranking of candidates to favourable list positions, most clearly the prestigious top position (Folke et al., Reference Folke, Persson and Rickne2016). As implied by our previous discussion, gender effects in candidate nominations under PR might be less pronounced as multiple positions on the list are available. However, homophilic preferences can manifest themselves in the ranking of candidates on the list as there is only one head of the list. Even party selectors who focus on gender balance in candidate nomination – for example, by following a gender zipper ranking – have to decide whether a man or a woman is at the top of the list. Therefore, our final hypothesis states that
-
• H3: Female party elites are more likely to select a female candidate to the top list position and male party elites are more likely to nominate a male candidate to the top.
Finally, we focus on ideology. Gender equality and the instruments to achieve it have increasingly been politicized. In particular, the radical‐right is usually strongly opposed to any positive action measures to address imbalances. In contrast, left‐wing progressive parties put much emphasis on creating a gender‐balanced parliament and are usually in favour of implementing measures, such as the introduction of gender quotas. Thus, attitudes towards women's representation are strongly affected by ideology and structured along the left‐right continuum. Given that left‐wing progressive parties are often willing to actively promote women, we expect that their party selectors are more likely to select and favourably rank female candidates. For right‐wing party elites, it remains unclear whether they will actively oppose female candidates or whether there are no observable differences in their selection patterns between male and female candidates. Our fourth and final hypothesis is thus
-
• H4: Left‐wing party leaders will be more likely to select and favourably rank female aspirants.
Context: Gender nomination patterns in the Austrian PR system
To examine our hypotheses, we focus on Austria for several reasons. First, as a purely proportional system using party lists, parties' selectorates determine which candidates have the best chances of being elected, despite its preference vote provisions. Second, Austria does not have state‐mandated gender quotas, though some parties have adopted voluntary provisions for gender representation (Ahrens et al., Reference Ahrens, Chmilewski, Lang and Sauer2020, pp. 29–36). This variation constitutes the most likely case for our hypothesis on selection.Footnote 3 Third, the three‐layered system comes with a large pool of party elites and potential respondents, helping us to hedge against low response rates. Finally, Austria with its large number of low‐ and medium‐magnitude districts (median of 5) and rather weak provision for preference votes is comparable to many other list‐based systems such as Spain (median of 5) or Norway (median of 8).
The Austrian electoral system – in place since 1992 – is quite complex. It combines a total of 49 PR districts using flexible party lists with seat allocation over three tiers. The 183 Nationalrat seats are distributed over the nine regions (i.e., Bundesländer) of Austria in accordance with their population. Each regional district is further subdivided into two to seven local electoral districts. Each region's seat contingent is distributed across their local districts according to the latters' population sizes. Parties win mandates at this local level if their vote share surpasses the Hare quota calculated at the respective regional level. Seats not allocated at this first level are then allocated at the second tier, the regional districts, again in accordance with the region's district‐specific Hare quota. Any remaining seats enter the third round of allocation at the national level. As a consequence, parties typically devise lists for the 39 local, the nine regional, and the final federal PR districts, with huge personnel overlap to hedge against electoral uncertainty (Müller, Reference Müller, Gallager and Mitchell2005).
Although citizens can cast preference votes at all three levels, this has only rarely led to a meaningful change in the actual personnel taking a seat in the Nationalrat.Footnote 4 Oftentimes, it is the candidate with the most resources or already at the top who garners the party's most preference votes – which it is argued disadvantages women (e.g., Erzeel & Caluwaerts, Reference Erzeel and Caluwaerts2015). As Crisp et al. (Reference Crisp, Olivella, Malecki and Sher2013) have noted, flexible‐list systems are often closed‐list systems in disguise – and the most crucial influence over who will be elected rests with the candidate selectors of the parties.
Parties' selection processes reflect the complexity of the system and vary quite substantially also with respect to their institutional provisions for gender representation. Local and regional lists have a more decentralized selectorate compared to the compensatory federal list. It is typically the leadership of the regional party organization that either completely (e.g., the Freedom Party of Austria (FPÖ) or the ÖVP) or together with lower level party organs (e.g., Greens or the Social Democratic Party of Austria (SPÖ)) devise the local lists for the first round of seat allocations. Responsible for the regional lists are the respective regional party leaderships, partly in cooperation with the federal leadership as in the FPÖ or the (single) party leader in the ÖVP. Finally, the federal list is in the hands of the federal party leadership or party leader (ÖVP).Footnote 5
Specific stipulations to improve women's representation exist in the statutes of the Greens, the ÖVP and the SPÖ. On the federal list of the Greens, men may only compete for a rank if this nomination will not increase the share of men above 50 per cent on the list up to that rank. The ÖVP statute states that – if possible – lists should be balanced and follow a zipper system, a slight improvement of the 40 per cent target from the 2015 statute. The SPÖ introduced the first (voluntary) quota of 25 per cent in the 1980s, which has been raised to 40 per cent in 1993. With the 1998 statute, no gender should have fewer seats in any legislative (or party) body than 40 per cent, and replacements for retiring incumbents have to comply with this rule, too. Statutes of the FPÖ and NEOS – The New Austria (NEOS) – are mute on this topic.
Table A2 in Online Appendix Section E presents statistics on candidate gender, party lists and elected members of parliament (MPs) for the five parties in the parliament and for all tiers of the electoral system in 2019.Footnote 6 Unsurprisingly, the three parties with some form of gender quota – the Greens, ÖVP and SPÖ – have an almost perfect gender balance among their candidates and tend to employ a zipper ranking more often than the other parties. The table, however, only lists perfect zippers, which masks a much greater number of partial zipper lists. Oftentimes, only some parts but not the complete list alternate candidates by gender. Despite fielding the most zippers, the ÖVP still falls short of its own goal of gender parity in the Nationalrat. In the following sections, we explore whether the preferences of party elites for selecting and ranking women can shed light on these nomination patterns.
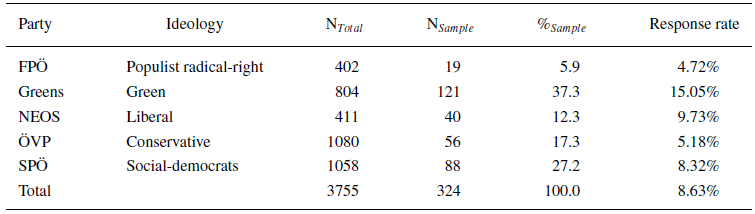
Sample
We collected the e‐mail addresses of 3755 party elites in Austria from official party websites and sent them an invitation to our survey.Footnote 7 Party elites are defined as members of the executive committee at one of the three layers of the Austrian system. While the specific procedures of candidate selection differ between parties, it is reasonable to assume that members of the party executive committee play a crucial role in the selection process, for example, by informally approaching potential candidates. We sent the survey out on 4 October 2021 and sent two reminders at the beginning of November and December. In total, we received 324 complete responses that are suitable for analysis (response rate of 8.6 per cent; see Table 1 for an overview).Footnote 8
Distribution of survey respondents

The final sample is, of course, not representative. This is a common problem for party elite surveys, and we ask readers to keep this in mind when interpreting the results. Most importantly, elites from left‐wing parties are over‐represented and, thus, some of our estimates might reflect the preferences of left‐wing parties disproportionally. Despite this imbalance, there is still a considerable number of right‐wing respondents in the sample which allows us to test our conditional hypotheses. Likewise, we have enough variation based on the gender of the respondent. Of the 3755 party elites that we approached, 34.9 per cent (N = 1309) are female. Among our respondents, the share of women is 30.56 per cent (N = 99) and thus largely proportional. Finally, we have good reason to believe that the responses do in fact stem from actual party elites and those involved in the selection process. First, we have collected personalized e‐mail addresses and not general office e‐mail addresses. Second, many elites involved in the selection process hail from lower regional levels and typically have no supporting staff (see also Table A4 in Online Appendix Section E for more information on respondents by Bundesland, party and electoral tier). Third, open questions at the end of the survey have generated quite extensive texts from 66 per cent of the respondents. We consider these insights and opinions as evidence for first‐hand experience with the respective party's selection process – an additional indicator for responses from actual selectors. Finally, Figure A6 in the Online Appendix suggests, that the respondents' self‐perceived actual impact on nomination decisions is quite high, too.
Two‐stage conjoint experiment
Conjoint experiments have become a standard toolkit in political science to analyse preferences in multi‐dimensional decision‐making problems (Bansak et al., Reference Bansak, Hainmueller, Hopkins, Yamamoto, Green and Druckman2021b). However, the standard design of presenting respondents with two hypothetical candidates competing for a single seat reflects the selection logic for plurality systems but does not fully capture the selection logic in list‐based PR systems.
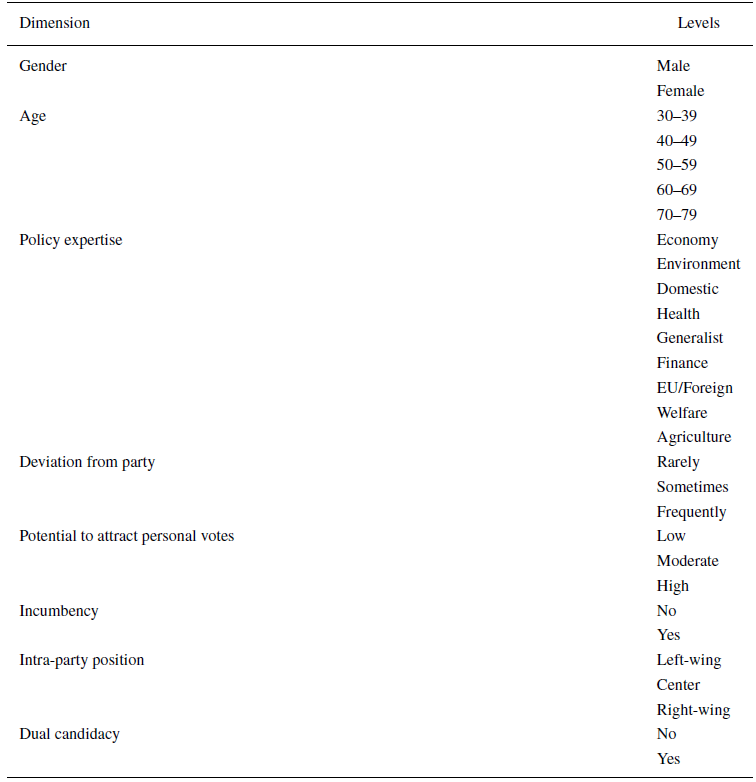
To overcome this limitation, we conducted a novel two‐stage conjoint experiment to better capture the complexity of candidate selection under PR. In the first stage, nine potential candidates (‘aspirants') are presented to the respondents. These aspirants differ on a set of attributes, which take on random pre‐defined values as listed in Table 2. We choose eight attributes, based on previous conjoint studies with party elites (Berz & Jankowski, Reference Berz and Jankowski2022; Rehmert, Reference Rehmert2022) – mainly indicators of candidate quality including incumbency, loyalty and ideological position – indicators taking the intricacies of the Austrian electoral system into account (potential to attract personal votes and dual candidacy)Footnote 9 and three attributes related to representation: age and gender (descriptive representation) and policy expertise (substantive representation).
Attributes and levels of the conjoint experiment

The order of the attributes was randomized between respondents and the attribute levels were fully randomized. In the first stage, respondents are asked to deselect three of these nine aspirants in a classic conjoint‐choice fashion. In other words, the respondents select six aspirants from the pool of nine. We call this stage the ‘(de‐)selection task’.Footnote 10 In the second stage, the six remaining profiles from the first stage are presented again and respondents had to nominate each profile to a list position. The respondents saw in real‐time how their list was filled up with the possibility of correct nominations. Periodic evidence from newspapers indicates that parties do in fact deselect their incumbents or sometimes restrict the length of their list similar to our design.Footnote 11 This ‘ranking task’ concluded the experiment. As our design is quite complex and to keep the survey short to minimize survey fatigue, we only conducted one conjoint task. In Online Appendix Section D, we display screenshots of both tasks from the experiment.
Our design improves over paired conjoint experiments for analysing candidate selection under PR in several ways. First, it deliberately allows respondents to select more than one candidate – the most important difference to selection in plurality systems. In addition, our experiment also introduces the crucial aspect of ranking the candidates to list positions. Consequently, our dependent variable can take on seven distinct values ranging from deselection to the selection onto one of the six list positions. Therefore, we can study the selection and ranking of women and additionally explore the patterns of list compositions, via the usage of zipper rankings and our FRI, which we explain in more detail below. Finally, due to the randomization, we have variation in the supply of female candidates and elites make their choice while being aware of who else is in the pool of potentials. As a consequence, we can also analyse how the overall supply of female candidates affects selection probabilities.
Importantly, neither our survey nor the experiment made the gender attribute salient. The survey invitation and the description of the experiment only stated that we were interested in the candidate selection process. All attributes presented in Table 2 were given equal weight in the description of the experiment and their order, as shown to the respondents, varied randomly. Also, we asked no additional questions in the survey which could indicate a particular research interest in the gender dimension. Thus, it is unlikely that the results are affected by demand effects or by priming the respondents to focus on the gender of the candidates in the experiment.
Results
The empirical analysis is split into two parts. First, we assess our hypotheses on the effect of aspirants’ gender on their individual probability of being selected and ranked on the party list. Second, we examine our hypotheses at the aggregate level by analysing overall list properties, such as the overall share of women on the list. This dual approach allows us to explore how individual‐level characteristics predict selection and ranking, and party elites' composite selection and ranking preferences as well.
Effects of gender on selection and list placement
First, we are interested in how aspirants' gender affects the probability of a certain outcome in the experiment.Footnote 12 The outcome can either be that the profile was deselected or one of the six listed positions. Thus, our outcome variable has seven categories: one category for each list position and a category for deselected aspirants. To estimate the causal effects, we use multinominal logistic regression in which the outcome of the experiment is the dependent variable and the conjoint attribute levels are the independent variables.Footnote 13 The full regression table is given in Online Appendix Section A5.Footnote 14
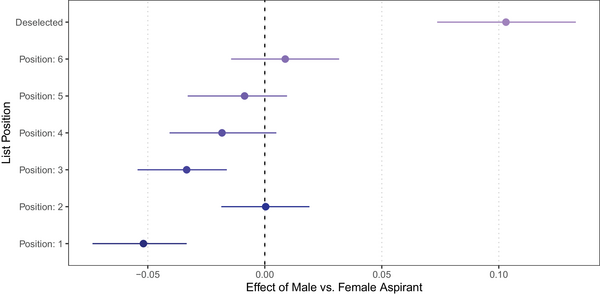
The effect of an aspirant's gender on the selection outcome is displayed in Figure 1. The x‐axis displays the effect for male aspirants, meaning that negative values indicate that males (females) have a lower (higher) probability of being selected for the respective position. The results are in line with studies that demonstrate a female advantage in experimental analyses of the candidate selection process (Schwarz & Coppock, Reference Schwarz and Coppock2022) and, thus, are consistent with our H1c while H1a (female disadvantage) and H1b (no gender effects) are not supported by the data. The probability of a male aspirant being selected to the first list position is 5 per cent lower compared to female aspirants. This advantage for female candidates is also present for the third, fourth and fifth positions although it gets weaker and is not always significant at $p < 0.05$. For the second list position, no gender effects can be observed, indicating perhaps a deliberate ranking pattern by (some) respondents for the two top list positions. The general advantage of female aspirants is also visible in the substantially higher probability of male aspirants being deselected at Stage 1 of the experiment. There is a 10 per cent higher probability for men to be deselected.
Effect of aspirant's gender on selection outcome.
Note: The x‐axis is the effect of a male profile on being selected to the respective position. For example, male aspirants are less likely to be selected to the first list position, but more likely to be deselected. Horizontal lines are 95 per cent confidence intervals. Effects are based on Model 1 in Online Table A5. Figure A19 in the Online Appendix shows predicted values.

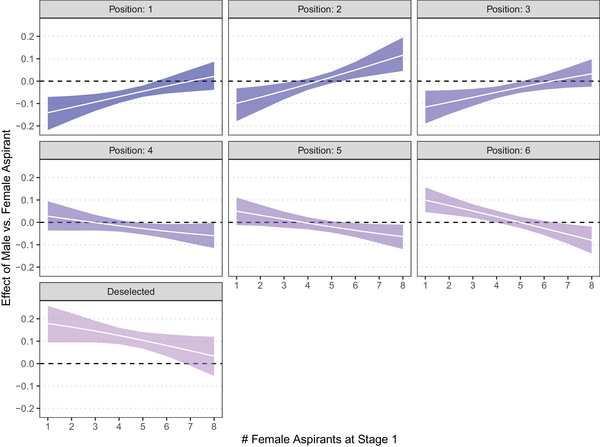
We test our second hypothesis by leveraging the random creation of profiles at the first stage, which creates variation in the supply of aspirants' gender. This allows us to analyse how selectors' preferences for candidates of a certain gender depend on the supply of female aspirants. We interact the aspirants' gender with the number of female aspirants at Stage 1 of the experiment. Figure 2 presents the results: a clear interaction between aspirants' gender and the total supply of female aspirants. When the supply of women is low, female aspirants have a clear and strong advantage over male candidates. For example, the selection probability for the first list position can be 15 per cent points higher for women when the supply of female candidates is low. This pattern clearly suggests that the respondents were aware of the low supply of female candidates and made sure that the few available women would have a high probability of being selected.
Effect of aspirant's gender on selection outcome conditional on supply of female aspirants.
Note: The y‐axis is the effect of ‘male’ on being selected to the respective position. Shaded areas are 95 per cent confidence intervals. Effects are based on Model 3 in Table A5. Figure A21 in the Online Appendix shows predicted values.

Interestingly, these patterns are not completely mirrored for the case of male aspirants and a high supply of female aspirants. For example, male aspirants do not benefit in the same way when their gender is low in supply. This advantage is only observed for the second list position, not the first. Thus, respondents appear to put a particularly strong emphasis on securing the nomination of women, less so on the nomination of male candidates. Overall, these findings suggest that the selection of candidates under PR follows a well‐known supply‐and‐demand logic where the price for certain goods increases when the supply is more scarce under stable demand, supporting our Hypothesis 2.
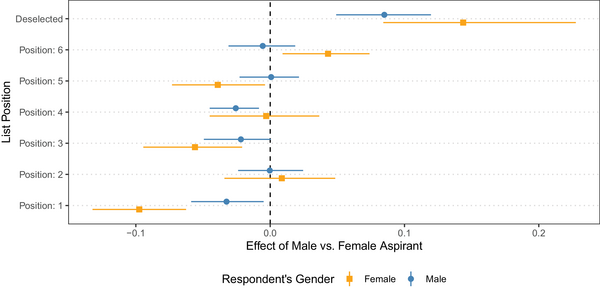
Next, we test our third hypothesis by interacting the respondent's gender with that of the profiles. Existing studies suggest that homophily leads to gendered patterns of selection in which female (male) selectors prefer female (male) candidates. As Figure 3 displays, there is clear evidence that female respondents prefer to select female aspirants to more favourable list positions. Especially for the first list position, a clear difference in the effects can be observed. However, the results do not indicate that male respondents prefer the selection of male aspirants. Instead, male respondents only show a weaker preference for the selection of female aspirants but the effect for male aspirants is still negative. Likewise, among both male and female respondents, the probability of deselecting male aspirants is much higher compared to female aspirants. This finding, thus, only partly supports our expectations of gender homophily. While female respondents show a stronger preference for women‐friendly selection and ranking patterns than male respondents, the latter do not seem to prefer male candidates over female candidates.
Effect of aspirant's gender on selection outcome conditional on the gender of respondents.
Note: The x‐axis is the effect of ‘male’ on being selected to the respective position. Horizontal lines are 95 per cent confidence intervals. Effects are based on Model 2 in Online Table A5. Figure A20 in the Online Appendix shows predicted values.

These findings allow for a quite comprehensive picture of candidate selection under PR. First, women seem to have an advantage in the experiment in the form of higher list positions and a lower likelihood of deselection. Second, supply matters for candidate selection. Selectors recognize the shortage of candidates and deliberately select candidates from groups with little supply to favourable list positions. This pattern is more pronounced for the selection of women than for the selection of men. Finally, the gender of the selectors matters but differently than expected. Women show higher preferences for female aspirants than men, but all show rather female‐friendly selection patterns.
With regard to these findings, one might ask for the role of respondents' ideology. Our H4 expects that especially left‐wing party elites are more likely to select female candidates. To examine this, we interact the aspirant's gender with the left‐right self‐placement of the respondents on a 10‐point scale (1 $=$ ‘very left’, 10 $=$ ‘very right'). The results are consistent with our hypothesis (see Figure A22 in Online Appendix Section I): Respondents leaning to the left are more likely to select female candidates to top list positions. For very left‐wing respondents, female aspirants have an approximately 10 per cent points higher probability of being selected to the first position compared to male aspirants. Moreover, the deselection of female aspirants is less likely for left‐wing respondents, resulting in a 20 per cent points higher likelihood for a man to be deselected. In contrast, we find no gender effects for right‐wing respondents.
Now, is this driven by left‐wing females and right‐wing males, confounding the homophily effect? To address this point, we ran the ideology analysis separately for male and female respondents. Due to the rather low number of respondents, this analysis should be taken with a grain of salt. We report the results in Online Appendix Section I. The results do not suggest that the gender of the respondents and the left‐right self‐placement strongly interact. The only tendency that can be observed is that left‐wing men tend to show very similar selection patterns compared to left‐wing women, while there seems to be a small gender gap among right‐wing respondents.
These conditional effects of gender and ideology are particularly noteworthy against the background of the left‐wing skewed sample. As the majority of our respondents come from rather left‐wing parties, the presented effects suggest that the positive effect for women would be weaker but still present in an ideologically representative sample.
List composition and gender
The previous section described the effects for individual list positions in line with our hypotheses. However, these analyses do not directly allow us to analyse how party elites compose their lists. While we have no specific hypotheses for such an analysis, our data allow us to explore respondents’ gendered list composition patterns. Therefore, in the following, we analyse how party elites compose their lists and which factors influence their list composition patterns. Specifically, we explore how female‐friendly the list composition at the aggregate level is and which respondents use zipper rankings. Admittedly, these analyses were not pre‐registered and have a more exploratory character.
Ranking of female candidates
To assess the overall female‐friendliness of respondents' nomination decisions, we compute an FRI. This index reflects how favourably a respondent ranked female candidates on the list and consists of two components. First, we calculate the value of female positions on a list by assigning a value of 6 if a woman is placed on the first rank, a value of 5 if a woman is placed on the second rank, and so on, so that a value of 1 is given if a woman is placed on the last sixth rank, and 0 for deselection. Then we take the sum of these values.Footnote 15
Although this index reflects that higher list positions are more valuable, it is highly contingent on the supply of women in the first stage. For example, a respondent with only two female aspirants can only get a maximum value of 11 by placing both on the two top positions. In contrast, a respondent with seven female aspirants could deselect three and place the remaining four at the four lowest positions. Despite this being a less favourable ranking it would still result in a value of 10. To account for this, we compute for each number of female aspirants in the first stage the expected value if they were assigned randomly to list positions or deselected. Specifically, this expected value can be estimated as
 $$\begin{equation*} \textrm {Expected value} = \frac{2}{3} \times N_{Female} \times \sum _{k = 1}^{6} \frac{k}{6} = \frac{7}{3} \times N_{Female}. \nonumber \end{equation*}$$
The final FRI is the difference between the observed ‘value of female positions’ and the expected value for each respondent:
 $$\begin{equation*} \text{FRI} = \textrm {Value of female positions} - \textrm {Expected value.} \nonumber \end{equation*}$$
The FRI is zero when a respondent selected and ranked candidates similar to a completely random selection and ranking pattern. Positive values indicate a more female‐friendly nomination, and negative values indicate the opposite.
Using ordinary least squares (OLS) regressions, we explain the variation in the FRI with respondents' gender, age and party affiliation. We also run a model in which we replace party affiliation with a 10‐point left‐right self‐placement of the respondents. Moreover, we asked the respondents after the experiment whether they focused on candidates' individual characteristics or the overall list composition during the nomination. This variable has a 5‐point range and higher values indicate a stronger focus on the overall list composition. Respondents also evaluated their own actual impact on the candidate nominations within their party on a 7‐point scale (higher values = more impact). Finally, we include fixed effects for the number of female aspirants in Stage 1 of the experiment. The distribution of all independent variables is displayed in Online Appendix Section E.
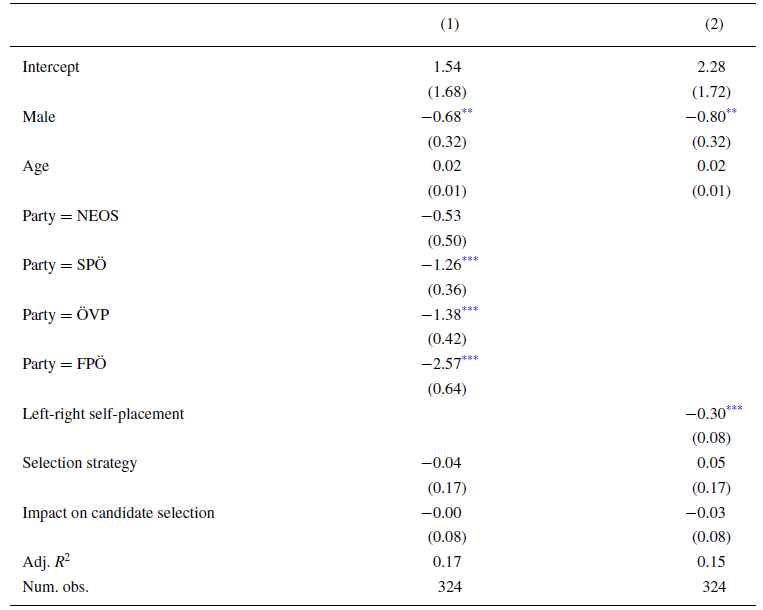
The results shown in Table 3 contain three very relevant results. First, party elites' gender matters. On average, male respondents place women in worse positions than female respondents. The effect is not very large, but significant at
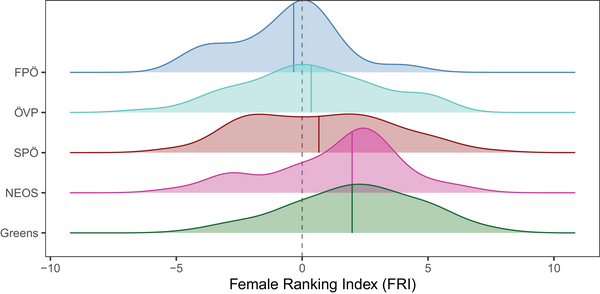
 $p < 0.05$. Second, we find party effects. While respondents from the liberal NEOS do not differ from the Green party (our reference category), respondents of the SPÖ, ÖVP and FPÖ exhibit substantial and significant negative effects. Moreover, the effects become larger the more right‐wing the party is. For example, among FPÖ selectors, the score is −2.57 points below the score of the Green party. This effect is roughly half the size for selectors of the SPÖ. Model 2 replaces party affiliation with respondents' self‐placement on the left‐right scale with similar effects. The other variables show no substantial effects and are not significant. Finally, despite the negative effects observed for male respondents and more right‐wing parties, the results reveal generally female‐friendly selection patterns. In addition, Figure 4 shows that almost all parties exhibit positive FRI values, indicating that most ranking patterns are more favourable towards women. In line with the findings from the previous analyses, these findings indicate that female party elites make a difference in candidate ranking and that left‐wing parties show more female‐friendly candidate ranking patterns; findings that support our theoretical expectation (H1c).
OLS regression: Explaining female candidate ranking

Note: The dependent variable is the FRI. ‘Selection strategy’: Self‐evaluation of whether the focus in the nomination task was on individual attributes or overall list composition (range: 1–5). ‘Impact on candidate selection’: Self‐assessed impact on nominations within the party (range: 1–7). Fixed effects for # of female aspirants included but not displayed. $^{***}p<0.01$
;
$^{***}p<0.01$
; $^{**}p<0.05$; $^{*}p<0.1$.
Distribution of female ranking index by party.
Note: Solid vertical lines are medians. The x‐axis displays the ‘female ranking index’. Positive values indicate female ranking patterns that are more favourable towards women than expected under random candidate ranking.

Ranking sequences: The zipper ranking
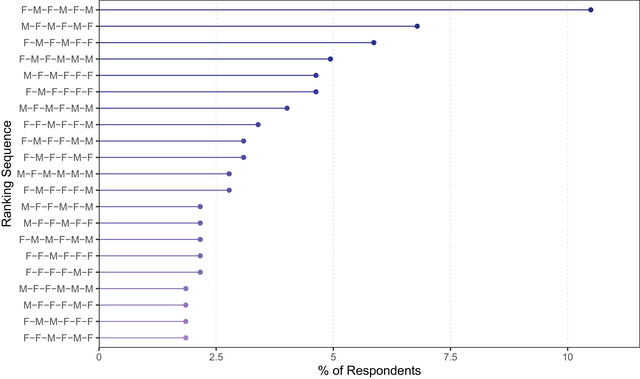
Next, we explore specific sequences of candidate ranking. Our focus is on ‘zipper rankings’ in which candidates of different genders are listed in alternating order. This composition is seen as most effective for increasing women's political representation (Delgado‐Márquez et al., Reference Delgado‐Márquez, Ramírez‐González and López‐Carmona2014) and is deemed the most gender‐equal candidate ranking under PR. We first assess descriptively how often respondents use such zipper placements and estimate for all respondents the gender sequence of how candidates were placed on different ranks.
Figure 5 presents these patterns. Among all possible ranking sequences, the most frequently used is indeed the ‘female zipper’, that is, a gender‐alternating list headed by a woman, chosen by 10 per cent (N $=$ 34) of the respondents.Footnote 16 The second most frequent pattern is the ‘male zipper’, headed by a man (N = 22). Combined, both patterns account for more than 17 per cent of the respondents.Footnote 17 Further, even the third most frequent pattern follows largely the ‘female zipper’ only with a replacement on the last spot (i.e., F‐M‐F‐M‐F‐F). There are many other ranking sequences in Figure 5 which show partial zipper patterns. Note that not all respondents could conduct a full zipper placement either because too few or too many women were among the aspirants in Stage 1 of the experiment. For example, when only two women were among the aspirants in Stage 1, then it was impossible to use the full zipper. These findings provide further evidence that a substantial part of the respondents care about gender composition and compose lists accordingly.
Most frequent gender ranking sequences.
Note: M = Male, F = Female. Ranking sequences that occurred fewer than five times are excluded from the visualization (but not from the computation of per cent).

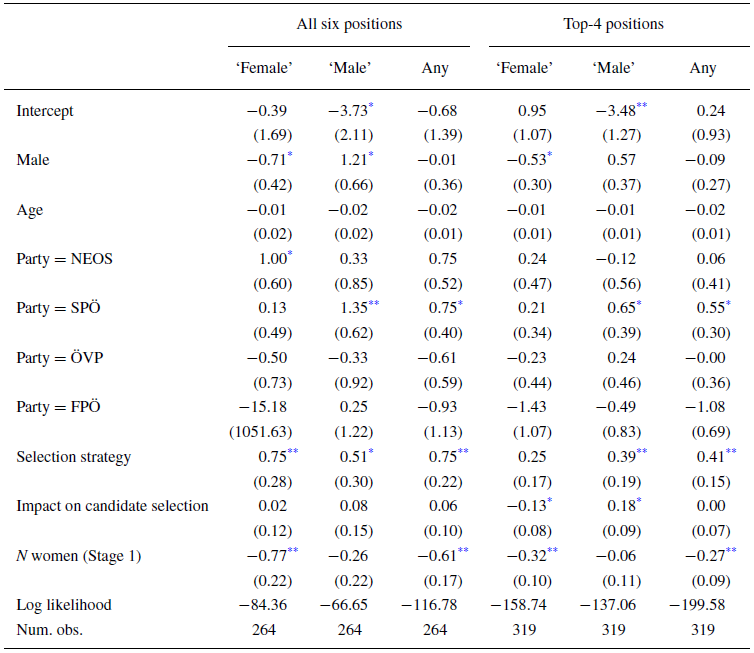
Using logistic regression, we now analyse who is using what type of zipper (see Table 4). We use three different dependent variables. First, whether a respondent used the ‘female zipper’, that is, whether a zipper placement was used and a woman is the list leader. Second, whether a ‘male zipper’ is used (i.e., a male‐led zipper). Finally, whether any type of zipper system was used (male or female zipper). The first three models consider zipper list placements for all six positions of the ranking task. Models 4–6 in Table 4 only consider the first four ballot positions, that is, the dependent variable also equals one when candidates on positions five and six are not placed in alternating order. Cases in which it was impossible to rank candidates according to the zipper either because too few or too many female aspirants were randomly chosen at Stage 1, are excluded from the analysis. The independent variables follow the model specification from before (see Table 3).
Explaining zipper ranking (logistic regression)

Note: $^{**}p<0.05$; $^{*}p<0.1$. Dependent variable is whether respondents rank female and male candidates in alternating order. First three models consider only cases in which all six candidates were ranked in alternating order. Models 4‐6 only consider the first four positions. Models denoted as ‘female’ denote a female head of list; ‘male’ = male head of list; ‘any’ = either male or female on top of list. Reference Category for ‘Party’ is the Green Party. Observations in which number of women was below three (two) or above six (seven) were excluded as zipper‐ranking was not possible in these cases.
Models 1 and 4 demonstrate a gender effect for using the female zipper ( $p < 0.1$). Male respondents are less likely to use the female zipper. In contrast, Models 2 and 5 indicate a positive effect of male respondents on the probability of using the male zipper. In Model 5, this effect is not significant at $p < 0.1$. Models 3 and 6 demonstrate that the gender of respondents is irrelevant in predicting whether any type of the zipper system is used. Thus, the regression models indicate that male and female respondents are equally likely to use the zipper, but there is a gender gap in whether a female or male candidate heads the list. With regard to party effects, respondents from NEOS seem to be particularly likely to use the female zipper (compared to Green party elites) despite not having a formal quota requirement. This effect, however, only holds for the full female zipper.
There is a stable and consistent effect of the selection strategy of the respondents. Respondents stated they focused on the whole list when selecting and ranking candidates – instead of focusing solely on individual attributes – are more likely to use the zipper ranking, highlighting the consistency between self‐assessed behaviour and actual list composition. Overall, these analyses provide systematic evidence for gendered list placement. Crucially, these patterns are structured by the gender of the party elites as women show more female‐friendly gender zipper patterns than men. Again, these results highlight the importance of party elites’ own demographics.
The same‐sex tendency of male selectors can have actual consequences for descriptive representation, despite formal and numerical parity on lists. In fact, it links directly to the current under‐performance of the statutory zipper provisions of the largest party in Austria, the ÖVP. Despite its own provisions, the party's share of female MPs stands at 36.6% despite its goal of gender parity. The party is most successful at the local level where only 15 of its 39 lists were headed by women in 2019. From these, only nine were fielded in districts where the first position was successful in the previous election, accruing to an electability ratio of 0.6. For men, however, the number stands at 0.83, with only 4 out of 24 male‐led lists fielded in futile districts. Similarly for the regional lists; five lists were led by women but two of them were in hopeless districts. The four list‐leading men, in contrast, were nominated in districts previously successful. The usage of the male zipper in combination with low‐magnitude districts and geographically dispersed party support can thus result in a skewed gender distribution in parliament (Ahrens et al., Reference Ahrens, Chmilewski, Lang and Sauer2020). Simulations based on the actual results of the 2019 legislative election suggest that zipper quotas – with a male or a female lead – will structurally lead to gender imbalances. The solution might be the alternation of male and female zipper lists across the districts (see Online Appendix Section L).
Conclusion
Due to the nomination of more diverse party lists, PR systems are deemed more favourable for women's representation. While aggregate‐level analyses seem to support this conclusion, the candidate selection process under PR is not well understood and is plagued by methodological challenges. This includes the absence of information about the pool of aspirants. Moreover, it is hard to assess the preferences of the selectorate regarding ranking strategies and list composition.
Providing the first systematic analysis of selectors’ list composition strategies under PR, we demonstrate that gender is recognized by respondents in our experiment as an important dimension of list composition. Crucially, the observed nomination patterns are generally female‐friendly, echoing previous research on plurality systems (e.g., Teele et al., Reference Teele, Kalla and Rosenbluth2018). Moreover, the patterns become less female‐friendly for selectors from right‐wing parties. More importantly, respondents’ gender plays a highly relevant role. Subtle same‐sex preferences among male and female selectors influence whether a man or woman leads the list; highly consequential in low‐magnitude PR districts. Observational data confirm a skewed distribution of male‐headed lists in districts with low party magnitude. Our findings suggest that these patterns in the observational data can be explained by the preferences revealed in our experimental design. In this regard, our experiment identifies an important potential source of female under‐representation under PR. Given that most party elites are still male, list composition preferences are likely to play in the men's favour. Finally, our simulation based on parties’ regional support, as in the 2019 elections, suggests that alternating between male‐ and female‐led zipper quotas across the 49 Austrian electoral districts would help close the gender gap in parliament.
Our study also highlights how the supply of female candidates affects nomination decisions. When low in supply, selectors react to this scarcity and ensure that the few available female candidates are placed on favourable list positions – corresponding to the selection logic under PR to compose a diverse team of candidates. Quite surprisingly, this mechanism is less pronounced for male candidates. It can only be speculated why this is the case. One explanation might be that due to the actual under‐representation of women in politics, party selectors pay more attention to the appropriate selection of female candidates. Future research could focus more strongly on this finding and analyse the mechanisms behind it in more detail.
Methodologically, we contribute to the development of conjoint analysis in political science. Having become a staple method for studying multidimensional preferences, applications typically design only two profiles. We demonstrate that deviating from this standard approach can hold great promise. Our experiment resembles better the selection process under PR and may be fruitful for addressing new research questions, for example, by modelling the supply of eligibles or going beyond selection and rating through the ranking of profiles. Future research hopefully advances the usage of conjoint experiments along these lines and addresses topics including the causal estimands for ranking data (e.g., Atsusaka, Reference Atsusaka2022) or the response quality due to the cognitive load associated not with the number of attributes (Bansak et al., Reference Bansak, Hainmueller, Hopkins and Yamamoto2021a) or choice tasks (Bansak et al., Reference Bansak, Hainmueller, Hopkins and Yamamoto2018) but with the number of profiles.
Obviously, our study has some limitations. Not every aspect of candidate selection is addressed in our study, including informal networks or intra‐party coalitions. Moreover, as with most experimental research, the set‐up is rather artificial in order to not contaminate findings by patterns already present in observational data, which might imply an overestimation of female‐friendliness in the selection processes. The over‐representation of left‐wing elites in our sample should also be considered. As we argued above, it probably increased the positive female effect in our study. Nonetheless, our paper provides important insights into how party elites consider gender in their candidate selection process in an unconfounded environment.
Acknowledgements
We are grateful to Yuki Atsusaka, Michele Fenzl, Robert A. Huber, Christina‐Marie Juen, Jaemin Shim, Jon Slapin, Daniel M. Smith and the audiences of the ‘Women as Political Actors: Contemporary Barriers, Challenges, and Opportunities’ workshop in Greifswald and the ‘Zurich Workshop on Political Representation’ for providing helpful feedback and comments on the manuscript as well as the experimental design.
Open access funding provided by Universitat Zurich.
Conflict of interest
The author(s) declare no conflicts of interest.
Data availability statement
Replication materials can be found at https://doi.org/10.7910/DVN/O1ILRD.
Online Appendix
Additional supporting information may be found in the Online Appendix section at the end of the article:
Supporting information
Data S1


 Open access