





Introduction
Compared to early HIV diagnosis, late diagnosis delays access to antiretroviral therapy (ART), increasing the risk of disease progression, and thus causes more morbidity and mortality for people living with HIV (PLWH) and leads to higher health care costs. Timely diagnosis and effective ART use also prevent onward transmission of HIV [Reference Mocroft1–5].
Distinguishing true new diagnoses from newly registered but previously diagnosed PLWH is important for epidemic dynamics, as, given linkage to care is ensured, many of the previously diagnosed are on ART, and do not transmit HIV further.
In Finland, a low HIV prevalence country, HIV testing is currently recommended based on symptoms indicative of HIV infection, for everyone with a known or suspected exposure to HIV including behaviour or lifestyle risk factors such as sex between men or injecting drug use (IDU) or if diagnosed with an AIDS-defining condition or other infections with similar modes of transmission to HIV, for migrants coming from high-prevalence (≥1%) countries, and at a person’s request. Opt-out HIV testing is recommended in antenatal care. Babies born to women with HIV and blood, breast milk, and organ donors are screened for HIV [Reference Brummer-Korvenkontio6, 7].
In 2011, the European Late Presenter Consensus Working Group defined late presentation as persons presenting for HIV care with a CD4+ T-cell count <350 cells/μL or with an AIDS-defining event regardless of CD4+ T-cell count, and presentation with advanced HIV disease as presenting to care with a CD4+ T-cell count <200 cells/μL or with an AIDS-defining event, regardless of CD4+ T-cell count [Reference Antinori8]. An increasing proportion of new infections are diagnosed at an acute stage when CD4+ T-cell count can decrease temporarily, thus incorrectly being classified as late [Reference Kirwan9–Reference Brännström11]. In 2022, these definitions were updated, and they refer to diagnosis instead of presentation. Recent infections are reclassified as non-late diagnoses [Reference Croxford12].
Late HIV diagnosis is an indicator of insufficient testing. Analysis of risk factors for late diagnosis can be used to further develop national strategies for testing and for other public health measures.
Aim
We assessed trends in new HIV diagnoses for Finnish- and foreign-born individuals, and risk factors associated with late HIV diagnosis in Finland using the updated definitions for late and very late HIV diagnosis.
Objectives
Our objectives were (i) to report quantity and proportion of new HIV diagnoses of the newly registered HIV cases annually, (ii) to report quantity and proportion of late and very late diagnoses annually and changes in this over time, (iii) to present risk factors for late and very late diagnosis and (iv) to assess population attributable risk (PAR) for late HIV diagnosis.
Methods
Study design
This was a registry-based retrospective cohort study.
Data sources and data management
The Finnish HIV Register (FINHIV) was formed in 2020 at the Finnish Institute for Health and Welfare (THL) [Reference Mutru13]. It combines data from all 21 public HIV clinics that exclusively treat PLWH in Finland and from the National Infectious Disease Register (NIDR), which is maintained by THL and contains all notified HIV cases diagnosed and/or treated in Finland from 1984 onwards [14]. Notification to NIDR is mandatory both for physicians and for clinical laboratories.
In Finland, a unique personal identity code (PIC), given to each person registered in the Population Information System, is used to identify persons in the registers and information systems of different authorities and in data linkage between them [15]. We identified 22 duplicate entries that were removed accordingly.
We collected data from FINHIV on sex (male/female), date and country of birth, mother tongue, date of notification to NIDR, date and result of first positive HIVAgAb laboratory test in Finland and the first CD4+ T-cell count in Finland, mode of transmission, country of transmission, date or year of HIV diagnosis, previously diagnosed abroad, first date of admission to a HIV clinic in Finland and the name of the clinic, first ever date of ART, year of immigration to Finland, date or year of last negative HIV test, clinical stage of HIV infection at diagnosis, and date of AIDS diagnosis.
Data on country of birth are retrieved directly to NIDR from the Population Information System [16]. It is determined by the mother’s permanent home country according to the state system at the time of birth.
Definitions
We used the updated definitions for late and very late HIV diagnosis and classified those with a CD4+ T-cell count <350/μL ≤90 days of diagnosis who had a recent infection as non-late [Reference Croxford12]. Recent infection was classified based on the physician’s notification or on having tested negative for HIV in the same year or the year before FINHIV registration. Data on the last negative test were mostly available by calendar year.
We referred to all PWLH registered in Finland for the first time during the study period as newly registered cases or new cases, for short. These include both PLWH who were newly diagnosed in Finland during the study period and those diagnosed previously abroad. We referred to PLWH who were diagnosed for the first time, and that was in Finland during the study period, as newly diagnosed or new diagnosis.
We defined the FINHIV registration date as the earliest of the following: the date of notification to NIDR, the first date of admission to an HIV clinic in Finland, or the date of the first positive HIVAgAb laboratory test in Finland.
We established seven categories for country or region of birth: 1. Finland, 2. Northern, Western, and Southern Europe, 3. Eastern Europe and Russia, including all countries that were part of the former Soviet Union (FSU), 4. Asia (excluding FSU countries), 5. Africa, 6. Other, and 7. Unknown. Detailed information on classification is provided in Supplement S1.
We divided newly diagnosed PLWH by population size of municipality of residence, as <100000 rural and ≥100000 urban. Nine cities in Finland have populations >100000 [17].
Study population
The study consists of all HIV cases newly registered in FINHIV between 1 January 2008 and 31 December 2023 who were >18 years old on the FINHIV registration date.
For the analyses of new diagnoses, we excluded PLWH who had previously been diagnosed abroad. Data on those diagnosed abroad have been collected via physician’s NIDR notification only since 2016. If these data were missing or notified as unknown, we classified the following as previously diagnosed: the date of the first positive HIV test or diagnosis preceding the FINHIV registration date by at least 60 days, the year of the first positive HIV test or diagnosis preceding the year of immigration to Finland, the first ever date of ART at least 60 days earlier than the FINHIV registration date, or HIV-1 RNA <50 copies/mm3 within 60 days of the FINHIV registration date.
Newly diagnosed PLWH in Finland with CD4+ T-cell count available ≤90 days of diagnosis were analysed for diagnostic delay.
Statistical analysis
Characteristics of non-late and late, including very late, diagnoses were compared by chi-squared test for categorical variables and by Mann–Whitney U-test for non-normally distributed data. We assessed temporal trends by Poisson regression for incidence rates of new HIV diagnoses and of late and very late diagnoses, and by binary log-linear regression for proportions of late and very late diagnoses.
We performed univariable analysis of diagnostic delay (late or very late diagnosis) for selected variables: sex, age at diagnosis, country or region of birth, calendar year of diagnosis, mode of transmission, urban versus rural location of residence at diagnosis, and collaborative area in Finland (divided between the five university hospitals across the country). For the multiple logistic regression analysis of diagnostic delay, we selected variables with univariable p-values <0.200. Akaike’s information criterion (AIC) and Bayesian information criterion (BIC) were used for assessing the models. To explore the effects of small numbers and missing data on the multivariable model, we rerun the analyses using Firth logistic regression and multiple imputation by chained equations (MICE) respectively. For MICE, we included all the variables selected in the univariable analysis and other variables for which we assumed the missingness process in the data was missing at random (MAR). Based on the final multivariable model, we analysed the PAR for late diagnosis by creating multiple scenarios. We performed the analyses using Stata ver. 17 and 18 (Stata Corp LLC, TX, USA).
Results
The study population and reasons for exclusion are presented in Figure 1.
Flow chart of case selection and reasons for exclusion, Finland, 2008–2023 (n = 2683).

Figure 1. Long description
The flowchart begins at the top with a box for All new adult H I V cases registered in F I N H I V 1 January 2008 through 31 December 2023, n equals 2683.
An arrow points to a box on the right listing exclusion criteria for H I V diagnosed previously, n equals 870 of which 96 born in Finland. Reasons include:
* Notified as diagnosed abroad n equals 487, of which 31 Finnish-born.
* Date of H I V diagnosis earlier than 60 days of the F I N H I V registration date, n equals 376 of which 65 Finnish-born.
* Year of the first positive H I V test or diagnosis prior to the year of immigration to Finland, n equals 16.
* Date of the first ever A R T earlier than 60 days of the F I N H I V registration date, n equals 191 of which 24 Finnish-born.
* H I V-1-R N A less than 50 copies per mm cubed within 60 days of the F I N H I V registration date, n equals 161 of which 22 Finnish-born.
The main flow continues to New H I V diagnoses, n equals 1813. An arrow points right to No C D 4 plus T-cell count available less than or equal to 90 days of H I V diagnosis, n equals 241.
The main flow proceeds to New H I V diagnoses included in the analysis of diagnostic delay, n equals 1572. This box branches into three categories:
1. A I D S less than or equal to 90 days of diagnosis, n equals 268.
2. C D 4 plus T-cell count less than 350 per microliter, no A I D S less than or equal to 90 days of diagnosis, n equals 609.
3. C D 4 plus T-cell count greater than or equal to 350 per microliter, no A I D S less than or equal to 90 days of diagnosis, n equals 695.
From these branches, cases are further classified:
* Late H I V diagnoses, n equals 790. This includes C D 4 plus T-cell count less than 350 per microliter, no A I D S less than or equal to 90 days of diagnosis and no indication of recent H I V infection, n equals 522; and A I D S less than or equal to 90 days of diagnosis, n equals 268.
* Recent H I V infection, n equals 87. This includes Primary infection at diagnosis, n equals 42 or Negative H I V test, the same year than or the year before F I N H I V registration, n equals 58.
* Very late H I V diagnoses, n equals 526. This includes C D 4 plus T-cell count less than 200, no A I D S less than or equal to 90 days of diagnosis, n equals 258; and A I D S less than or equal to 90 days of diagnosis, n equals 268.
* Non-late H I V diagnoses, n equals 782. This includes C D 4 plus T-cell count greater than or equal to 350 per microliter, no A I D S less than or equal to 90 days of diagnosis, n equals 695; and C D 4 plus T-cell count less than 350 per microliter, no A I D S less than or equal to 90 days of diagnosis, recent H I V infection, n equals 87.
Newly registered cases and new diagnoses in FINHIV
Of the 2683 newly registered adults in FINHIV between 2008 and 2023, 1813 (67.6%) were new HIV diagnoses. In total, 1604/2683 (59.8%) of newly registered cases and 830/1813 (45.8%) of new diagnoses were foreign-born.
Annual numbers of newly registered cases and new diagnoses stratified by country of birth (Finland vs. others) are shown in Figure 2. Annual incidence rates of newly registered HIV cases and new HIV diagnoses for the adult population are provided in Supplement S2. Incidence rate ratio (IRR) of new HIV diagnoses for the Finnish-born was 0.94 (95% CI 0.93–0.96), p < 0.001. No specific change point year was detected. For the foreign-born, there was no change in IRR of new diagnoses over the total study period, 1.00 (95% CI 0.996–1.018), p = 0.205. However, when excluding years 2022 and 2023 from the analysis, IRR for the foreign-born was 0.96 (95% CI 0.95–0.98), p < 0.001. Of the 427 new cases in 2022–2023, 203 (47.5%) were migrants from Ukraine based on the notified country of transmission (200) and mother tongue (3). The country of birth was not notified for 164/203 (80.8%), and thus the region of birth was classified as unknown. In 2022–2023, 42/118 (35.6%) of the new diagnoses were migrants from Ukraine.
Annual newly registered HIV cases (n = 2683) and new HIV diagnoses (n = 1813) separately for Finnish-born and foreign-born, Finland, 2008–2023.

Figure 2. Long description
A stacked bar chart with the y-axis labeled Number of cases from 0 to 250 and the x-axis labeled Year of registration to F I N H I V from 2008 to 2023.
The legend identifies four categories.
1. Born in Finland, new H I V diagnoses in dark blue.
2. Born in Finland, new H I V cases, previously diagnosed in light blue.
3. Born abroad, new H I V diagnoses in dark red.
4. Born abroad, new H I V cases, previously diagnosed in light red.
For each year, two stacked bars are shown. The left bar represents Finnish-born and the right bar represents foreign-born individuals.
From 2008 to 2021, the total number of cases for both groups remains relatively stable, generally under 100 cases per group per year. In the Finnish-born group, dark blue new diagnoses consistently make up the majority of the bar. In the foreign-born group, dark red new diagnoses and light red previously diagnosed cases are more evenly split, and the proportion of light red increases over time.
A significant spike occurs in 2022 and 2023 for the foreign-born group. In 2022, the total cases for foreign-born individuals jump to over 200, driven primarily by a massive increase in the light red previously diagnosed category. This trend continues in 2023, while the Finnish-born cases drop to their lowest levels in the recorded period, totaling under 30 cases.
New diagnoses analysed for diagnostic delay
CD4+ T-cell count ≤90 days of HIV diagnosis was available for 1572/1813 (86.7%) of newly diagnosed, including all the 268 reported with an AIDS-defining illness ≤90 days of diagnosis. Two hundred forty-one newly diagnosed individuals for whom CD4+ T-cell count was not available were excluded from the analysis of diagnostic delay. The excluded were younger, median age 35 versus 39, more often foreign-born (75.9% vs. 41.2%), data on country of birth lacking for 41.1%, diagnosed during earlier years of the study period (2008–2011: 40.7% vs. 29.6%, 2020–2023: 11.6% vs. 19.0%), diagnosed at the Northern (13.7% vs. 5.9%) or the Eastern (18.3% vs. 8.6%) collaborative areas compared to the Southern (53.5% vs. 62.7%), the Inland (6.6% vs. 10.8%) and the Western (7.9% vs. 18.6%) areas and data on mode of transmission were lacking or classified ‘other’ (47.9% vs. 7.8%).
Eighty-seven of the 609 (14.3%) with CD4+ T-cell count <350/μL had a recent infection based on the physician’s notification or having tested negative for HIV in the same year or the year before FINHIV registration (Figure 1). There was no increase in reclassification over time. However, 44/87 (50.6%) of the reclassified were men who have sex with men (MSM), and their proportion of the reclassified rose from 4/19 (21.1%, 95% CI 6.1–45.6) in 2008–2011 to 13/17 (76.5%, 95% CI 50.1–93.2) in 2020–2023.
Overall, 150/1572 (9.5%) of those analysed for diagnostic delay were reported diagnosed during primary infection, and 264/1572 (16.8%) were reported having a previous negative HIV test within two years. Of MSM, 166/530 (31.3%, 95% CI 27.4–35.5) were reported having a negative HIV test within two years compared to 14/70 (20.0%, 95% CI 11.4–31.3) of people who inject drugs (PWID) and 76/849 (9.0%, 95% CI 7.1–11.1) of those with heterosexual transmission (p < 0.001). Living in larger versus smaller municipalities was associated with being previously tested, 200/982 (20.4%, 95% CI 17.9–23.0) vs. 64/590 (10.8%, 95% CI 8.5–13.6), respectively, (p < 0.001). There was no change in overall reported previous negative test coverage over the study period (p = 0.288). Among MSM, test coverage increased steadily from 31/150 (20.7%, 95% CI 14.5–28.0) 2008–2011 to 40/99 (40.4%, 95% CI 30.7–50.7) 2020–2023 (p = 0.003).
In total, 49.7% were classified as non-late, 16.8% late, excluding very late, and 33.5% very late. Characteristics of the 1572 included in the analysis of delayed diagnosis are shown in Table 1, and results of univariable analysis are in Supplement S3. In univariable analysis, higher age, female sex, heterosexual, other or unknown mode of transmission, being Asian- or African-born, and residing in a smaller municipality were significantly associated with late diagnosis. For the 87 diagnosed with a recent infection and CD4+ T-cell count <350/μL, the median CD4+ T-cell count was 262 (IQR 211–299).
Characteristics of all newly diagnosed individuals for whom CD4+ T-cell count was available ≤90 days of HIV diagnosis, stratified by diagnostic delay, Finland, 2008–2023 (n = 1572)

Table 1. Long description
The table presents data for 1572 individuals.
* Overall: 49.7 percent were non-late diagnoses and 50.3 percent were late diagnoses.
* Sex: Males accounted for 73 percent of diagnoses (48.6 percent late), while females accounted for 27 percent (54.8 percent late), with a p-value of 0.027.
* Age: The median age for late diagnoses was 42 years compared to 37 years for non-late diagnoses (p-value less than 0.001). Late diagnosis rates increased with age: 33.8 percent for ages 18 to 30, 52.6 percent for ages 31 to 50, and 61.9 percent for ages 51 and older.
* C D 4 super plus count: Median count for non-late diagnoses was 518 cells per microliter versus 132 for late diagnoses.
* Transmission: Late diagnosis was most prevalent in heterosexual transmission (56.2 percent) and ‘Other or unknown’ (65 percent), while sex between men had a lower late diagnosis rate of 38.3 percent (p-value less than 0.001).
* Year of Diagnosis: Rates remained stable across four-year intervals from 2008 to 2023, with late diagnoses hovering around 48 to 52 percent (p-value 0.682).
* Origin: Foreign-born individuals had a higher late diagnosis rate (56 percent) compared to Finnish-born individuals (46.3 percent), with the highest rates among those from Asia (63.6 percent) and Africa (59.2 percent).
* Geography: Municipalities with populations under 100,000 had higher late diagnosis rates (57.8 percent) than larger municipalities (45.7 percent).
a Heterosexual transmission analysed as one group.
b Includes unknown country of birth.
Annual new HIV diagnoses are presented in Figure 3. There was no temporal trend in the proportion of late HIV diagnoses (relative risk (RR) 1.008, 95% CI: 0.997–1.020, p = 0.159), whereas we observed a slightly increasing trend in the proportion of very late diagnoses (RR 1.017, 95% CI: 1.00–1.03, p = 0.037). IRR for late diagnoses was 0.96 (95% CI: 0.95–0.98), p < 0.0001, and for very late diagnoses 0.97 (95% CI: 0.95–0.99), p = 0.001.
New HIV diagnoses stratified by diagnostic delay and proportion of late and very late HIV diagnoses of those with CD4+ T-cell count available ≤90 days of diagnosis, Finland, 2008–2023 (n = 1813).

Figure 3. Long description
The x-axis represents the Year of H I V diagnosis from 2008 to 2023. The primary y-axis on the left measures the Number of new H I V diagnoses from 0 to 180. The secondary y-axis on the right measures the Percentage of late and very late H I V diagnoses from 0 to 100.
Stacked bars for each year are composed of four segments from bottom to top:
- Red: Very late diagnoses.
- Yellow: Late diagnoses excluding very late.
- Light Blue: Non-late diagnoses.
- Grey: New diagnoses where C D 4 plus T-cell count within 90 days was unavailable and no A I D S was present.
Two line graphs are superimposed over the bars:
- A green line represents the Percentage of late diagnoses, which fluctuates between approximately 45 percent and 60 percent over the period.
- A black line represents the Percentage of very late diagnoses, which fluctuates between approximately 25 percent and 45 percent.
Key data points show a peak in total diagnoses in 2010 at over 160 cases, followed by a general downward trend toward 2023, which shows approximately 80 total cases. The proportion of very late diagnoses (black line) shows a slight upward trend toward the end of the period, reaching over 35 percent in 2023.
Multivariable analysis of odds for late and very late HIV diagnosis
Based on univariable analysis, we included age at diagnosis (per ten years), sex, country or region of birth, mode of transmission, and population size of municipality of residence in the multivariable analysis. We explored various interactions between these variables. Age at diagnosis, sex, and country or region of birth, and mode of transmission and population of municipality of residence showed the best fit by AIC and BIC. Results of the final multivariable model are shown in Figure 4 and as tables in Supplement S3. Multivariable analysis of very late diagnosis produced similar results, except there was no significant difference in odds between males born in Eastern Europe or Russia compared to the Finnish-born males. The results of the Firth logistic regression were completely consistent with, and MICE by 30 imputations indicated only minor deviations compared to our original analysis. These results are provided in Supplement S4 and S5 respectively.
Adjusted odds ratios with 95% confidence intervals of risk factors for a) late HIV diagnosis and b) very late HIV diagnosis, Finland, 2008–2023 (n = 1572).

Figure 4. Long description
The image consists of two vertically stacked forest plots, labeled a and b. Both plots share a horizontal x-axis representing Adjusted Odds Ratio with 95 percent C I, and a vertical reference line at 1.0 indicating no difference in risk.
Panel a, Late H I V diagnosis:
* Age per 10 years shows a slight increase in risk just above 1.0.
* Sex and country or region of birth: Female, Asia and Female, Africa show the highest risk, with odds ratios near 4.0 and 3.0 respectively, and wide confidence intervals. Male, Finland is the reference point at 1.0. Female, Northern, Western and Southern Europe has an extremely wide confidence interval extending past 10.0.
* Mode of transmission and population of municipality: Most factors cluster near 1.0. Heterosexual transmission and population of municipality 100,000 or over is the reference point. Sex between men and population of municipality 100,000 or over show a decrease in risk.
Panel b, Very late H I V diagnosis:
* Age per 10 years remains slightly above 1.0.
* Sex and country or region of birth: Similar to panel a, Female, Asia and Female, Africa show elevated risk. Female, Northern, Western and Southern Europe shows a very high odds ratio near 3.0 with a confidence interval extending to nearly 25.0. Female, Other also shows a high odds ratio near 3.5 with a wide interval.
* Mode of transmission and population of municipality: Injecting drug use and other or unknown transmission categories show odds ratios between 1.0 and 2.0, with wider confidence intervals compared to sexual transmission categories.
Population attributable risk for late HIV diagnosis
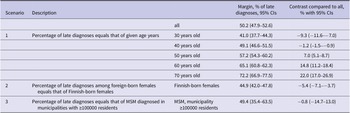
Based on the multivariable model findings, we estimated PAR for late diagnosis by creating scenarios presented in Table 2. For each scenario, the percentage of late HIV diagnoses in the study population analysed for diagnostic delay (n = 1572) was assumed equal by the described factor(s), and the other factors were adjusted for. The largest reduction in the proportion of late diagnoses in the study population was associated with younger age at diagnosis (Scenario 1). For example, assuming the percentage of late diagnoses among all in the study population changed from that of 30-year-olds to that of 50-year-olds increased the proportion of late diagnoses by 16.2% (95% CI 12.2–20.3) and the change from 40-year-olds to 60-year-olds by 16.0% (95% CI 12.1–19.9). In a scenario where the proportion of late diagnoses for foreign-born females was equal to that of Finnish-born females, a reduction in the proportion of late diagnoses among the study population was estimated to be 5.4% (95% CI 3.7–7.1). In the third scenario, equalling the proportion of late diagnoses among MSM living in larger municipalities at diagnosis to other modes of transmission and to MSM living in smaller municipalities, only a marginal reduction, 0.8% (95% CI –14.7 to 13.0), was detected.
Scenarios for estimating population attributable risk (PAR) for late HIV diagnosis, Finland, 2008–2023

Table 2. Long description
The table contains five columns: Scenario, Description, a sub-category column, Margin percentage of late diagnoses with 95 percent C Is, and Contrast compared to all percentage with 95 percent C Is.
* Baseline: The ‘all’ category shows a margin of 50.2 with a 95 percent C I of 47.9 to 52.6.
* Scenario 1: Percentage of late diagnoses equals that of given age years.
- 30 years old: Margin 41.0 (37.7 to 44.3); Contrast minus 9.3 (minus 11.6 to minus 7.0).
- 40 years old: Margin 49.1 (46.6 to 51.5); Contrast minus 1.2 (minus 1.5 to minus 0.9).
- 50 years old: Margin 57.2 (54.3 to 60.2); Contrast 7.0 (5.1 to 8.7).
- 60 years old: Margin 65.1 (60.8 to 62.3); Contrast 14.8 (11.2 to 18.4).
- 70 years old: Margin 72.2 (66.9 to 77.5); Contrast 22.0 (17.0 to 26.9).
* Scenario 2: Percentage of late diagnoses among foreign-born females equals that of Finnish-born females.
- Finnish-born females: Margin 44.9 (42.0 to 47.8); Contrast minus 5.4 (minus 7.1 to minus 3.7).
* Scenario 3: Percentage of late diagnoses equals that of M S M diagnosed in municipalities with greater than or equal to 100,000 residents.
- M S M, municipality greater than or equal to 100,000 residents: Margin 49.4 (35.4 to 63.5); Contrast minus 0.8 (minus 14.7 to 13.0).
Discussion
To our knowledge, this is the first study on risk factors for late HIV diagnosis in Finland based on national registry data. Despite some success in controlling the HIV epidemic in Finland over the study period, the proportion of late diagnoses did not change, and we even observed a slight temporal increase in the proportion of very late diagnoses; 50% were diagnosed late and 34% very late, proportions similar to those in many other low-prevalence countries [18].
The HIV epidemic in Finland underwent some major changes between 2008 and 2023. We show a decreasing trend in new diagnoses, especially among the Finnish-born, and up to 2021, among the foreign-born, and an increasing proportion of immigrated PLWH were diagnosed before moving to Finland. These changes are multifactorial, including public health efforts in adopting the 2015 WHO recommendations of providing ART to all diagnosed with HIV and pre-exposure prophylaxis (PrEP) to those most at-risk of acquiring HIV [19], and in 2020–2021, the effects of the COVID-19 pandemic in reducing HIV testing, contacts, and international migration [Reference Van Beckhoven20–Reference Mude22].
In 2022–2023, new cases among the foreign-born more than doubled in Finland, and new diagnoses increased compared to 2017–2021, mainly due to the arrival of Ukrainian PLWH fleeing the war. Almost 80% of them were diagnosed previously, which is more compared to 58.5% reported by the European Union/European Economic Area countries in 2022 [Reference Reyes-Urueña23]. Since 2016, nearly half, and in 2022–2023, over half, of new HIV diagnoses in Finland were among migrants. A similar trend of migrants being overrepresented among newly diagnosed PLWH was reported in a European study covering 2014–2023 [Reference Reyes-Urueña24].
In multivariable analysis, age was an independent risk factor for late diagnosis, as it has been in several previous studies [Reference Justice25–Reference Widgren27]. Of the other factors included in the final model, we found an interaction between sex and country or region of birth and between mode of transmission and urban versus rural municipality of residence at diagnosis.
Finnish-born females were less likely to be diagnosed late or very late than Finnish-born males. This might be explained by differences in healthcare-seeking behaviour between sexes and opt-out antenatal screening. We could not analyse why or where a positive HIV test was taken before referral to an HIV clinic. Considering that in larger municipalities MSM were likely to be diagnosed earlier compared to those with heterosexual transmission, Finnish-born males with heterosexual transmission were more likely to be diagnosed markedly later than Finnish-born females with heterosexual transmission.
Females of Asian and African origin and males from Eastern Europe and Russia were likely to be diagnosed late compared to the Finnish-born. We could not assess whether the diagnostic delay occurred more often pre- or post-migration.
Year of immigration was notified only for 188/1604 (11.7%) of all new foreign-born cases and for 45/647 (7.0%) of new diagnoses among the foreign-born analysed for diagnostic delay. From our previous study, we know that many migrants had been living in Finland for several years prior to having been diagnosed with HIV [Reference Isosomppi28]. Post-migration acquisition of HIV has been shown to be common in migrants to Europe [Reference Stirrup29, Reference Yin30]. Nevertheless, our results indicate that recommended post-immigration screening did not reach all eligible migrants. Reception centres arrange health care services, including voluntary post-immigration screening for asylum-seekers [31]. To increase screening coverage, public health care providers would need to be able to actively reach out to all the eligible newly arrived migrants.
MSM living in larger municipalities were likely to be diagnosed earlier than MSM in smaller municipalities, and all with other modes of transmission. In several previous studies, MSM have been found to be the least at-risk of late HIV diagnosis [Reference Mocroft1, Reference Widgren27, Reference Collins32]. In univariable analysis, those living in larger municipalities were twice as likely to have tested negative the same or previous year as those diagnosed, compared to residents in smaller municipalities. The proportion of previously tested negative was larger among MSM, and it increased during the study period. MSM living in larger municipalities might have more contacts, be more aware of their risk, and have easier access to low-threshold testing compared to the other subgroups. The roll-out of PrEP in Finland since 2019 is likely to have increased testing, especially among MSM. In previous studies, mostly from the USA, rural residence is shown to be a risk factor for late HIV diagnosis [Reference Ohl and Perencevich33–Reference Trepka37].
We analysed PAR to understand where the most impact in reducing the proportion of late HIV diagnoses would likely have been gained. Adjusting for other factors, higher age at diagnosis was the most important factor for increasing the proportion of late diagnoses. Better awareness of the risk of contracting HIV among older adults is needed both for preventive advice and actions, and enhanced testing. Among Asian- and African-born females, equalling their risk to that of Finnish-born females, had less effect in reducing the PAR compared to age, as they consisted of a rather small subgroup of the study population. However, for their own health, they are a priority group for targeted testing. Equalling the proportion of late diagnoses among MSM living in larger municipalities to those with other modes of transmission and to MSM living in smaller municipalities would only have a marginal effect on the PAR.
Using the 2022 definition for late HIV diagnosis, 14.3% of the newly diagnosed with CD4 + T-cell count ≤350/μL and without AIDS diagnosis were reclassified as non-late. Half of the reclassified were MSM, and their proportion of the reclassified increased over time. Our results are in line with previous studies from the UK, Belgium, and Italy [Reference Kirwan9, Reference Sasse10, Reference Suligoi38].
Less than one in five of the newly diagnosed PLWH were reported to have been tested for HIV in the previous year or the same year as diagnosed, and there was no change in overall test coverage over the study period. In a study consisting of 934 PLWH diagnosed between 1985 and 2005 in Finland, 28% had a negative HIV test within two years [Reference Kivelä39]. Risk awareness might differ between sub-populations and health care professionals, impacting access to testing. From the public health viewpoint, to find undiagnosed PLWH in Finland, we strongly recommend enhancing testing as instructed by the current national guideline, and that it be updated to include more indicator condition-based testing as recommended by the European Centre for Disease Prevention and Control (ECDC) [40]. To enhance the surveillance system, for each newly diagnosed PLWH, previous negative HIV test results could be automatically collected to NIDR from the nationwide patient data system Kanta, which covers both public and private health care [41].
Limitations
Our study was based solely on register data, and it is likely to contain some reporting errors, misclassifications, and incomplete data. Notifications on the dates of previous HIV diagnoses and ART received abroad, and on the last negative HIV test prior to HIV diagnosis, were subject to recall bias. As notifications on previous diagnoses abroad were available only from 2016 onwards, and even after that, the data were incomplete, we had to set exclusion criteria for previous diagnoses. We might have misclassified some newly diagnosed persons, such as those receiving integrase inhibitors and elite controllers, as previously diagnosed. Recency assays for recent infection testing algorithms are currently not performed in Finland. Physicians at HIV clinics diagnose primary infection based on clinical picture, p24 antigen, HIV-1 RNA, and antibody findings, and a history of previous negative HIV test. Data on diagnoses during primary infection and on the last negative HIV test were incomplete, so it is likely that we misclassified some non-late cases as late. Our multivariable model was limited by the small number of new diagnoses in some subgroups. However, our further analyses, the Firth logistic regression, which is generally considered to be more unbiased with small case numbers than the ordinary logistic regression, and multiple imputation by chained equations (MICE) for missing data, provided results that were consistent with our original multivariable model.
Conclusion
Increasing awareness of the risk of contracting HIV and the importance of preventive actions among the older adult population, and diagnosing older PLWH earlier through enhanced testing would have had the most impact in reducing the proportion of late HIV diagnoses in Finland, 2008–2023. Screening of migrants from high-prevalence (≥1%) countries should be enhanced, for example, by creating reminders in electronic medical records and enabling regional public health care providers to actively reach out to newly arrived persons. Effective preventive measures and repetitive testing should be maintained and further developed among sub-populations with the least diagnostic delay, such as MSM. To better understand reasons for diagnostic delay, a further study by interviewing those diagnosed late and reviewing their medical records is warranted. For the previously diagnosed PLWH immigrating to Finland, ensuring linkage to care and uninterrupted access to ART should be emphasized both for the individual’s health and for preventing onward transmission of HIV.
Supplementary material
The supplementary material for this article can be found at http://doi.org/10.1017/S0950268826101757.
Data availability statement
The data that support the findings of this study are available on request for scientific research in anonymized form from Data Permit Authority Findata (https://www.findata.fi/en/services/data-requests/). The data are not publicly available due to privacy or ethical restrictions.
Acknowledgements
The authors thank Mr. Pauli Isosomppi for producing the forest plots.
Author contribution
SI, JO, PK, KL, and IA took part in planning the study. KL provided administrative support. JO compiled the data. SI and JO analysed the data. All authors took part in the interpretation of the results. SI wrote the first draft. All authors revised and approved the final draft.
Funding statement
This work was supported by the State Research Funding (SRF) for university-level health research via City of Helsinki Social Services, Health Care and Rescue Services Division, and by Helsinki University Hospital (HUS) Inflammation Center research funding. The funders were not involved in planning, conducting, or reporting of the study.
Competing interests
SI has received a lecture fee from MSD and a research grant from Gilead. PK and IA have received honoraria, lecture fees, and conference support from Gilead, Merck, and GSK/ViiV, and research grants from Gilead. JO, KL, and MM declare none.
Ethical statement
Permission for this study was obtained from the Finnish Institute for Health and Welfare (THL; Dnro THL/6140/6.02.00/2023). No ethics approval was required for this study under Finnish law.




 Open access

