


1. Introduction
The past few decades have seen a remarkable transformation in labor markets across the advanced industrial societies: employment opportunities decreased in certain industries and occupations, and not in others. This development is attributed to increasing reliance on technological change, the embeddedness of production and trade in global markets, and the decline in Fordism (Iversen and Cusack, Reference Iversen and Cusack2000; Autor et al., Reference Autor, Levy and Murnane2003; Scheve and Slaughter, Reference Scheve and Slaughter2004). As the labor share declined across the Organization for Economic Co-operation and Development (OECD) and domestic labor markets became more reliant on precarious jobs, citizens’ economic experiences and redistribution preferences have attracted a great deal of scholarly attention. As prior research has shown, vote choice is largely driven by changes in economic circumstances and concerns over taxation (Margalit, Reference Margalit2013; Ahlquist et al., Reference Ahlquist, Copelovitch and Walter2020).
A core result in this literature holds that voters are motivated by self-interest in forming redistribution preferences. In particular, significant changes in one's economic standing, whether realized (e.g., job loss) or expected (e.g., a sharp increase in one's likelihood of getting unemployed), are predicted to shape these preferences, well beyond what a voter's income would suggest (Meltzer and Richard, Reference Meltzer and Richard1981; Rehm, Reference Rehm2009; Margalit, Reference Margalit2019). This is found to be true for individuals working in industries or occupations exposed to the risk of automation, outsourcing, and offshoring, or necessitating more specific skill investments (Iversen and Soskice, Reference Iversen and Soskice2001; Walter, Reference Walter2017; Thewissen and Rueda, Reference Thewissen and Rueda2019). In brief, citizens working in risky occupations or industries are expected to support social spending more than their less risk-exposed counterparts.
For the interpretation of these results to hold, one needs first to assume that the same people would hold different, maybe even opposite, views had their economic circumstances been different than the observed ones. Such a causal implication is not however substantiated with empirical support, as most work relies on cross-sectional comparisons. More substantively, this research is typically static in nature, as individuals’ preferences and economic situation is observed and quantified only at a given point in time. An open question therefore is whether this empirical relationship is dynamic in nature, specifically whether individuals’ preferences change in response to shifts in personal circumstances.
This is an important question for understanding shifts in public opinion and the malleability of preferences. For example, following the crisis, conventional wisdom expected public opinion to shift left, but support for populism increased instead (Funke et al., Reference Funke, Schularick and Trebesch2016).Footnote 1 To the extent that economic hardship is correlated with support for radical parties (Guiso et al., Reference Guiso, Herrera, Morelli and Sonno2020), exploring the dynamic nature of labor market risk could contribute to a better understanding of the changes in the political landscape. Relatedly, it is important to understand just how volatile voters’ preferences are to be able to anticipate what level of economic insecurity is likely to contribute to changes in public opinion (O'Grady, Reference O'Grady2019).
Apart from the methodological implication emphasizing the need for dynamic empirical research, this question has further theoretical substance. Individual-risk is typically captured by inferring individuals’ economic experiences from occupational or sectoral information. This is conceptually appealing as it aims to capture supply and demand for a certain skill set. At the same time, individuals’ risk level is typically defined based on the tasks or characteristics of their occupation: routine, specific or general, offshorable or geographically immobile. Importantly, this exercise captures the source of risk individuals may experience. This implies, however, that workers within the same industry or occupation experience labor market risk in the same way. Due to the sunk costs necessitated in acquiring skills or the mere difficulty in adapting an occupation's task structure, individual risk emerges conceptually as sticky (see, e.g., Thewissen and Rueda, Reference Thewissen and Rueda2019) and homogeneous within an occupation. In reality, within-occupation inequality is rising, but not because of changes in task structures (Eckardt, Reference Eckardt2019; Iversen and Soskice, Reference Iversen and Soskice2019).
Aggregate shocks or local trends make within-occupation inequality especially prominent across firms and regions (Greenstone et al., Reference Greenstone, Hornbeck and Moretti2010; Autor et al., Reference Autor, Dorn and Hanson2013; Boeri et al., Reference Boeri, Ichino, Moretti and Posch2019; Iversen and Soskice, Reference Iversen and Soskice2019). Although it is normally assumed that local markets are in equilibrium, geographical differences in labor market outcomes persist across time (Overman and Puga, Reference Overman and Puga2002; Kline and Moretti, Reference Kline and Moretti2014), partly because of local shocks (Amior and Manning, Reference Amior and Manning2018) and partly because of insufficient labor mobility when local firms relocate elsewhere (Manning and Petrongolo, Reference Manning and Petrongolo2017). Furthermore, recent research shows that the share of tasks that can be done remotely varies across workers within occupations or industries (Adams-Prassl et al., Reference Adams-Prassl, Boneva, Golin and Rauh2020), while others find that not all workers in firms that close down or relocate perceive a subsequent job risk (Klandermans et al., Reference Klandermans, Hesselink and Van Vuuren2010). This is where individual labor market experience could address existing challenges: it can account for within-occupation variation in risk at a given time and trace how this risk evolves over time. In brief, research proposing that risk clusters at the occupation level may overlook variation within occupations in exposure to risk and possible transitions between secure and precarious employment within a given occupation. Therefore, I suggest that although most research exploring redistribution preferences can very well capture average differences across occupations in employment opportunities and related welfare preferences, it cannot identify within-occupation inequality in risk—that is, which individuals experience risk, how their risk unfolds over time, and how this labor market dynamic impacts public opinion change in support of the welfare state.
This paper takes an initial step in addressing these challenges, by proposing a measure of risk that is not imputed to respondents from occupational or sector information, but is rather informed by individual employment characteristics. In doing so, I make the following two contributions.
First, I recognize a dynamic risk component and account empirically for individual specific variation by relying on a long-run panel data. Although this strategy does not entirely eliminate all possible inferential difficulties resultant from risk not occurred randomly, it does allow me to control for key individual characteristics such as motivation or early family upbringing. A further advantage of analyzing individual experiences is that these are less susceptible to selection effects than individuals’ occupational choice.
Second, I explore individuals’ labor market experience through their employment characteristics. In brief, I maintain that individuals will demand higher insurance against risk when they are in riskier jobs, not necessarily in riskier occupations. In fact, I show that job vulnerability is a much better predictor of social spending demand than previously thought (Schwander and Hausermann, Reference Schwander and Hausermann2013). Focusing on individuals, I translate the likely implications of within-occupation heterogeneity in risk and its individual-specific evolution onto job characteristics. Expanding on earlier research focusing on employment status (Rueda, Reference Rueda2007; Burgoon and Dekker, Reference Burgoon and Dekker2010; Marx and Picot, Reference Marx and Picot2020), I suggest that both subjective and objective employment risks matter in forming redistribution preferences, but that dichotomizing risk is ill-equipped for increasingly transient and insecure working patterns. In the spirit of a dynamic account, I suggest that not only the current status, but also the frequency with which one experiences change, matters. Therefore, I introduce as a measure of employment risk a workers’ job tenure, alongside measures previously considered such as contract type and subjective job insecurity. Finally, I identify these three characteristics to map onto three employment risk types—those in secure jobs, those expecting or likely to lose their jobs, and those who have lost their jobs. I extend this framework to the study of redistribution preferences and contribute to a growing literature on the micro-level link between personal exposure to risk and individual-level political preferences (Hacker, Reference Hacker2019; Margalit, Reference Margalit2019; Rueda and Stegmueller, Reference Rueda and Stegmueller2019).
By making these two contributions, the paper proposes a new method to classify labor market risk and shows that labor market transitions (not just downward) substantially impact welfare state preferences—for example, decreasing one's risk makes her up to 5 percentage points less likely to support redistribution. At a time when populist appeals are on the rise and concerns over taxation often dominate the political discourse, this papers’ findings not only contribute to understanding public opinion shifts, but also speak to the comparative government literature more broadly. For example, Guiso et al. (Reference Guiso, Herrera, Morelli and Sonno2020) show that becoming more economically insecure decreases the likelihood to turnout in elections. If risk, however, does not cluster within clearly identifiable socio-economic groups like occupations, as this paper argues, then the impact on turnout could be interpreted as parties’ hardship in mobilizing scattered economically insecure individuals.
2. Variation in risk and preferences
A challenge in understanding public opinion changes is identifying whose preferences change. Of particular interest is tracing how social spending preferences respond to changes in economic circumstances, especially those related to individuals’ exposure to risk in the labor market. The argument I put forward proposes two sources of variation that one needs to theoretically account for: within-occupation variation in risk at a given point in time, and worker-specific variation over time. Although the two may be related, I identify distinct job characteristics that closely track these dimensions, both observable and objectively classifiable, and unmeasurable in objective terms, but where subjective risk provides leverage. Akin to existing research, I subscribe to an insurance logic through which these indicators are likely to impact political preferences.
2.1 Occupational risk
A series of influential articles situate the source of labor market risk at the occupational level. For example, Iversen and Soskice (Reference Iversen and Soskice2001) argue that the portability of one's skills across firms, skill-specificity, determine which workers are likely to experience unemployment. They maintain that workers with specific skills are valuable to only one firm or occupation, whereas those with general skills are likely to find employment in a different occupation or industry, a fact which lowers the latter's risk exposure. Technological change or globalization is also expected to impact an occupation's risk. Those in occupations least reliant on repetitive tasks (e.g., managers) or tasks that cannot be performed abroad (e.g., drivers) are expected to be least exposed to labor market risks (Walter, Reference Walter2017; Thewissen and Rueda, Reference Thewissen and Rueda2019). Although routinization suggests a skill-bias in the experience of unemployment risk, increasing reliance on artificial intelligence is expected to expose highly skilled workers to the negative labor market effects of automation (Webb, Reference Webb2019). As involuntary switches between occupations are more costly than between industries, the levels of unemployment of specific occupations, often measured through occupational unemployment rates, is considered informative about workers’ risk (Rehm, Reference Rehm2009).
Importantly, this study explains differences in average levels of risk across occupations. This is useful for understanding a series of aggregate economic and political outcomes such as wage polarization, declining union density, or inequality (Hirsch, Reference Hirsch2008; Goos et al., Reference Goos, Manning and Salomons2014; Moll et al., Reference Moll, Rachel and Restrepo2021).
Yet, if we are interested in understanding whose opinions change, and we believe this is driven by exposure to risk, then relying on aggregate data might only tell part of the story. As research on occupational risk explores different risk sources, it naturally concludes that different groups are risky—see Figure 1. The figure plots on the y-axis the ranked risk of each available ISCO-2 occupation based on routine task intensity, skill specificity, offshoring, and occupational unemployment rate. If each occupation was identified by all these measures to be similarly risk exposed, then all observations would fall on the dotted diagonal line.
Ranked occupational risk by source.
Note: The y-axis denotes the ranked risk of each available ISCO-2 occupation based on routine task intensity (RTI), skill-specificity, offshorability (Offshore), and occupational unemployment rates (OUR). On the x-axis, ISCO-2 occupations are ordered with respect to their ranked risk on the skill specificity measure. Within each ISCO-2 group, greater vertical spread informs about variation in risk based on the different source of risk considered.
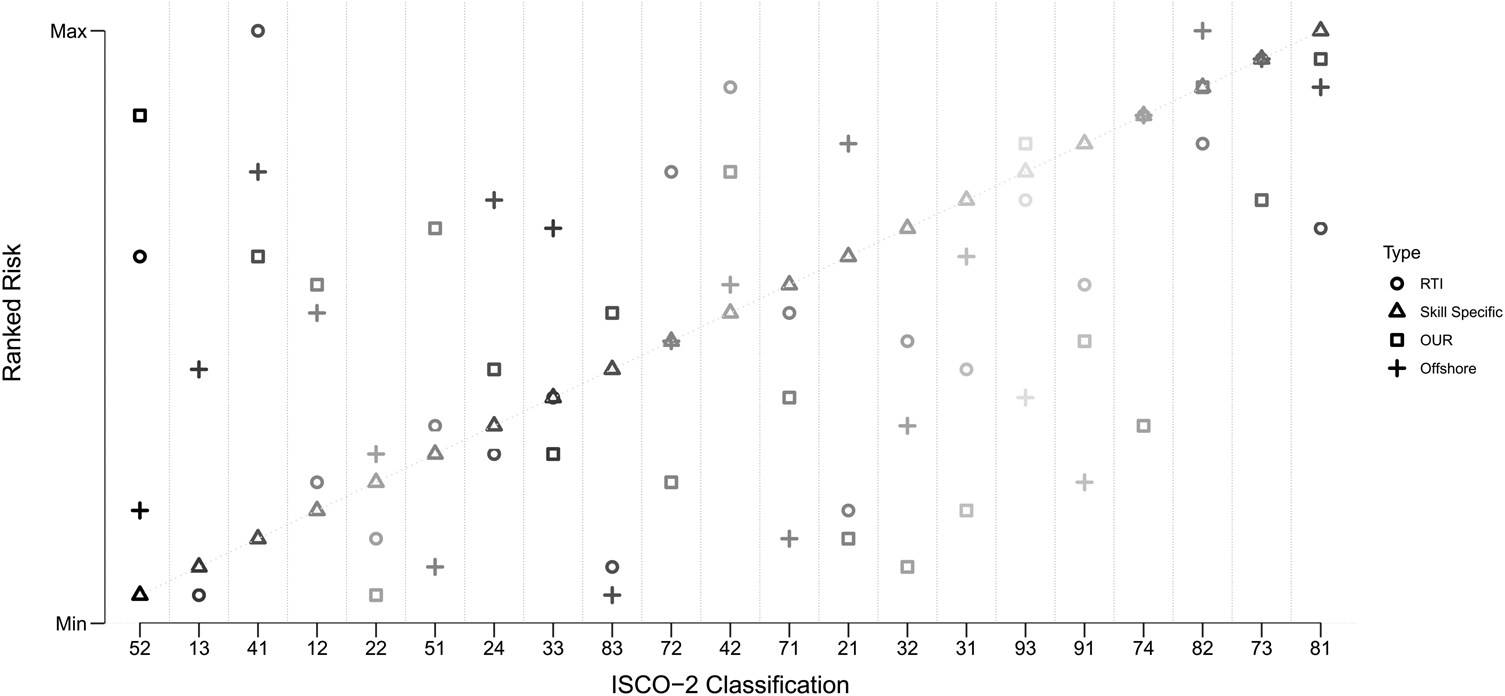
The fact that these measures map risk quite differently may therefore have important implications for understanding whose opinions change. Rather than thinking voters in most occupations are cross-pressured in risk depending on the source one considers, it is more plausible to suggest that work has become more precarious and more unequal within occupations (Katz and Krueger, Reference Katz and Krueger2017; Berger et al., Reference Berger, Chen and Frey2018).
2.2 Sources of individual variation
Why might individuals working in the same occupation experience risk differently? Although risk may vary across countries (Gingrich and Ansell, Reference Gingrich and Ansell2012), of particular interest is variation within institutional settings. I explore sources of within-occupation variation in risk at a given point in time and discuss how this may evolve heterogeneously over time.
Local labor markets are normally assumed to be in equilibrium. But, recent research suggests significant geographical differences in employment outcomes (Overman and Puga, Reference Overman and Puga2002; Kline and Moretti, Reference Kline and Moretti2014). Despite expectations, markets are not converging (Austin et al., Reference Austin, Glaeser and Summers2018).
Shocks in the labor market may disproportionately impact some regions, given initial differences in industry specialization, productivity, or migration flows (Glitz, Reference Glitz2012; Autor et al., Reference Autor, Dorn and Hanson2013; Boeri et al., Reference Boeri, Ichino, Moretti and Posch2019). Moreover, regional differences are accelerated by recessions or influenced by past unemployment, and vacancies may fall differently, even when exposed to the same process, such as routinization (Hershbein and Kahn, Reference Hershbein and Kahn2018; Bartik and Sotherland, Reference Bartik and Sotherland2019). In fact, such effects are persistent on local labor markets generating long-lasting hysteresis (Hershbein and Stuart, Reference Hershbein and Stuart2020), even when workers are identical (Bilal, Reference Bilal2020).
Firm characteristics can also influence within-occupation differences in risk. For example, firms may respond differently to shocks (Bloom et al., Reference Bloom, Draca and Van Reenen2016), firing costs and decisions may vary depending on firm size or employer expectations about economic conditions (Martins, Reference Martins2009; Coibion et al., Reference Coibion, Gorodnichenko and Ropele2020). Additionally, geographical sorting may explain what types of policies get implemented, such as initiatives aimed at training local workers or expanding union power (Jensen et al., Reference Jensen, Marble, Scheve and Slaughter2021). Furthermore, local conditions may also reflect local government's success in attracting firms through subsidies or multinational companies (Greenstone et al., Reference Greenstone, Hornbeck and Moretti2010; Slattery, Reference Slattery2018; Setzler and Tintelnot, Reference Setzler and Tintelnot2019).
In response, workers may differentially respond to local conditions. For example, location sorting may act as an investment that influences the type of future job opportunities (Bilal and Rossi-Hansberg, Reference Bilal and Rossi-Hansberg2018). In particular, working in a big city ensures a better match of jobs to high-quality plants and more valuable experiences (Roca and Puga, Reference Roca and Puga2017; Dauth et al., Reference Dauth, Findeisen, Moretti and Suedekum2018). This matters as jobs at more productive employers could be more stable (Bilal, Reference Bilal2020). At the other end, insufficient labor mobility when local firms relocate elsewhere may explain spatial mismatches between unemployment and vacancies (Blanchard and Katz, Reference Blanchard and Katz1992; Manning and Petrongolo, Reference Manning and Petrongolo2017). This happens, for example, due to declining internal migration related to workers’ home attachment (Coate and Mangum, Reference Coate and Mangum2019). The result, a mismatch between workers skills and demand for that skill, local skills remoteness, implies that if laid off, the workers have lower re-employment opportunities and at lower wage (Macaluso, Reference Macaluso2017).
Workers may also be heterogenously affected, even within-firms and occupations, based on last-in first-out rules, the type and length of employment, or taste-based discrimination (Sundstrom, Reference Sundstrom1992; Davis and Von Wachter, Reference Davis and Von Wachter2011; Egan et al., Reference Egan, Matvos and Seru2017; Coibion et al., Reference Coibion, Gorodnichenko and Ropele2020).
This suggests that although a worker's occupation, as income or education, may be a good predictor of economic insecurity (Jacobs and Newman, Reference Jacobs, Newman and Newman2008), occupations are affected differently depending on one's job, firm, or location. Therefore, to trace how individual experiences plan out, we might want to synthesize this information at the individual level.
2.3 Anchoring risk: an individual approach
One way to synthesize these sources of variation is to assert their likely impact on observable risk characteristics, such as contract type or job tenure, and on unobservable characteristics in objective terms, but where subjective expectations may expose private information.
2.3.1 Objective risk
Earlier research suggests that contract-type (part-time or full-time) is a reliable measure of individual risk (King and Rueda, Reference King and Rueda2008). Indeed, this could contribute to within-occupation variation in risk observed at a given point in time, as the share of individuals in alternative work arrangements or wanting to work longer hours has risen sharply in recent years (Katz and Krueger, Reference Katz and Krueger2016; Bell and Blanchflower, Reference Bell and Blanchflower2018). For example, recent research around OECD suggests that routine jobs based on standard contracts have been replaced by non-standard work (Codagnone et al., Reference Codagnone, Abadie and Biagi2016; OECD, Reference OECD2015, 10), but this may also be true for low-risk occupations that undergo precarious work, such a gig workers. Contract type may, of course, vary not just within-occupations, but also within-firms, as some firms may rely on a mix of fully employed and part-time workers to resist demands for wage increases from the latter, more protected employees (Bell and Blanchflower, Reference Bell and Blanchflower2018). Therefore, whether an individual is employed on a part-time or full-time contract can plausibly be considered an observable risk characteristic that varies within-occupations.
Employment stability, in particular, the likelihood of lasting matches between firms and workers may vary, as outlined above, with several firm and individual characteristics. Simply put, job tenure is likely to vary within-occupations driven by firm characteristics such as productivity or size, but also within-individuals, driven, for example, by their propensity to move when their employer relocates. Yet, this is an employment characteristic that has not been considered as contributing to workers’ insecurity, despite several reasons why those with longer job tenure may have lower risk of unemployment.
First, job tenure is a reliable proxy for employment rights, and therefore highly relevant from a legal standpoint. For example, continuous employment is required to qualify for statutory employment rights or to qualify for the right not to be unfairly dismissed (Fudge and Owens, Reference Fudge and Owens2006). This is particularly important for the growing pool of atypical workers, such as gig workers, which tend to switch jobs with a high frequency.Footnote 2 Second, experience that is both firm- and job-specific cannot be rewarded equally in another company, and therefore, the incentives to undertake such (firm specific) investments are stronger when there is expectation of long-lasting firm-worker matches (Becker, Reference Becker1962; Hashimoto, Reference Hashimoto1981; Hall and Soskice, Reference Hall, Soskice, Hall and Soskice2001; Doepke and Gaetani, Reference Doepke and Gaetani2018). Relatedly, those with longer tenure may be more likely to receive on-the-job training, which not only reduces perceptions of insecurity, but also makes the worker more valuable (Lebert and Antal, Reference Lebert and Antal2016). Third, longer job tenure may imply that the worker has become more productive at their job than a randomly selected worker, therefore the firm may have an interest in retaining that worker. Analogous to deterrent effects identified in Baderin and Barnes (Reference Baderin and Barnes2020) for insecure tenants not willing to invest integrating in the local community, workers with short tenure may underperform at their job whilst looking for alternative job arrangements, increasing thus their chances of getting unemployed. Therefore, firms that rely heavily on atypical workers may have lower productivity, which may matter for their survival. For example, Iversen and Soskice (Reference Iversen and Soskice2019) note that “knowledge-bearing companies range from great long-lived multinationals to short-lived high-tech start-ups in agglomerations of such companies,” and indeed, such businesses vary significantly in their degree of market risk. Finally, a last-in, first-out logic could apply, particularly for struggling firms and industries (Bender and Sloane, Reference Bender and Sloane1999; Von Below and Thoursie, Reference Von Below and Thoursie2010; Caggese et al., Reference Caggese, Cuñat and Metzger2019). Therefore, relying on the time a worker has spent in a job can be used as an observable risk characteristic that varies within-occupation, and potentially within-individuals over time.
2.3.2 Subjective risk
The role of expectations in decision-making is well known, but so far few empirical papers investigated the impact of subjective expectations on economic and political outcomes. For example, home price expectations influence individuals’ selling decisions (Bottan and Perez-Truglia, Reference Bottan and Perez-Truglia2020), macroeconomic or job loss expectations affect consumption behavior (Pettinicchi and Vellekoop, Reference Pettinicchi and Vellekoop2019; Roth and Wohlfart, Reference Roth and Wohlfart2020), and perceptions of crime and expectations of job loss determine redistribution preferences (Margalit, Reference Margalit2013; Rueda and Stegmueller, Reference Rueda and Stegmueller2016; O'Grady, Reference O'Grady2019). This suggests that although correlated with objective indicators of actual job loss (Stephens, Reference Stephens2004), subjective expectations can still have a distinct, direct effect on preferences and behavior (Rainer and Siedler, Reference Rainer and Siedler2008; Pettinicchi and Vellekoop, Reference Pettinicchi and Vellekoop2019).
Consequently, focusing on objective characteristics may only capture part of the story. “Losing a job flipping burgers and finding a new one as a parking lot attendant may not mean much of a pay cut, but it certainly doesn't mean things are looking up either” (Jacobs and Newman, Reference Jacobs, Newman and Newman2008, 86). So, what might subjective expectations capture additionally?
It is useful to remember that risk in the labor market captures both the probability of job loss and the severity of that loss in terms of future prospects of re-employment (Iversen and Soskice, Reference Iversen and Soskice2001).Footnote 3 Subjective insecurity may be informed by and highly correlated with objective insecurity as far as the probability of job loss is concerned. Even then, perceptions of unemployment risk may vary across individuals with the same objective risk of unemployment. This happens because subjective expectations reveal private information available to workers about subsequent realizations of job loss or re-employment (Dickerson and Green, Reference Dickerson and Green2012; Hendren, Reference Hendren2017), such as employer inflation expectations or home attachment (Coate and Mangum, Reference Coate and Mangum2019; Coibion et al., Reference Coibion, Gorodnichenko and Ropele2020).
The two indicators might also differ with respect to the second dimension concerning re-employment: “From neatly coifed executives to aproned production workers, once secure futures now seem threatened” (Jacobs and Newman, Reference Jacobs, Newman and Newman2008). Based on occupational measures, we can learn about differences in the average re-employment opportunities across occupations. However, as these vary across institutions, firms, and regions, a worker might be knowledgeable of the probability and severity of job loss well beyond what her occupation, contract type or length might imply. Indeed, this could be why not all workers perceive high insecurity when firms close down (Klandermans et al., Reference Klandermans, Hesselink and Van Vuuren2010). On the flipside, if a worker is not actually aware of the probability of losing her job, then surely relying only on objective measures is unlikely to fully capture the extent to which that worker supports social spending. In fact, Campbell et al. (Reference Campbell, Carruth, Dickerson and Green2007) show that subjective expectations better track job loss than observed objective characteristics, and argue this happens because of private information available to workers, which cannot be captured in conventional objective variables.
In brief, subjective expectations of unemployment are generally correct, although individuals may overweight some experiences (Campbell et al., Reference Campbell, Carruth, Dickerson and Green2007; Conlon et al., Reference Conlon, Pilossoph, Wiswall and Zafar2018; Roth and Wohlfart, Reference Roth and Wohlfart2020). However, as subjective insecurity is likely to capture otherwise unavailable information such as relationship to employer, performance on the job (especially important for gig workers), the use of both subjective and objective measures is therefore a qualitative improvement on work using only subjective or only objective measures.
2.3.3 Summary
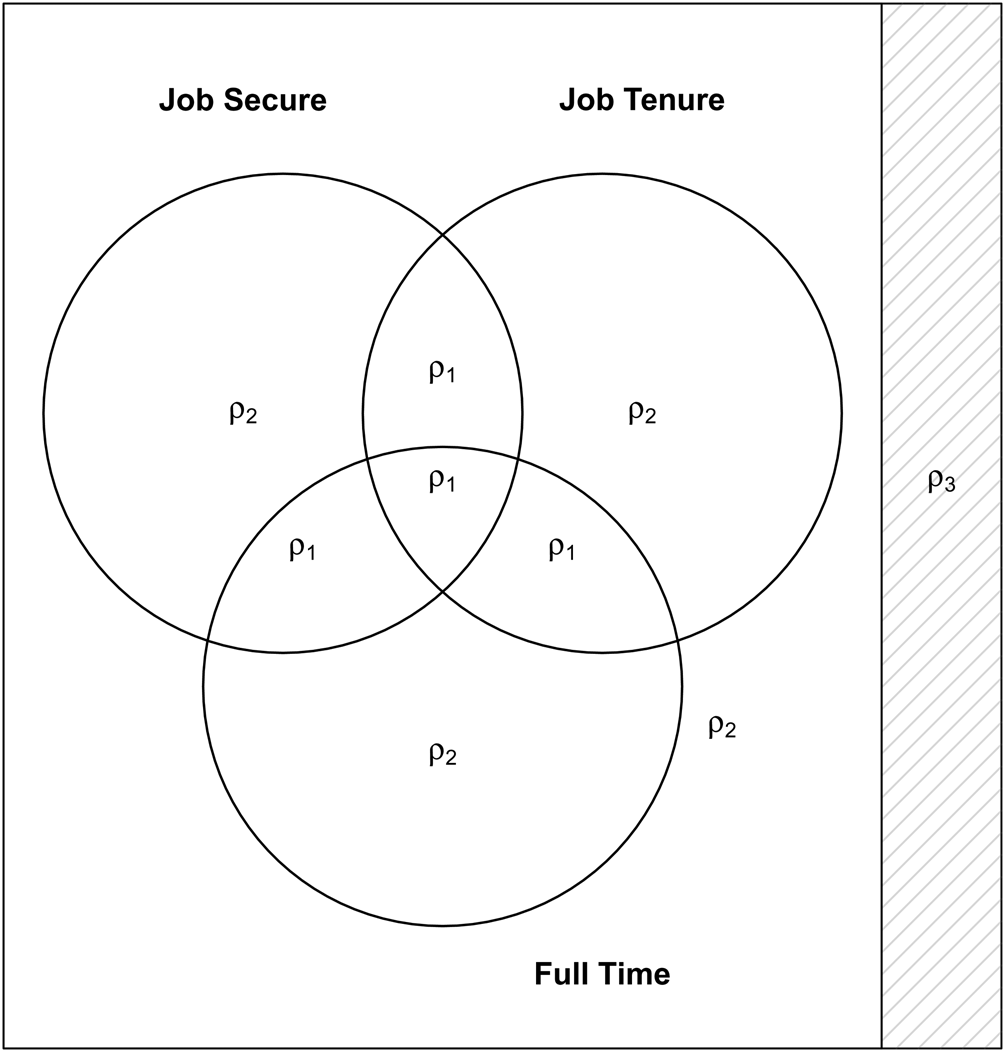
Based on these considerations, I propose a dynamic approach that integrates the objective and subjective facets of risk and maps the labor force into three groups, as shown in Figure 2: those without a job, those employed in a precarious job, and those employed in a secure job, each with a corresponding risk but also employment opportunity. This implies that the risk of the unemployed (realized risk ρ 3) differs from that experienced by precarious workers (risk ρ 2). This also means that secure workers (risk ρ 1), although low, do experience labor market risk.Footnote 4
Defining risk type.
Note: Full-time denotes the standard binary classification of individuals’ contract type based on their contractual working hours (part-time versus full-time). Job Tenure captures the number of years an individual is employed with one (and the same) employer, as described in Figure D.1. This is represented by a binary classification differentiating those who have continuously worked with the same employer and those who have not. Job Secure is represented a binary, distinguishing people who consider their job to be secure from those who consider it insecure. As in any standard Venn diagram, the figure plots logical sets as circles within an enclosing rectangle (the universal set) and common elements of the sets are represented by intersection of the circles.
2.4 Implication for preferences
As modern welfare states redistribute income and provide social insurance (Barr, Reference Barr2001),Footnote 5 individuals are not only motivated by redistributive calculations, but also by insurance motives (Moene and Wallerstein, Reference Moene and Wallerstein2001). Extending the research of Romer (Reference Romer1975) and Meltzer and Richard (Reference Meltzer and Richard1981), a growing literature finds that exposure to risk, in particular in the labor market, increases support for social spending (Margalit, Reference Margalit2019; Rueda and Stegmueller, Reference Rueda and Stegmueller2019). I apply this insurance logic and derive similar expectations in Appendix A. In brief, I expect a dynamic relationship between risk and social spending preferences, meaning an individual transiting into a more (less) secure job is expected to decrease (increase) her demand for insurance compared to her time in a less (more) secure job.
One key feature of this expectation is that individuals can change their risk by transiting not only into a less secure job, but also into a more secure one. Consequently, studying how individuals respond to change is important in capturing individuals’ responsiveness to risk,Footnote 6 and ultimately understanding public opinion changes.
3. Data and measurement
To explore empirically the proposed dynamic relationship, individual-level panel data are desirable for three main reasons. First, identifying changes in risk requires detailed information about the individual's current and past experience in the labor market and associated social spending preferences. Second, panel data are preferred to cross-sectional data because it enables modeling individual specific variation. Third, panel data are needed in order to objectively measure job tenure. In addition, a long-run panel is ideal in order to allow the observation of sufficient labor market transitions and subsequent social spending preferences.
To meet these criteria, I employ a long-run panel data following individuals from 1999 to 2014 from Switzerland. The Swiss Household Panel (SHP) is a stratified random sample of private households, representative of the non-institutional resident population in Switzerland (Voorpostel et al., Reference Voorpostel, Tillmann, Lebert, Kuhn, Lipps, Ryser, Schmid, Antal, Monsch and Wernli2016). It started in 1999 and it includes two sample refreshments, one in 2004 and one in 2013. Crucially, the SHP measures social spending preferences as well as perceived job security, contract type, and detailed information about each individual's employment history and job characteristics.
The dependent variable used in this analysis is captured by the question “Are you in favor of a decrease or in favor of an increase in federal social spending?.” Potential answers include “in favor of an increase,” “neither” or “in favor of a decrease.” This question does not distinguish a redistribution logic from an insurance one. Although many other scholars have previously used such measures (Iversen and Soskice, Reference Iversen and Soskice2001; Rehm, Reference Rehm2009), it is clear that although serious, the problem is not “fatal” given that the two preferences are highly correlated (Alesina and Giuliano, Reference Alesina, Giuliano, Benhabib, Bisin and Jackson2011). Nevertheless, in two waves, corresponding to the years 2011 and 2014, respondents are asked about several social policy issues, including spending on unemployment benefits. Figure D.4 shows the positive correlation between demand for federal social spending and unemployment benefits spending.
The question asks specifically about federal social spending preferences. Switzerland has been a federal state since 1848. It resembles the USA's dual-federalism in that there are clear divisions of power between the federal and the canton level. It is essential thus for respondents to report their desired federal spending level rather than the canton ones. Social insurance in Switzerland reveals a story of progressive transfer of power from the canton to the federal level (as happened in Germany or the USA), especially on matters of insurance. The contemporaneous Swiss system places responsibilities for unemployment, sickness, and disability insurance with the federal government rather than cantons (Noel, Reference Noel2004; Obinger et al., Reference Obinger, Armingeon, Bonoli, Bertozzi, Obinger, Leibfried and Castles2005).
Three questions are used in order to construct the individual-based risk in the labor market. The first, related to individual's perceived job security, asks the respondents “Would you say that your job is very secure, quite secure, a bit insecure or very insecure?.” Respondents are given four options, ranging from “very secure” to “very insecure.” The question is particularly useful since it avoids creating a mid-point response bias, usually associated with Likert items. The second, straightforwardly asks respondents who are employed whether they are part-time or full-time “Currently, in your main job, do you work part-time or full-time?.” The third question asks whether the individual has changed her job in the last 12 months, with potential answers being “yes, only jobs (with the same employer),” “yes, employers (same job),” “yes, jobs and employers,” “no, neither jobs nor employers.” This third variable allows the construction of the job continuation measure. Based on these measures, individuals’ employment characteristics complying with at least two high-risk indicators are classified as risk ρ 2 and those with at least two low-risk indicators are classified with risk ρ 1, as depicted in Figure 2.
Income is measured at the household level and is adjusted for the number of household members and their age by employing the OECD-modified equivalence scale (Atkinson et al., Reference Atkinson, Rainwater and Smeeding1994; Hagenaars et al., Reference Hagenaars, de Vos and Zaidi1994). This measure is equivalent to the cost of living price index: it estimates the ratio between a household's income compared with that of a single individual's income who enjoys the same utility as that household (Browning et al., Reference Browning, Chiappori and Lewbel2013). By accounting thus for the number of a household's members, this measure avoids under- or over-estimations of the relative wealth of a household or of the relative impact of income shocks for any given household. In order to account for the skewness of the income distribution, the household income is log-transformed. The measurement of other covariates is described in the Appendix.
4. Results
I begin by examining respondents’ baseline social preferences informed by their risk type, irrespective of income or other individual characteristics. Based on the theoretical framework, this attribute alone should have an independent effect on spending demand. Figure 3 reports the preferences among all labor market participants from the pooled sample. Informed only by their associated risk status, those classified as least exposed to risk, ρ 1, are likely to demand about 7 percent less spending than those in a precarious job (risk ρ 2) and about 12 percent less than the unemployed (realized risk, ρ 3). Similarly, there is a sizeable difference between the unemployed and the high-risk workers of about 5 percent. This reaffirms the importance of accounting for risk, as emphasized in the insurance models. That said, it also tentatively shows that risk can be synthesized at the individual level.
Risk type and social spending.
Note: The bar plot shows the average support for social spending by risk type accompanied by 95 percent confidence intervals. Individuals classified as meeting at least two high-risk indicators (i.e., perceived job insecurity, no job tenure or part-time contract) are defined as ρ 2, those with at least two low-risk indicators are defined as ρ 1 and those who have been laid off as ρ 3 (see Figure 2).

When accounting for the individuals’ position in the income distribution, higher incomes are expected to inform lower support for redistribution. As individuals are expected to be motivated both by redistributive and insurance motivations, their spending preferences are predicted to be decreasing in income and increasing in risk, as in Figure A.1. This expectation is corroborated in Figure 4.
Spending demand by income and risk type.
Note: The left panel plots the income distribution by risk type. The right panel explores this relationship with respect to demand for social spending and shows predicted levels of spending support by risk type and income. Estimates are based on a linear probability model, and presented along with their 95 percent confidence interval based on clustered robust standard errors.

The left panel plots the income distribution by risk type. Although having a different mean and distribution probabilities, individual risk occurs across the income distribution. This may imply that differences in social spending preferences merely reflect an income effect. The right panel though clarifies this is unlikely to be the case. Specifically, for the same income level, secure workers are shown to demand lower spending than the unemployed.
I proceed by estimating individual-specific redistribution demands, a model that could account for unobserved individual heterogeneity.Footnote 7 When an individual is followed for a lengthy period of time, as here, the unobserved effects could also be interpreted as capturing features of the individual such as motivation or early family upbringing. The panel data setup is convenient as it makes possible to track individuals over time. Essentially, if an individual's labor market risk changes across time and this affects her spending preferences, then the estimated coefficients would capture this effect. Equation 1 describes the model that includes individual fixed effects and time-varying controls X* such as income, education, civil status and wealth:

Table 1 reports the results. All models include time fixed effects (λt), capturing the influence of aggregate time trends. Subnational unemployment rates tend to be higher in the French- and Italian-speaking cantons than in the German-speaking ones, which explains the notable different levels of social spending demands. Interestingly, there is quite some variation even within regions speaking the same language. In order to address this issue empirically, all models include canton fixed effects (θc). For ease of interpretation, all models present results of a linear probability estimation, and the coefficients can directly be interpreted as percentage points change in the dependent variable associated with each covariate.
Fixed effects analysis: risk and social spending demand

Note: The outcome is binary denoting whether the respondent supports more social spending. The second model includes time-variant controls for income, education, and region, whereas the third model includes, in addition, time-varying controls for home ownership, and civil status. Standard errors are clustered at the unit level. ***p<0.01, **p<0.05, *p<0.1.
The outcome of interest is support for higher levels of social spending. Model (1) serves as a reference to the relationship between risk exposure and social spending demands. Model (2) includes a restricted set of time-variant covariates, such as income and education. The coefficients capturing labor market risk continue to posit a statistically significant relationship between individual-based risk exposure and social spending demand. Finally, model (3) includes a comprehensive vector of time-varying covariates, which includes, apart from income and education, a respondent's civil status and wealth (in the form of real estate ownership). Given the use of a within-individual estimator, these coefficients inform how, on average, social spending demands compare across different risk exposure categories for a given individual. Therefore, a secure worker (with risk ρ 1) is expected to demand, on average, 5 percentage points less spending than during her unemployment and 2 percentage points less spending than during her time in precarious work. In sum, this exercise finds that changes in individuals’ labor market position translate into changes in social spending demand.
5. Robustness checks
The foregoing discussion suggested that risk may not be homogeneous within an occupation, and that consequently, inferring individuals’ economic experiences from occupational information might conceal greater variation in risk—fact which is also depicted in Figure D.8.Footnote 8 But, if risk is not homogeneous within occupations, is it within risk types? Figure D.6 plots the difference between the various combinations of objective and subjective measures from Figure 2 and estimates their effect on spending demand for precarious (risk ρ 2) and secure (risk ρ 1) workers. The null-effects imply that the groups are indeed homogeneous in their redistribution preferences.
An empirical limitation of most measures of risk is that they cannot account for the possibility that preferences change over time. This is the case for measures such as skill-specificity, RTI, or offshoring. This, however, is possible with OUR and the proposed classification, as shown in Figures D.7 and D.9. Comparing how the two measures perform over time, it appears that both measures pick up variance in risk and preferences over time, but that the OUR measure bundles together high and risk occupations, making most of them indistinguishable. Also, individuals working in occupations with higher unemployment rates sometimes demand just as much or even less spending than more sheltered occupations. By contrast, the three groups proposed in this paper do maintain their predicted differences in demand across time.
I test the validity of the insurance mechanism against a placebo outcome and the “impressionable” year hypothesis. First, I use the proposed risk classification to test whether it significantly affects individuals’ support for unrelated policy domains such as nuclear energy spending. If risk exposure were not the mechanism linking the individual's labor market status to insurance demands, then one may expect differences among individuals also with respect to such policies. The null results reported in model (1) of Table D.3 validate the mechanism.
Relatedly, it is important to note that individuals’ preferences may be more volatile during their socialization period or “impressionable” years (Sears, Reference Sears, Kiesler, Morgan and Oppenheimer1981). This opens the possibility that changes in preferences occur among the youth and may not necessarily be related to the individuals’ risk exposure. Following the trajectory of attitudinal stability presented in Dinas (Reference Dinas2013), I restrict the sample to those over 25 years old (Table D.3, model (6)) corresponding to probabilities of less than 0.5 of an attitude change. Therefore, the chosen cut-off seems to capture individuals who have passed the “impressionable years” and reached political maturity. The estimates suggest that including only adults who have reached attitudinal stability does not affect the interpretation of the main results. Finally, Table D.3 reports the robustness of the results following the inclusion of local time trends and several time-varying covariates such as ideology, membership in a trade union, and employment in the public sector.
6. Discussion
This paper has introduced a new approach for evaluating personal labor market risk and its impact on redistribution preferences that addresses two important shortcomings in earlier research. First, previous researchers have assessed this relationship by imputing to individuals risk from occupation or sectoral characteristics. This, importantly, may overlook important variation in risk within occupations. Second, earlier research relied on cross-sectional comparisons capturing risk and preferences only at a given point in time. This means that over-time variation in individuals’ experiences is not captured. I attempted to obtain a more realistic measure of risk by relaxing these assumptions. Although the method suggested can be applied to measure risk in any system, I focus on Switzerland as this is a very unlikely case for labor market risk to manifest. Using data from a long-run panel data, this paper may have a better claim at causality than previous research.
I argued that aggregate shocks or local trends make within-occupation inequality especially prominent across firms and regions, and that this may vary heterogeneously over time. Although structural changes in the labor market have created labor markets increasingly reliant on precarious jobs, these processes have obvious macro-level industrial and occupational effects, but ultimately impact on job characteristics. I suggested one way to synthesize these sources of variation is to assert their likely impact on observable risk characteristics, such as contract type or job tenure, and on unobservable characteristics in objective terms, but where subjective expectations may expose private information. Consequently, I proposed a dynamic approach that integrates the objective and subjective facets of risk and argued these map onto three risk types—those in secure jobs, those expecting or likely to lose their jobs and those who have lost their jobs. I extended this framework to the study of redistribution preferences and showed that a dynamic relationship exists and that a change in risk changes redistribution support.
Two main implications regarding aggregate demand for redistribution may be derived. The first concerns the identity of the median voter. Based on labor shares, this paper follows the standard view of occupational-based risk arguments by positioning the median voter as a secure worker. In my framework, the median voter is easily identified as that holding a secure job, whereas this is not clear under alternative explanations, where the occupation of the median voter is not the same across specifications, as Figure 1 set out. Therefore, thinking of public opinion shifts, this framework could provide traction in understanding whose preferences change. A second implication concerns the role of occupations in coalition formation. If individuals are more likely to perceive risk as clustering alongside types of jobs (secure versus insecure) rather than across macro-societal groups (such as class or occupation), then the lack of a clear structure in organizing individuals’ interests is likely to unveil obvious coordination problems, and inference about individuals’ support for populist appeals in favor of the “forgotten” people. Future research should therefore consider to what extent coordination problems in articulating spending preferences matter and how an increasing pool of highly risk exposed individuals demanding higher taxation but also paying less contributions may affect government budget balance.
Supplementary material
The supplementary material for this article can be found at https://doi.org/10.1017/psrm.2021.45.
Acknowledgments
I thank Ben Ansell, Elias Dinas, Ray Duch, Andy Eggers, Laurenz Ennser-Jedenastik, Jane Gingrich, Gerda Hooijer, Desmond King, Spyros Kosmidis, Thomas Kurer, Scott Lavery, Akshay Mangla, Tom O'Grady, Stavros Poupakis, David Rueda, and seminar participants at the University of Oxford, annual conference of the European Political Science Association 2018, Political Economy of Finance Workshop, PSA British and Comparative Political Economy Specialist Group Workshop as well as the editor and two anonymous reviewers for fruitful discussions and suggestions. I am grateful to Nicolas Pekari for sharing detailed data on occupational unemployment. This study has been realized using the data collected by the Swiss Household Panel, which is based at the Swiss Centre of Expertise in the Social Sciences FORS and financed by the Swiss National Science Foundation.


 Open access