

Key messages
Chapter 1.1 discusses the use of taxes and social health insurance (SHI) contributions. A key objective of health financing is to redistribute financial resources from the healthy to the sick and from the well-off to the poor. This can be best achieved through compulsory prepayment mechanisms like general taxes and social contributions. Key learning includes that:
A high reliance on public revenue-raising instruments (general taxes and/or SHI) is essential to progress towards universal health coverage (UHC).
Large informal economies and poor governance can make collecting public revenues difficult in low- and middle-income countries.
Health financing systems have to be able to adapt to:
○ offset challenges to the revenue base such as economic decline, low levels of economic development or a preponderance of informal employment or economic activity; and
○ meet increasing health care demands which grow with rising expectations and population ageing.
The traditional distinction between health systems that rely on general taxation (Beveridge or National Health Service (NHS) systems) and social insurance contributions (Bismarck or SHI systems) has blurred with time.
Health systems increasingly rely on a diverse mix of revenue-raising instruments to finance health care.
There is a growing focus on delinking employment from entitlement to services in historically SHI-based systems and on emphasizing general taxation as a complementary source of revenues.
Introduction
The objectives of this chapter are to describe global trends in countries’ use of general taxation and SHI to finance health care and, by taking relevant country examples, to highlight some of the key challenges that governments face in raising public revenues for health as well as some of the solutions.
General taxation and SHI
Public funding of health systems is crucial to promote financial protection and improve access to services. The two dominant styles of publicly financing health care are general taxation and SHI – collectively referred to as public revenue-raising modalities – which enable health systems to move away from reliance on private out-of-pocket (OOP) spending at the time and place of seeking care. Financing health systems from OOP spending is both inefficient and inequitable, exposing individuals and households to financial risk when seeking care, including the risk of deeper impoverishment, as well as contributing to foregone care. Under general taxation, revenue comes from the share of overall government resources apportioned to the provision of health care. Under SHI, on the other hand, revenues are raised in the form of contributions from mandatory earmarked payroll taxes. The nature of health services – the presence of externalities, information asymmetries between providers and patients, the need for protection from the financial burden of unanticipated health spending, common public good elements, lack of competition in the hospital sector, information failures, etc. – is such that overdependence on unregulated private financing inevitably leads to suboptimal outcomes, including from the perspective of equity (Arrow, Reference Arrow1963).
Compulsion and redistribution
Well-designed health financing systems ensure that there is some form of mandatory prepayment combined with redistribution for funding health. Compulsion and redistribution are key elements of public financing for countries to make progress towards UHC, i.e. where everyone can access the essential health services they need without facing undue financial hardship in the process of doing so (Fuchs, Reference Fuchs1996; WHO, 2010; Kutzin, Yip & Cashin, Reference Kutzin, Yip, Cashin and Scheffler2016; Tandon & Reddy, Reference Tandon and Reddy2021). Critically, this involves risk pooling from the healthy to the sick as well as from the well-off to the poor via progressivity in prepayments. Although some countries implement this by mandating the purchase of private health insurance with targeted subsidies for those who cannot afford premiums, most countries have made progress towards UHC using public financing, i.e. via general taxation and SHI (Kutzin, Reference Kutzin2012). Voluntary health insurance (VHI) plays a complementary or supplementary role but is not the primary mechanism for financing UHC globally, while funding from external sources including development assistance plays a role, particularly in lower-income settings (see chapters 1.3 and 1.4).
The health financing transition
In general, as countries grow and develop, overall levels of funding for health increase along with the share that comes from public sources, thus decreasing reliance on OOP and external financing. Across low- and middle-income countries (LMICs), this empirical trend – dubbed “the health financing transition” – brings with it the challenges of raising obligatory contributions for health care, whether as general taxes or mandatory SHI contributions (Fan & Savedoff, Reference Fan and Savedoff2014). These challenges include low levels of economic development, high levels of poverty and informal economic activity, difficulties in collection of taxes, institutional and governance-related weaknesses and a low priority ascribed to, and poor absorption of, allocations for health in government budgets (World Bank, 2016). In high-income countries (HICs), on the other hand, governments are contending with the problems of an ageing population: rates of participation in the labour force are declining, so necessitating general tax infusions for SHI systems as contribution bases shrink, while at the same time the demand for and costs of health care are rising, thus raising issues of the existing systems’ long-term sustainability (Stadhouders et al., Reference Stadhouders2019; OECD, 2015).
The rest of the chapter is laid out as follows. First, we elaborate on the definitions of public financing for health, general taxation and SHI in particular, and examine how each relates to principles of equity and efficiency and where their boundaries have blurred. Next, we summarize the global landscape and trends in public financing for health across countries. Then, we outline key challenges facing public financing for health across the different income groupings of countries and some of the solutions.
General taxation and SHI: how countries use them to raise revenues
High-performing health financing models for UHC can be characterized as those where financing levels are adequate, prepaid funds are pooled in order to spread the financial risks of ill health and spending is efficient and equitable. These characteristics ensure the desired levels of effective service coverage and financial risk protection for all people, and provide a system that is both resilient and sustainable (World Bank, 2019a). In general, the overall objectives of public financing are considered to be the provision of public goods as well as to address market failure, redistribute resources and stabilize the impact of business cycles. In the case of the health sector, expansion of public financing constitutes the means by which most countries have made progress towards UHC, including the elements of compulsion and redistribution that are inherent in such a financing modality, though – in a few cases – countries have instead implemented mandates and subsidies for purchasing private health insurance.
General taxation: definition
Under general taxation, revenues for health come from apportioning a share of overall government resources to the provision of health care, either for the entire population or for specific population subgroups such as the poor and vulnerable (Gottret & Schieber, Reference Gottret and Schieber2006). This type of general tax-financed public delivery system is often referred to as the Beveridge model, named after William Beveridge, the economist whose ideas underpinned the introduction of the United Kingdom’s NHS in 1948. Even earlier than this, in the 1920s, a similar, though more centralized and hospital-focused system of universal coverage had been introduced in the Soviet Union, known as the Semashko model, after health care commissar, Nikolai Semashko.
The term general taxation is often used interchangeably with general government revenue financing, although in fact the latter is more accurate since government funding typically comprises both tax and non-tax sources. For example, general taxation financing also includes both general and sector-specific borrowing by the government. Tax revenues are defined as “compulsory, unrequited” payments to the government; unrequited because the benefits received from government spending are usually not proportional to the amount paid in taxes (OECD, 2021). Tax revenues are further classified into two broad categories, direct and indirect. Direct taxes – for example, taxes on income, profit, wealth and property – can be adjusted based on the characteristics of the payer, but cannot be shifted to another taxpayer. Indirect taxes, in contrast, are paid on transactions that are independent of the characteristics of the payer – for example, taxes on consumption, including sales taxes, value-added tax (VAT), excise taxes and import tariffs; these can, at least in part, be shifted to other taxpayers. Non-tax revenues typically comprise sources of funds other than from taxation: for example, from external grants, rents or royalties from natural resources such as oil, gas and other commodities, as well as profits from state-owned enterprises.
SHI: definition
Under SHI, revenues for health are raised in the form of contributions from a mandatory earmarked payroll tax (Wagstaff, Reference Wagstaff2010; Yazbeck et al., Reference Yazbeck2020). Payment of this mandatory contribution secures entitlement to health care, and it is this quid pro quo payment-for-entitlement that is one of the key differences between SHI and general taxation modalities for raising revenues for health. SHI contributions are generally imposed on wages and are paid by both employers and employees of firms as well as by those who are self-employed. Hence, due to the way revenues are collected, there is typically a link between employment status and entitlement. Under SHI financing, funds are pooled, and service providers are paid prospectively or retroactively on behalf of contributors for utilization of health care services; in some countries; for example, in Costa Rica, the SHI agency that collects and pools contributions also owns and manages service delivery via its own network of providers (OECD, 2017a). Contribution rates are usually set based on actuarial analysis of estimated costs and projected utilization rates. An SHI system is also sometimes referred to as the Bismarck model, named after Otto von Bismarck, Chancellor of Germany, who introduced it there in 1883.
Overlapping approaches to public financing in health
General taxation and SHI contributions are often collectively referred to as public sources of health financing given that they both constitute mandatory prepayments for health care and the fact that management and administration of these funds is usually undertaken by government or quasi-public agencies. Some countries – including the Netherlands (Kingdom of the)Footnote 1 and Switzerland – mandate that citizens purchase private health insurance; despite the presence of this mandate, revenues raised thus are managed and administered by private entities and, hence, are not considered to be public sources of financing. The latest System of Health Accounts (jointly produced by the Organisation for Economic Co-operation and Development (OECD), Eurostat and the World Health Organization (WHO)) eschews categorizing revenue-raising modalities for health in terms of public versus private; instead, the distinctions are based on whether revenues are: (i) compulsory or voluntary; (ii) domestic or external; and (iii) prepaid or OOP (Jowett & Kutzin, Reference Jowett and Kutzin2015; OECD, 2017b). For the remainder of this chapter, we follow others in the literature and take health’s share of general government expenditure – financed by domestic revenues, borrowing, external grants and mandatory SHI contributions, but excluding resources raised via compulsory private insurance prepayments – to represent the overall public financing envelope for health (WHO, 2020).
General taxation and SHI versus principles of equity and efficiency
A key issue is who contributes to and who benefits from a publicly financed health system. One policy objective for such a system is that it should be equitable, with those most able to pay shouldering the heaviest burden of the costs (so in effect redistributing resources from the well-off to the poor). However, obligatory contributions to public funds such as general taxes and SHI can be either progressive or regressive. While progressive payments are defined as those where the well-off pay a generally higher share of their income, a regressive payment is one where the poor pay a higher share of their income relative to the well-off. Generally, direct taxes – on income, property, wealth – are progressive. Indirect taxes – for example, taxes on consumption – are generally regressive. However, governments need to consider not just equity in payments linked to any instrument, but also the possible yield in terms of revenue generation, as well as the cost of collection. They also have the option to compensate for regressivity in any given instrument in two ways: making another instrument more progressive or compensating the poor using transfers in cash or kind from the revenue that is raised. In that sense, progressivity in terms of revenue generation of any particular instrument is not greatly relevant: the equity of the financing system needs to be assessed in terms of the distribution across individuals of net benefits, i.e. the payments into the system overall, including for health, net of what they receive as benefits in cash or kind (and not just health benefits) (Kaiser, Bredenkamp & Iglesias, Reference Kaiser, Bredenkamp and Iglesias2016; Jellema, Wai-Poi & Afkar, Reference Jellema, Wai-Poi and Afkar2017; World Bank, 2018).
Efficiency in how government revenues are raised is another key consideration in public finance, including for health. All taxes introduce distortions to economic activity by creating a gap between what a buyer pays and what a seller receives. Not only does this cause welfare losses, if not offset or balanced by externalities, but it can also adversely impact resource allocation decisions. In addition, some forms of tax collection themselves can be costlier to administer than others. Well-designed tax systems typically aim to reduce the economic inefficiencies that are inherent in any form of taxation, be progressive and broad-based in their incidence (ideally with minimal exemptions and loopholes) – and be relatively easy and cost-effective to administer.Footnote 2
Several countries, mostly high income, that originally financed their health provision by means of SHI systems subsequently abolished them – usually out of concerns for equity or as part of more general political reforms – and replaced them with tax-financed systems (Saltman & Dubois, Reference Saltman, Dubois, Saltman, Busse and Figueras2004). For instance, the United Kingdom absorbed its existing system of SHI when it transitioned to general tax financing in 1948. Norway abandoned its SHI system in 1967, followed by Denmark in 1973. Political transitions furthermore resulted in the removal of SHI and replacement by tax financing for health in Greece, Italy, Portugal and Spain. Conversely, many countries that started out with solely tax-financed health systems later introduced SHI, sometimes as a way to reduce financial pressure on existing tax-financed public delivery systems, but without dismantling them – in particular, in eastern and central Europe. In many countries – for example, in India (see Box 1.1.1), Nigeria, Myanmar and others – both general taxation and SHI financing systems coexist in parallel, but covering different population subgroups.
India’s tax-financed public delivery health system is universal, accessible to all and loosely modelled on the United Kingdom’s NHS. It also has several supplementary noncontributory and contributory SHI schemes.
Pradhan Mantri Jan Arogya Yojana (PM-JAY): Noncontributory tax-financed hospitalization coverage scheme for the poor and near-poor which was introduced in 2018 and targets the bottom 500 million of India’s population.
Central Government Health Scheme: This covers current and retired central government employees and their dependants, giving them access to public and designated private facilities.
Employees’ State Insurance Scheme: For lower-income workers of private firms with 10 or more employees.
One advantage of general taxation over SHI is that the former is more broad-based and, hence, assumed to be more resilient and less volatile as a source of public financing. However, this is not always the case. This purported advantage of general taxation as a source of financing can be lost during economic downturns when public revenues decline significantly, especially in the absence of automatic stabilizers and countercyclical policy responses (Maresso et al., Reference Maresso2015). General taxation financing is also subject to political vicissitudes and competition for resources from other sectors, which can add to elements of unpredictability (Wagstaff, Reference Wagstaff2010). Although SHI revenues are also not immune to economic crises, in some countries – for example, Estonia during the 2008/2009 economic downturn – SHI reserves can help stabilize volatility and other challenges to short-term revenue-raising pressures. In general, a move towards a diversified revenue base appears to offer the best prospects for mitigating some of these challenges.
Over time, distinctions between the SHI versus the general taxation public financing models have blurred, so much so that they have lost several core characteristics that initially differentiated them (Yazbeck et al., Reference Yazbeck2020; Mathauer, Saksena & Kutzin, Reference Mathauer, Saksena and Kutzin2019). Included under the umbrella of general taxation financing modalities are situations in which governments impose additional taxes on income or consumption specifically for health, whether or not these are earmarked at source or for use (or both), although payment of these earmarked taxes is usually not a prerequisite for entitlement to health care. At the same time, SHI systems are increasingly dependent on cofinancing via general taxation, either due to prevalence of informal economic activity or the impact of an ageing population. Where governments subsidize contributions – for example, if SHI contributions are fully or partially subsidized for the unemployed, the poor and pensioners – these are classified and analysed as cofinancing via general taxation even if they are paid out by SHI schemes. Several general tax-financed health funding models now include elements that were previously considered to be hallmarks of SHI-financed systems, such as having a clear separation between purchasers and providers, explicit and well-defined benefits packages, use of non-traditional provider payment mechanisms, as well as the purchasing of services from both public and private providers.
It is important to note that the way revenues are raised in health systems can have significant implications for the pooling function of health financing; for example, if resources are raised and pooled separately by geographical areas or – as is sometimes the case under SHI – by industrial affiliation. This is addressed elsewhere in the book (see Chapter 2.1); for the remainder of the chapter, we focus primarily on issues and challenges related to revenue generation via public financing.
Amount and modality of health funding versus country income level
Globally in 2019, the latest year for which data from WHO’s Global Health Expenditure database were available at the time of writing, levels of per capita health spending – from all sources of financing, not just public – ranged from lows of <US$ 25 in Burundi, the Democratic Republic of the Congo, Madagascar and South Sudan to highs of >US$ 8000 in Norway, Switzerland and the USA. Although these differences are not adjusted for variations in purchasing power of currencies across countries – for example, US$ 1 buys more in low-income countries (LICs) than it does in HICs due to cheaper labour and other costs – the contrast in absolute levels of health spending across countries is nevertheless staggering. Differences are less stark when comparing health spending as share of gross domestic product (GDP). In 2019, health spending among LICs averaged 5.2% of GDP (US$ 35 in per capita terms), compared with 11.4% (US$ 5644 per capita) among HICs (Table 1.1.1).Footnote 3 Average levels of health spending vary significantly across income classifications, but the way health is financed also differs significantly. Public financing for health predominates among upper-middle-income countries (UMICs) and HICs. Among HICs, 67% of spending on health in 2019 came from public funding (34% of the latter, on average, from SHI contributions). Among LICs, on the other hand, only 37% (US$ 12) of funding for health came from public sources (with only 2% of the latter from SHI contributions); this number reduces to 22% if external financing that is channelled via government budgets is excluded (see Chapter 1.4). Private OOP spending is the largest source of funding for health among LICs and LMICs, accounting for 40–52% of health spending. Globally, VHI is not a significant source of financing, contributing only 6% of resources for health. Other private sources – for example, from faith-based organizations, other nongovernmental organizations (NGOs), external financing not channelled via government – are included in the “Other” category inTable 1.1.1.
| Indicators | Low-income countries | Lower-middle-income countries | Upper-middle-income countries | High-income countries | All countries |
|---|---|---|---|---|---|
| Current health spending per capita (US$) | 35 | 97 | 555 | 5 644 | 1 138 |
| Share of GDP (%) | 5.2 | 3.6 | 5.9 | 11.4 | 5.8 |
| Public share of current health spending (%) | 37 | 36 | 55 | 67 | 47 |
| Per capita (US$) | 12 | 39 | 304 | 3 487 | 681 |
| Share from general taxation (%) | 64 | 83 | 60 | 66 | 72 |
| Share from SHI contributions (%) | 2 | 11 | 40 | 34 | 24 |
| Share from external sources (%) | 33 | 5 | 0 | 0 | 5 |
| OOP share of current health spending (%) | 40 | 52 | 33 | 16 | 39 |
| VHI share of current health spending (%) | 2 | 5 | 9 | 3 | 6 |
| Other (NGOs, etc.) (%) | 21 | 7 | 3 | 14 | 8 |
GDP: gross domestic product; OOP: out-of-pocket; NGO: nongovernmental organization; SHI: social health insurance; VHI: voluntary health insurance.
Note: Averages are population weighted.
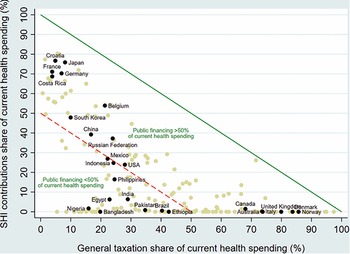
General taxation is the main source of financing for health in several countries including Australia, Canada, Denmark, Italy, Norway and the United Kingdom (Fig. 1.1.1). SHI contributions, on the other hand, are predominant in Costa Rica, Croatia, France, Germany and Japan, among others. Blended public financing – a combination of financing via general taxation and SHI – is the largest source of health care funding in countries such as Belgium, China, the Republic of Korea and the Russian Federation. General taxation and SHI contributions account for less than half of current health expenditures in most LMICs including; for example, in Bangladesh, Brazil, Egypt, Ethiopia, India, Pakistan, the Philippines and Nigeria.
Public financing is a much bigger share of health spending in richer countries
SHI: social health insurance; UK: United Kingdom; USA: United States of America.

Figure 1.1.1 Long description
The x-axis notes General taxation share of current health spending in percentage from 0 to 100, while the y-axis notes S H I contributions share of current health spending in percentage from 0 to 100. A solid straight line moves from (0, 100) to (100, 0), and all countries below this have Public financing of more than 50 percent of current health spending. These countries, from low to high general taxation, include Croatia, France, Japan, Germany, Costa Rica, Belgium, Korea, China, Russia, Mexico, U S A, Canada, Australia, U K, Italy, Denmark, and Norway. Another dashed line moves straight from (0, 50), to (50, 0), and all countries below this have Public financing of less than 50 percent of current health spending. These countries, from low to high general taxation, include Nigeria, Indonesia, Egypt, Bangladesh, the Philippines, India, Pakistan, Brazil, and Ethiopia.
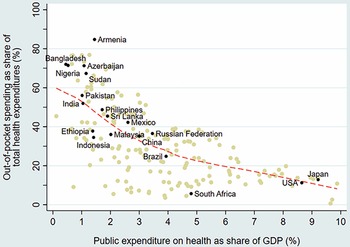
There is an inverse correlation between public spending on health as share of GDP and the OOP spending share in current health expenditures across countries (Fig. 1.1.2). Low public spending on health often manifests as poor supply-side readiness and responsiveness at public facilities, resulting in the population having to supplement public financing with private OOP payments for medicines and diagnostics or to seek self-financed care at private facilities. Countries that have made the most progress towards UHC generally have OOP spending levels that are less than 15–20% of current health spending, a threshold benchmark recommended by WHO and met or exceeded in HICs within the Organisation for Economic Co-operation and Development (OECD). In the case of countries that have made progress towards UHC despite their OOP spending being higher than the 15–20% threshold, their OOP outlay largely occurs among well-off segments of the population and therefore is no longer a significant risk factor for impoverishment; for example, in Malaysia and Sri Lanka (WHO, 2010). OOP spending shares are particularly high – exceeding two thirds of all spending on health – in sub-Saharan African countries such as in Cameroon, Nigeria and Sudan, as well as in several central Asian and south Asian countries such as Armenia, Azerbaijan, Bangladesh, Tajikistan and Turkmenistan.
OOP falls as public spending grows: the inverse relationship between public versus OOP spending on health, 2019
GDP: gross domestic product; USA: United States of America.

Figure 1.1.2 Long description
The x-axis notes Public expenditure on health as share of G D P in percentage from 0 to 10, while the y-axis notes Out-of-pocket spending as a share of total health expenditures in percentage from 0 to 100. The best-fit line gently curves from about (0.5, 60) to (9, 10). Countries on the low end of public expenditure include Armenia, Bangladesh, Turkmenistan, Cameroon, Azerbaijan, Sudan, India, Pakistan, Ethiopia, Indonesia, and Brazil. Countries on the upper end include South Africa, U S A, and Japan.
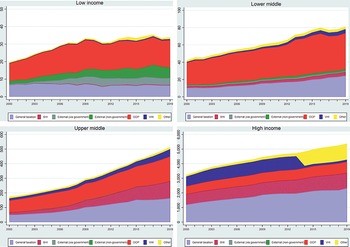
Over time, health expenditures have typically risen faster than rates of economic growth, i.e. the unconditional income elasticity of health spending has exceeded unity. Between 2000 and 2019, for instance, there was a secular (long-term) increase in spending on health, both in levels and as share of GDP: for example, per capita spending levels on health increased globally from US$ 713 (5.1% of GDP) in 2000 to US$ 1138 in 2018 (5.8% of GDP). Higher levels of current health spending – and a changing composition of financing away from OOP and external sources towards a greater share coming from public sources – is also notable over time (Fig. 1.1.3). These empirical trends – dubbed the health financing transition – are driven by a range of factors (Fan & Savedoff, Reference Fan and Savedoff2014). Some influence the overall quantum of health spending, while others impact the way in which health systems are financed. The faster growth in health expenditure is partly because people demand more and better services as they get richer. Other influences are population ageing and the associated changes in disease patterns to costlier chronic conditions; the continuous availability of new and often more expensive medicines and health technologies; and a range of public or private choices made around revenue generation, pooling and purchasing of health care.Footnote 4
Spending has increased across the board but patterns of spending have evolved differently in low-, middle- and high-income countries
OOP: out-of-pocket; SHI: social health insurance; VHI: voluntary health insurance.

Figure 1.1.3 Long description
Each chart has an x-axis marking the Year from 2000 to 2018, while the y-axis notes the Constant 2019 U S dollar from 0 to 50. The 4 charts, representing the 4 income groups, are Low income, Lower-middle, Upper-middle, and High income. The expense areas are: general taxation, S H I, external (via government), external (non-governmental), O O P, V H I, and others. General taxation and O O P take up most of the expenses cross all categories, which also notes higher spending trends over the years. The lower-middle and high-income groups show the highest total spending.
The health financing transition reflects what happens on average as countries move up the income ladder. There are important differences, though, across countries and many factors can shape the timing and magnitude of the transition and the extent to which it poses a policy challenge, especially in LMICs. For example, despite rapid economic growth and its transition from LIC to LMIC status in 2015, external financing in Myanmar subsequently increased (not decreased, as might be expected) as a share of health spending (Teo & Cain, Reference Teo and Cain2018). Several countries in the Pacific – including the Solomon Islands, Kiribati and Vanuatu – have relatively low OOP shares in health spending, in contrast to other countries at similar levels of income. In UMICs such as Armenia, the OOP spending share has remained stubbornly high and has been increasing over time despite economic growth (Dudu et al., Reference Dudu2021).
General taxation and SHI: key challenges and country responses
In this section, we examine the challenges posed to the public financing of health, in particular: countries’ levels of growth and poverty; countries’ often weak overall generation of revenue; high rates of informal economic activity; popular resistance to making SHI contributions; conflicting budgetary priorities; and ageing populations. We also include current responses to these challenges: reform of the tax system, blurring and diversifying revenue bases, earmarking new revenues and raising the pension age.
Challenge: Levels of economic growth and poverty
In most countries the overall size of the economy in per capita terms is a key constraint in terms of public financing, including for health. Economic activity is the basis of most forms of taxation, whether taxes are imposed with or without a quid pro quo intent. Countries that have experienced high levels of economic growth generally see levels of public financing for health also increasing at faster rates. India is a case in point: although levels of public financing for health remain far below those expected for its income level, relatively high economic growth rates have resulted in almost a tripling in real public financing for health in India in per capita terms since 2000 (Tandon et al., Reference Tandon2020). Conversely, countries on a lower growth trajectory – for example, Brazil, Mexico, Nigeria, and the Russian Federation – have faced a more constrained environment for public financing for health. Beyond the effects of economic growth, public spending for health is also a function of government revenues as well as the share of government budgets that flow to health (Tandon & Cashin, Reference Tandon and Cashin2010). Lower levels of economic development are also associated with high rates of absolute poverty; hence, even if institutional mechanisms for collecting taxes exist (which often they do not), the ability of the poor to pay such taxes remains a constraint. In addition, ageing not only causes an increase in demand for health but also lowers the tax base as people retire. (We discuss both ageing and the tax system in more detail in the Challenge: Governments’ conflicting budget priorities and the Challenge: Ageing populations sections).
Weak revenue generation
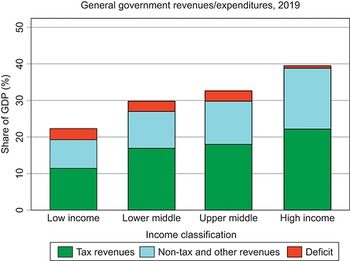
Weaknesses in revenue generation overall are a key challenge facing public financing of health, especially in LMICs. Lower-income countries tend to have lower levels of government revenue as a share of their economies. In 2019, whereas in HICs average general government revenues, both from taxes and non-tax sources, were 38% of GDP, in LICs this number was only 19%, even when external grants are included (Fig. 1.1.4).Footnote 5 Although countries can to some extent borrow to increase spending beyond the revenues received, repayment of debt can constrain future expenditure, especially if nominal economic growth rates are lower than the cost of borrowing (Blanchard, Reference Blanchard2019). Even within country income groups, there are some countries that lag behind in terms of government revenue collection: for example, in 2019, the general government revenue share of GDP was <10% of GDP in countries such as Bangladesh and Nigeria and only between 10 and 15% of GDP in Democratic Republic of the Congo, Ethiopia, Indonesia and Pakistan, therefore constraining the ability of their governments to publicly finance spending across all sectors, including health.
General government revenues are a small proportion of GDP in lower-income countries
GDP: gross domestic product.

Figure 1.1.4 Long description
The y-axis notes the Share of G D P (percentage), from 0 to 50, while the x-axis notes the 4 income groups. Each bar has 3 stacks, representing Tax revenues, Non-tax and other revenues, and Deficit, with tax revenues being the largest share across each. The approximate net revenues across the categories are: Low income: 21 percent. Lower middle: 30 percent. Upper middle: 32 percent. High income: 40 percent.
Response: reform of the tax system
International Monetary Fund (IMF) research has recently suggested a benchmark of at least 15% for the tax revenue share of GDP if countries are to make sustained and inclusive progress on development outcomes (Gaspar, Jaramillo & Wingender, Reference Gaspar, Jaramillo and Wingender2016). But how can countries that have low rates improve tax revenues? A systematic assessment across LMICs found 55 episodes of tax revenue increases during the period 2000–2015 that resulted in an annual increase of at least 0.5% of GDP and that lasted a minimum of three years. In most cases, a combination of tax policy and revenue administration reforms were employed. Increases in rates of indirect taxes and broadening the base for both direct and indirect taxes – in addition to simplification, increasing compliance and elimination of tax exemptions – were found to be key in most cases (see Box 1.1.2) (Akitoby et al., Reference Akitoby2020).
At the time of its so-called Rose Revolution in 2003, Georgia’s tax revenues as a share of GDP were only 12% due to evasion and corruption. Tax reforms – including simplification of the system, curbing exemptions, introduction of flat income taxes for individuals and corporations, a small reduction in the VAT rate and electronic reforms that made it easier to pay taxes – resulted in a sustained increase in tax revenues. In 2008, within just five years of implementing its reforms, Georgia’s tax revenue share of GDP had doubled to 24% (Akitoby, Reference Akitoby2018). As a result, public spending on health expanded from 1.2% to 1.6% of GDP during the period 2003–2008, despite a decline in health’s share of overall government spending over the same period.
Similar reforms led to an increase in tax revenue collection and public spending on health in several other countries including Cambodia, Guyana, Liberia and Ukraine.
Challenge: Informal economic activity
In LICs and LMICs, large and persistent levels of informality in the labour market and in the economy more generally makes collection of taxes – especially direct taxes on income, wealth and property – particularly challenging (e.g. tax revenues as a share of GDP are only 8% in the Democratic Republic of the Congo and 10% in Ethiopia). Recent estimates indicate that whereas one third of GDP on average across LMICs is informal activity output – i.e. market based and legal but unobserved or hidden from public authorities for monetary, regulatory or institutional reasons – more than two thirds of all employment tends to be informal (Ohnsorge & Yu, Reference Ohnsorge and Yu2022; Schneider, Buehn & Montenegro, Reference Schneider, Buehn and Montenegro2010). Informality is often a consequence of poor government enforcement capacity as well as evasive strategies by firms and labourers to avoid (possibly burdensome) taxation and regulation.Footnote 6 There are wide variations underlying these averages: in some lower-income countries with large agricultural sectors and widespread subsistence farming, estimated informal employment exceeds 80%. In addition to its association with agriculture and farming, informal employment is also prevalent among the self-employed or those employed in small firms with relatively few employees. By definition, informal employment occurs without contracts and without formal payroll arrangements.
The challenge of pervasive informality also makes SHI an impractical and ineffective revenue-raising modality for LMICs aiming to make rapid progress towards UHC (Yazbeck et al., Reference Yazbeck2020). When workers lack formal contracts, labour income cannot be taxed directly. This helps explain the relatively tiny share of SHI contributions in financing health in LICs and LMICs (see Table 1.1.1).
Challenge: Resistance to SHI contributions
Many LICs and LMICs have SHI schemes but they tend to cover a small proportion of the labour force: usually civil servants and those employed in the formal private sector. Even for the latter, imposing the mandate for payment of SHI contributions has often been difficult. For example, Nigeria’s SHI programme for the formal sector covers approximately 1.5% of the population, the majority of whom are civil servants. The almost exclusive source of revenue is the employer contribution from the federal government for the civil servants (3.25% of the consolidated salary), while the collection of employee contributions has proven to be politically impossible (World Bank, 2019b). HICs have also faced challenges in maintaining their SHI systems when stakeholders are opposed to contributing because of concerns about rising labour costs and implications for competitiveness.
Response: blurring and diversifying revenue bases
Reluctance on the part of stakeholders to contribute to SHI schemes has led many countries to subsidize and co-finance SHI programmes with revenues from general taxation, notably Belgium and France. In the context of high levels of informality, concerns about competitiveness and an ageing population, many countries are moving towards delinking income-related contributions from entitlements and diversifying sources of earmarked taxation away from income (Kutzin, Yip & Cashin, Reference Kutzin, Yip, Cashin and Scheffler2016).
France and Hungary have diversified revenue bases for their SHI systems, for example. The United Kingdom collects earmarked National Insurance contributions on income from employers, employees and self-employed individuals and part of these revenues are used to provide about one fifth of NHS’s financing; the remainder comes from general taxation (Cylus et al., Reference Cylus2015). Given its significant levels of informal economic activity, Ghana co-finances its SHI fund using earmarked revenues that are levied on consumption – as part of its VAT – in addition to SHI contributions levied on formal sector income (Government of Ghana, 2015). The introduction of India’s tax-financed noncontributory health insurance programme for the poor and near-poor in 2018 that covers almost 500 million individuals was used as a means for the central government to raise a cess – basically, an additional 1% tax on all income taxes paid – although the funds are not strictly earmarked for the programme and most of the beneficiaries of the scheme are not the ones that pay income taxes since almost all of them are poor and in the informal sector (Government of India, 2018).
In some countries, the health sector has been actively involved in lobbying for taxes on “harmful” products such as tobacco, alcohol and products with added sugar, in order to deter their consumption and reduce the subsequent burden of disease on the sector, while also expanding the overall public resource envelope (even if the revenues thus raised are not earmarked for health). Given the growing ill health burden resulting from air pollution, carbon taxes are another possible area where the health sector can seek to raise revenues and reduce the risk of disease, as demonstrated by the experiences of some HICs (World Bank, 2019a). The challenge from a fiscal-space-for-health perspective – as opposed to a fiscal-policy-for-health perspective – is the amount of resources generated by adopting such a strategy and whether they can be earmarked and, if so, whether over time such resources are truly additional. As discussed further below, the Philippines is a recent example of a country that has used earmarked tobacco and alcohol taxes to finance health care contributions on behalf of the indigent and thus create a fiscal space for health (Kaiser, Bredenkamp & Iglesias, Reference Kaiser, Bredenkamp and Iglesias2016).
Challenge: Governments’ conflicting budget priorities
A key challenge – especially in LMICs – is that health is accorded a relatively low priority in government budgets, for a variety of reasons: other sectors’ demands for financing, perceptions that the health sector is inefficient or is unable to absorb allocated funds, or ideologically driven political narratives that favour private over public versus private financing for health. Globally, health’s share in overall public spending stands at about 9% (WHO, 2022). However, there are very large variations across countries: on the one end, health accounts for less than 3% of public expenditure in countries such as Cameroon and South Sudan; on the other hand, health exceeds 20% of public expenditures in other countries such as Costa Rica, Japan, Panama, Uruguay and the USA. Despite large country-specific variations, health’s share of government budgets is, on average, higher in HICs (Table 1.1.2). Health care costs tend to be higher in richer countries, driven by relative price differences as well as the availability of higher-technology care. Richer countries also tend to have more educated and ageing populations with preference structures that expect higher levels of public financing for health. Education tends to receive a higher share of government budgets across LICs, LMICs and UMICs; only in HICs does health’s share end up being higher than education’s, on average. Although both interest payments on debt and military spending represent the same or lower share than health on average, there are notable country-specific exceptions such as Armenia, Bangladesh, India, Morocco, Pakistan, Sri Lanka and Uganda where health receives a lower share vis-à-vis both interest payments and military spending.

Table 1.1.2 Long description
The table has 2 main columns (and further subcolumns): Classification and Share of government expenditure (Health, Education, Military, and Interest payments, all in percentage). It reads as follows. Low-income country: 9; 16; 7; 5. Lower-middle-income country: 6; 15; 8; 15. Upper-middle-income country: 10; 13; 5; 5. High-income country: 18; 13; 6; 4. All countries: 9; 14; 7; 9.
Response: earmarking new revenues
Earmarking of new revenues is often implemented to increase health’s share of the overall public financing envelope. Earmarking is when revenues are assigned through constitutional or statutory law from certain sources to specific expenditures (McCleary, Reference McCleary1991; Bird & Jun, Reference Bird and Jun2005). Apart from the standard case of SHI, different types of earmarks for health have emerged or gained popularity over the past two decades. Earmarks take different forms, with various attempts to categorize them based on the rationale, source of revenue, expenditure category and the revenue–expenditure link. The revenue–expenditure link may be tight, i.e. the amount spent is restricted to the amount raised through the earmark, or soft, i.e. the amount spent is loosely related, if at all, to the amount raised. In practice, many earmarks fall between these two extremes of strength of link. From a sector perspective, two classes of earmarks are of special interest as in both the earmarked revenues are substantial, i.e. they are a prominent source of funding.
Increased rates or new indirect taxes
The first class comprises cases of increased rates or the introduction of entirely new indirect taxes to finance the expansion of health care coverage beyond formal workers and their dependants. The most notable examples include Ghana (a 2.5% increase in VAT in 2004) and the Philippines (additional revenue generated from a comprehensive reform of tobacco and alcohol taxes in 2012). Other countries are emulating the approach. For example, Egypt, as part of a comprehensive overhaul of its SHI system, introduced earmarks on additional revenue from tobacco tax reforms and new levies on toll roads, drivers and car licenses to complement compulsory, individual contributions (Government of Egypt, 2018). Lessons from Ghana and the Philippines highlight the potential advantages of a soft revenue–expenditure link (Cashin, Sparkes & Bloom, Reference Cashin, Sparkes and Bloom2017). In both instances, tax reforms generated substantial amounts of funding for the extension of SHI: more than 0.5% of GDP. However, in the Philippines, even in the medium term, additional revenues exceeded the funds that the SHI agency managed to absorb (Ulep, Pargas & Alcantara, Reference Ulep, Pargas and Alcantara2021). In contrast, in Ghana, from year three onwards, additional revenues fell far short of operational expenditures (Kurowski & Iglesias, Reference Kurowski and Iglesiasin press).
Designated fixed shares for health in budget allocation
The second class of earmarked revenues comprises fixed shares for health in the allocation of general funds. Such fixed shares have been reported by more than a dozen countries. In decentralized systems, fixed shares for health have not only been established at the central level, but also in transfers from central to subnational governments, as well as for lower levels of government, to ensure the overall level of expenditure is adequate but also to reduce spending inequalities. Some countries use this type of earmark for specific expenditure categories – for example, Nigeria does so for its basic health care provision fund and South Africa for its HIV/AIDS programme. The fixed shares typically reflect only a minimum level of spending. As they fall short of actual spending needs, countries have combined them with other types of earmark.
But do these substantial earmarks affect spending levels in the targeted expenditure categories and ultimately in the health sector? In the absence of a counterfactual, this question is difficult to resolve. Country experiences suggest that there may be a short-term effect on government expenditures. For example, in Ghana, the size of the earmark correlated in the early years after its introduction with increases in the level of government spending on health (Kurowski & Iglesias, Reference Kurowski and Iglesiasin press). With time, however, the likelihood increases that allocations from general taxes are reduced. These cuts may lead to a shift in expenditure priorities with potential consequences for the efficiency of spending. In Ghana, for example, concerns have been raised that priority services outside SHI benefits – for example, immunization services – took a hit.
More generally, empirical work on prioritization has been sparse: the limited cross-country econometric analyses that exist suggest that factors such as democratization, lower levels of corruption, ethnolinguistic homogeneity and more women in public office are correlated with higher shares of public spending on health; however, these findings are not robust and are sensitive to model specification (Lebovic, Reference Lebovic2001; Meltzer & Richard, Reference Meltzer and Richard1981; Keefer & Khemani, Reference Keefer and Khemani2005; Tandon et al., Reference Tandon2014). A range of factors – political changes, disease outbreaks/pandemics, macroeconomic shocks – are common triggers that can sometimes lead to a sustained increase in health’s share of a government’s budget. The use of budgetary or numeric financing targets (e.g. the Abuja Declaration target that health’s share of the government budget be at least 15%) generally has not resulted in a higher priority for health. Evidence to date suggests that country-specific political economy considerations are key and that results-focused reform efforts – in particular efforts to explicitly expand the breadth and depth of health coverage as opposed to efforts focused only on government budgetary and numerical targets – are more likely to result in a sustained and politically feasible prioritization of health.
Challenge: Ageing populations
Another key policy challenge – particularly among UMICs and HICs – is that of an ageing population. With higher life expectancies and declining fertility has come a growing proportion of the population that is elderly with greater needs for health spending and long-term care. Some UMICs are seeing higher median ages resulting from declining fertility alone, even without registering significant improvements in life expectancy. United Nations estimates place the total number of people aged 65 years and above at 727 million in 2020, about 9% of the global population; this number is expected to more than double – to 1.5 billion, 16% of the global population – by 2050. In 2020, several countries such as Brazil, China and Mexico were already classified as “ageing”, i.e. with a population share of people aged more than 65 years over 7%; the Russian Federation and the USA counted among “aged” countries – with a population share of people aged more than 65 years exceeding 14% – and Japan was already “super-aged” with a share of the population aged more than 65 years of more than 21% of its total population (United Nations, 2020).
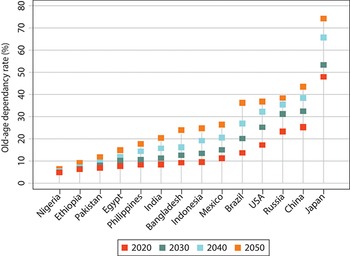
From a revenue generation perspective, the immediate risks from ageing are rising old-age dependency ratios – i.e. increasing numbers of those aged over 65 years relative to those in the working age population group aged 15–64 years – such that even if the size of the working age population is growing, it is having to provide a resource base for public financing for health and other services for a dependent population of people aged more than 65 years that is growing at an even faster rate. Elderly populations tend to have greater rates of multimorbidity from noncommunicable diseases (NCDs) than younger, working populations and need integrated care, which currently is provided in a fragmented manner across most countries. This rise in old-age dependency is already occurring in nearly all countries – albeit at different rates – and the trend is expected to accelerate in coming decades, especially in HIC. According to the United Nations’ projections, by 2050, the proportion of those people aged more than 65 years will be almost three quarters the proportion of those in the working age population group in Japan; this same old-age dependency ratio will exceed 35% in China, Brazil, the Russian Federation and the USA.
Although rising over time, the old-age dependency ratio in 2050 is expected to remain 10% or below in lower-income countries such as Ethiopia and Nigeria (Fig. 1.1.5). In some countries such as China, Japan and the Russian Federation, the rise in old-age dependency is occurring on top of an ongoing decline in the working age population of 15–64 years old. With ageing comes the potential for declining labour productivity and, when combined with a shrinking labour force, the possibility of reductions in investments and economic output. These trends can have adverse knock-on effects on public financing including for health, increasing the need for additional public spending while at the same time reducing the ability of governments to raise revenues as (generally lower) pension incomes replace (generally higher) labour incomes. Tax revenues tend to be highly correlated with the size of the employed population rather than with the size of the total population (Rouzet et al., Reference Rouzet2019). For lower-income countries, the challenge of ageing is that it is likely to occur at a rate that is faster than underlying rates of economic development, i.e. many of these countries will become old before they become rich.
Old-age dependency ratios are projected to increase in many (middle- to higher-income) countries
USA: United States of America.

Figure 1.1.5 Long description
The y-axis shows the Old-age dependency rate in percentage from 0 to 80, while the x-axis lists the countries. Each country has 4 serially higher dots, representing current and projected ratios from 2020, 2030, 2040, and 2050. They increase as follows. Nigeria and Ethiopia: all projections stay below 10. Pakistan: 6 to 15. Egypt: 8 to 16. Philippines: 9 to 19. India: 9 to 20. Bangladesh: 9 to 22. Indonesia: 9 to 23. Mexico: 10 to 28. Brazil: 12 to 38. U S A: 18 to 28. Russia: 21 to 40. China: 25 to 44. Japan: 49 to 77.
Response: strategies to offset the impacts of ageing on revenues
There is growing empirical evidence that suggests the impact of ageing on health spending might not be as high as expected. Although ageing is associated with higher prevalence of multimorbidities and greater rates of utilization of health care, the impact is not as dramatic as that of other drivers of health spending such as technological innovations (Greer et al., Reference Greer2021). Moreover, countries could cope with some of the challenges of reduced revenue generation due to ageing by implementing corrective policies. Many HICs have raised the mandatory retirement age in line with rising life expectancies to increase the potential labour force while at the same time decreasing old-age dependency ratios. In Portugal, for example, the mandatory retirement age now automatically increases by two thirds of any increase in life expectancy. Similar approaches have been adopted in Denmark, Finland, Italy, the Netherlands and elsewhere. Simply raising the mandatory retirement age, however, may not be sufficient to induce older people to work: such policies would need to be combined with other incentives including flexible working arrangements and designing older people-friendly workplaces. A recent systematic review of the literature did find evidence, though, that raising the mandatory retirement age increased labour force participation rates among older people (Patrick, Groot & Pavlova, Reference Patrick, Groot and Pavlova2021).
As outlined above, other options include diversification of the revenue base by increasing taxes on consumption and wealth rather than relying on wage-based income alone. For example, although France’s SHI system was initially almost entirely funded from wage-based payroll contributions, these now account for only about half of the system’s revenues. The remainder is financed by an earmarked income tax – levied on all sources of income – along with taxes on tobacco and alcohol, the pharmaceutical industry – and VHI (Commonwealth Fund, 2020). The shift to a broader definition of taxable income in France has also decreased inequities in revenue generation as richer individuals not only tend to be older but they also have higher wealth-related income (World Bank, 2019a). Similarly, Hungary’s SHI system is now a hybrid: transfers from general taxation are just as important a revenue source as payroll-based contributions, potentially enhancing the sustainability of health financing in the light of ageing (Szabolcs et al., Reference Szabolcs2019).
Policy relevance and conclusions
This chapter has landscaped revenue raising for health via public financing – both general taxation and SHI – with an understanding that the compulsory and redistributive elements of this source of financing have been key for making sustained progress towards UHC. Public financing for health is predominant among HICs where key challenges faced include those of sustainability, diversification of revenue sources (especially where SHI is prevalent) and cost containment in light of demographic, epidemiological and technological trends. Among lower-income countries, on the other hand, the key challenge is navigating and accelerating the transition from predominantly private OOP financing of health systems towards greater levels and effective use of public resources for health. Lower-income countries that have successfully made the transition to expanding public financing for health have done so by means of expanding general taxation through a combination of economic growth, improving government revenue generation and increasing the share for health in government budgets, and by targeting spending towards the poor (Cotlear et al., Reference Cotlear2015).
We underscore the view that SHI financing for health is, in essence, earmarked taxation of wages and, over time and across countries, we are seeing a blurring of institutional and other differences between systems that were previously separately classified as general tax-financed models of health financing versus SHI-financed. Several general tax-financed health financing systems now include elements – for example, strategic purchasing of health services and a purchaser-provider split – that were previously considered to be hallmarks of SHI-financed systems. And SHI-financed systems are increasingly becoming dependent on complementary general tax-financed sources, especially for subsidizing financing of health care coverage for the poor, unemployed and retired populations. In some HICs, stakeholders oppose raising SHI contributions because of concerns about rising labour costs and implications for competitiveness. Such constraints have led many countries to subsidize and co-finance SHI programmes with revenues from general taxation. In such environments – with high levels of informal economic activity, competitiveness concerns and an ageing population – countries should consider delinking income-related contributions from entitlements and diversifying sources of earmarked taxation away from income (Kutzin, Yip & Cashin, Reference Kutzin, Yip, Cashin and Scheffler2016). The challenge of pervasive informality makes SHI an impractical and ineffective large-scale revenue-raising modality in LMICs (Yazbeck et al., Reference Yazbeck2020).
Globally, it is increasingly evident that expansion in general taxation, more so than SHI, has been central for precipitating health financing transitions as well as for making and sustaining progress towards UHC. Although SHI financing remains part of the revenue-generating arsenal to varying degrees depending on country context, the global policy dialogue is increasingly centred around constraints and opportunities related to diversifying revenue sources, delinking employment from entitlement and moving towards a more central role for general taxation as the core source of public financing for health.Footnote 7


 Open access