


1. Introduction
Galactic outflows are a key component of galaxy evolution, enriching, shocking and shaping their environments (e.g. Veilleux, Cecil, & Bland-Hawthorn Reference Veilleux, Cecil and Bland-Hawthorn2005; Veilleux et al. Reference Veilleux, Maiolino, Bolatto and Aalto2020; Tumlinson, Peeples, & Werk Reference Tumlinson, Peeples and Werk2017). Outflow morphologies vary from bipolar lobes and bubbles to X-shaped cones and collimated jets, depending on their origin, velocity, age, and driving force (e.g. active galactic nuclei, hot stellar winds, or supernova explosions). The observed outflow sizes range from less than one parsec for stellar winds to $\gt$
1 kpc for the large-scale winds of star-forming galaxies. Here, we focus on the latter. In their review, latter. In their review define ‘superwinds’ as galactic-scale mass outflows driven by the collective effect of supernova explosions and stellar winds associated with powerful, compact starbursts. In this context, galaxies like M 82 (Lehnert, Heckman, & Weaver Reference Lehnert, Heckman and Weaver1999), NGC 253 (Pietsch et al. Reference Pietsch, Vogler, Klein and Zinnecker2000; Strickland et al. Reference Strickland, Heckman, Weaver, Hoopes and Dahlem2002), NGC 1808 (Koribalski et al. Reference Koribalski, Dahlem, Mebold and Brinks1993a; Koribalski, Dickey, & Mebold Reference Koribalski, Dickey and Mebold1993b), and NGC 3079 (Veilleux et al. Reference Veilleux1994; Hodges-Kluck et al. Reference Hodges-Kluck2020) are often noted as ‘superwind’ galaxies (see also Strickland et al. Reference Strickland, Heckman, Colbert, Hoopes and Weaver2004a; Strickland et al. Reference Strickland, Heckman, Colbert, Hoopes and Weaver2004b).
$\gt$
1 kpc for the large-scale winds of star-forming galaxies. Here, we focus on the latter. In their review, latter. In their review define ‘superwinds’ as galactic-scale mass outflows driven by the collective effect of supernova explosions and stellar winds associated with powerful, compact starbursts. In this context, galaxies like M 82 (Lehnert, Heckman, & Weaver Reference Lehnert, Heckman and Weaver1999), NGC 253 (Pietsch et al. Reference Pietsch, Vogler, Klein and Zinnecker2000; Strickland et al. Reference Strickland, Heckman, Weaver, Hoopes and Dahlem2002), NGC 1808 (Koribalski et al. Reference Koribalski, Dahlem, Mebold and Brinks1993a; Koribalski, Dickey, & Mebold Reference Koribalski, Dickey and Mebold1993b), and NGC 3079 (Veilleux et al. Reference Veilleux1994; Hodges-Kluck et al. Reference Hodges-Kluck2020) are often noted as ‘superwind’ galaxies (see also Strickland et al. Reference Strickland, Heckman, Colbert, Hoopes and Weaver2004a; Strickland et al. Reference Strickland, Heckman, Colbert, Hoopes and Weaver2004b).
Dettmar (Reference Dettmar1992) highlights the ‘disk-halo connection’ in galaxies where star formation drives outflows not only from the nuclear region but, in some cases, from the extended stellar disk into the halo and concludes that magnetic fields play an important role (see also Heesen et al. Reference Heesen2018). The edge-on galaxy NGC 891 is a prime example with H $\alpha$
filaments extending up to
$\alpha$
filaments extending up to $\sim$
4.5 kpc above the disk (Dettmar Reference Dettmar1990). Galante et al. (Reference Galante, Saponara, Romero and Benaglia2024) and Irwin et al. (Reference Irwin2024) search for the presence of radio halos in nearby, edge-on starburst galaxies, while Stein et al. (Reference Stein2025) find X-shaped magnetic field structure in many nearby edge-on disks. In contrast, Seyfert galaxies often show outflows from near their core. Hota & Saikia (Reference Hota and Saikia2006) compare the small-scale outflow properties of 10 gas-rich Seyfert galaxies, all of which also show starburst activity and some show radio jets inside the bubbles. Maybe the most prominent example is Circinus, a nearby spiral galaxy showing bipolar radio bubbles or lobes emerging from near its Sy 2 nucleus, perpendicular to the stellar disk to a height of
$\sim$
4.5 kpc above the disk (Dettmar Reference Dettmar1990). Galante et al. (Reference Galante, Saponara, Romero and Benaglia2024) and Irwin et al. (Reference Irwin2024) search for the presence of radio halos in nearby, edge-on starburst galaxies, while Stein et al. (Reference Stein2025) find X-shaped magnetic field structure in many nearby edge-on disks. In contrast, Seyfert galaxies often show outflows from near their core. Hota & Saikia (Reference Hota and Saikia2006) compare the small-scale outflow properties of 10 gas-rich Seyfert galaxies, all of which also show starburst activity and some show radio jets inside the bubbles. Maybe the most prominent example is Circinus, a nearby spiral galaxy showing bipolar radio bubbles or lobes emerging from near its Sy 2 nucleus, perpendicular to the stellar disk to a height of $\sim$
3 kpc (e.g. Elmouttie et al. Reference Elmouttie, Haynes, Jones, Sadler and Ehle1998).
$\sim$
3 kpc (e.g. Elmouttie et al. Reference Elmouttie, Haynes, Jones, Sadler and Ehle1998).
The star formation rate (SFR) in galaxies varies over time and depends on the fuel available in the disk and accreted from the interstellar medium (ISM). While generally strongest in the nuclear regions, star formation in galaxies spreads over the whole stellar disk, driving gas outflows into the galaxy halo and, in some cases, well beyond the disk into the circumgalactic medium (CGM, Tumlinson et al. Reference Tumlinson, Peeples and Werk2017). For observational and theoretical reviews of stellar-driven galactic winds see Rupke (Reference Rupke2018) and Zhang (Reference Zhang2018), respectively.
In this paper, we focus on the nearby, edge-on galaxy ESO 130-G012 and its newly discovered bipolar outflow. The ASKAP observations are described in Section 2, followed by our results in Section 3. Possible formation scenarios are discussed in Section 4, our summary and conclusions are given in Section 5 and an outlook in Section 6.
2. ASKAP observations and data processing
ASKAP is a powerful 6.4-km diameter radio interferometer consisting of 36 $\times$
12-m antennas, dedicated to large radio sky surveys (Johnston et al. Reference Johnston2008; Norris et al. Reference Norris2011; Koribalski Reference Koribalski2012; Koribalski et al. Reference Koribalski2020; McConnell et al. Reference McConnell2020; Norris et al. Reference Norris2021b; Duchesne et al. Reference Duchesne2023) plus guest projects. Each antenna is equipped with an innovative, wide-field Phased Array Feed (PAF, Chippendale et al. Reference Chippendale2015), which operates at frequencies from 0.7 to 1.8 GHz and delivers a
$\times$
12-m antennas, dedicated to large radio sky surveys (Johnston et al. Reference Johnston2008; Norris et al. Reference Norris2011; Koribalski Reference Koribalski2012; Koribalski et al. Reference Koribalski2020; McConnell et al. Reference McConnell2020; Norris et al. Reference Norris2021b; Duchesne et al. Reference Duchesne2023) plus guest projects. Each antenna is equipped with an innovative, wide-field Phased Array Feed (PAF, Chippendale et al. Reference Chippendale2015), which operates at frequencies from 0.7 to 1.8 GHz and delivers a $\sim$
30 deg
$\sim$
30 deg $^2$
field of view out to the half power point. The currently available ASKAP bandwidth of 288 MHz is divided into
$^2$
field of view out to the half power point. The currently available ASKAP bandwidth of 288 MHz is divided into $288 \times 1$
MHz coarse channels. For a comprehensive system overview see Hotan et al. (Reference Hotan2021). A brief summary of ASKAP technical and science highlights is presented in Koribalski (Reference Koribalski2022).
$288 \times 1$
MHz coarse channels. For a comprehensive system overview see Hotan et al. (Reference Hotan2021). A brief summary of ASKAP technical and science highlights is presented in Koribalski (Reference Koribalski2022).
Our field of interest was observed on the 14th of April 2024 as part of the EMU project, with the band centred at 943.5 MHz (scheduling block 61 083). The total integration time was 10 h and the field centre is at $\alpha,\delta$
(J2000) =
$\alpha,\delta$
(J2000) = $12^\textrm{h}\,20^\textrm{m}\,34^\textrm{s}$
, –60
$12^\textrm{h}\,20^\textrm{m}\,34^\textrm{s}$
, –60 $^\circ$
19′ 18′′. ASKAP PAFs were used to form 36 beams arranged in a
$^\circ$
19′ 18′′. ASKAP PAFs were used to form 36 beams arranged in a $6 \times 6$
closepack footprint. The data processing was done in the ASKAPsoft pipeline (Wieringa, Raja, & Ord Reference Wieringa, Raja and Ord2020; Norris et al. Reference Norris2021a). We obtained fully calibrated ASKAP EMU radio continuum images from the CSIRO ASKAP Science Data Archive (CASDA).Footnote
a
We use the convolved ASKAP images with an angular resolution of 15′′ as well as the high-resolution ASKAP images with a synthesised beam of
$6 \times 6$
closepack footprint. The data processing was done in the ASKAPsoft pipeline (Wieringa, Raja, & Ord Reference Wieringa, Raja and Ord2020; Norris et al. Reference Norris2021a). We obtained fully calibrated ASKAP EMU radio continuum images from the CSIRO ASKAP Science Data Archive (CASDA).Footnote
a
We use the convolved ASKAP images with an angular resolution of 15′′ as well as the high-resolution ASKAP images with a synthesised beam of $7.9'' \times 7.3''$
. We measure an rms noise of
$7.9'' \times 7.3''$
. We measure an rms noise of $\sim$
22
$\sim$
22 $\unicode{x03BC}$
Jy beam
$\unicode{x03BC}$
Jy beam $^{-1}$
near ESO 130-G012 in the 15′′-resolution images.
$^{-1}$
near ESO 130-G012 in the 15′′-resolution images.
We also use the clean component residual maps, which are available in CASDA under the ‘Ancillary’ tab. These turn out to very useful to examine the faint diffuse emission of extended sources as bright sources are subtracted out.
Properties of the galaxy ESO 130-G012 for $D = 16.9$
Mpc.
$D = 16.9$
Mpc.

References: S06 (Skrutskie et al. Reference Skrutskie2006), RC3 (de Vaucouleurs et al. Reference de Vaucouleurs1991), B95 (Buta Reference Buta1995), ESO (Lauberts Reference Lauberts1982), W14 (Williams, Kraan-Korteweg, & Woudt Reference Williams, Kraan-Korteweg and Woudt2014), CB10: (Caramete & Biermann Reference Caramete and Biermann2010), C21 (Cutri et al. Reference Cutri2021), Y93 (Yamada et al. Reference Yamada1993), Y09 (Yamamura et al. Reference Yamamura2009).
Optical DECaPS colour-composite image of ESO 130-G012. The stellar disk clearly stands out despite the high density of foreground stars from the Milky Way Galactic Plane, and a curved dust lane is just visible against the bright galaxy bulge, suggesting a disk inclination of $\sim$
80
$\sim$
80 $^\circ$
. The ESO
$^\circ$
. The ESO $B_\mathrm{25.5mag}$
-band diameter of the stellar disk is
$B_\mathrm{25.5mag}$
-band diameter of the stellar disk is $\sim$
1.8 arcmin corresponding to 8.8 kpc for a distance of D = 16.9 Mpc. – North is up and East to the left.
$\sim$
1.8 arcmin corresponding to 8.8 kpc for a distance of D = 16.9 Mpc. – North is up and East to the left.

3. Results
While inspecting deep ASKAP EMU 944 MHz radio continuum images, we discovered a bipolar outflow extending at least 6′ ( $\sim$
30 kpc) above and below the edge-on stellar disk of ESO 130-G012, a nearby spiral galaxy at a distance of only 16.9 Mpc (see Table 1). Figure 1 shows a deep optical image of the galaxy from the Dark Energy Camera Galactic Plane Survey (DECaPS, Saydjari et al. Reference Saydjari2023).Footnote
b
Despite the high density of Galactic foreground stars, ESO 130-G012’s stellar disk (size
$\sim$
30 kpc) above and below the edge-on stellar disk of ESO 130-G012, a nearby spiral galaxy at a distance of only 16.9 Mpc (see Table 1). Figure 1 shows a deep optical image of the galaxy from the Dark Energy Camera Galactic Plane Survey (DECaPS, Saydjari et al. Reference Saydjari2023).Footnote
b
Despite the high density of Galactic foreground stars, ESO 130-G012’s stellar disk (size $\sim$
2.5′) and the curved inner dust lane around the central bulge are discernible. We estimate a disk inclination of
$\sim$
2.5′) and the curved inner dust lane around the central bulge are discernible. We estimate a disk inclination of $\sim$
80
$\sim$
80 $^\circ$
. The catalogued 2MASS
$^\circ$
. The catalogued 2MASS $K_s$
-band major axis diameter (Jarrett et al. Reference Jarrett2000; Skrutskie et al. Reference Skrutskie2006) is 2.1′ at the 20 mag arcsec
$K_s$
-band major axis diameter (Jarrett et al. Reference Jarrett2000; Skrutskie et al. Reference Skrutskie2006) is 2.1′ at the 20 mag arcsec $^{-2}$
isophote. The radio emission of ESO 130-G012, including its edge-on disk and the spectacular, limb-brightened outflow, are shown in Figures 2–5. The shape of the bipolar outflow, which may extend up to
$^{-2}$
isophote. The radio emission of ESO 130-G012, including its edge-on disk and the spectacular, limb-brightened outflow, are shown in Figures 2–5. The shape of the bipolar outflow, which may extend up to $\sim$
50 kpc on each side, resembles a closed hourglass with a
$\sim$
50 kpc on each side, resembles a closed hourglass with a $\sim$
10 kpc wide waist. A summary of the galaxy properties is given in Table 1.
$\sim$
10 kpc wide waist. A summary of the galaxy properties is given in Table 1.
3.1. Optical properties
ESO 130-G012 is a nearly edge-on, nearby spiral galaxy located at a Galactic latitude of only 4 $^\circ$
, making optical imaging difficult. An optical colour-composite image from DECaPS, shown in Figure 1, reveals the galaxy’s bright stellar disk, inner ring and central bulge, all partially hidden behind a multitude of Galactic foreground stars. de Vaucouleurs et al. (Reference de Vaucouleurs1991) give a morphological type of SB0
$^\circ$
, making optical imaging difficult. An optical colour-composite image from DECaPS, shown in Figure 1, reveals the galaxy’s bright stellar disk, inner ring and central bulge, all partially hidden behind a multitude of Galactic foreground stars. de Vaucouleurs et al. (Reference de Vaucouleurs1991) give a morphological type of SB0 $^+$
(r)?, while Buta (Reference Buta1995) give S(r)a: and note an inner ring (r) with dimensions
$^+$
(r)?, while Buta (Reference Buta1995) give S(r)a: and note an inner ring (r) with dimensions $0.68' \times 0.20'$
(3.3 kpc
$0.68' \times 0.20'$
(3.3 kpc $\times$
1.0 kpc). The size of the ESO 130-G012 stellar disk, as revealed by the DECaPS images, is
$\times$
1.0 kpc). The size of the ESO 130-G012 stellar disk, as revealed by the DECaPS images, is $\sim$
2.5′ corresponding to
$\sim$
2.5′ corresponding to $\sim$
12.3 kpc, slightly larger than the optical and infrared diameters listed in Table 1.
$\sim$
12.3 kpc, slightly larger than the optical and infrared diameters listed in Table 1.
ASKAP EMU 944 MHz radio continuum image of the spectacular outflow from the edge-on galaxy ESO 130-G012. At the galaxy distance of 16.9 Mpc, the detected outflow height of at least 6′ corresponds to $\sim$
30 kpc (see also Figures 3). The ASKAP resolution of 15′′ is indicated in the bottom left corner.
$\sim$
30 kpc (see also Figures 3). The ASKAP resolution of 15′′ is indicated in the bottom left corner.

ASKAP EMU 944 MHz radio continuum images of the bipolar outflow from the galaxy ESO 130-G012, rotated such that the flow is approximately along the y-axis. – Left pair: Total intensity images at 15′′ resolution. – Right pair: Clean residual images smoothed to 20′′ resolution. The contour levels are 30, 60, 150 and 300 $\unicode{x03BC}$
Jy beam
$\unicode{x03BC}$
Jy beam $^{-1}$
. The yellow ellipse indicates the approximate size of the stellar disk. Orange circles are drawn at radii of 60′′, 150′′, 300′′, and 600′′. At the galaxy distance of 16.9 Mpc, 60′′ corresponds to
$^{-1}$
. The yellow ellipse indicates the approximate size of the stellar disk. Orange circles are drawn at radii of 60′′, 150′′, 300′′, and 600′′. At the galaxy distance of 16.9 Mpc, 60′′ corresponds to $\sim$
5 kpc. The blue ellipses have sizes of 560′′
$\sim$
5 kpc. The blue ellipses have sizes of 560′′ $\times$
340′′ (46 kpc
$\times$
340′′ (46 kpc $\times$
28 kpc).
$\times$
28 kpc).

Zoom-in of the ESO 130-G012 outflow, here shown to a height of $\sim$
160′′ (
$\sim$
160′′ ( $\sim$
13 kpc). – DECaPS zrg-band optical image overlaid with ASKAP EMU 944 MHz radio continuum contours. – Left: Total intensity contours (yellow, 15′′ resolution). – Right: Clean residual contours (orange, 20′′ resolution). The levels are 0.06, 0.09, 0.12, 0.15, 0.20, 0.25, 0.3, 0.4, 0.5, 0.6, 0.8 and 1.2 mJy beam
$\sim$
13 kpc). – DECaPS zrg-band optical image overlaid with ASKAP EMU 944 MHz radio continuum contours. – Left: Total intensity contours (yellow, 15′′ resolution). – Right: Clean residual contours (orange, 20′′ resolution). The levels are 0.06, 0.09, 0.12, 0.15, 0.20, 0.25, 0.3, 0.4, 0.5, 0.6, 0.8 and 1.2 mJy beam $^{-1}$
(yellow/orange) plus 0.5, 1, 1.4, and 1.8 mJy beam
$^{-1}$
(yellow/orange) plus 0.5, 1, 1.4, and 1.8 mJy beam $^{-1}$
(black, 8′′ resolution).
$^{-1}$
(black, 8′′ resolution).

The inner ring and disk of ESO 130-G012. VPHAS+ H $\alpha$
image (left), overlaid with ASKAP EMU 944 MHz radio continuum contours at
$\alpha$
image (left), overlaid with ASKAP EMU 944 MHz radio continuum contours at $\sim$
8′′ resolution (middle), and a zoom-in VPHAS+ continuum subtracted (H
$\sim$
8′′ resolution (middle), and a zoom-in VPHAS+ continuum subtracted (H $\alpha$
-r) image (right). Contours in the middle image are at 0.3, 0.4, 0.6 (red), 1.0, 1.2, 1.4, 1.6, and 2.1 mJy beam
$\alpha$
-r) image (right). Contours in the middle image are at 0.3, 0.4, 0.6 (red), 1.0, 1.2, 1.4, 1.6, and 2.1 mJy beam $^{-1}$
(yellow).
$^{-1}$
(yellow).

ESO 130-G012 was also observed as part of the VST Photometric H $\alpha$
Survey of the Southern Galactic Plane and Bulge (VPHAS+, Drew et al. Reference Drew2014), which provides u, g, r, i and H
$\alpha$
Survey of the Southern Galactic Plane and Bulge (VPHAS+, Drew et al. Reference Drew2014), which provides u, g, r, i and H $\alpha$
images at
$\alpha$
images at $\sim$
1′′ angular resolution. The above-mentioned dusty inner ring is detected in H
$\sim$
1′′ angular resolution. The above-mentioned dusty inner ring is detected in H $\alpha$
, as shown in Figure 5, suggesting it is star-forming. Such inner rings are often observed in spiral galaxies and are in many cases associated with bars.
$\alpha$
, as shown in Figure 5, suggesting it is star-forming. Such inner rings are often observed in spiral galaxies and are in many cases associated with bars.
3.2. Radio properties
The ASKAP EMU 944 MHz radio continuum emission associated with the galaxy ESO 130-G012 consists of several components: a core, inner knots (associated with the inner ring, see Figure 5), a thin disk, a box-shaped thick disk, and X-shaped radio wings emerging from the edges of the box-shaped emission (see Figure 3 and 4), forming the wide base of a huge hourglass-shaped radio outflow which reaches at least 30 kpc above and below the disk. The outflow properties are summarised in Table 2, and the radio continuum flux estimates for different regions are listed in Table 3. Estimates of the SFR from both radio and infrared data are given in Section 3.3.1.
Figures 2 and 3 highlight the size, shape, and limb-brightened nature of the bipolar radio continuum outflow. Very faint radio emission can detected to nearly 50 kpc, most clearly seen in the clean residual images (Figure 3, right pair), with the north-eastern outflow slightly brighter than its south-western counterpart. We measure a total radio continuum flux density of $\sim$
65 mJy, with half of the flux coming from the box-shaped area around and aligned with the galaxy disk (
$\sim$
65 mJy, with half of the flux coming from the box-shaped area around and aligned with the galaxy disk ( $\sim$
3′
$\sim$
3′ $\times$
2′, i.e. 15 kpc
$\times$
2′, i.e. 15 kpc $\times$
10 kpc, see Figure 4).
$\times$
10 kpc, see Figure 4).
In the high-resolution (8′′) radio continuum image we measure a core flux of 2.1 mJy. The flux densities within the lowest red and yellow contours in Figure 5 (middle) are 23 and 13 mJy, respectively. The lowest red contour shows the first hints of wings/ears at both sides. For the core and inner ring together we measure 16 mJy. Integrating the flux up to a height of $\sim$
2′ above the disk (see Figure 4), which includes the bright, box-shaped central area and X-shaped wings, gives 50 mJy. Beyond a height of
$\sim$
2′ above the disk (see Figure 4), which includes the bright, box-shaped central area and X-shaped wings, gives 50 mJy. Beyond a height of $\sim$
2′ the detected flux in the outflow is only
$\sim$
2′ the detected flux in the outflow is only $15 \pm 5$
mJy. See Table 3 for a summary of the flux densities. The outflow possibly extends to 10′ (50 kpc) above and below the disk of ESO 130-G012, but deeper high-resolution radio images (with good sensitivity to low surface brightness emission) are needed to confirm this.
$15 \pm 5$
mJy. See Table 3 for a summary of the flux densities. The outflow possibly extends to 10′ (50 kpc) above and below the disk of ESO 130-G012, but deeper high-resolution radio images (with good sensitivity to low surface brightness emission) are needed to confirm this.
The bi-polar outflow of ESO 130-G012 is symmetric and edge-brightened, with a prominent (closed) hourglass shape. In Figure 3, we show ASKAP total intensity and clean residual images. The blue ellipses each have sizes of 46 kpc (height) $\times$
28 kpc (width). The stellar disk, indicated by a yellow ellipse of
$\times$
28 kpc (width). The stellar disk, indicated by a yellow ellipse of $\sim$
10 kpc, forms the base of the outflow. The latter is also evident in Figure 4 as well as box-shaped emission in the lower outflow above and below the disk. Prominent X-shapes wings, which are seen in several other nearby, edge-on galaxies with outflows, indicate that most of the emission resides on the surface of a largely hollow structure.
$\sim$
10 kpc, forms the base of the outflow. The latter is also evident in Figure 4 as well as box-shaped emission in the lower outflow above and below the disk. Prominent X-shapes wings, which are seen in several other nearby, edge-on galaxies with outflows, indicate that most of the emission resides on the surface of a largely hollow structure.
3.2.1. Polarisation and spectral index estimates
Analysis of the polarisation data from the same ASKAP observation shows no detection of polarised emission in the galaxy disk, suggesting a polarisation fraction lower than 1%. Depolarisation is likely high both by Galactic foreground emission and internally; see, e.g. Stein et al. (Reference Stein2025). The EMU in-band spectral index within the inner disk (where the radio flux is $\gt$
3 mJy) is
$\gt$
3 mJy) is $\sim$
0.57
$\sim$
0.57 $\pm$
0.11, typical for star-forming galaxies (Marvil, Owen, & Eilek Reference Marvil, Owen and Eilek2015; Klein, Lisenfeld, & Verley Reference Klein, Lisenfeld and Verley2018). Furthermore, we note that ESO 130-G012 is catalogued in GLEAM-300 (Duchesne et al. Reference Duchesne2025) with an integrated flux density of
$\pm$
0.11, typical for star-forming galaxies (Marvil, Owen, & Eilek Reference Marvil, Owen and Eilek2015; Klein, Lisenfeld, & Verley Reference Klein, Lisenfeld and Verley2018). Furthermore, we note that ESO 130-G012 is catalogued in GLEAM-300 (Duchesne et al. Reference Duchesne2025) with an integrated flux density of $71 \pm 13$
mJy and a source size of 184′′ (
$71 \pm 13$
mJy and a source size of 184′′ ( $\pm$
13′′)
$\pm$
13′′) $\times$
129′′ (
$\times$
129′′ ( $\pm$
8′′). The EMU 944 MHz flux within the above area is
$\pm$
8′′). The EMU 944 MHz flux within the above area is $\sim$
50 mJy (disk + lower outflow, see Table 3), suggesting a flat spectral index of
$\sim$
50 mJy (disk + lower outflow, see Table 3), suggesting a flat spectral index of $\alpha \approx -0.30 \pm 0.15$
. The local noise (10.3 mJy) and low resolution (150.3′′
$\alpha \approx -0.30 \pm 0.15$
. The local noise (10.3 mJy) and low resolution (150.3′′ $\times$
135.4′′) of GLEAM-300 make this a very preliminary estimate for the disk and lower outflow combined. For example, the detected 888 MHz flux density of ESO 130-G012 in the first data release of the Rapid ASKAP Continuum Survey (RACS, McConnell et al. Reference McConnell2020; Hale et al. Reference Hale2021) is only
$\times$
135.4′′) of GLEAM-300 make this a very preliminary estimate for the disk and lower outflow combined. For example, the detected 888 MHz flux density of ESO 130-G012 in the first data release of the Rapid ASKAP Continuum Survey (RACS, McConnell et al. Reference McConnell2020; Hale et al. Reference Hale2021) is only $\sim$
30 mJy due to the survey’s shallow nature (rms
$\sim$
30 mJy due to the survey’s shallow nature (rms $\sim$
0.3 mJy beam
$\sim$
0.3 mJy beam $^{-1}$
, 25′′ resolution), which leads to
$^{-1}$
, 25′′ resolution), which leads to $\alpha \approx -0.8 \pm 0.2$
.
$\alpha \approx -0.8 \pm 0.2$
.
Deep, wide-band data are needed to map the spectral index of the disk and detect polarised emission in the X-shaped wings and bipolar outflow. The upgraded Australia Telescope Compact Array (ATCA) with its brand-new BIGCAT correlator, which recently replaced the Compact Array Broad-band Backend (CABB, Wilson et al. Reference Wilson2011), would be ideal for this purpose, particularly the sensitive and nearly RFI-free 4-cm band, as well as MeerKAT UHF- and L-band follow-up observations.
3.3. Infrared properties
From the infrared magnitudes listed in Table 1, we estimate the stellar mass, $M_{\star}$
, of ESO 130-G012, correcting for dust extinction (
$M_{\star}$
, of ESO 130-G012, correcting for dust extinction ( $E(B-V$
) = 0.5, Schlafly & Finkbeiner Reference Schlafly and Finkbeiner2011). Williams et al. (Reference Williams, Kraan-Korteweg and Woudt2014), using deep near infrared (NIR) photometry of H I-detected galaxies in the Zone of Avoidance, give an extrapolated total K-band magnitude of
$E(B-V$
) = 0.5, Schlafly & Finkbeiner Reference Schlafly and Finkbeiner2011). Williams et al. (Reference Williams, Kraan-Korteweg and Woudt2014), using deep near infrared (NIR) photometry of H I-detected galaxies in the Zone of Avoidance, give an extrapolated total K-band magnitude of $8.610 \pm 0.024$
for ESO 130-G012, corresponding to
$8.610 \pm 0.024$
for ESO 130-G012, corresponding to $M_{\star}$
= 2.1 (
$M_{\star}$
= 2.1 ( $\pm$
0.1)
$\pm$
0.1) $\times 10^{10}$
M
$\times 10^{10}$
M $_{\odot}$
. Converting from a Salpeter to a (Chabrier Reference Chabrier2003) initial mass function (IMF) results in
$_{\odot}$
. Converting from a Salpeter to a (Chabrier Reference Chabrier2003) initial mass function (IMF) results in $M_{\star}$
= 1.2 (
$M_{\star}$
= 1.2 ( $\pm$
0.1)
$\pm$
0.1) $\times 10^{10}$
M
$\times 10^{10}$
M $_{\odot}$
. Alternately, following Jarrett et al. (Reference Jarrett2023) and Cluver et al. (Reference Cluver2025), who adopt a Chabrier IMF, we estimate
$_{\odot}$
. Alternately, following Jarrett et al. (Reference Jarrett2023) and Cluver et al. (Reference Cluver2025), who adopt a Chabrier IMF, we estimate $M_{\star}$
=
$M_{\star}$
= $1.1 \times 10^{10}$
M
$1.1 \times 10^{10}$
M $_{\odot}$
based on the extinction-corrected WISE W1 magnitude.
$_{\odot}$
based on the extinction-corrected WISE W1 magnitude.
Outflow properties of ESO 130-G012.
 $^\star$
The outflow opening angle is determined with respect to the vector orthogonal to the disk from the midplane on each side.
$^\star$
The outflow opening angle is determined with respect to the vector orthogonal to the disk from the midplane on each side.
Radio continuum flux estimates for different regions in the galaxy ESO 130-G012 from the ASKAP 944 MHz images.

3.3.1. Star formation rate (SFR)
We estimate the disk SFR of ESO 130-G012 from (a) the ASKAP 944 MHz radio continuum emission, (b) the IRAS FIR emission, and (c) the WISE W3- and W4-band magnitudes.
-
(a) The formation rate of recent, high-mass stars ( $M \gt 5$
M
$_{\odot}$
) is calculated using SFR (M
$_{\odot}$
yr
$^{-1}$
) = 0.03
$D^2$
$S_\mathrm{20cm}$
(Condon, Cotton, & Broderick Reference Condon, Cotton and Broderick2002), where D is the distance in Mpc and
$S_\mathrm{20cm}$
the 20-cm radio continuum flux density in Jy. We measure
$S_\mathrm{944MHz} \sim 23$
mJy for the inner disk (see Table 3), resulting in SFR
$\sim$
0.2 M
$_{\odot}$
yr
$^{-1}$
. In order to derive the formation rate of all stars (
$M \gt 0.1$
M
$_{\odot}$
) we multiply this value by 5.5 (see Condon et al. Reference Condon, Cotton and Broderick2002), resulting in
$\sim$
1.1 M
$_{\odot}$
yr
$^{-1}$
. Adjusting from a Salpeter to a Chabrier IMF results in SFR
$\sim$
0.6 M
$_{\odot}$
yr
$^{-1}$
for the disk of ESO 130-G012.
$M \gt 5$
M
$_{\odot}$
) is calculated using SFR (M
$_{\odot}$
yr
$^{-1}$
) = 0.03
$D^2$
$S_\mathrm{20cm}$
(Condon, Cotton, & Broderick Reference Condon, Cotton and Broderick2002), where D is the distance in Mpc and
$S_\mathrm{20cm}$
the 20-cm radio continuum flux density in Jy. We measure
$S_\mathrm{944MHz} \sim 23$
mJy for the inner disk (see Table 3), resulting in SFR
$\sim$
0.2 M
$_{\odot}$
yr
$^{-1}$
. In order to derive the formation rate of all stars (
$M \gt 0.1$
M
$_{\odot}$
) we multiply this value by 5.5 (see Condon et al. Reference Condon, Cotton and Broderick2002), resulting in
$\sim$
1.1 M
$_{\odot}$
yr
$^{-1}$
. Adjusting from a Salpeter to a Chabrier IMF results in SFR
$\sim$
0.6 M
$_{\odot}$
yr
$^{-1}$
for the disk of ESO 130-G012. -
(b) Using the IRAS flux densities (see Yamada et al. Reference Yamada1993), we derive
$L_\mathrm{FIR}$
= 5.1 (
$\pm$
1.1)
$\times 10^{42}$
erg s
$^{-1}$
and SFR
$_\mathrm{FIR} = 0.23$
M
$_{\odot}$
yr
$^{-1}$
based on Kennicutt (Reference Kennicutt1998) and a Salpeter IMF. Adjusting to a Chabrier IMF gives 0.13 M
$_{\odot}$
yr
$^{-1}$
. -
(c) Following Cluver et al. (Reference Cluver2025), who use the Chabrier IMF, we estimate SFR = 0.20 M
$_{\odot}$
yr
$^{-1}$
and 0.24 M
$_{\odot}$
yr
$^{-1}$
based on the extinction-corrected WISE W3- and W4-band magnitudes, respectively.


In summary, we find SFR values of 0.1–0.6 M $_{\odot}$
yr
$_{\odot}$
yr $^{-1}$
for the disk of ESO 130-G012. We estimate an H I depletion time of
$^{-1}$
for the disk of ESO 130-G012. We estimate an H I depletion time of $M_\mathrm{HI}$
/SFR
$M_\mathrm{HI}$
/SFR $\sim$
1–5 Gyr.
$\sim$
1–5 Gyr.
3.3.2. Radio-FIR correlation
We find that the disk of ESO 130-G012 lies on the radio-FIR correlation, derived for star-forming galaxies by Helou, Soifer, & Rowan-Robinson (Reference Helou, Soifer and Rowan-Robinson1985). For the inner disk, where we measure a flux density of 23 mJy (see Table 3), the logarithmic FIR/radio flux density ratio, $q_\mathrm{FIR}$
, is 2.24, close to the typical value of 2.34 (Yun, Reddy, & Condon Reference Yun, Reddy and Condon2001). For the total flux of 65 mJy, which includes the bipolar outflow, we get a much lower value of
$q_\mathrm{FIR}$
, is 2.24, close to the typical value of 2.34 (Yun, Reddy, & Condon Reference Yun, Reddy and Condon2001). For the total flux of 65 mJy, which includes the bipolar outflow, we get a much lower value of $q_\mathrm{FIR}$
= 1.78.
$q_\mathrm{FIR}$
= 1.78.
3.4. X-ray properties
The SRG/eROSITAFootnote
c
All-sky Survey catalogue (eRASS1) reveals a point-like source in the centre of ESO 130-G012 with an absorbed 0.2–2.3 keV flux of 5.8 ( $\pm$
1.6)
$\pm$
1.6) $\times 10^{-14}$
erg s
$\times 10^{-14}$
erg s $^{-1}$
cm
$^{-1}$
cm $^{-2}$
(Merloni et al. Reference Merloni2024), so there might be a low-luminosity (
$^{-2}$
(Merloni et al. Reference Merloni2024), so there might be a low-luminosity ( $\sim$
3.4
$\sim$
3.4 $\pm0.9 \times 10^{39}$
erg s
$\pm0.9 \times 10^{39}$
erg s $^{-1}$
) active galactic nucleus (AGN) or several X-ray binaries in the galaxy centre. Based on the total H I column density in the galaxy direction of
$^{-1}$
) active galactic nucleus (AGN) or several X-ray binaries in the galaxy centre. Based on the total H I column density in the galaxy direction of $\sim$
1.3
$\sim$
1.3 $\times 10^{21}$
cm
$\times 10^{21}$
cm $^{-2}$
, we used a correction factor of unabsorbed/absorbed = 1.7 for the 0.2–2.3 keV band and a powerlaw spectrum with a photon index of
$^{-2}$
, we used a correction factor of unabsorbed/absorbed = 1.7 for the 0.2–2.3 keV band and a powerlaw spectrum with a photon index of $\Gamma = 1.8$
. Our estimated unabsorbed soft X-ray luminosity for ESO 130-G012 lies only slightly above the value expected from the soft X-ray to FIR luminosity relationship for star-forming galaxies (Sazonov & Khabibullin Reference Sazonov and Khabibullin2017; Mineo, Gilfanov, & Sunyaev Reference Mineo, Gilfanov and Sunyaev2012), although we note the relatively large scatter for galaxies with low SFRs. Chandra observations are needed to map the extent of the X-ray emission and distinguish high and low mass X-ray binaries from an AGN.
$\Gamma = 1.8$
. Our estimated unabsorbed soft X-ray luminosity for ESO 130-G012 lies only slightly above the value expected from the soft X-ray to FIR luminosity relationship for star-forming galaxies (Sazonov & Khabibullin Reference Sazonov and Khabibullin2017; Mineo, Gilfanov, & Sunyaev Reference Mineo, Gilfanov and Sunyaev2012), although we note the relatively large scatter for galaxies with low SFRs. Chandra observations are needed to map the extent of the X-ray emission and distinguish high and low mass X-ray binaries from an AGN.
3.5. HI properties
Only low-resolution H I data are currently available for the galaxy ESO 130-G012 and its environment. These were taken with the Parkes 21-cm multibeam receiver system as part of the H I Parkes All Sky Survey (HIPASS, Barnes et al. Reference Barnes2001) and the H I Parkes Zone of Avoidance survey (HIZOA, Donley et al. Reference Donley2005, Reference Donley2006), which is 5 $\times$
deeper than HIPASS. ESO 130-G012 is catalogued as HIZOA J1222–58 (
$\times$
deeper than HIPASS. ESO 130-G012 is catalogued as HIZOA J1222–58 ( $v_\mathrm{sys}$
=
$v_\mathrm{sys}$
= $1\,531 \pm 6$
km s
$1\,531 \pm 6$
km s $^{-1}$
, Staveley-Smith et al. Reference Staveley-Smith2016) showing a distinct double-horn H I profile (see Figure 6 top). Our measured and derived properties are listed in Table 1. The galaxy’s H I mass of
$^{-1}$
, Staveley-Smith et al. Reference Staveley-Smith2016) showing a distinct double-horn H I profile (see Figure 6 top). Our measured and derived properties are listed in Table 1. The galaxy’s H I mass of $M_\mathrm{HI}$
=
$M_\mathrm{HI}$
= $5.3 \times 10^8$
M
$5.3 \times 10^8$
M $_{\odot}$
suggests an H I diameter of only
$_{\odot}$
suggests an H I diameter of only $D_\mathrm{HI}$ $\sim$
13 kpc, based on the
$\sim$
13 kpc, based on the $M_\mathrm{HI}$
-
$M_\mathrm{HI}$
- $D_\mathrm{HI}$
relation (Wang et al. Reference Wang2016), i.e. only slightly larger than the stellar disk.
$D_\mathrm{HI}$
relation (Wang et al. Reference Wang2016), i.e. only slightly larger than the stellar disk.
(Top:) Parkes H I spectrum of the galaxy ESO 130-G012. – (Bottom:) Mean H I velocity field of ESO 130-G012 and two neighbouring galaxies. The gridded Parkes beam (15.5′) is shown in the bottom left corner.

Interestingly, the red-shifted, south-eastern (SE) side of the global H I spectrum is somewhat brighter than the blue-shifted, northwestern (NW) side. Exploring the Parkes H I channel maps we find this asymmetry may be caused by extraplanar H I emission ( $M_\mathrm{HI}$ $\sim$
10
$\sim$
10 $^7$
M
$^7$
M $_{\odot}$
) around 1 700 km s
$_{\odot}$
) around 1 700 km s $^{-1}$
, located south-east of the disk, possibly a yet unidentified, interacting dwarf galaxy, likely located within 100 kpc of ESO 130-G012. This is hinted at in Figure 6 (bottom), where we show the mean H I velocity field of ESO 130-G012 and surroundings. Interferometric H I observations are needed to study the galaxy’s gas distribution, kinematics, including its rotation and peculiar motions, and environment.
$^{-1}$
, located south-east of the disk, possibly a yet unidentified, interacting dwarf galaxy, likely located within 100 kpc of ESO 130-G012. This is hinted at in Figure 6 (bottom), where we show the mean H I velocity field of ESO 130-G012 and surroundings. Interferometric H I observations are needed to study the galaxy’s gas distribution, kinematics, including its rotation and peculiar motions, and environment.
We detect two gas-rich galaxies in the surroundings of ESO 130-G012: (1) HIZSS 073 ( $v_\mathrm{sys}$
= 1 477 km s
$v_\mathrm{sys}$
= 1 477 km s $^{-1}$
, Henning et al. Reference Henning2000), also known as HIPASS 1221–59 and HIZOA J1221–59, and (2) HIZOA J1211–59 (
$^{-1}$
, Henning et al. Reference Henning2000), also known as HIPASS 1221–59 and HIZOA J1221–59, and (2) HIZOA J1211–59 ( $v_\mathrm{sys}$
= 1 533 km s
$v_\mathrm{sys}$
= 1 533 km s $^{-1}$
, Staveley-Smith et al. Reference Staveley-Smith2016) at projected distances of
$^{-1}$
, Staveley-Smith et al. Reference Staveley-Smith2016) at projected distances of $\sim$
70′ and
$\sim$
70′ and $\sim$
90′, i.e. 344 and 442 kpc, respectively, for a group distance of D = 16.9 Mpc. HIZSS 073’s H I mass is
$\sim$
90′, i.e. 344 and 442 kpc, respectively, for a group distance of D = 16.9 Mpc. HIZSS 073’s H I mass is $2.7 \times 10^9$
M
$2.7 \times 10^9$
M $_{\odot}$
(Ryan-Weber et al. Reference Ryan-Weber2002; Koribalski et al. Reference Koribalski2004),
$_{\odot}$
(Ryan-Weber et al. Reference Ryan-Weber2002; Koribalski et al. Reference Koribalski2004), $\sim$
4
$\sim$
4 $\times$
larger than that of ESO 130-G012. DECaPS images reveal the optical counterpart at
$\times$
larger than that of ESO 130-G012. DECaPS images reveal the optical counterpart at $\alpha,\delta$
(J2000) =
$\alpha,\delta$
(J2000) = $12^\textrm{h}\,21^\textrm{m}\,34.4^\textrm{s}$
, –59
$12^\textrm{h}\,21^\textrm{m}\,34.4^\textrm{s}$
, –59 $^\circ$
42′ 17.3′′ (size
$^\circ$
42′ 17.3′′ (size $\sim$
30′′,
$\sim$
30′′, $PA \sim 130$ $^\circ$
, inclination
$^\circ$
, inclination $\sim$
60
$\sim$
60 $^\circ$
). Interferometric H I observations may reveal further dwarf companion galaxies in the vicinity of ESO 130-G012, which would play a role in triggering star formation through tidal interactions.
$^\circ$
). Interferometric H I observations may reveal further dwarf companion galaxies in the vicinity of ESO 130-G012, which would play a role in triggering star formation through tidal interactions.
3.5.1. Binding energy and HI kinetic energy
The dynamical mass of ESO 130-G012 within $R_\mathrm{HI}$
= 6.5 kpc is
$R_\mathrm{HI}$
= 6.5 kpc is $M_\mathrm{dyn}$
= 5.3 (
$M_\mathrm{dyn}$
= 5.3 ( $\pm$
0.5)
$\pm$
0.5) $\times 10^{10}$
M
$\times 10^{10}$
M $_{\odot}$
(see Table 1). This suggests, based on the popular spherical top-hat model (Peebles Reference Peebles1993), a virial radius of
$_{\odot}$
(see Table 1). This suggests, based on the popular spherical top-hat model (Peebles Reference Peebles1993), a virial radius of $R_\mathrm{vir} \sim 80$
kpc for which the mass density contrast is
$R_\mathrm{vir} \sim 80$
kpc for which the mass density contrast is $18 \pi^2$
and the binding energy is
$18 \pi^2$
and the binding energy is $-1.9 \times 10^{57}$
erg. From the galaxy’s H I mass,
$-1.9 \times 10^{57}$
erg. From the galaxy’s H I mass, $M_\mathrm{HI}$
= 5.3 (
$M_\mathrm{HI}$
= 5.3 ( $\pm$
0.8)
$\pm$
0.8) $\times 10^8$
M
$\times 10^8$
M $_{\odot}$
, and its rotational velocity,
$_{\odot}$
, and its rotational velocity, $v_\mathrm{rot}$
= 188
$v_\mathrm{rot}$
= 188 $\pm$
6 km s
$\pm$
6 km s $^{-1}$
, we estimate the corresponding H I kinetic energy as
$^{-1}$
, we estimate the corresponding H I kinetic energy as $K_\mathrm{rot} \simeq M_\mathrm{HI} \times v_\mathrm{rot}^2 = 1.9 (\pm 0.5) \times 10^{56}$
erg. This value, together with the estimate of the system binding energy, suggests that gas cannot leave the halo.
$K_\mathrm{rot} \simeq M_\mathrm{HI} \times v_\mathrm{rot}^2 = 1.9 (\pm 0.5) \times 10^{56}$
erg. This value, together with the estimate of the system binding energy, suggests that gas cannot leave the halo.
4. Discussion
In the Local Universe, powerful outflows observed above and below the disks of spiral galaxies typically originate from their nuclear regions, driven either by starbursts or AGN. While outflows or filaments are also sometimes seen from the mildly star-forming disks of edge-on galaxies, their heights are typically quite low. Our discovery of a large-scale ( $\gtrsim$
30 kpc) bipolar outflow from the
$\gtrsim$
30 kpc) bipolar outflow from the $\sim$
10 kpc-diameter disk of ESO 130-G012, was unexpected. Does the galaxy’s low-luminosity AGN play a role ? Or can star formation and stellar-driven winds explain the width, large height, and symmetric, edge-brightened bubble shape of the bipolar outflow from the disk of ESO 130-G012 ? And what triggered the outflow ?
$\sim$
10 kpc-diameter disk of ESO 130-G012, was unexpected. Does the galaxy’s low-luminosity AGN play a role ? Or can star formation and stellar-driven winds explain the width, large height, and symmetric, edge-brightened bubble shape of the bipolar outflow from the disk of ESO 130-G012 ? And what triggered the outflow ?
From the detected X-ray emission, we infer that there might be low-luminosity AGN in the centre of ESO 130-G012. But no radio jets are detected, neither a nuclear bi-conical outflow, and the galaxy lies on the radio-FIR relation where normal SF galaxies are found. Nevertheless, as the accretion rate of black holes varies on timescales of $\sim$
10–100 Myr, prior AGN outbursts are likely.
$\sim$
10–100 Myr, prior AGN outbursts are likely.
On the other hand, the wide outflow base and bipolar bubble morphology of ESO 130-G012 favours a stellar outburst scenario. While rare, similar large-scale outflows have been observed in a few nearby disk galaxies, traced by X-ray, H $\alpha$
, dust and/or radio continuum (RC) emission (see Table 4, for example in NGC 1371 Veronese et al. Reference Veronese2025, which also has a low SFR, NGC 1808 Kane & Veilleux Reference Kane and Veilleux2024, NGC 3079 Hodges-Kluck et al. Reference Hodges-Kluck2020, NGC 4217 Heesen et al. Reference Heesen2024, and NGC 5775 Heald et al. Reference Heald2022). Several formation scenarios – star formation, CR winds, and AGN bubbles – have been put forward, able to explain the observed outflow properties. We find that the energies required to launch the radio emission to heights of
$\alpha$
, dust and/or radio continuum (RC) emission (see Table 4, for example in NGC 1371 Veronese et al. Reference Veronese2025, which also has a low SFR, NGC 1808 Kane & Veilleux Reference Kane and Veilleux2024, NGC 3079 Hodges-Kluck et al. Reference Hodges-Kluck2020, NGC 4217 Heesen et al. Reference Heesen2024, and NGC 5775 Heald et al. Reference Heald2022). Several formation scenarios – star formation, CR winds, and AGN bubbles – have been put forward, able to explain the observed outflow properties. We find that the energies required to launch the radio emission to heights of $\sim$
50 kpc can be supplied even by steady, low star formation in the disk over an extended period of time. See our calculation in the Appendix. So, why are such large-scale outflows not seen more often? Will deeper, more sensitive observations, e.g. in the radio continuum, reveal many more large-scale outflows? Is it likely that galaxies with already known X-shaped, polarised wings (e.g. Stein et al. Reference Stein2025) harbour large-scale outflows? After some 10 million years, the radio emission fades away, so older outflows are not detectable. Obtaining outflow ages (e.g. via spectral index maps) and SF histories will be important to progress our understanding of outflow formation and timescales.
$\sim$
50 kpc can be supplied even by steady, low star formation in the disk over an extended period of time. See our calculation in the Appendix. So, why are such large-scale outflows not seen more often? Will deeper, more sensitive observations, e.g. in the radio continuum, reveal many more large-scale outflows? Is it likely that galaxies with already known X-shaped, polarised wings (e.g. Stein et al. Reference Stein2025) harbour large-scale outflows? After some 10 million years, the radio emission fades away, so older outflows are not detectable. Obtaining outflow ages (e.g. via spectral index maps) and SF histories will be important to progress our understanding of outflow formation and timescales.
Nearby galaxies with known large ( $\gtrsim$
3 kpc) bipolar outflows.
$\gtrsim$
3 kpc) bipolar outflows.

References: B08 (Bauer et al. Reference Bauer2008), B24 (Borlaff et al. Reference Borlaff2024), D90 (Dettmar Reference Dettmar1990), DB99 (Devine & Bally Reference Devine and Bally1999), E98 (Elmouttie et al. Reference Elmouttie, Haynes, Jones, Sadler and Ehle1998), H96 (Heckman et al. Reference Heckman, Dahlem, Eales, Fabbiano and Weaver1996), H09 (Heesen et al. Reference Heesen, Krause, Beck and Dettmar2009), H20 (Hodges-Kluck et al. Reference Hodges-Kluck2020), H22 (Heald et al. Reference Heald2022), H24 (Heesen et al. Reference Heesen2024), K93a (Koribalski et al. Reference Koribalski, Dahlem, Mebold and Brinks1993a), K93b (Koribalski et al. Reference Koribalski, Dickey and Mebold1993b), K10 (Kepley et al. Reference Kepley2010), K24 (Kane & Veilleux Reference Kane and Veilleux2024), L99 (Lehnert et al. Reference Lehnert, Heckman and Weaver1999), M25 (Matthews et al. Reference Matthews2025), R19 (Rupke et al. Reference Rupke2019), R23 (Rupke et al. Reference Rupke2023), S04 Strickland et al. (Reference Strickland, Heckman, Colbert, Hoopes and Weaver2004a), S10 Su et al. (Reference Su, Slatyer and Finkbeiner2010), S19 (Stein et al. Reference Stein2019), V01 (Veilleux, Shopbell, & Miller Reference Veilleux, Shopbell and Miller2001), V25 (Veronese et al. Reference Veronese2025), W24 (Watts et al. Reference Watts2024), and Y16 (Yoshida et al. Reference Yoshida2016).
4.1. Comparison with other large-scale galaxy outflows
In Table 4, we list galaxies with relatively large ( $\gtrsim$
3 kpc) bipolar outflows. This list includes several well-known starburst galaxies where the observed outflow heights reach 10–15 kpc from the disk (e.g. Matthews et al. Reference Matthews2025; Thompson & Heckman Reference Thompson and Heckman2024). Larger outflows are extremely rare. Notably, in most galaxies, the outflows emerge from their nuclear region. Both the ESO 130-G012 outflow height and its disk-wide outflow base are highly unusual. See Figure 7 (left) for a sketch of the bipolar outflow from ESO 130-G012.
$\gtrsim$
3 kpc) bipolar outflows. This list includes several well-known starburst galaxies where the observed outflow heights reach 10–15 kpc from the disk (e.g. Matthews et al. Reference Matthews2025; Thompson & Heckman Reference Thompson and Heckman2024). Larger outflows are extremely rare. Notably, in most galaxies, the outflows emerge from their nuclear region. Both the ESO 130-G012 outflow height and its disk-wide outflow base are highly unusual. See Figure 7 (left) for a sketch of the bipolar outflow from ESO 130-G012.
-
• Among the lowest observed outflow heights in our sample is the nearby Circinus Galaxy which shows prominent radio bubbles emerging from its active central region (see Elmouttie et al. Reference Elmouttie, Haynes, Jones, Sadler and Ehle1998, and references therein) extending 3 kpc above and below its disk. The sketch shown in Figure 7 (right) is based on the radio and infrared images of the Circinus Galaxy; we highlight the bipolar radio bubbles and their inner structure, the inner stellar disk, the prominent AGN and the central star-forming ring.
-
• The activity and outflow geometry of the starburst galaxy M 82 is very different from that of ESO 130-G012. Both H
$\alpha$
and X-ray emission is observed to heights of 11 kpc (e.g. Adebahr et al. Reference Adebahr2013). While exploring the starburst wind from M 82, Strickland & Stevens (Reference Strickland and Stevens2000) and Strickland & Heckman (Reference Strickland and Heckman2009) developed several models, including a thin-disk model (their Figure 6), which produces conical winds with large opening angles, somewhat similar to ESO 130-G012. -
• The nearby, edge-on galaxy NGC 891 – often considered a twin of the Milky Way – is well-known for its disk-wide chimneys (Dettmar Reference Dettmar1990). Its SFR and
$v_\mathrm{rot}$
are somewhat higher than in ESO 130-G012, while its H I mass is 10
$\times$
than that of ESO 130-G012. In NGC 891, where SF is detected from the whole disk, Schmidt et al. (Reference Schmidt2019) find that the best-fitting advection flow is an accelerated galactic wind with midplane velocities of
$\sim$
150 km s
$^{-1}$
, reaching the escape velocity at a height of 9–17 kpc, depending on the radius. -
• In NGC 1532, which is tidally interacting with its smaller elliptical companion, Matthews et al. (Reference Matthews2025) find magnetized, highly ordered radio continuum loops originating from star forming regions and extending 10 kpc above and below the disk. They suggest cosmic ray (CR) pressure plays a significant role in launching these outflows. Notably, the north-western radio loops appear to surround the infalling companion, NGC 1531, which is likely responsible for NGC 1532’s enhanced SFR of
$\sim$
2.7 M
$_{\odot}$
yr
$^{-1}$
. -
• The dust filaments and gas outflow from the central starburst region of NGC 1808, emerging perpendicular to its disk, have been known for a long time (e.g. Koribalski et al. Reference Koribalski, Dahlem, Mebold and Brinks1993a,b). More recently, Kane & Veilleux (Reference Kane and Veilleux2024) detected dust filaments extending up to
$\sim$
13 kpc from the disk in a bi-conical structure. Using the isothermal sheet model, they estimate the potential energy needed to lift the dust and gas to a mean height of
$\sim$
5 kpc. They find that 5–10
$\times 10^{56}$
erg is required, which they suggest can be delivered by the SFR of 3.5–5.4 M
$_{\odot}$
yr
$^{-1}$
sustained over 4–26 Myr. They also note that the weak AGN in NGC 1808 is energetically not important in driving the observed large-scale outflow. -
• The largest outflow that we could find in the literature is detected in the halo of the edge-on, starburst galaxy NGC 3079. Hodges-Kluck et al. (Reference Hodges-Kluck2020) find an X-shaped outflow reaching 30 and 60 kpc above the disk in X-ray and UV emission, respectively (see also Veilleux et al. Reference Veilleux2021). This is much larger than the inner radio lobes previously seen to emerge from the galaxy’s nuclear region (Duric & Seaquist Reference Duric and Seaquist1988; Irwin & Saikia Reference Irwin and Saikia2003), which are similar to those in the Circinus Galaxy. The edges of the X-ray outflow in NGC 3079 are found just inside the bubble created by the FUV filaments. Hodges-Kluck et al. (Reference Hodges-Kluck2020) refer to 3D hydro-dynamical simulations by Tanner, Cecil, & Heitsch (Reference Tanner, Cecil and Heitsch2016) who model the outflow formation within a 1 kpc cube. In Tanner, Weaver, & Ogorzałek (Reference Tanner, Weaver and Ogorzałek2025), these simulations are expanded to a 5 kpc box, comparing nuclear starburst and AGN with focus on the X-ray emission.
-
• In the nearby, edge-on galaxy NGC 4217 Heesen et al. (Reference Heesen2024) find a one-sided 20 kpc radio bubble. Using matched Low-Frequency Array (LOFARi) 144 MHz and Jansky Very Large Array (JVLA) 3 GHz data, they find a spectral gradient (ageing) in the bubble. Fitting CRE advection models to the intensity profiles, Heesen et al. (Reference Heesen2024) find the bubble may have been inflated by supernovae over a timescale of 35 Myr. No AGN is detected in NGC 4217, which has an SFR of 4.6 M
$_{\odot}$
yr
$^{-1}$
. -
• In NGC 4666, Stein et al. (Reference Stein2019) find a box-like 9 kpc radio halo, X-shaped magnetic field structure, and widespread star formation across almost the entire disk. Similar X-shaped polarisation structures are also observed in NGC 253 by Heesen et al. (Reference Heesen, Krause, Beck and Dettmar2009) and NGC 5775 by Tüllmann et al. (Reference Tüllmann, Dettmar, Soida, Urbanik and Rossa2000) who explore the formation of such spurs by dynamo action. The SFR of NGC 4666 is 7.3 M
$_{\odot}$
yr
$^{-1}$
, the highest among the 35 edge-on galaxies in the ‘Continuum Halos in Nearby Galaxies – an EVLA Survey’ (CHANG-ES) sample (Wiegert et al. Reference Wiegert2015). -
• Interestingly, the mildly inclined spiral galaxy NGC 1371 (Grundy et al. Reference Grundy2023; For et al. Reference For2021), which – like ESO 130-G012 – has relatively low SFR and a weak AGN, reveals bipolar bubbles of
$\sim$
20 kpc height (Veronese et al. Reference Veronese2025). The large H I disk of NGC 1371 resembles that of the Circinus Galaxy (Jones et al. Reference Jones, Koribalski, Elmouttie and Haynes1999; Koribalski et al. Reference Koribalski2018), which also hosts an AGN and SF ring, but its radio bubbles are much larger (maybe at a later evolutionary stage) than those in Circinus. -
• The ‘flux tube’ model by Heald et al. (Reference Heald2022) for the galaxy-wide outflow in NGC 5775 may be applicable to ESO 130-G012. They use an outflow base of 14 kpc (this is half the SF disk in NGC 5775), where CRs are advected vertically in the flow of magnetized plasma, expanding adiabatically (their Figure 8).


Sketches of the bipolar outflows observed in ESO 130-G012 (left) and the Circinus Galaxy (right, based on Elmouttie et al. Reference Elmouttie, Haynes, Jones, Sadler and Ehle1998). The galaxy stellar disks, shown in blue color, are indicative.

4.1.1. Fermi bubbles
The teardrop-shaped ‘Fermi bubbles’ (Su, Slatyer, & Finkbeiner Reference Su, Slatyer and Finkbeiner2010), which extend 8–10 kpc above and below the Galactic Plane, emerge from the star-forming Galactic Centre region where Sgr A $^\star$
, our Galaxy’s
$^\star$
, our Galaxy’s $\sim$
10
$\sim$
10 $^6$
M
$^6$
M $_{\odot}$
black hole, resides. The central waist of the elongated bubbles appears to be very narrow (
$_{\odot}$
black hole, resides. The central waist of the elongated bubbles appears to be very narrow ( $\sim$
100 pc). The bubbles are likely underdense, i.e. filled with hot gas of lower density than the surrounding ISM, expand at
$\sim$
100 pc). The bubbles are likely underdense, i.e. filled with hot gas of lower density than the surrounding ISM, expand at $\lesssim$
1 000 km s
$\lesssim$
1 000 km s $^{-1}$
with energies of
$^{-1}$
with energies of $\sim$
10
$\sim$
10 $^{55-56}$
erg (e.g. Crocker et al. Reference Crocker, Bicknell, Taylor and Carretti2015) and are likely
$^{55-56}$
erg (e.g. Crocker et al. Reference Crocker, Bicknell, Taylor and Carretti2015) and are likely $\sim$
10
$\sim$
10 $^7$
–
$^7$
– $10^8$
yr old. Magnetic fields may be present, stabilizing the bubble shape and preventing their break-up. Using the Parkes 64-m telescope ‘Murriyang’, Carretti et al. (Reference Carretti2013) find two giant, linearly polarised radio lobes, closely corresponding to the Fermi bubbles, with a strong magnetic fields of
$10^8$
yr old. Magnetic fields may be present, stabilizing the bubble shape and preventing their break-up. Using the Parkes 64-m telescope ‘Murriyang’, Carretti et al. (Reference Carretti2013) find two giant, linearly polarised radio lobes, closely corresponding to the Fermi bubbles, with a strong magnetic fields of $\lesssim$
15
$\lesssim$
15 $\unicode{x03BC}$
Gauss and suggest they formed via an SF-driven outflow from the Galaxy’s central 200 pc (see also Crocker et al. Reference Crocker, Bicknell, Taylor and Carretti2015). In their review, Sarkar (Reference Sarkar2024, their Figure 13) compare simulation snapshots for four different formation scenarios, consisting of an SF-driven wind with SFR = 0.5 M
$\unicode{x03BC}$
Gauss and suggest they formed via an SF-driven outflow from the Galaxy’s central 200 pc (see also Crocker et al. Reference Crocker, Bicknell, Taylor and Carretti2015). In their review, Sarkar (Reference Sarkar2024, their Figure 13) compare simulation snapshots for four different formation scenarios, consisting of an SF-driven wind with SFR = 0.5 M $_{\odot}$
yr
$_{\odot}$
yr $^{-1}$
, an AGN burst, an AGN jet and a tilted AGN jet.
$^{-1}$
, an AGN burst, an AGN jet and a tilted AGN jet.
4.1.2. Statistics
The radio outflow from the disk of the nearby edge-on galaxy ESO 130-G012 was discovered during a visual search of the currently available EMU fields. At the time of writing, the southern sky coverage of EMU was $\sim$
50% complete. This visual search, conducted mainly by BSK for LSB structures such as odd radio circles (ORCs, Norris et al. Reference Norris2021b; Koribalski et al. Reference Koribalski2021), nearby galaxies (Norris et al. Reference Norris2021a) and radio shell systems (e.g. Koribalski et al. Reference Koribalski2024) as well cluster relics and halos so far resulted in only one large radio outflow. Such extraplanar radio emission would be recognisable for well-resolved galaxies oriented close to edge-on (
$\sim$
50% complete. This visual search, conducted mainly by BSK for LSB structures such as odd radio circles (ORCs, Norris et al. Reference Norris2021b; Koribalski et al. Reference Koribalski2021), nearby galaxies (Norris et al. Reference Norris2021a) and radio shell systems (e.g. Koribalski et al. Reference Koribalski2024) as well cluster relics and halos so far resulted in only one large radio outflow. Such extraplanar radio emission would be recognisable for well-resolved galaxies oriented close to edge-on ( $i \gt 70$ $^\circ$
), but the detection of bipolar radio bubbles in the nearly face-on spiral galaxy NGC 1371 shows that an edge-on orientation is not necessary. They are also expected to be gas-rich, likely catalogued in HIPASS (Koribalski et al. Reference Koribalski2004), as the gas is fueling the star formation.
$^\circ$
), but the detection of bipolar radio bubbles in the nearly face-on spiral galaxy NGC 1371 shows that an edge-on orientation is not necessary. They are also expected to be gas-rich, likely catalogued in HIPASS (Koribalski et al. Reference Koribalski2004), as the gas is fueling the star formation.
One nearby galaxy with a distinct radio halo detected in the EMU Pilot Survey (Norris et al. Reference Norris2021a) is NGC 7090 (HIPASS J2136–54). It is gas-rich (Koribalski et al. Reference Koribalski2004) and was previously studied by Heesen et al. (Reference Heesen, Dettmar, Krause, Beck and Stein2016). Another edge-on galaxy with extraplanar emission, detected in EMU, is NGC 5775 (HIPASS J1453+03), which was studied in detail by Heald et al. (Reference Heald2022). EMU will allow the study of several 100 nearby, edge-on spiral galaxies. For now, we conclude that the huge, bipolar radio bubbles detected in ESO 130-G012 are very rare, meaning less than one in a 100 edge-on spiral galaxies show such extended extraplanar structures.
In the sample of $\sim$
300 nearby, infrared-bright galaxies studied by Condon et al. (Reference Condon2021) with MeerKAT, only one galaxy (NGC 1532, see above) is noted as having a radio detected outflow.
$\sim$
300 nearby, infrared-bright galaxies studied by Condon et al. (Reference Condon2021) with MeerKAT, only one galaxy (NGC 1532, see above) is noted as having a radio detected outflow.
4.1.3. Comparison to PN formation
The hourglass-shaped outflow from the disk of ESO 130-G012 resembles that of some bipolar planetary nebulae (PNe). Examples include the ‘Southern Crab’ (Hen 2-104) and the ‘Butterfly Nebula’ (NGC 6302). Fast stellar wind from the primary star in a close binary system, whose expansion is funneled by a dense torus of gas, collide with slower winds and produce hourglass-shaped shells, aided by magnetic fields (Blackman, Frank, & Welch Reference Blackman, Frank and Welch2001). Such magneto-hydrodynamical (MHD) winds from the PNe disks or centre can power and shape their bipolar outflows. Magneto-centrifugally driven winds are likely to also play a rôle in galaxy outflows. Balick, Frank, & Liu (Reference Balick, Frank and Liu2019, Reference Balick2023) pose that the injected flows that create the hollow lobes of PNe must be light, ‘tapered’ and injected considerably faster than the lobe expansion speed. They also emphasise the role of toroidal magnetic fields. Light flows produce hollow lobes bordered by dense walls of displaced gas. Icke (Reference Icke2022) propose that the disk at the base of bipolar PNe is itself the source of the outflow.
4.2 Outflow energetics and timescales
The enthalpy content of the lobes is $\sim$
1–
$\sim$
1– $2 \times 10^{56}$
erg for outflow heights of 30–50 kpc (see Appendix). Star formation (SF) at the current rate of 0.1–0.6 M
$2 \times 10^{56}$
erg for outflow heights of 30–50 kpc (see Appendix). Star formation (SF) at the current rate of 0.1–0.6 M $_{\odot}$
yr
$_{\odot}$
yr $^{-1}$
can supply 10
$^{-1}$
can supply 10 $^{56}$
erg in
$^{56}$
erg in $3 \times 10^7$
yr, which is less than the dynamical time estimated as 30 kpc/
$3 \times 10^7$
yr, which is less than the dynamical time estimated as 30 kpc/ $c_\mathrm{s} \sim 3 \times 10^8$
yr. For comparison, 10
$c_\mathrm{s} \sim 3 \times 10^8$
yr. For comparison, 10 $^{56}$
erg is very similar to the Fermi Bubbles. Even if the structures expand somewhat supersonically and/or less than 100% of the disk supernova mechanical energy goes into inflating the bubbles, looks like disk SF at the current rate can do it reasonably easily (in
$^{56}$
erg is very similar to the Fermi Bubbles. Even if the structures expand somewhat supersonically and/or less than 100% of the disk supernova mechanical energy goes into inflating the bubbles, looks like disk SF at the current rate can do it reasonably easily (in $\sim$
30 Myr). Interestingly, CRs by themselves are, for fiducial numbers, inadequate (by
$\sim$
30 Myr). Interestingly, CRs by themselves are, for fiducial numbers, inadequate (by $\sim$
1/2) to power the inflation of the lobes at the sound speed (see our calculations in the Appendix).
$\sim$
1/2) to power the inflation of the lobes at the sound speed (see our calculations in the Appendix).
Could AGN jets have inflated the observed bipolar lobes of ESO 130-G012? While large double-lobed radio sources are typically hosted by elliptical galaxies, some do have spiral hosts (Mulcahy et al. Reference Mulcahy2016; Koribalski Reference Koribalski2025). A nearby example is the Circinus Galaxy, whose bipolar radio lobes originate from its central AGN (see Figures 7 and 8).
A $2 \times 10^7$
M
$2 \times 10^7$
M $_{\odot}$
black hole accreting at the typical rate of 0.1% of Eddington and with a jet production efficiency of 10% (Turner & Shabala Reference Turner and Shabala2015) will produce a
$_{\odot}$
black hole accreting at the typical rate of 0.1% of Eddington and with a jet production efficiency of 10% (Turner & Shabala Reference Turner and Shabala2015) will produce a $3 \times 10^{41}$
ergs s
$3 \times 10^{41}$
ergs s $^{-1}$
jet. Because AGN jets couple approximately half their energy to the ambient gas (Hardcastle & Krause Reference Hardcastle and Krause2013; Bourne & Sijacki Reference Bourne and Sijacki2021), over a lifetime of several Myr this provides sufficient energy to inflate the bubbles even in an environment an order of magnitude denser than that adopted in the Appendix. Further circumstantial evidence in favour of an AGN-driven mechanism is the observed ring of star formation in the galactic disk. Simulations by Dugan, Gaibler, & Silk (Reference Dugan, Gaibler and Silk2017) showed that strong backflow from jet termination shocks can compress gas in the galactic disk and trigger rings of star formation. AGN winds can inflate similar bubbles and also trigger star formation, however the jets are more efficient (by approximately an order of magnitude because of their mechanical advantage due to being energy-driven Dugan et al. Reference Dugan, Bryan, Gaibler, Silk and Haas2014, see also Cattaneo & Best Reference Cattaneo and Best2009). If the observed radio bubbles arise due to jet activity, faint parsec-scale structures consistent with low lobe luminosity would be expected in VLBI observations – assuming that no significant modulation in jet power has taken place since the bubble inflation phase.
$^{-1}$
jet. Because AGN jets couple approximately half their energy to the ambient gas (Hardcastle & Krause Reference Hardcastle and Krause2013; Bourne & Sijacki Reference Bourne and Sijacki2021), over a lifetime of several Myr this provides sufficient energy to inflate the bubbles even in an environment an order of magnitude denser than that adopted in the Appendix. Further circumstantial evidence in favour of an AGN-driven mechanism is the observed ring of star formation in the galactic disk. Simulations by Dugan, Gaibler, & Silk (Reference Dugan, Gaibler and Silk2017) showed that strong backflow from jet termination shocks can compress gas in the galactic disk and trigger rings of star formation. AGN winds can inflate similar bubbles and also trigger star formation, however the jets are more efficient (by approximately an order of magnitude because of their mechanical advantage due to being energy-driven Dugan et al. Reference Dugan, Bryan, Gaibler, Silk and Haas2014, see also Cattaneo & Best Reference Cattaneo and Best2009). If the observed radio bubbles arise due to jet activity, faint parsec-scale structures consistent with low lobe luminosity would be expected in VLBI observations – assuming that no significant modulation in jet power has taken place since the bubble inflation phase.
On the other hand, there are no indications of outflow from the galaxy core in ESO 130-G012, and the observed X-shaped wings forming the base of the bubbles are not seen in AGN-driven outflows. The observed limb brightening suggests that the outflow cones are hollow, possibly filled with hot X-ray gas. The high rotation of the disk may also play a role in terms of generating a dynamo and amplifying the magnetic field into the halo (Stein et al. Reference Stein2025), while the relatively low mass of ESO 130-G012 allows outflows to grow larger than in more massive galaxies.
5. Summary and conclusions
The edge-on spiral ESO 130-G012 is neither a starburst galaxy nor does it host a dominant AGN. Its disk SFR is mild, and a tentative X-ray detection suggests there may be a low-luminosity AGN. Overall, ESO 130-G012 seems like an unremarkable nearby galaxy located within a loose group, apart from the fact that it hosts one of the largest bipolar outflows known in the Local Universe. Our discovery of a radio continuum outflow reaching 30–50 kpc into the halo on each side of ESO 130-G012’s star-forming disk, which forms the base (waist) of the flow, raises a number of questions.
Sketches of the bipolar radio continuum outflows from three nearby galaxies, highlighting a possible evolutionary path. From left to right (young to old): Circinus, NGC 1371 and ESO 130-G012. The sketches are approximate and not to scale.

The shape of the detected bipolar bubbles hold clues as to their origin. Bright X-shaped radio spurs emerge from the boxy thick disk, similar to the polarised radio spurs seen in other galaxies with large outflows. Beyond these bright spurs or ‘butterfly’ wings, the radio emission decreases rapidly, with faint elongated bubbles just detectable on both sides of ESO 130-G012’s stellar disk. In the following, we summarise the galaxy’s key properties:
-
• The dynamical mass of ESO 130-G012, which we derive from its H I rotational velocity (
$v_\mathrm{rot}$
=
$188 \pm 6$
km s
$^{-1}$
), is M
$_\mathrm{dyn}$
= 5.3 (
$\pm$
0.5)
$\times\ 10^{10}$
M
$_{\odot}$
within
$R_\mathrm{HI}$
= 6.5 kpc. The galaxy’s H I mass is 5.3 (
$\pm$
0.8)
$\times 10^8$
M
$_{\odot}$
, i.e.
$\sim$
1% of M
$_\mathrm{dyn}$
, and its stellar mass is
$\sim$
1.1
$\times 10^{10}$
M
$_{\odot}$
, based on the extinction-corrected WISE W1 magnitude. -
• ESO 130-G012 is located in a loose group; the galaxy’s slightly asymmetric, global H I spectrum suggests it may have a dwarf companion and/or tidal tail.
-
• ESO 130-G012 has a low disk SFR of
$\sim$
0.1–0.6 M
$_{\odot}$
yr
$^{-1}$
. It has a radio core and probably hosts a weak AGN, based on the tentative X-ray detection, but no radio jets are seen. -
• ASKAP EMU 944 MHz radio continuum images of ESO 130-G012 reveal a large-scale hourglass-shaped outflow to a height of at least 30 kpc above and below the disk, possibly extending to
$\sim$
50 kpc. -
• The outflow initially rises vertically off the 10 kpc-diameter stellar disk, then broadens laterally while expanding upward (like a wine glass),
-
• Bright X-shaped radio wings, likely accompanied by magnetic fields, suggest that the wind is light and hollow,
-
• The outflow opening angle with respect to the vector orthogonal to the disk is
$\sim$
30
$^\circ$
on both sides, -
• ESO 130-G012’s outflow is likely driven by star formation, stellar winds and cosmic rays from the full width of its stellar disk, although we cannot exclude contributions from a more active black hole or central starburst in the past.
-
• A dynamo induced, poloidal magnetic field might explain the bubble shapes of the observed bipolar outflow.
-
• Our energetics calculations suggest that star formation from the disk of ESO 130-G012 sustained over 30 Myr can inflate the observed bubbles/lobes. Not yet explained here is the rarity of such large-scale outflows in the Local Universe.
-
• Our discovery of a large-scale radio continuum outflow from the disk of ESO 130-G012 makes it a promising target to further explore its disk-halo interface and model the outflow formation. This requires a big observing and modeling campaign (see below), which is now under way. Results from this campaign will be presented in follow-up papers.


6. Outlook
Interferometric H I data as well as wide-band radio continuum and polarisation data of ESO 130-G012 are needed to further examine the observed large-scale radio outflow and its origin. These can be obtained with both the ATCA, which is currently transitioning from CABB (Wilson et al. Reference Wilson2011) to an even more versatile correlator (BIGCAT), in L-band (1–3 GHz) and CX-band (4–12 GHz), and MeerKAT extending to lower frequencies. Wide-band radio continuum data are essential to study the magnetic field and spectral index of the galaxy and its bipolar outflow. Particularly, deep ATCA 4-cm (CX-band) data would allow to map the magnetic field in disk of ESO 130-G012 and its X-shaped winds as the $\lambda^2$
-dependent depolarisation is much reduced. ATCA H I maps would provide insights into the galaxy kinematics and any peculiar motions (e.g. halo gas), uncover nearby dwarf companions and tidal interactions.
$\lambda^2$
-dependent depolarisation is much reduced. ATCA H I maps would provide insights into the galaxy kinematics and any peculiar motions (e.g. halo gas), uncover nearby dwarf companions and tidal interactions.
A spatially resolved spectral index map of the outflow bubbles might not only constrain the time of the outburst event, but also indicate whether the underlying electron population was injected either by supernovae or an AGN. Some blazars display very flat spectra with spectral indices lower than the limit achievable through shock acceleration of $\alpha = 0.5$
, which would rule out CR injection through supernovae. Apart from the spectral properties, multi-frequency radio observations would also constrain the local properties of the CGM by analyzing the rotation measure and fractional polarisation across the outflow.
$\alpha = 0.5$
, which would rule out CR injection through supernovae. Apart from the spectral properties, multi-frequency radio observations would also constrain the local properties of the CGM by analyzing the rotation measure and fractional polarisation across the outflow.
MUSE H $\alpha$
mosaics of ESO 130-G012, particularly its thick disk and X-shaped wings would deliver outflow velocities and ionisation properties, while deep X-ray observations would likely show the hot gas inside the outflow cones. An analysis of the stellar population of ESO 130-G012 would provide insights into its star formation history, including possible starbursts in its past.
$\alpha$
mosaics of ESO 130-G012, particularly its thick disk and X-shaped wings would deliver outflow velocities and ionisation properties, while deep X-ray observations would likely show the hot gas inside the outflow cones. An analysis of the stellar population of ESO 130-G012 would provide insights into its star formation history, including possible starbursts in its past.
And finally, Chandra maps would reveal the extent of the X-ray emission and allow us to distinguish high and low mass X-ray binaries from an AGN.
Acknowledgements
We are grateful to the expert reviewer for constructive feedback that helped to improve the paper. We thank Michelle Cluver, Ivy Wong, Ettore Carretti, and Andrew Hopkins for their comments and insightful questions. RMC acknowledges support from the Australian Research Council through the Discovery Projects scheme, award DP 230101055, shared with Prof. Mark Krumholz. RJD acknowledges support by the Deutsche Forschungsgemeinschaft through grant CRC 1491 and the CSIRO ATNF visitors program. The Australian SKA Pathfinder is part of the Australia Telescope National Facility (ATNF), which is managed by CSIRO. Operation of ASKAP is funded by the Australian Government with support from the National Collaborative Research Infrastructure Strategy. ASKAP uses the resources of the Pawsey Supercomputing Centre. Establishment of ASKAP, the Murchison Radio-astronomy Observatory (MRO) and the Pawsey Supercomputing Centre are initiatives of the Australian Government, with support from the Government of Western Australia and the Science and Industry Endowment Fund. This paper includes archived data obtained through the CSIRO ASKAP Science Data Archive (CASDA). We acknowledge the Wajarri Yamatji as the traditional owners of the Observatory site.
Data availability statement
The ASKAP data used in this article are available through CASDA. Image processing and analysis was conducted with the miriad softwareFootnote d and the Karma visualisationFootnote e packages.
Appendix: Lobe enthalpy, expansion time, and energetics
The enthalpy of a bubble or lobe slowly inflated to volume $V_\mathrm{lobe}$
in pressure equilibrium with its surroundings is A
$V_\mathrm{lobe}$
in pressure equilibrium with its surroundings is A
 \begin{equation}H = \frac{\gamma}{\gamma - 1}\ P_\mathrm{ext}\ V_\mathrm{lobe},\end{equation}
where $\gamma$
is the adiabatic index of the plasma inside the lobe and
$\gamma$
is the adiabatic index of the plasma inside the lobe and $P_\mathrm{ext}$
is the external pressure. For a non-relativistic (NR) monoatomic gas,
$P_\mathrm{ext}$
is the external pressure. For a non-relativistic (NR) monoatomic gas, $\gamma = 5/3$
, so
$\gamma = 5/3$
, so $H_\mathrm{NR} = 5/2 P_\mathrm{ext} V_\mathrm{lobe}$
, while a relativistic (rel) plasma (e.g. a cosmic-ray pair plasma) has
$H_\mathrm{NR} = 5/2 P_\mathrm{ext} V_\mathrm{lobe}$
, while a relativistic (rel) plasma (e.g. a cosmic-ray pair plasma) has $\gamma = 4/3$
, so
$\gamma = 4/3$
, so $H_\mathrm{rel} = 1.6 \times H_\mathrm{ NR}$
. The total enthalpy content of both lobes is then
$H_\mathrm{rel} = 1.6 \times H_\mathrm{ NR}$
. The total enthalpy content of both lobes is then $H_\mathrm{tot,NR} = 2 \times H_\mathrm{NR}$
and
$H_\mathrm{tot,NR} = 2 \times H_\mathrm{NR}$
and $H_\mathrm{tot,rel} = 3.2 \times H_\mathrm{NR}$
.
$H_\mathrm{tot,rel} = 3.2 \times H_\mathrm{NR}$
.
Approximating each lobe of ESO 130-G012’s outflow as a triaxial ellipsoid with axes $a = 50$
kpc and
$a = 50$
kpc and $b = c = 30$
kpc (see Figure 3), gives
$b = c = 30$
kpc (see Figure 3), gives $V_\mathrm{lobe} = \frac{\pi}{6} \ a \ b \ c \simeq 6.9 \times 10^{68}$
cm
$V_\mathrm{lobe} = \frac{\pi}{6} \ a \ b \ c \simeq 6.9 \times 10^{68}$
cm $^3$
.
$^3$
.
Calculations for different galaxy outflow heights assuming $T_\mathrm{vir} = 1.3 \times 10^6$
K and
$T_\mathrm{vir} = 1.3 \times 10^6$
K and $c_\mathrm{s}$
= 170 km s
$c_\mathrm{s}$
= 170 km s $^{-1}$
.
$^{-1}$
.

Next, we estimate the external pressure, $P_\mathrm{ext}(h)$
, at height h, by the halo of ESO 130-G012. For a fully ionised gas, the total particle number density is
$P_\mathrm{ext}(h)$
, at height h, by the halo of ESO 130-G012. For a fully ionised gas, the total particle number density is $n_\mathrm{tot} \simeq 2n_e$
and
$n_\mathrm{tot} \simeq 2n_e$
and
 \begin{equation} P_\mathrm{ext}(h) \simeq 2n_e(h)\ k_\mathrm{B}\ T_\mathrm{vir},\end{equation}
where $k_\mathrm{B}$
is the Boltzmann constant and
$k_\mathrm{B}$
is the Boltzmann constant and $T_\mathrm{vir}$
the virial temperature. For an isothermal halo with
$T_\mathrm{vir}$
the virial temperature. For an isothermal halo with $v_\mathrm{rot}$
= 188 km s
$v_\mathrm{rot}$
= 188 km s $^{-1}$
, we get:
$^{-1}$
, we get:
 \begin{equation}T_\mathrm{vir} \simeq \frac{\mu m_\mathrm{p} v_\mathrm{rot}^2}{2k_\mathrm{B}} \simeq 1.3 \times 10^6 \ \textrm{K},\end{equation}
with $\mu \simeq 0.59$
the mean molecular weight and
$\mu \simeq 0.59$
the mean molecular weight and $m_\mathrm{p}$
the proton mass. This implies an adiabatic sound speed in the halo gas of
$m_\mathrm{p}$
the proton mass. This implies an adiabatic sound speed in the halo gas of
 \begin{equation}c_\mathrm{s} = \sqrt{\frac{\gamma k_\mathrm{B} T_\mathrm{vir}}{\mu m_\mathrm{p}}} \simeq 170\ \mathrm{km\,s^{-1}} \left(\frac{T_\mathrm{vir}}{1.3\times10^6\ \textrm{K}}\right)^{1/2}\end{equation}
and an expansion time for each lobe of $t_\mathrm{exp,s} \simeq a / c_\mathrm{s}$
. For lobe heights of a = 15, 30 and 50 kpc, we get
$t_\mathrm{exp,s} \simeq a / c_\mathrm{s}$
. For lobe heights of a = 15, 30 and 50 kpc, we get $t_\mathrm{exp,s} \simeq 0.9$
, 1.7, and
$t_\mathrm{exp,s} \simeq 0.9$
, 1.7, and $2.8 \times 10^8$
yr.
$2.8 \times 10^8$
yr.
For the enthalpy calculation, we also need an estimate of the halo gas density. We adopt a representative electron density of $n_{e,50} = 1.5 \times 10^{-4}\ \mathrm{cm^{-3}}$
at a halo height of
$n_{e,50} = 1.5 \times 10^{-4}\ \mathrm{cm^{-3}}$
at a halo height of $h = 50$
kpc, and assume a power-law density profile
$h = 50$
kpc, and assume a power-law density profile
 \begin{equation}n_e(h) = n_{e,50} \left(\frac{h}{50\ \textrm{kpc}}\right)^{-3/2},\end{equation}
i.e. $n_e \simeq 9.1$
and
$n_e \simeq 9.1$
and $3.2 \times 10^{-4}\ \mathrm{cm^{-3}}$
for lower heights of h = 15 and 30 kpc, respectively. Given the density model and taking
$3.2 \times 10^{-4}\ \mathrm{cm^{-3}}$
for lower heights of h = 15 and 30 kpc, respectively. Given the density model and taking $T_\mathrm{vir} \simeq 1.3\times10^6\ \textrm{K}$
(see Equation 3), we then get
$T_\mathrm{vir} \simeq 1.3\times10^6\ \textrm{K}$
(see Equation 3), we then get $P_\mathrm{ext} \simeq 3.3$
, 1.1 and
$P_\mathrm{ext} \simeq 3.3$
, 1.1 and $0.5 \times 10^{-13}\ \mathrm{erg\,cm^{-3}}$
for h = 15, 30 and 50 kpc. For future use (see Figure A2), let us declare here a characteristic equipartition magnetic field amplitude at height h in kpc:
$0.5 \times 10^{-13}\ \mathrm{erg\,cm^{-3}}$
for h = 15, 30 and 50 kpc. For future use (see Figure A2), let us declare here a characteristic equipartition magnetic field amplitude at height h in kpc:
 \begin{equation}\frac{B^2_\mathrm{eq,h}}{8 \pi} \equiv P_\mathrm{ext}(\rm h).\end{equation}
In particular, we find $B_\mathrm{eq,30} = 1.7\unicode{x03BC}$
G and
$B_\mathrm{eq,30} = 1.7\unicode{x03BC}$
G and $B_\mathrm{eq,50} = 1.1\unicode{x03BC}$
G given our temperature estimate and density model.
$B_\mathrm{eq,50} = 1.1\unicode{x03BC}$
G given our temperature estimate and density model.
Substituting $P_\mathrm{ext} = 0.5 \times 10^{-13}$
erg cm
$P_\mathrm{ext} = 0.5 \times 10^{-13}$
erg cm $^{-3}$
and
$^{-3}$
and $V_\mathrm{lobe} = 6.9 \times 10^{68}$
cm
$V_\mathrm{lobe} = 6.9 \times 10^{68}$
cm $^{3}$
we get
$^{3}$
we get $H_\mathrm{tot,NR} \simeq 2.0 \times 10^{56}$
erg to reach an outflow height of 50 kpc (see also Heesen et al. Reference Heesen2024, their Section 4.2). This is a lower limit to the total energetics: it neglects the fact that the bubbles have expanded through denser gas at lower galactic elevations; that there may still be significant kinetic energy in the outflowing material (in the case of supersonic expansion, in particular), radiative losses from shocked matter (again, in the case of supersonic expansion); that work has been done against the gravitational potential in lifting the material of the bubbles; and it does not count the energy in their magnetic field or cosmic ray content. See Table A1 for a summary of the adopted and derived values.
$H_\mathrm{tot,NR} \simeq 2.0 \times 10^{56}$
erg to reach an outflow height of 50 kpc (see also Heesen et al. Reference Heesen2024, their Section 4.2). This is a lower limit to the total energetics: it neglects the fact that the bubbles have expanded through denser gas at lower galactic elevations; that there may still be significant kinetic energy in the outflowing material (in the case of supersonic expansion, in particular), radiative losses from shocked matter (again, in the case of supersonic expansion); that work has been done against the gravitational potential in lifting the material of the bubbles; and it does not count the energy in their magnetic field or cosmic ray content. See Table A1 for a summary of the adopted and derived values.
We now study the source of energy that drives the expansion of the gaseous lobes (SF) and the amount of stellar mass formed during expansion. The total energy implied by the above estimates is supplied over some inflation timescale $t_\mathrm{infl}$
by some astrophysical processes that liberate a mechanical power,
$t_\mathrm{infl}$
by some astrophysical processes that liberate a mechanical power, $\dot{E}_\mathrm{mech}$
, occurring in the disk of ESO 130-G012:
$\dot{E}_\mathrm{mech}$
, occurring in the disk of ESO 130-G012: $H_\mathrm{tot} = \dot{E}_\mathrm{mech} \ t_\mathrm{infl}$
. First, as a rough lower bound on the power requirements, we assume that the lobes expand at the sound speed. For outflow heights of 30 kpc and 50 kpc this requires
$H_\mathrm{tot} = \dot{E}_\mathrm{mech} \ t_\mathrm{infl}$
. First, as a rough lower bound on the power requirements, we assume that the lobes expand at the sound speed. For outflow heights of 30 kpc and 50 kpc this requires $\dot{E}_\mathrm{mech,s} \sim H_\mathrm{tot} / t_\mathrm{exp,s}$
=
$\dot{E}_\mathrm{mech,s} \sim H_\mathrm{tot} / t_\mathrm{exp,s}$
= $2.1 \times 10^{40}$
and
$2.1 \times 10^{40}$
and $2.3 \times 10^{40}$
erg s
$2.3 \times 10^{40}$
erg s $^{-1}$
, respectively.
$^{-1}$
, respectively.
SF energy from ESO 130-G012
We compare the above energy requirements to the mechanical power available from star formation, $\dot{E}_\mathrm{SF}$
, at the current rate of SFR
$\dot{E}_\mathrm{SF}$
, at the current rate of SFR $\sim$
0.1–0.6 M
$\sim$
0.1–0.6 M $_{\odot}$
yr
$_{\odot}$
yr $^{-1}$
, with
$^{-1}$
, with $10^{51}$
erg of kinetic energy injected into the ISM per core collapse supernova and around 100 M
$10^{51}$
erg of kinetic energy injected into the ISM per core collapse supernova and around 100 M $_{\odot}$
of total stellar mass formed to generate a single supernova (e.g. Roth et al. Reference Roth, Krumholz, Crocker and Celli2021):
$_{\odot}$
of total stellar mass formed to generate a single supernova (e.g. Roth et al. Reference Roth, Krumholz, Crocker and Celli2021):
 \begin{eqnarray} \dot{E}_\mathrm{SF} \simeq (0.3 - 1.9) \times 10^{41} \ \mathrm{erg \ s^{-1}}.\end{eqnarray}
This implies that star formation at the current rate can inflate the lobes provided they do not inflate a lot faster than the halo sound speed. Saying this differently, star formation can inflate the lobes at an average speed with a Mach number up to $\mathcal{M} \sim$
few. A total stellar mass of
$\mathcal{M} \sim$
few. A total stellar mass of $\sim$
2.8
$\sim$
2.8 $\times 10^8 \ \textrm{yr} \ \times \ (0.1-0.6) \ \rm M_\odot \ \mathrm{yr^{-1}} \simeq (0.3-2) \times 10^8$
M
$\times 10^8 \ \textrm{yr} \ \times \ (0.1-0.6) \ \rm M_\odot \ \mathrm{yr^{-1}} \simeq (0.3-2) \times 10^8$
M $_{\odot}$
would form over the lobes’ inflation. Even at the upper end, this is less than the current H I mass in the galaxy. This scenario requires that star formation be sustained over a timescale considerably smaller than the depletion timescale (see Table 1).
$_{\odot}$
would form over the lobes’ inflation. Even at the upper end, this is less than the current H I mass in the galaxy. This scenario requires that star formation be sustained over a timescale considerably smaller than the depletion timescale (see Table 1).
Interestingly, for fiducial numbers – in particular, adopting that around 10% of the mechanical energy liberated by star formation is processed into CRs via ISM shocks at accompanying supernova remnants (e.g. Roth et al. Reference Roth, Krumholz, Crocker and Celli2021, and references therein) – we see that CRs accompanying star formation do not seem quite adequate by themselves to inflate the lobes:
 \begin{eqnarray} \dot{E}_\mathrm{CR, SF} \simeq 0.1 \ \dot{E}_\mathrm{SF} \simeq (0.3 - 1.9) \times 10^{40} \ \mathrm{erg \ s^{-1}}.\end{eqnarray}
Cosmic ray electron constraints
The characteristic energy of cosmic ray electrons synchrotron emitting at 944 MHz in a magnetic field amplitude of $B_{\mu} \equiv B/(\mu G)$
is:
$B_{\mu} \equiv B/(\mu G)$
is:
 \begin{equation} E_{944} \simeq 9.4 \ \textrm{GeV} \ B_{\mu}^{-1/2}\end{equation}
The cooling time of electrons with this characteristic energy is shown in Figure A1 for three different number densities $n_\mathrm{H}$
. Here we account for ionisation, bremsstrahlung, synchrotron, and inverse Compton (IC) losses; IC losses are assumed to occur on the cosmic microwave background (CMB). Bremsstrahlung and ionisation losses are highly subdominant at
$n_\mathrm{H}$
. Here we account for ionisation, bremsstrahlung, synchrotron, and inverse Compton (IC) losses; IC losses are assumed to occur on the cosmic microwave background (CMB). Bremsstrahlung and ionisation losses are highly subdominant at $E_{944}$
for number densities typical of the halo gas. Note that there is a definite maximum lifetime for
$E_{944}$
for number densities typical of the halo gas. Note that there is a definite maximum lifetime for $B \sim 2\,\unicode{x03BC}$
G which is less than half the expansion timescale of each lobe at the sound speed. CR electrons, injected in the plane of the galaxy, can move a certain distance given this timescale and depending on the transport mechanism. In the limit that CR electrons are ‘frozen-in’ and do not move appreciably with respect to the thermal plasma, the fact that we detect synchrotron emission up to the full
$B \sim 2\,\unicode{x03BC}$
G which is less than half the expansion timescale of each lobe at the sound speed. CR electrons, injected in the plane of the galaxy, can move a certain distance given this timescale and depending on the transport mechanism. In the limit that CR electrons are ‘frozen-in’ and do not move appreciably with respect to the thermal plasma, the fact that we detect synchrotron emission up to the full $\sim$
50 kpc extent of the lobes would then imply that either the lobes are expanding at
$\sim$
50 kpc extent of the lobes would then imply that either the lobes are expanding at $\gtrsim$
2
$\gtrsim$
2 $ c_\mathrm{s}$
(so there should be shocks at the edges of the lobes, albeit not necessarily strong ones) or there are mechanisms injecting (e.g. via hadronic collisions
$ c_\mathrm{s}$
(so there should be shocks at the edges of the lobes, albeit not necessarily strong ones) or there are mechanisms injecting (e.g. via hadronic collisions $pp \to X \ e^\pm$
; Crocker et al. Reference Crocker, Bicknell, Taylor and Carretti2015) or re-accelerating CRs close to the lobe edges (e.g. Mertsch & Petrosian Reference Mertsch and Petrosian2019).
$pp \to X \ e^\pm$
; Crocker et al. Reference Crocker, Bicknell, Taylor and Carretti2015) or re-accelerating CRs close to the lobe edges (e.g. Mertsch & Petrosian Reference Mertsch and Petrosian2019).
The cooling time for electrons with energy $E_\mathrm{944}$
as a function of magnetic field amplitude. The vertical grey lines denote the magnetic field amplitudes that would be in approximate equipartition at 30 and 50 kpc, respectively, with
$E_\mathrm{944}$
as a function of magnetic field amplitude. The vertical grey lines denote the magnetic field amplitudes that would be in approximate equipartition at 30 and 50 kpc, respectively, with $P_\mathrm{ext}$
given our density and temperature assumptions. Note that the equipartition field amplitudes are close to the magnetic field that maximises the lifetime of CR electrons synchrotron radiating at 944 MHz.
$P_\mathrm{ext}$
given our density and temperature assumptions. Note that the equipartition field amplitudes are close to the magnetic field that maximises the lifetime of CR electrons synchrotron radiating at 944 MHz.

However, this ‘frozen-in’ limiting behaviour is unlikely to be realised in practice: even in the event that the lobe edges are expanding at the sound speed or slower, there may be faster internal flows of the plasma filling the lobes capable of advecting the cosmic rays and, even in the absence of such coherent internal flows, the CRs can be expected to move with respect to the plasma due to some combination of streaming and/or diffusion.
(1) If CR electrons of $E_{944}$
stream at speed
$E_{944}$
stream at speed $v_s$
along combed magnetic field lines at a speed equal to the Alfvén speed,
$v_s$
along combed magnetic field lines at a speed equal to the Alfvén speed, $v_\mathrm{s} \to v_\mathrm{A} (B_\mu, n_H)$
, they can reach a distance,
$v_\mathrm{s} \to v_\mathrm{A} (B_\mu, n_H)$
, they can reach a distance, $l_\mathrm{str}$
, shown by the curves in Figure A2 with
$l_\mathrm{str}$
, shown by the curves in Figure A2 with
 \begin{equation} l_\mathrm{str} = v_A(B,n_H)\ t_\mathrm{cool}(E_{944});\end{equation}
were streaming at the Alfvén speed the only important transport process and, in addition, were there no process of in situ CR injection or re-acceleration, then we would have the following constraints on the conditions (cf. Figure A1): $B \gtrsim 0.5\,\unicode{x03BC}$
G and
$B \gtrsim 0.5\,\unicode{x03BC}$
G and $n_H \lesssim 10^{-4}$
cm
$n_H \lesssim 10^{-4}$
cm $^{-3}$
. These putative constraints are not, in fact, unreasonable; the lower limit on the magnetic field is close to
$^{-3}$
. These putative constraints are not, in fact, unreasonable; the lower limit on the magnetic field is close to $B_\mathrm{ eq,50}$
and the density constraint is also not unreasonable if the lobes are filled by supernova heated gas: given a total mass of stars formed over the inflation of the lobes
$B_\mathrm{ eq,50}$
and the density constraint is also not unreasonable if the lobes are filled by supernova heated gas: given a total mass of stars formed over the inflation of the lobes $(0.3-2) \times 10^8$
M
$(0.3-2) \times 10^8$
M $_{\odot}$
, were a similar total mass of hot gas lofted into the lobes (e.g. Crocker Reference Crocker2012), this would correspond to
$_{\odot}$
, were a similar total mass of hot gas lofted into the lobes (e.g. Crocker Reference Crocker2012), this would correspond to $n_H$
in the range
$n_H$
in the range $(0.3-2)\times 10^8 \ {\rm M}_\odot/(2 \times 6.9 \times 10^{68} \ \mathrm{cm}^3 \ m_p) \sim (0.3-2) \times 10^{-4}$
cm
$(0.3-2)\times 10^8 \ {\rm M}_\odot/(2 \times 6.9 \times 10^{68} \ \mathrm{cm}^3 \ m_p) \sim (0.3-2) \times 10^{-4}$
cm $^{-3}$
.
$^{-3}$
.
However, these constraints are necessarily relaxed under many plausible circumstances: (i) in the halo gas, Alfvén wave damping processes may mean that $v_s \gg v_A$
(e.g. Wiener, Oh, & Guo Reference Wiener, Oh and Guo2013); (ii) there may be a non-negligible contribution of advective motion due to plasma bulk motion that adds to the electrons’ effective velocity with respect to ESO 130-G012 (such bulk motion could be either coherent internal plasma flows within the lobes’ slowly expanding edges – necessitating back flows and/or gas pile-up inside the lobe edges – or simply the overall expansion of the lobes); and (iii) there may be in situ re-acceleration processes, as already mentioned.
$v_s \gg v_A$
(e.g. Wiener, Oh, & Guo Reference Wiener, Oh and Guo2013); (ii) there may be a non-negligible contribution of advective motion due to plasma bulk motion that adds to the electrons’ effective velocity with respect to ESO 130-G012 (such bulk motion could be either coherent internal plasma flows within the lobes’ slowly expanding edges – necessitating back flows and/or gas pile-up inside the lobe edges – or simply the overall expansion of the lobes); and (iii) there may be in situ re-acceleration processes, as already mentioned.
The maximum streaming distance for electrons with energy $E_\mathrm{944}$
with a streaming speed equal to the Alfvén speed for the given magnetic field and the nominated proton number density cooling time for electrons with
$E_\mathrm{944}$
with a streaming speed equal to the Alfvén speed for the given magnetic field and the nominated proton number density cooling time for electrons with $E_\mathrm{944}$
as a function of magnetic field amplitude. The horizontal line corresponds to the full 50 kpc height of each lobe and the vertical grey lines denote the magnetic field amplitudes that would be in approximate equipartition with
$E_\mathrm{944}$
as a function of magnetic field amplitude. The horizontal line corresponds to the full 50 kpc height of each lobe and the vertical grey lines denote the magnetic field amplitudes that would be in approximate equipartition with $P_\mathrm{ext}$
given our density and temperature assumptions.
$P_\mathrm{ext}$
given our density and temperature assumptions.

The maximum diffusion distance for electrons with $E_\mathrm{944}$
with a diffusion coefficient given by Equation (A11) and a cooling time as shown in Figure A1. The different colours are for different values of
$E_\mathrm{944}$
with a diffusion coefficient given by Equation (A11) and a cooling time as shown in Figure A1. The different colours are for different values of $\chi$
as denoted in the legend. The horizontal line corresponds to the full 50 kpc height of each lobe and the vertical grey lines denote the magnetic field amplitudes that would be in approximate equipartition with
$\chi$
as denoted in the legend. The horizontal line corresponds to the full 50 kpc height of each lobe and the vertical grey lines denote the magnetic field amplitudes that would be in approximate equipartition with $P_\mathrm{ext}$
given our density and temperature assumptions.
$P_\mathrm{ext}$
given our density and temperature assumptions.

(2) CR electrons of energy $E_e$
which diffuse with some diffusion coefficient parametrised, following Gabici & Aharonian (Reference Gabici and Aharonian2007), as
$E_e$
which diffuse with some diffusion coefficient parametrised, following Gabici & Aharonian (Reference Gabici and Aharonian2007), as
 \begin{equation}\kappa(E_e,B) = 5.2 \times 10^{27} \ \chi \ \mathrm{cm^2 s^{-1}} \left(\frac{E_e}{\mathrm{GeV}} \right)^{1/2} \left(\frac{B}{ \mu \textrm{G}} \right)^{-1/2}\end{equation}
(where the case $\chi = 1$
approximately reproduces the diffusion coefficient inferred for CRs in the nearby plane of the Milky Way), would reach a maximum distance given approximately by
$\chi = 1$
approximately reproduces the diffusion coefficient inferred for CRs in the nearby plane of the Milky Way), would reach a maximum distance given approximately by
 \begin{equation} l_\mathrm{diff}(E_e,B) \simeq \left(2 \kappa(E_e,B)\ t_\mathrm{cool}( E_e) \right)^{1/2};\end{equation}
we show $l_\mathrm{diff}(E_e,B)$
for the case
$l_\mathrm{diff}(E_e,B)$
for the case $E_e = E_\mathrm{944}$
in Figure A3 where the different colours correspond to
$E_e = E_\mathrm{944}$
in Figure A3 where the different colours correspond to $\chi \in \{1,10,100\}$
. Purely diffusive transport would evidently constrain the lobe fields to be weak and the effective diffusion coefficient to be
$\chi \in \{1,10,100\}$
. Purely diffusive transport would evidently constrain the lobe fields to be weak and the effective diffusion coefficient to be $\gtrsim$
100 the in-plane Milky Way value at
$\gtrsim$
100 the in-plane Milky Way value at $\sim$
GeV energies; such a high diffusion coefficient need not be unreasonable (e.g. Butsky et al. Reference Butsky2023) but, as for the streaming case, there are many plausible ways to relax these constraints.
$\sim$
GeV energies; such a high diffusion coefficient need not be unreasonable (e.g. Butsky et al. Reference Butsky2023) but, as for the streaming case, there are many plausible ways to relax these constraints.
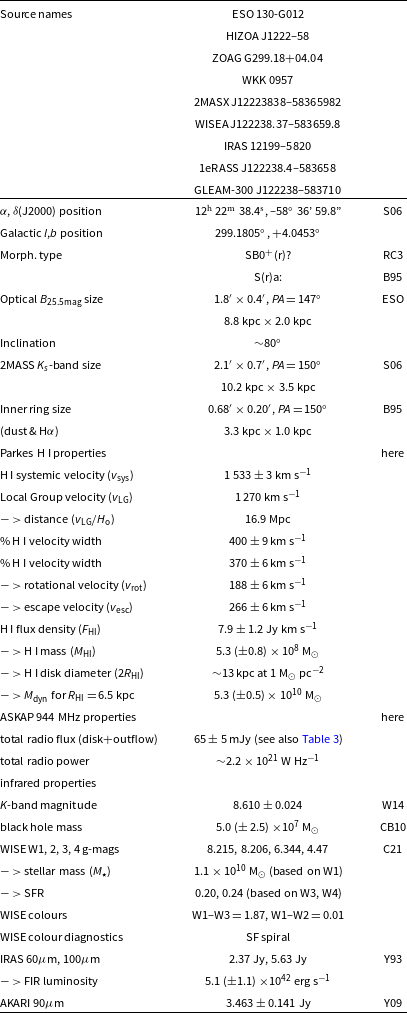

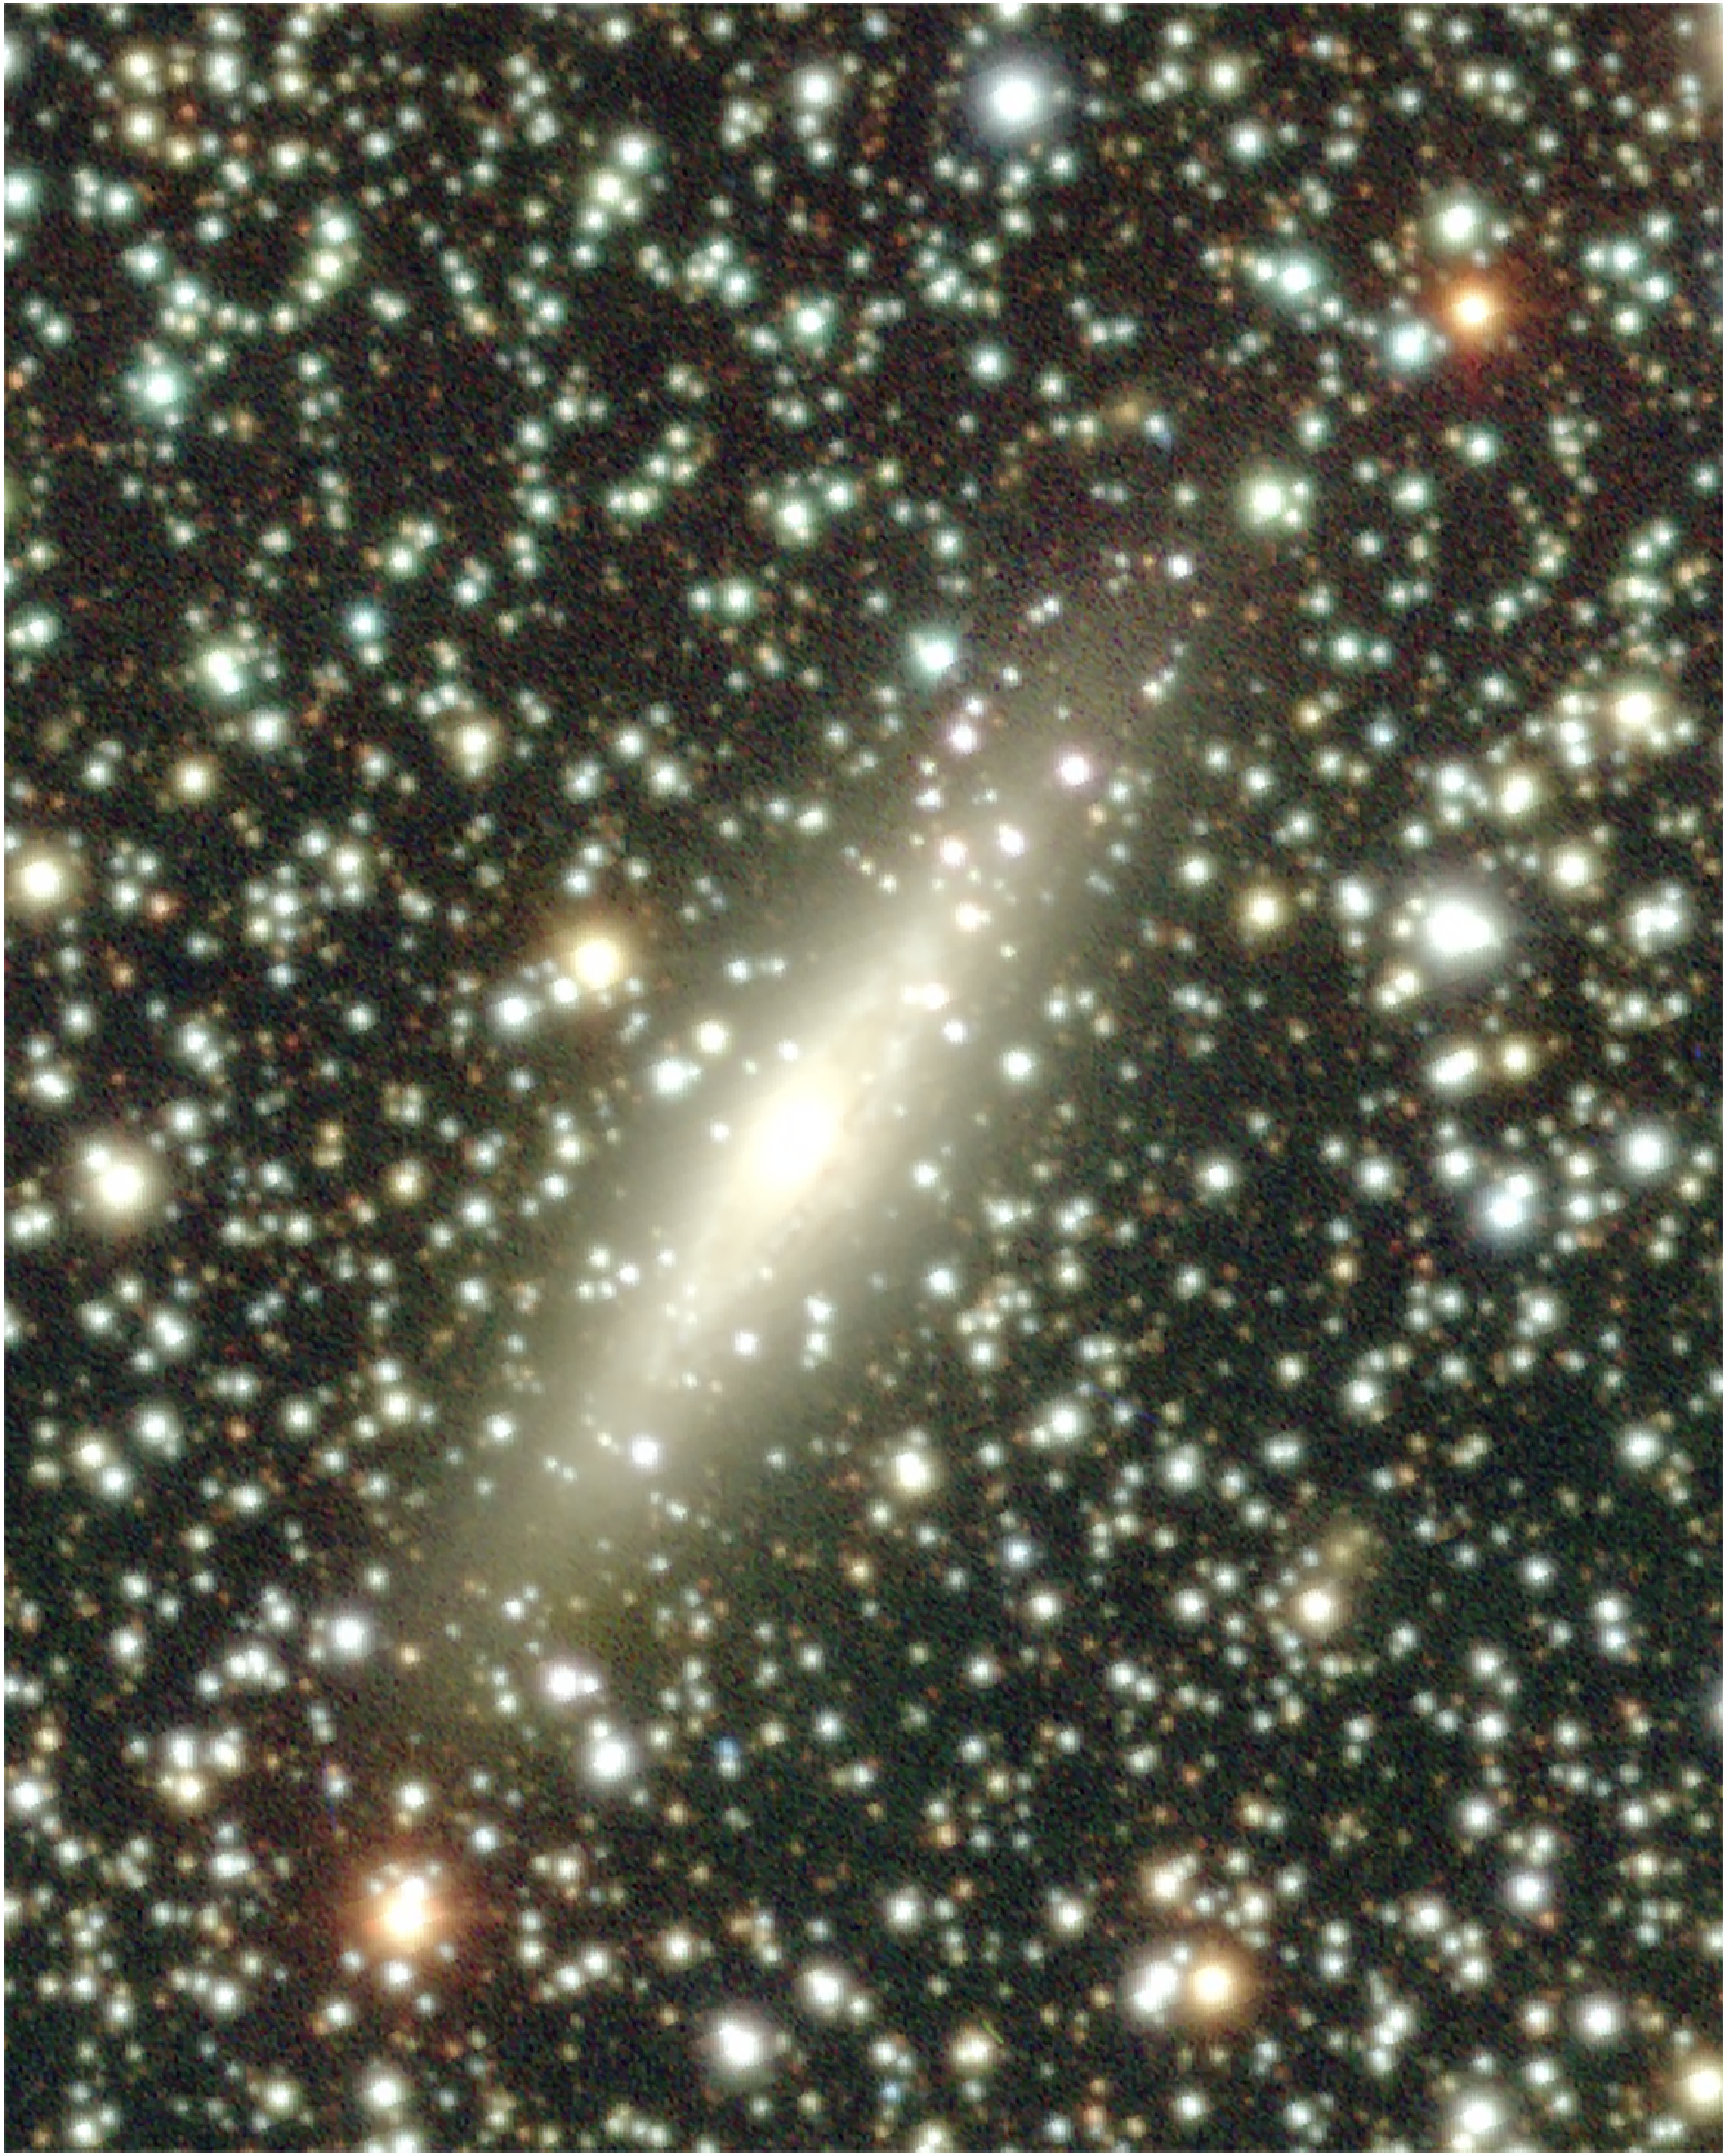


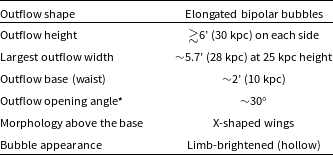

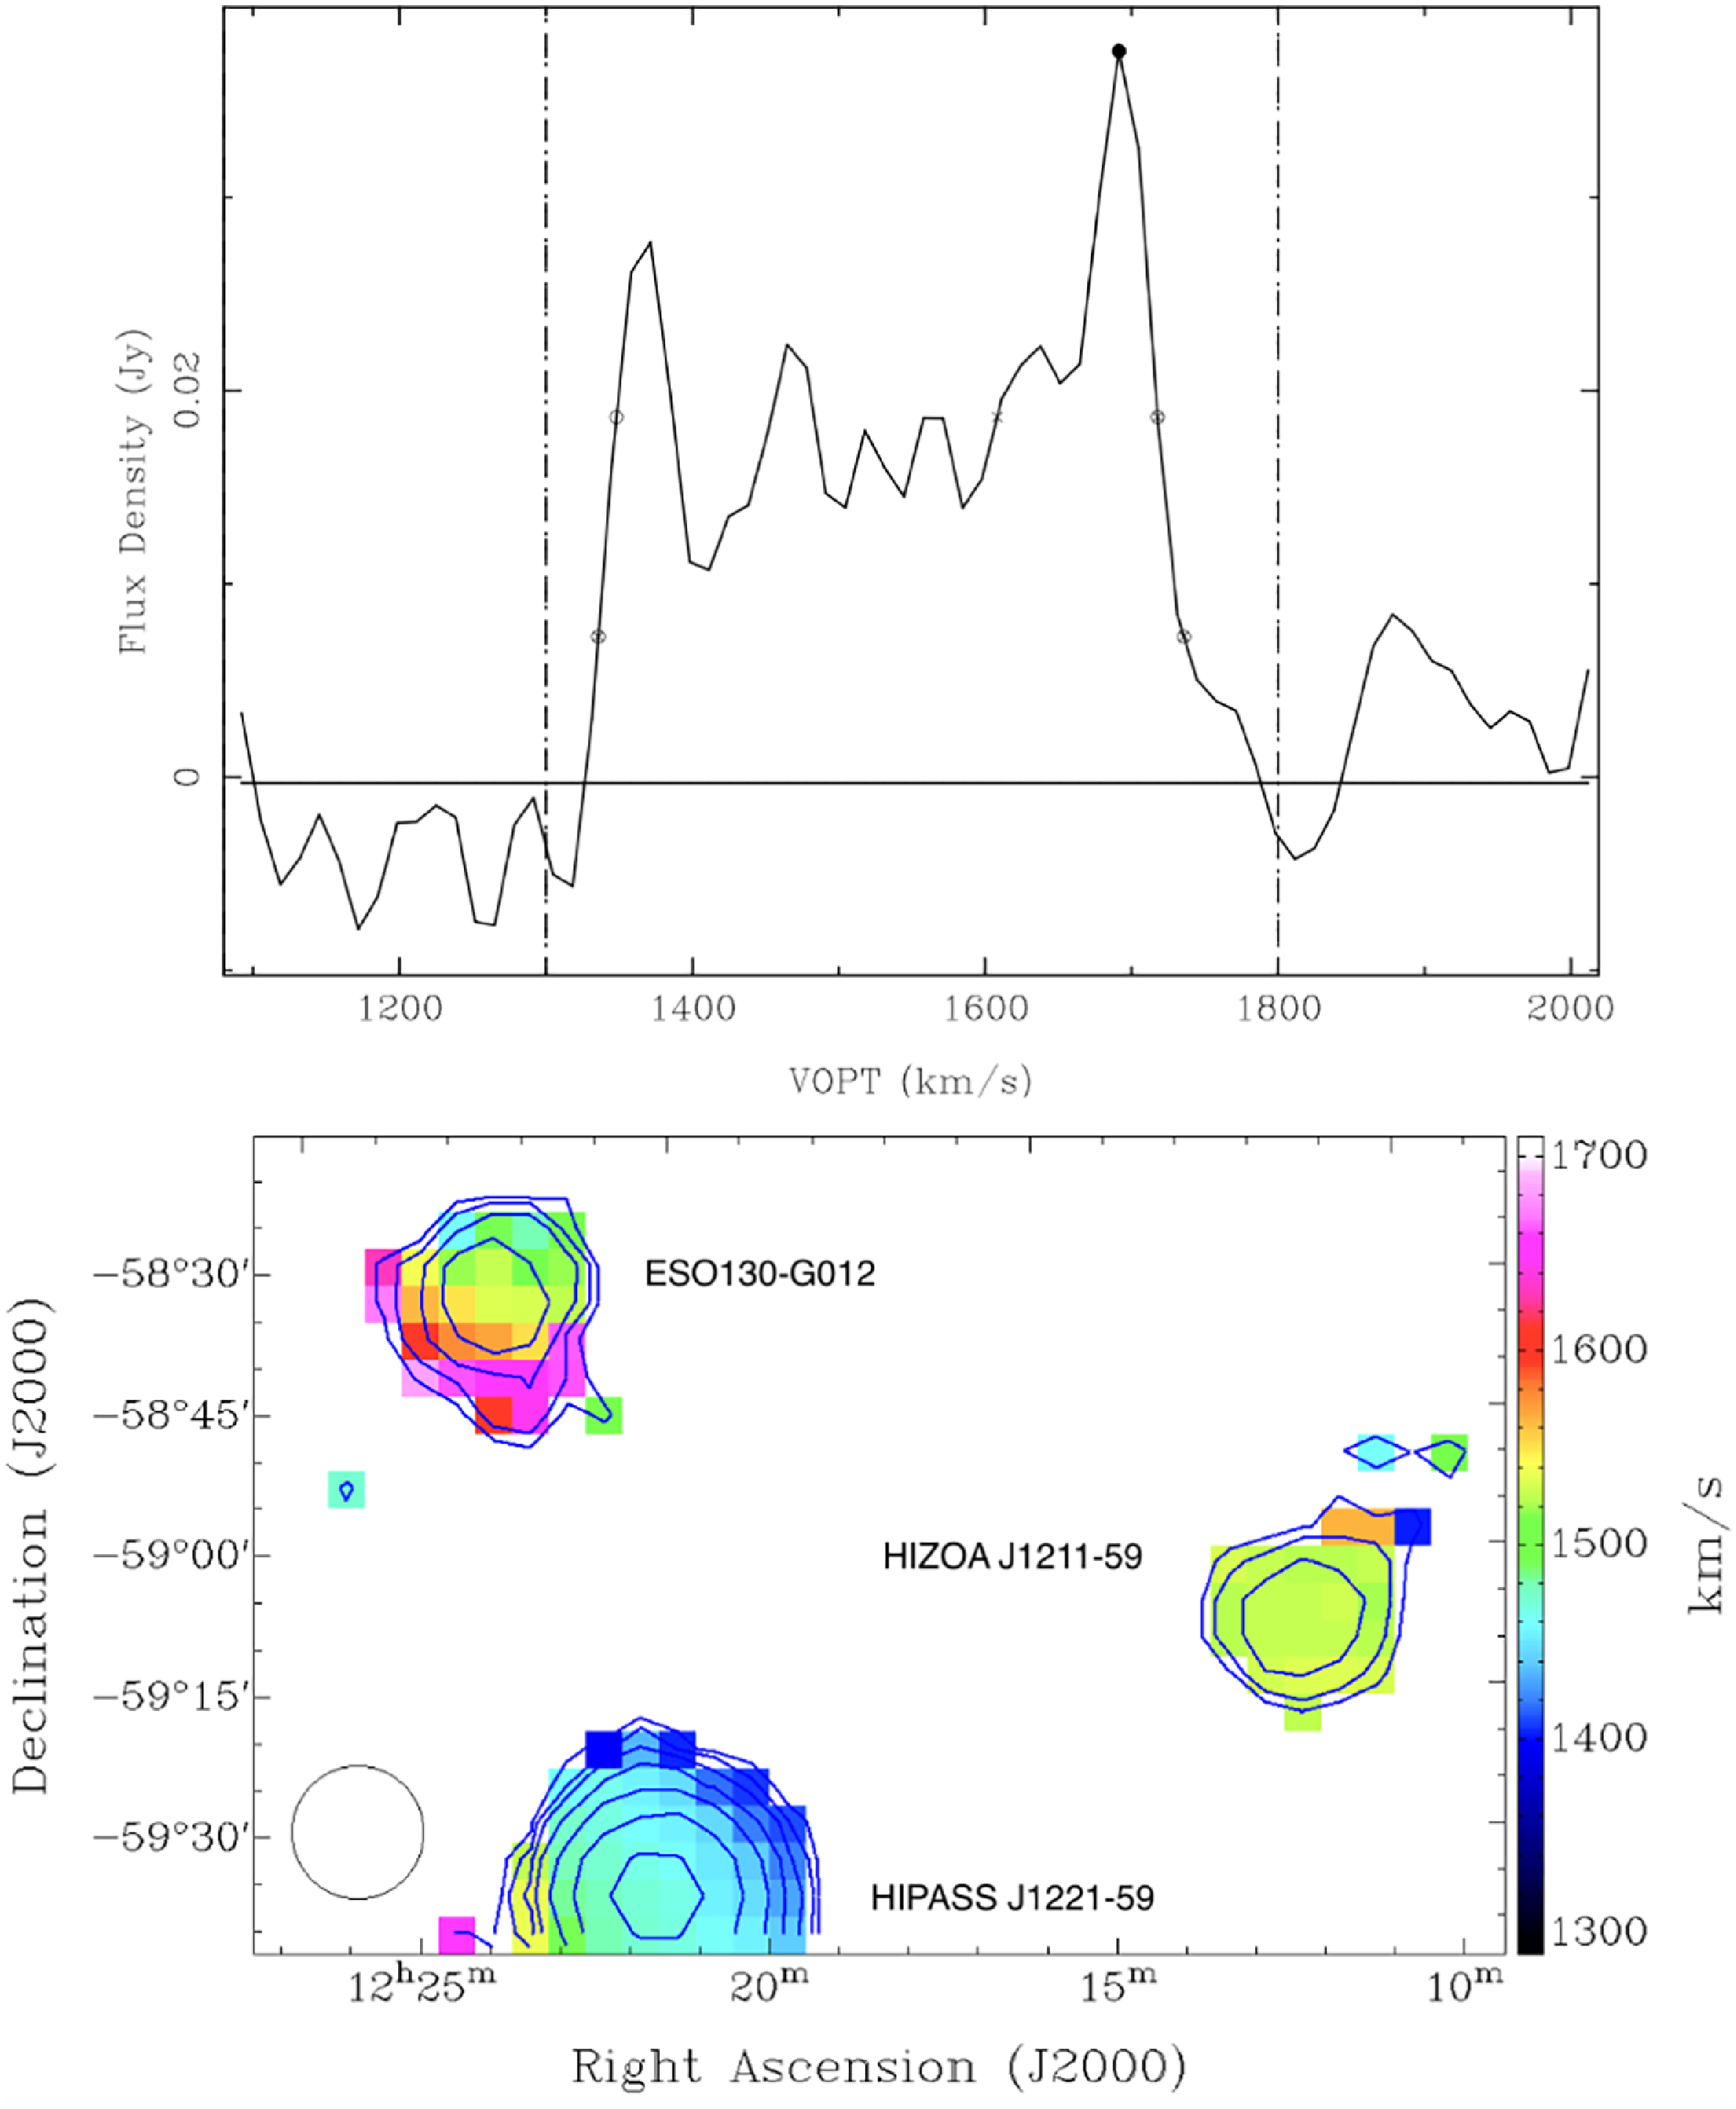


 Open access