





Introduction
Malaria remains a critical global public health challenge, with shifting environmental and climatic conditions fundamentally altering its transmission dynamics. Globally, approximately 263 million cases and nearly 600000 deaths were reported in recent years, with transmission risks uniquely sensitive to anthropogenic climate change [Reference Chen1, Reference Wang2]. The burden is profoundly unequal; sub-Saharan Africa (SSA) bears approximately 95% of all malaria cases. Recent ecological models project that warming temperatures, shifting rainfall patterns, and the increasing frequency of extreme, disruptive weather events will significantly expand Anopheles vector habitats across the continent, potentially driving tens of millions of new cases while simultaneously interrupting traditional vector control programmes [Reference Symons3, Reference Koudjom, Lokonon and Egbendewe4]. Within this highly vulnerable regional context, Tanzania remains one of the most severely affected nations. Contributing to over 4% of global malaria mortality, Tanzania faces an escalating threat as changing microclimatic conditions alter localized transmission epidemiology and challenge the long-term efficacy of standard interventions, making climate-informed surveillance in its rapidly urbanizing coastal areas urgently necessary [Reference Challe5, Reference Nkya6].
The transmission of these cases is intricately linked to meteorological factors such as temperature, rainfall, and relative humidity, which dictate the duration of the mosquito and parasite life cycles [Reference Gbaguidi7]. The Intergovernmental Panel on Climate Change (IPCC) reports with high confidence that climate variability has already driven malaria epidemics across East Africa, altering the historical range of the Anopheles mosquito and putting tens of millions more individuals at risk [Reference Lee and Romero8, Reference Ayanlade9]. In Tanzania, where Plasmodium falciparum accounts for 96% of cases [10], these shifting epidemiological patterns are further complicated by extreme weather events, such as unprecedented flooding and drought [Reference Ototo11, 12]. These climate-driven disruptions threaten to reverse recent gains in vector control and escalate transmission risks, particularly among vulnerable populations such as children under five and pregnant women [Reference Liheluka13].
Despite these escalating risks, the specific mechanisms by which shifting climate patterns and delayed weather effects influence malaria transmission in Dar es Salaam remain under-researched. The persistence of climate-sensitive disease transmission, even amidst a massive overall decline in urban malaria cases, makes understanding these non-linear interactions essential for future public health planning. Therefore, this study aims to evaluate temporal trends in malaria incidence in Dar es Salaam over a 10-year period (2014–2024) and to use generalized additive models (GAMs) to assess the non-linear, lagged effects of critical climatic factors on transmission dynamics.
Materials and methods
Study design
This ecological time series study analysed the temporal patterns and trends of malaria incidence. It investigated the relationship between climatic factors and malaria incidence in Dar es Salaam, Tanzania, from January 2014 to October 2024.
Study area
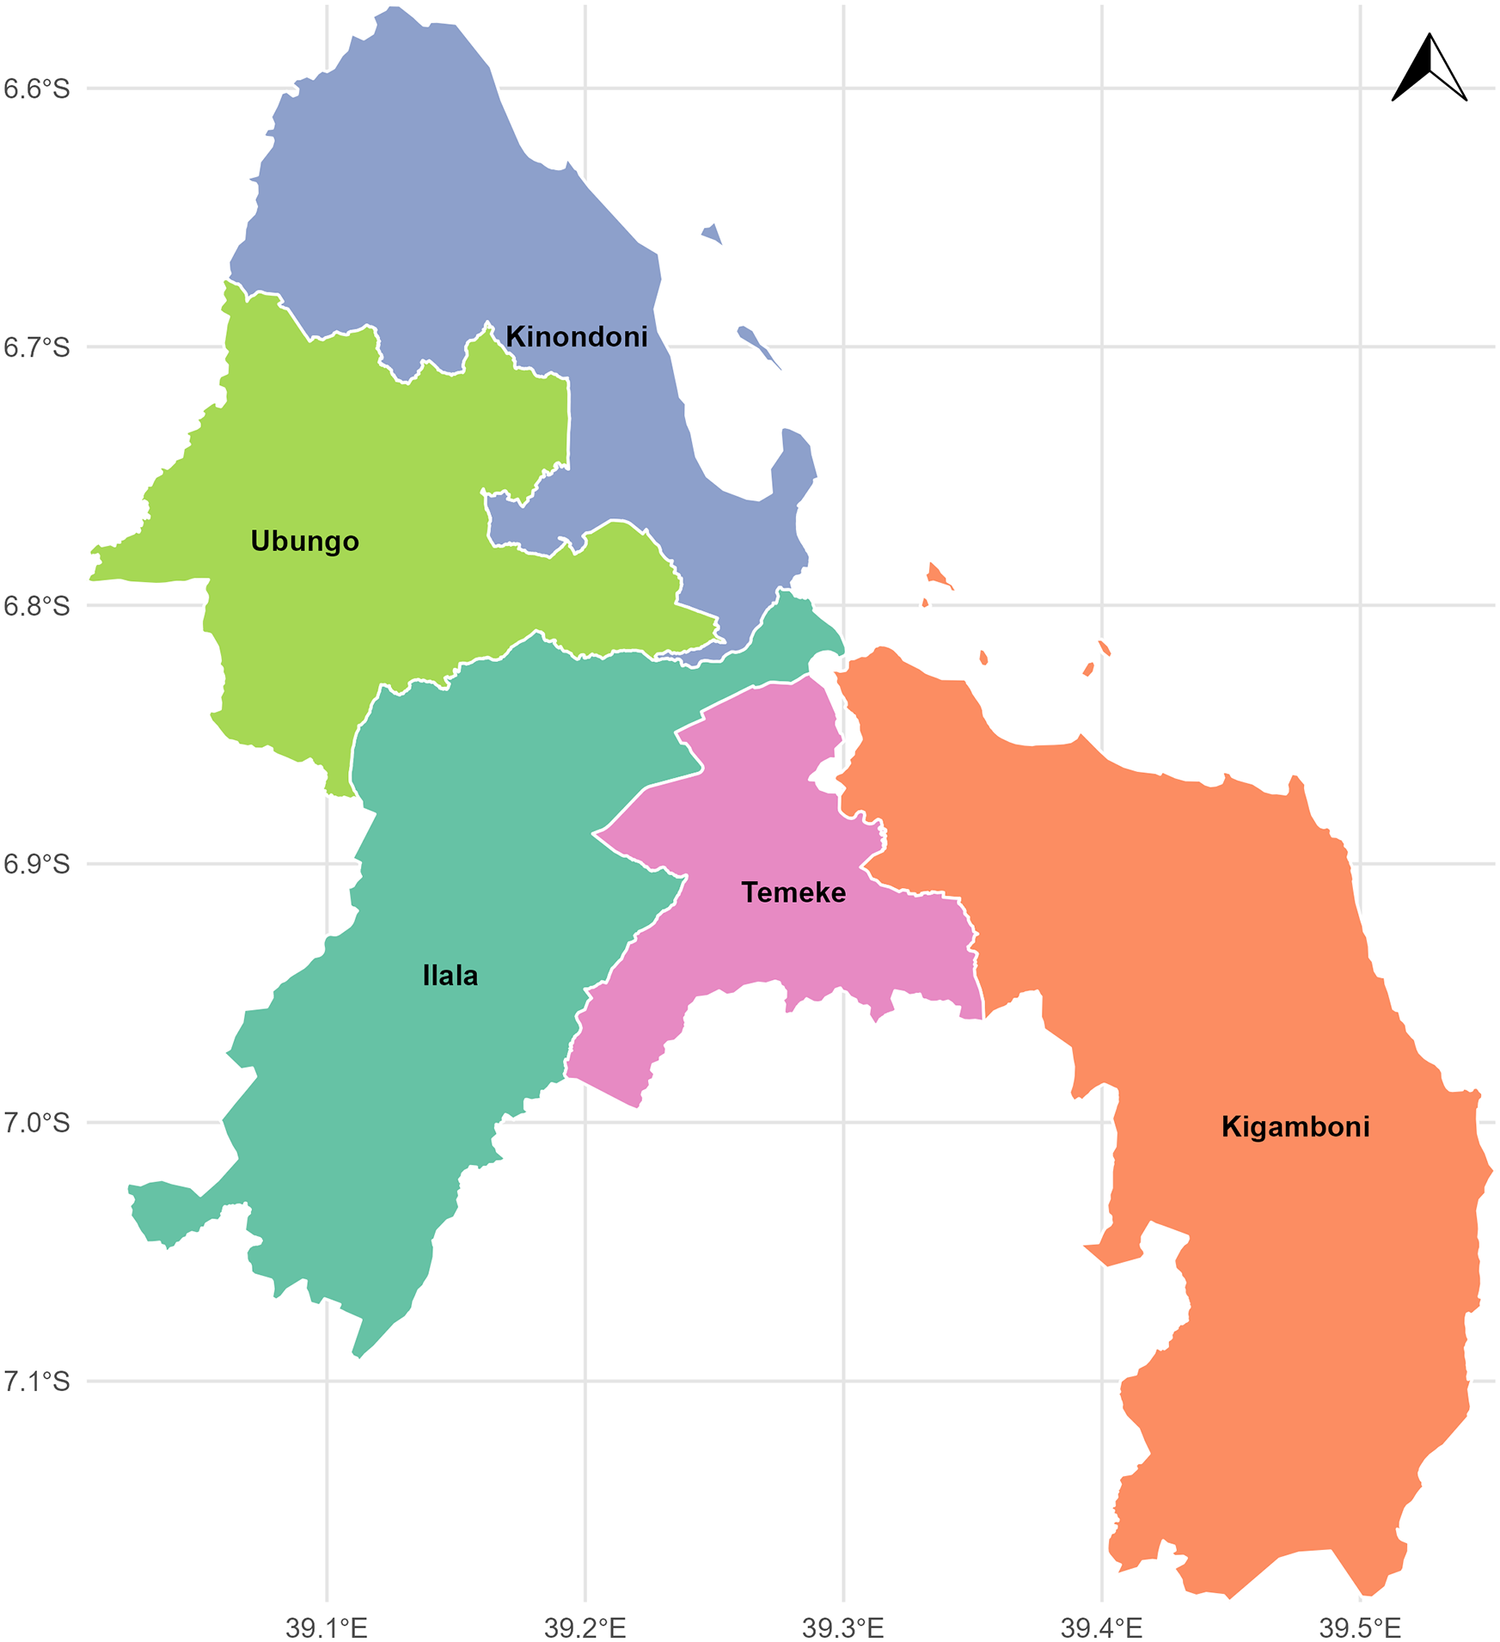
Dar es Salaam is one of the 31 regions on the mainland of Tanzania, divided into five districts and 90 wards, including Ilala, Kinondoni, Temeke, Ubungo, and Kigamboni (Figure 1). It is located along the southwest coast of the Indian Ocean on a flat coastal plain, and covers an area of approximately 1350 km2. It experiences warm, humid weather influenced by the monsoon season. The northeast monsoon affects the city between December and March, whereas the southeast monsoon occurs from May to October. Due to its proximity to the equator, the yearly mean air temperature is approximately 26°C, with modest seasonal fluctuations. The coolest months are May through September, when the average air temperature is around 24°C, while the warmest months are December through March, when the average air temperature is around 28°C [Reference Kagoye14].
Map of study area (Authors’ own contribution).

Figure 1 Long description
A map of the Dar es Salaam region divided into five administrative districts: Ilala, Kinondoni, Temeke, Ubungo, and Kigamboni. The districts are situated along the southwest coast of the Indian Ocean on a flat coastal plain.
Data sources
Malaria data
Confirmed monthly malaria cases for each district over the past 10 years (January 2014–October 2024) were collected from the District Health Information System (DHIS2). The data were obtained from outpatient, inpatient, and reproductive and child health services. Prior to analysis, rigorous quantitative data quality checks were performed to ensure temporal completeness and internal consistency. Time series plots were visually inspected for anomalous spikes or reporting errors, and the dataset was complete with no extreme outliers requiring exclusion. This aggregate data included confirmed malaria cases categorized into groups of children under 5 years of age, patients aged above 5 years, and pregnant women.
Climate data
Climate data, including monthly daytime and night-time temperatures, rainfall, and relative humidity, from January 2014 to October 2024, were collected from the Julius Nyerere International Airport station operated by the Tanzania Meteorological Authority (TMA), Dar es Salaam Region Division.
Population data
The annual population data for Dar es Salaam and its districts, spanning 2014–2024, were obtained from the National Bureau of Statistics (NBS).
Due to the aggregated and secondary nature of the health and meteorological records, the raw data were acquired upon formal request from the respective authorities. To ensure transparency and reproducibility, the finalized, compiled dataset utilized for all modelling in this study has been made publicly accessible as detailed in the Data Availability Statement.
Data analysis
Temporal patterns and trends analysis
Monthly malaria incidence (I) per 10000 person-months was calculated by dividing the total confirmed malaria cases (A) by the total population at risk (N) and multiplying the result by 10000:

The mean and standard deviation of monthly malaria incidence per 10000 person-months were derived for each calendar year.
Seasonal trend decomposition
A seasonal-trend decomposition using locally weighted (STL) regression was applied to the time series of malaria incidence to identify seasonal relationships, interannual patterns, and residual variability. The structure of the STL model was as follows:

where Y t represents local malaria incidence with logarithmic transformation; S t represents the seasonal component estimated using a locally weighted regression (LOESS) method to capture the periodic fluctuations; T t represents the trend component estimated using another LOESS smoothing to capture the long-term direction; R t represents the residual component calculated as the difference between the observed time series and the sum of the estimated trend and seasonal components; and t denotes a time index in months.
Climate–malaria relationship analysis
Generalized additive models (GAMs) were selected for this study to examine the relationship between climate variables and malaria incidence due to their ability to account for seasonal patterns, non-linear trends, and delayed environmental exposures. GAMs and distributed lag models are highly robust methods increasingly utilized in modern spatial epidemiology to quantify the complex, delayed physiological effects of climate on vector-borne disease transmission [Reference Sewe15, Reference Gasparrini, Armstrong and Kenward16]. GAMs can capture threshold or declining effects more accurately than a straightforward linear regression by modelling each climatic predictor with its smooth function. Using penalized splines to prevent overfitting keeps the model adaptable and comprehensible for any climatic element. To capture potential delayed climatic effects, a systematic lag analysis was conducted testing extended lag windows of up to 4 months (approximately 16 weeks). However, Akaike Information Criterion (AIC) comparisons confirmed that incorporating 4-month lags did not improve model performance (AIC increased from 851.48 to 852.31), and none of the 4-month climatic variables were statistically significant. Consequently, to maintain the most parsimonious fit, the final model was restricted to lags ranging from 0 to 3 months. Because the dependent variable was transformed into a continuous incidence rate, the GAM was fitted using a Gaussian distribution with an identity link function, which precludes the need for a count-based distribution.
To prevent overfitting and allow the model to automatically shrink non-informative predictors toward zero, all smooth terms were fitted using shrinkage cubic regression splines (bs = ‘cs’), which permit effective degrees of freedom (edf) to collapse when variables have weak evidence.
The GAM model formula was as follows:

where
$ {I}_t $
 is the continuous malaria incidence per 10000 population at month t;
$ {\beta}_0 $
is the continuous malaria incidence per 10000 population at month t;
$ {\beta}_0 $
 is the model intercept;
$ {s}_{i,l} $
is the model intercept;
$ {s}_{i,l} $
 represents the shrinkage smooth functions for the four climatic predictors (daytime temperature, night-time temperature, monthly rainfall, and relative humidity) assessed at lags 0, 1, 2, 3, and 4 months with a basis dimension k of 10;
$ {s}_{time} $
represents the shrinkage smooth functions for the four climatic predictors (daytime temperature, night-time temperature, monthly rainfall, and relative humidity) assessed at lags 0, 1, 2, 3, and 4 months with a basis dimension k of 10;
$ {s}_{time} $
 is the penalized temporal spline (year-month) with k = 12; and
$ {\epsilon}_t $
is the penalized temporal spline (year-month) with k = 12; and
$ {\epsilon}_t $
 is the Gaussian error term.
Model diagnostics were rigorously evaluated using the mgcv package in R. The gam. Check() function was used to assess the normality of residuals and homoscedasticity, and to verify that the chosen basis dimensions were sufficiently large to capture the non-linearity without overfitting. Furthermore, autocorrelation function (ACF) and partial autocorrelation function (PACF) plots of the model residuals were examined to ensure the temporal spline adequately controlled for residual temporal autocorrelation. Additionally, potential collinearity among the non-linear terms was evaluated using the concurvity() function, ensuring the smooth terms did not excessively concur.
To include unmeasured, long-term confounding factors such as insecticide-treated nets (ITNs), indoor residual spraying (IRS), and urbanization, a temporal trend term was included as a penalized spline in the model. Because granular, monthly data on vector control coverage were unavailable at the district level for the decade, this highly flexible temporal spline was utilized as a statistical proxy. By absorbing the gradual, non-linear, and long-term declines in malaria incidence driven by these interventions, the model effectively partials out this variance. This ensures that the remaining fluctuations explained by the climatic predictors represent true short-term, seasonal climate sensitivities rather than spurious correlations with long-term public health successes.
Statistical software
All analyses were conducted using R software, version 4.5.1 (© R Foundation for Statistical Computing). The mgcv package was used for GAM analysis, and custom scripts were developed for STL decomposition and preliminary data visualization.
Results
Monthly and annual trends of malaria incidence
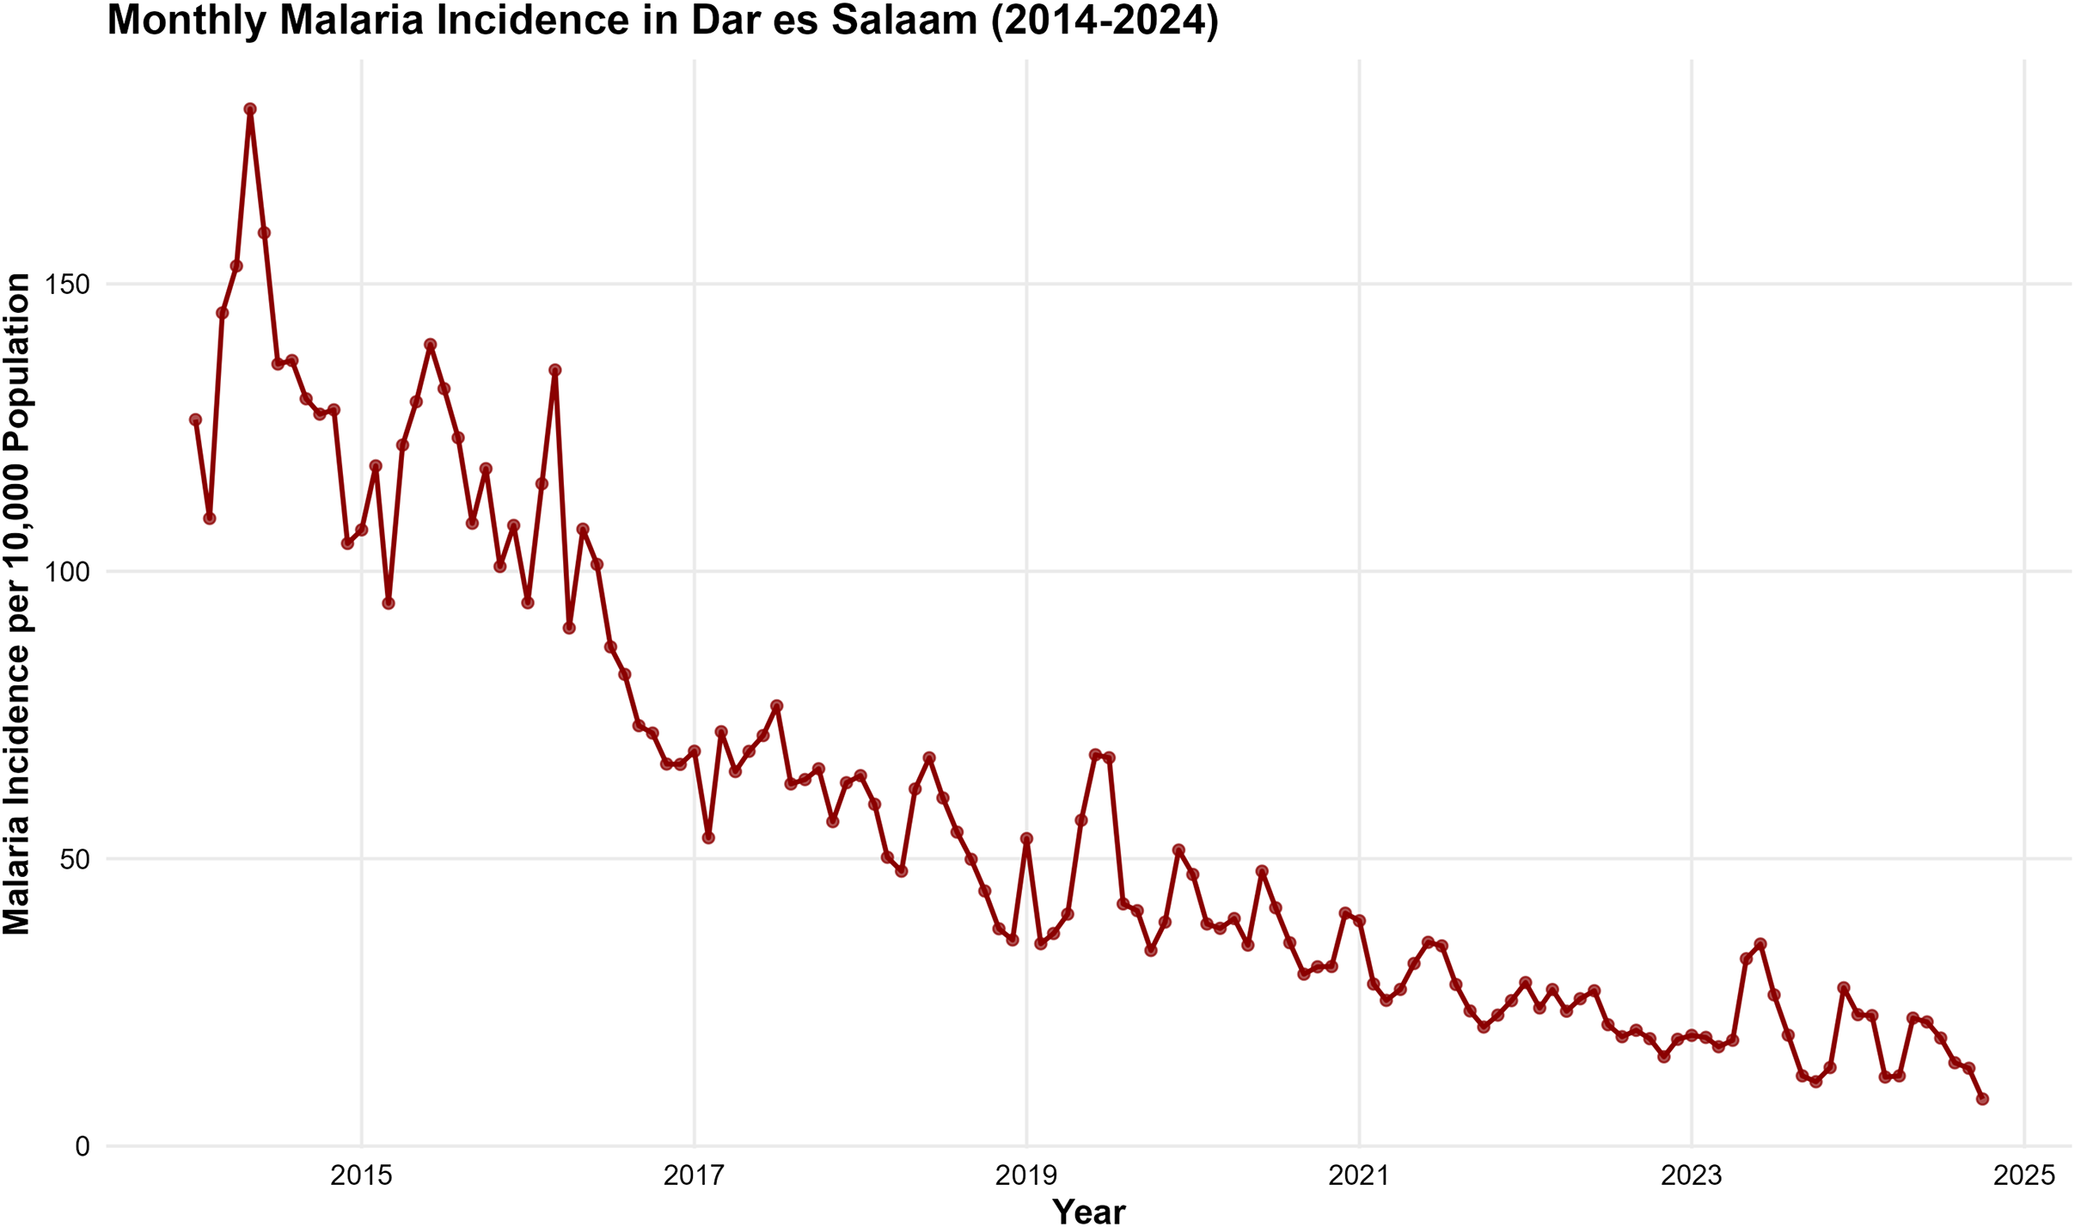
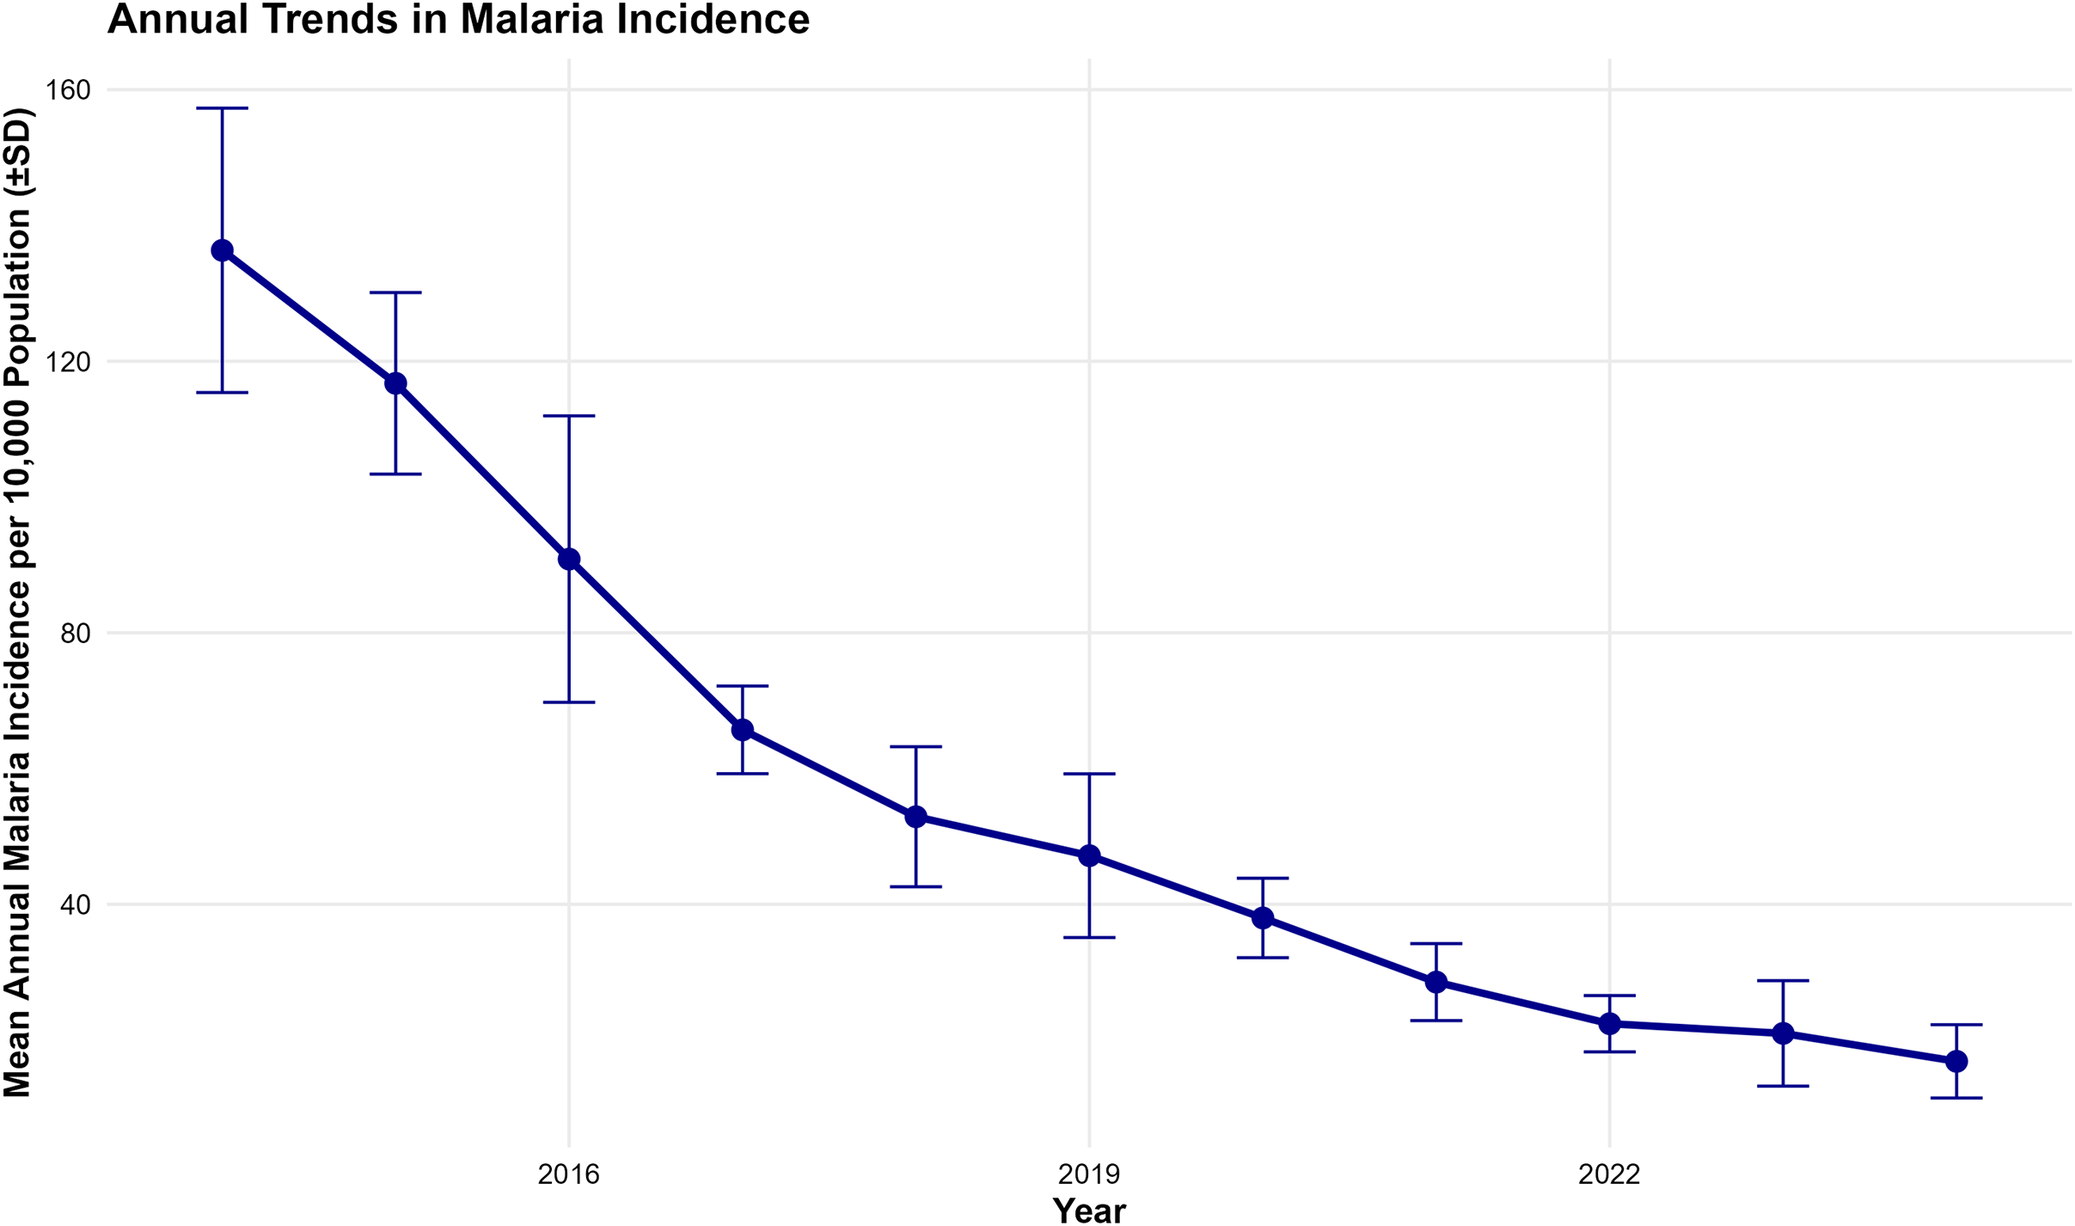
The monthly malaria incidence in Dar es Salaam from January 2014 to October 2024 exhibited a general declining trend over the study period (Figure 2). The time series demonstrated substantial month-to-month variability with peak incidence exceeding 180 cases per 10000 population in 2014–2015, while values decreased to below 50 cases per 10000 population by 2024. Annual mean malaria incidence showed a consistent downward trend from 2014 to 2024, with the highest mean yearly incidence recorded in 2014 (139.8 ± 25.3 cases per 10000) and the lowest observed in 2023 (22.4 ± 11.2 cases per 10000) (Figure 3).
Monthly trend of malaria incidence in Dar es Salaam (2014–2024). The overall downward trend is highly statistically significant (p < 0.001).

Figure 2 Long description
A time series plot showing monthly malaria incidence per 10000 population. The data shows a substantial month-to-month variability with peak incidence exceeding 180 cases per 10000 in 2014–2015, declining to below 50 cases per 10000 by 2024.
Annual trends of malaria incidence in Dar es Salaam (2014–2024). The interannual decline is statistically significant (p < 0.001).

Figure 3 Long description
A line plot showing the mean annual malaria incidence per 10000 population on the y-axis and the year on the x-axis, complete with standard deviation error bars. The graph illustrates a steady and significant downward trend, starting at approximately 140 cases per 10000 in 2014 and dropping to roughly 22 cases per 10000 by the year 2023.
Patterns of climate variables
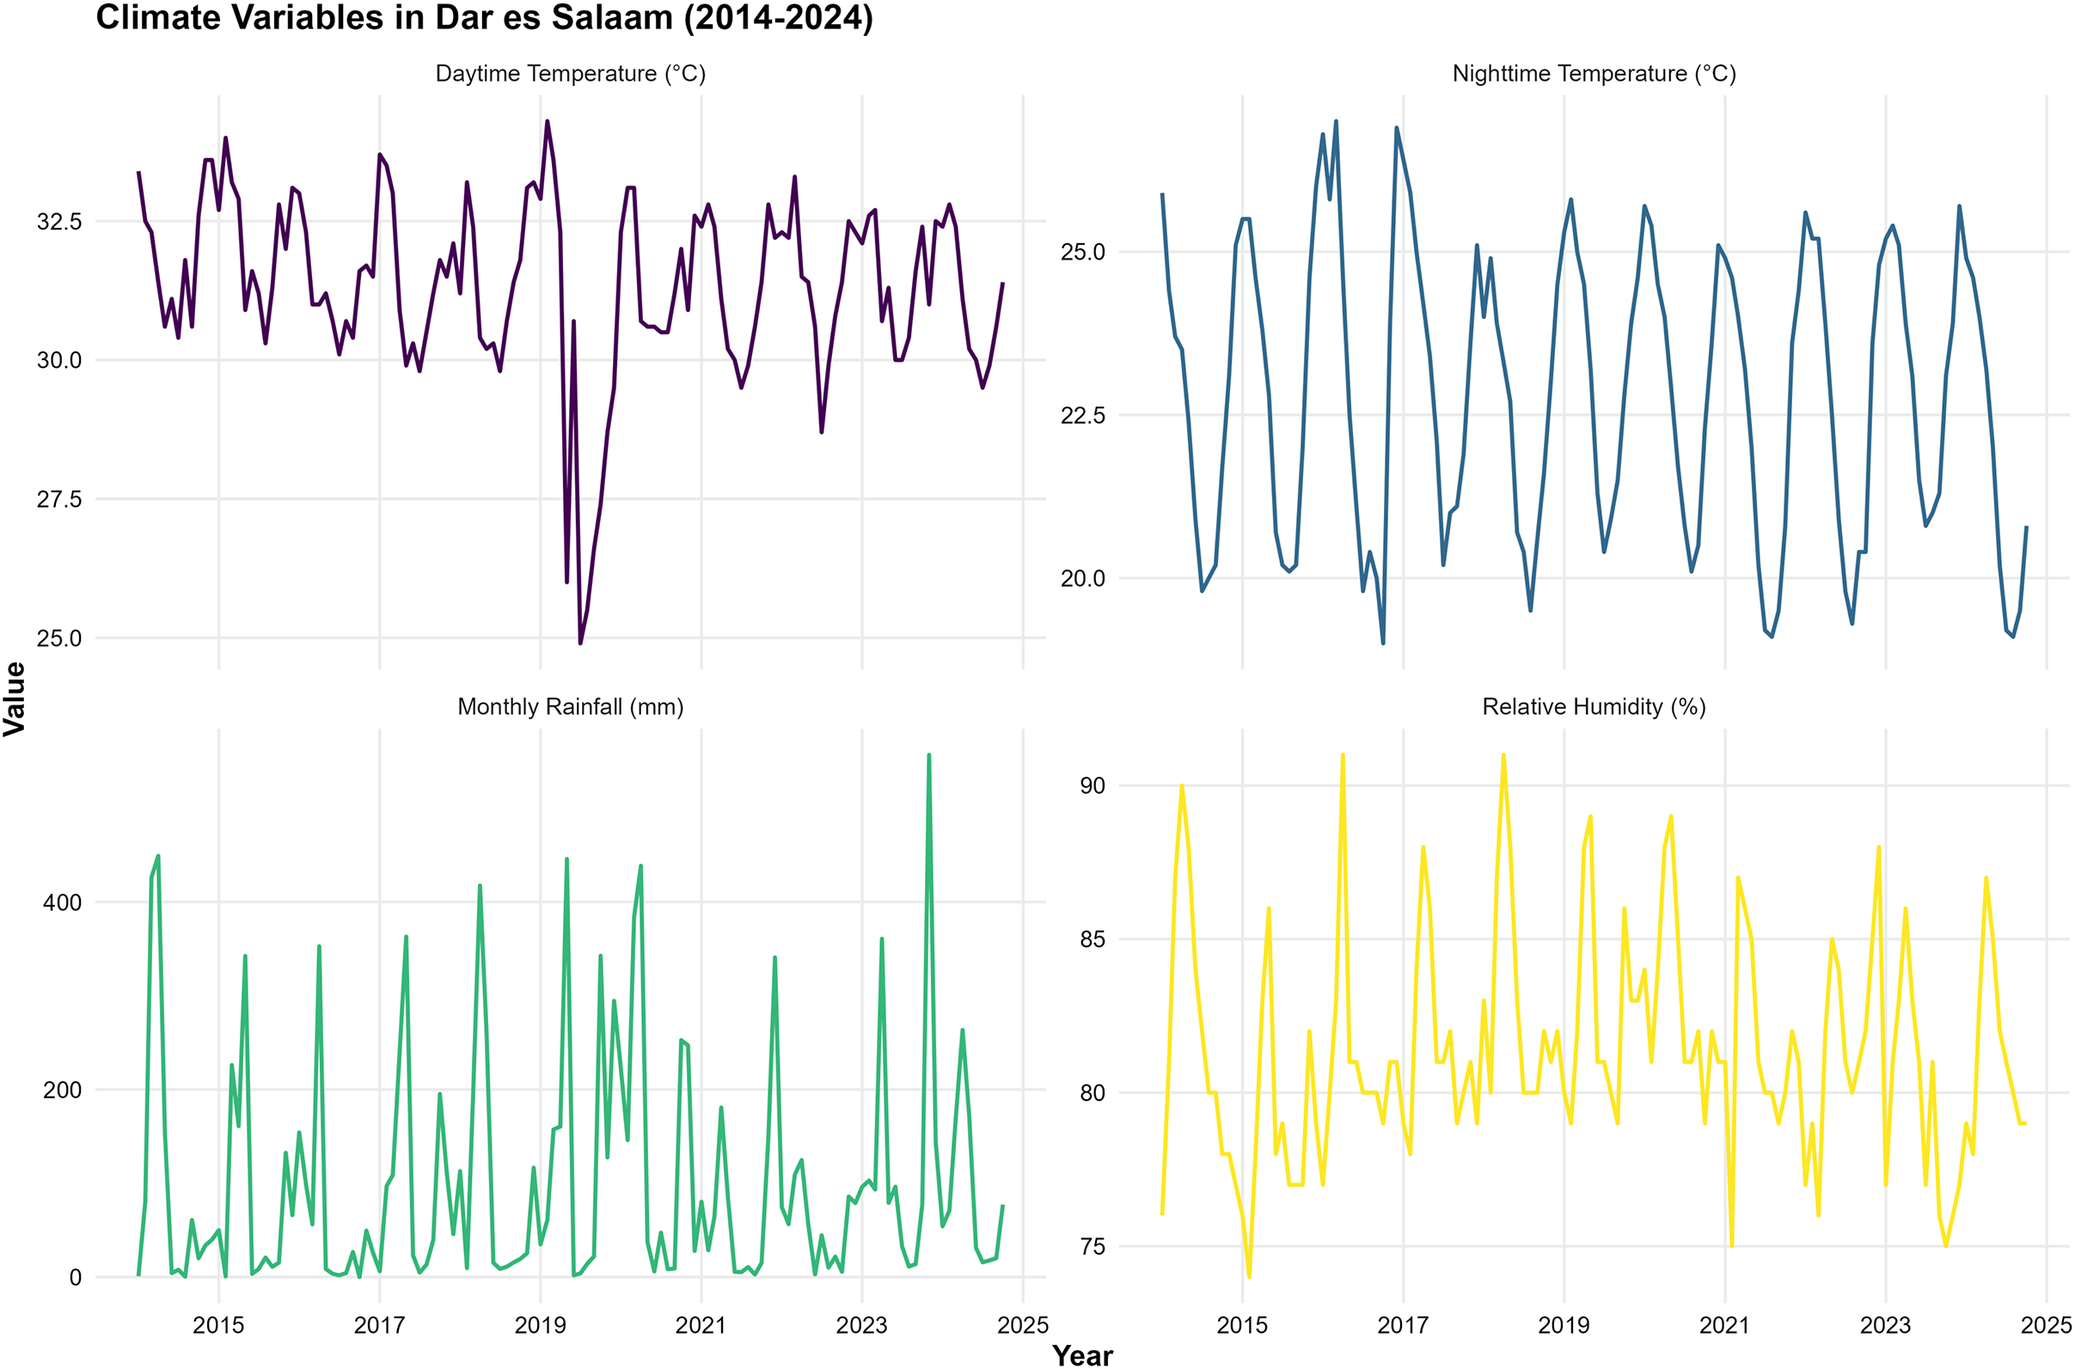
Daytime and night-time temperatures exhibited consistent seasonal patterns throughout the study period (Figure 4). Daytime temperatures ranged from approximately 26°C to 34°C, with peak values typically occurring during the short dry season (December–February). Night-time temperatures exhibited less variability, ranging from 19°C to 27°C, with similar seasonal patterns to daytime temperatures. Monthly rainfall exhibited high variability, with pronounced seasonal peaks during the long rainy season (March to May) and the short rainy season (October–December). Rainfall amounts ranged from near zero during dry periods to over 400 mm during peak rainy months. Relative humidity remained consistently high throughout the year, ranging from 75% to 91%, with slightly higher values during the rainy seasons.
Time series plot for all considered climate variables.

Figure 4 Long description
A multi-panel time series plot tracking four climatic variables over a 10-year period. The top left panel shows daytime temperature fluctuating between 26°C and 34°C. The top right panel shows nighttime temperature fluctuating between 19°C and 27°C. The bottom left panel displays highly variable monthly rainfall, with cyclical peaks reaching over 400 mm. The bottom right panel shows relative humidity consistently ranging between 75% and 91%.
Seasonal trend of malaria incidence
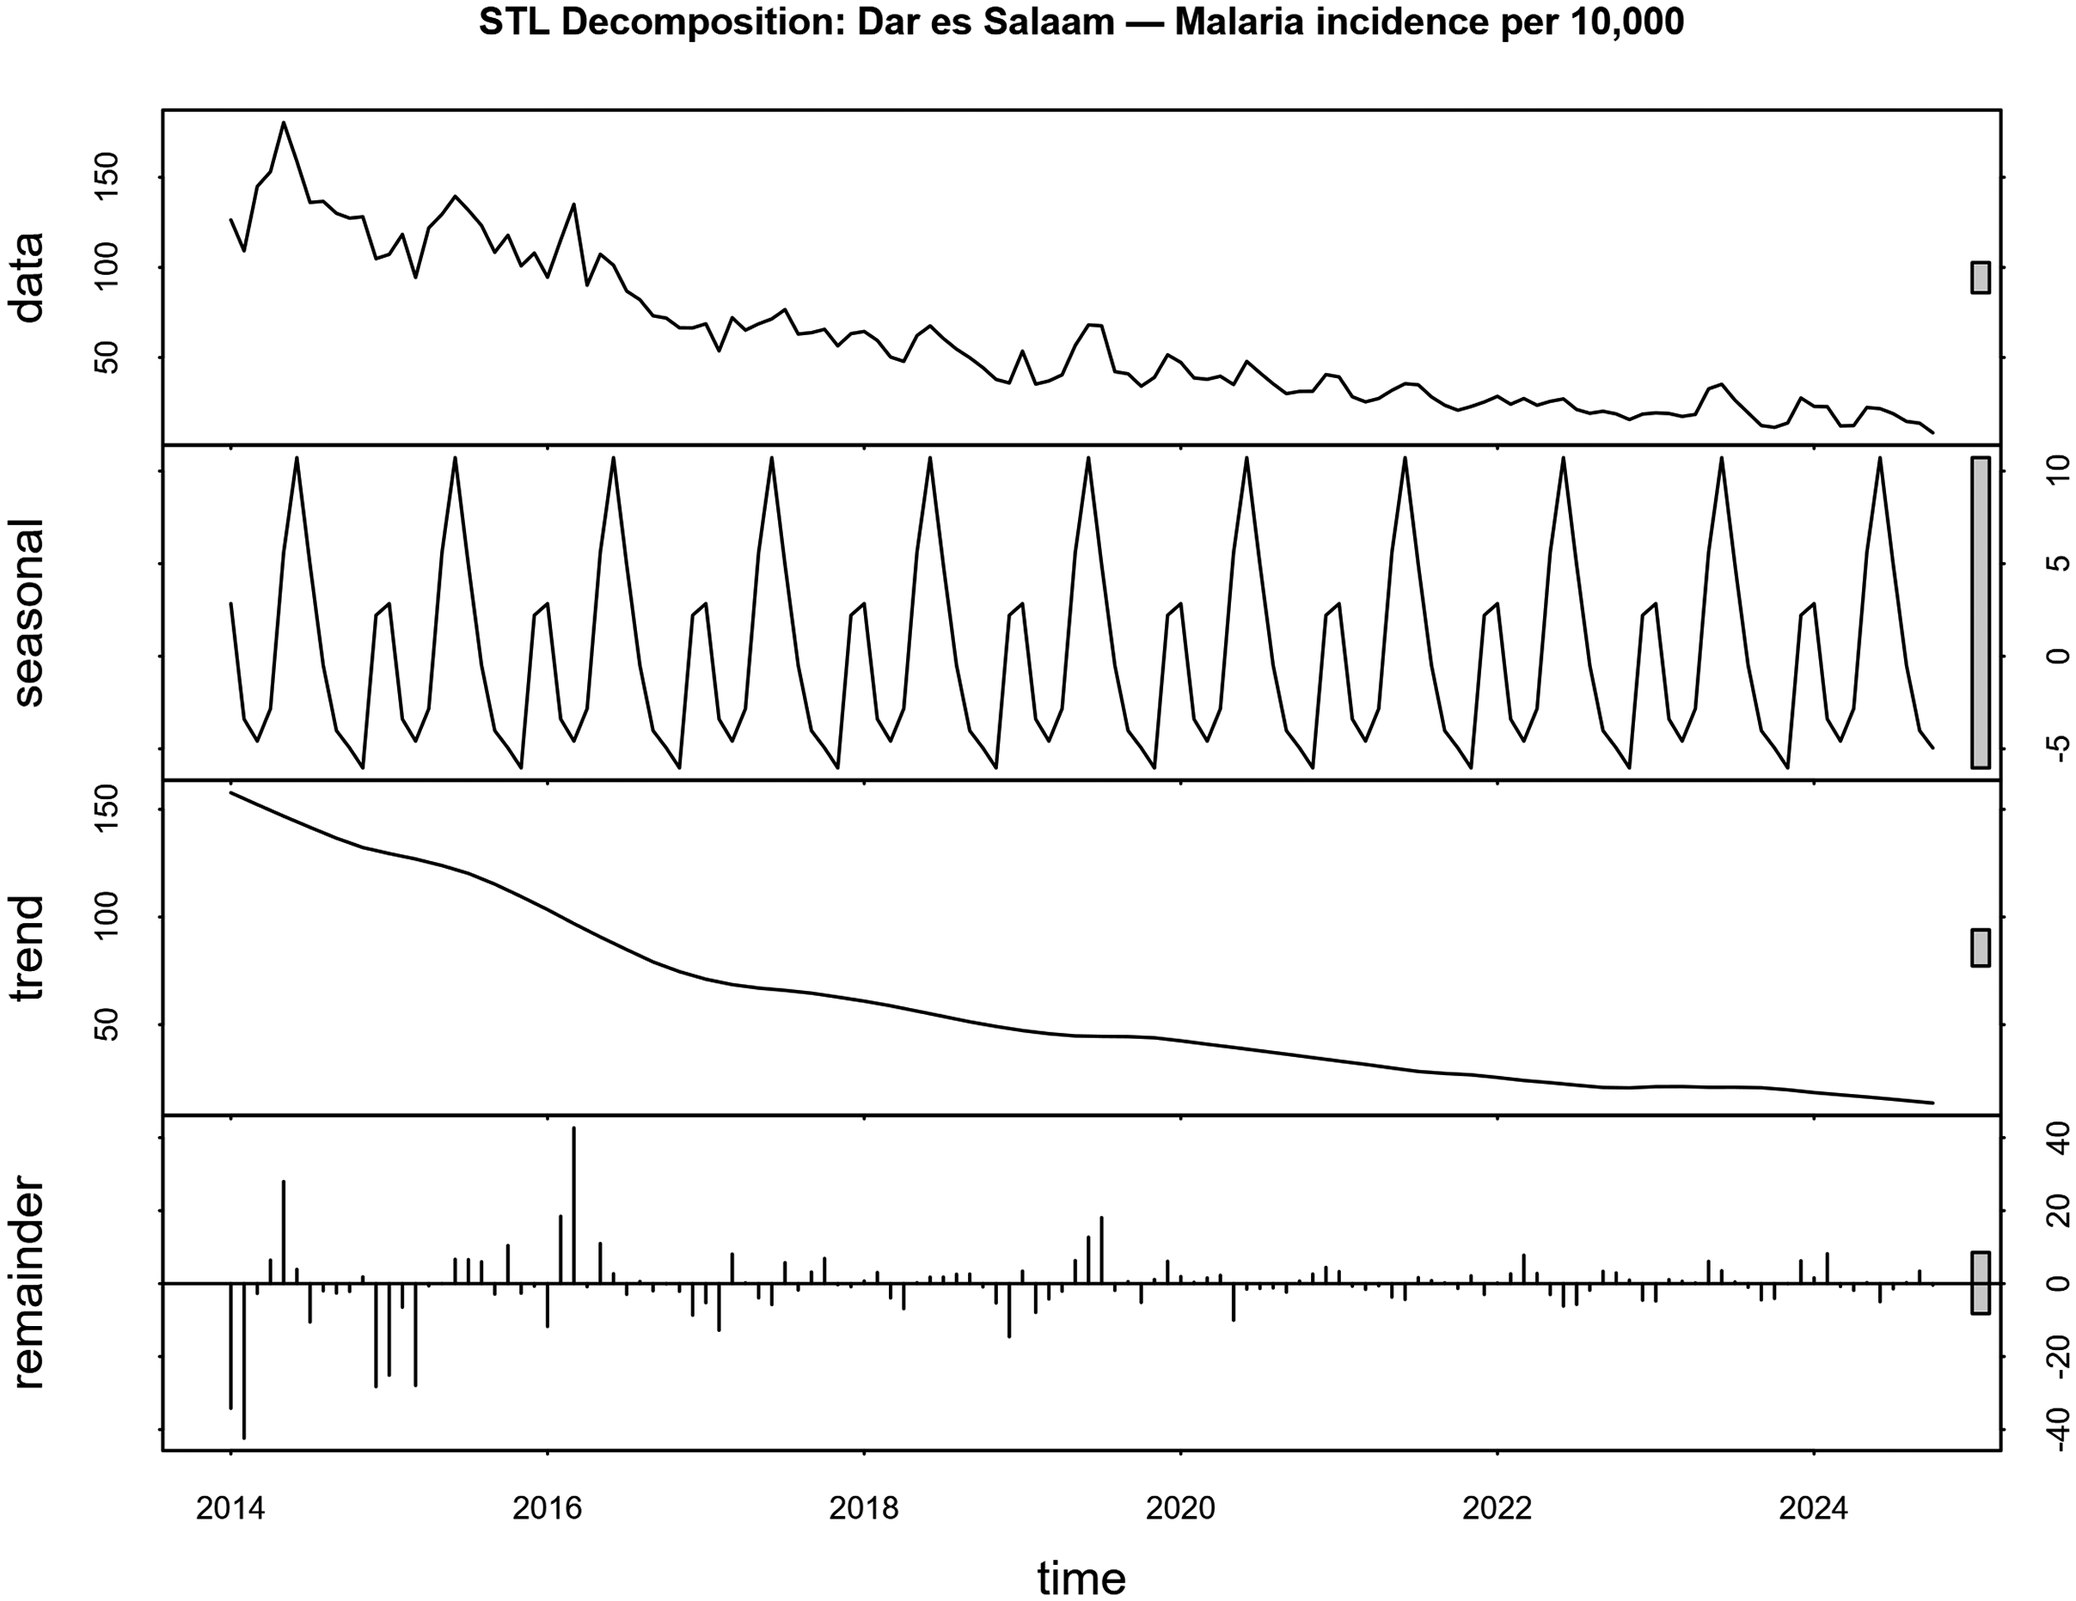
The STL decomposition of malaria incidence revealed three distinct components. The trend component showed an apparent long-term decline from 2014 to 2024, with the steepest decrease occurring between 2016 and 2018. The seasonal component exhibited a strong annual cycle with peak values during April–June and low values during August–September. The residual component demonstrated relatively low variability, indicating that the trend and seasonal components captured most of the temporal variation in malaria incidence (Figure 5).
Seasonal-trend decomposition using locally weighted (STL) regression of monthly malaria incidence in Dar es Salaam (2014–2024). The panels from top to bottom display the original observed data, the estimated long-term trend, the extracted seasonal component, and the remainder (residuals). The y-axis represents the malaria incidence, and the x-axis represents the time in years.

Figure 5 Long description
Four stacked line graphs decomposing the monthly malaria incidence from 2014 to 2024. The top panel shows the raw observed data. The second panel isolates the ‘seasonal’ component, revealing a highly regular annual cycle with distinct peaks and troughs. The third panel shows the ‘trend’ component, illustrating a smooth, continuous long-term decline over the decade. The bottom panel shows the ‘remainder’ or residuals, which cluster near zero.
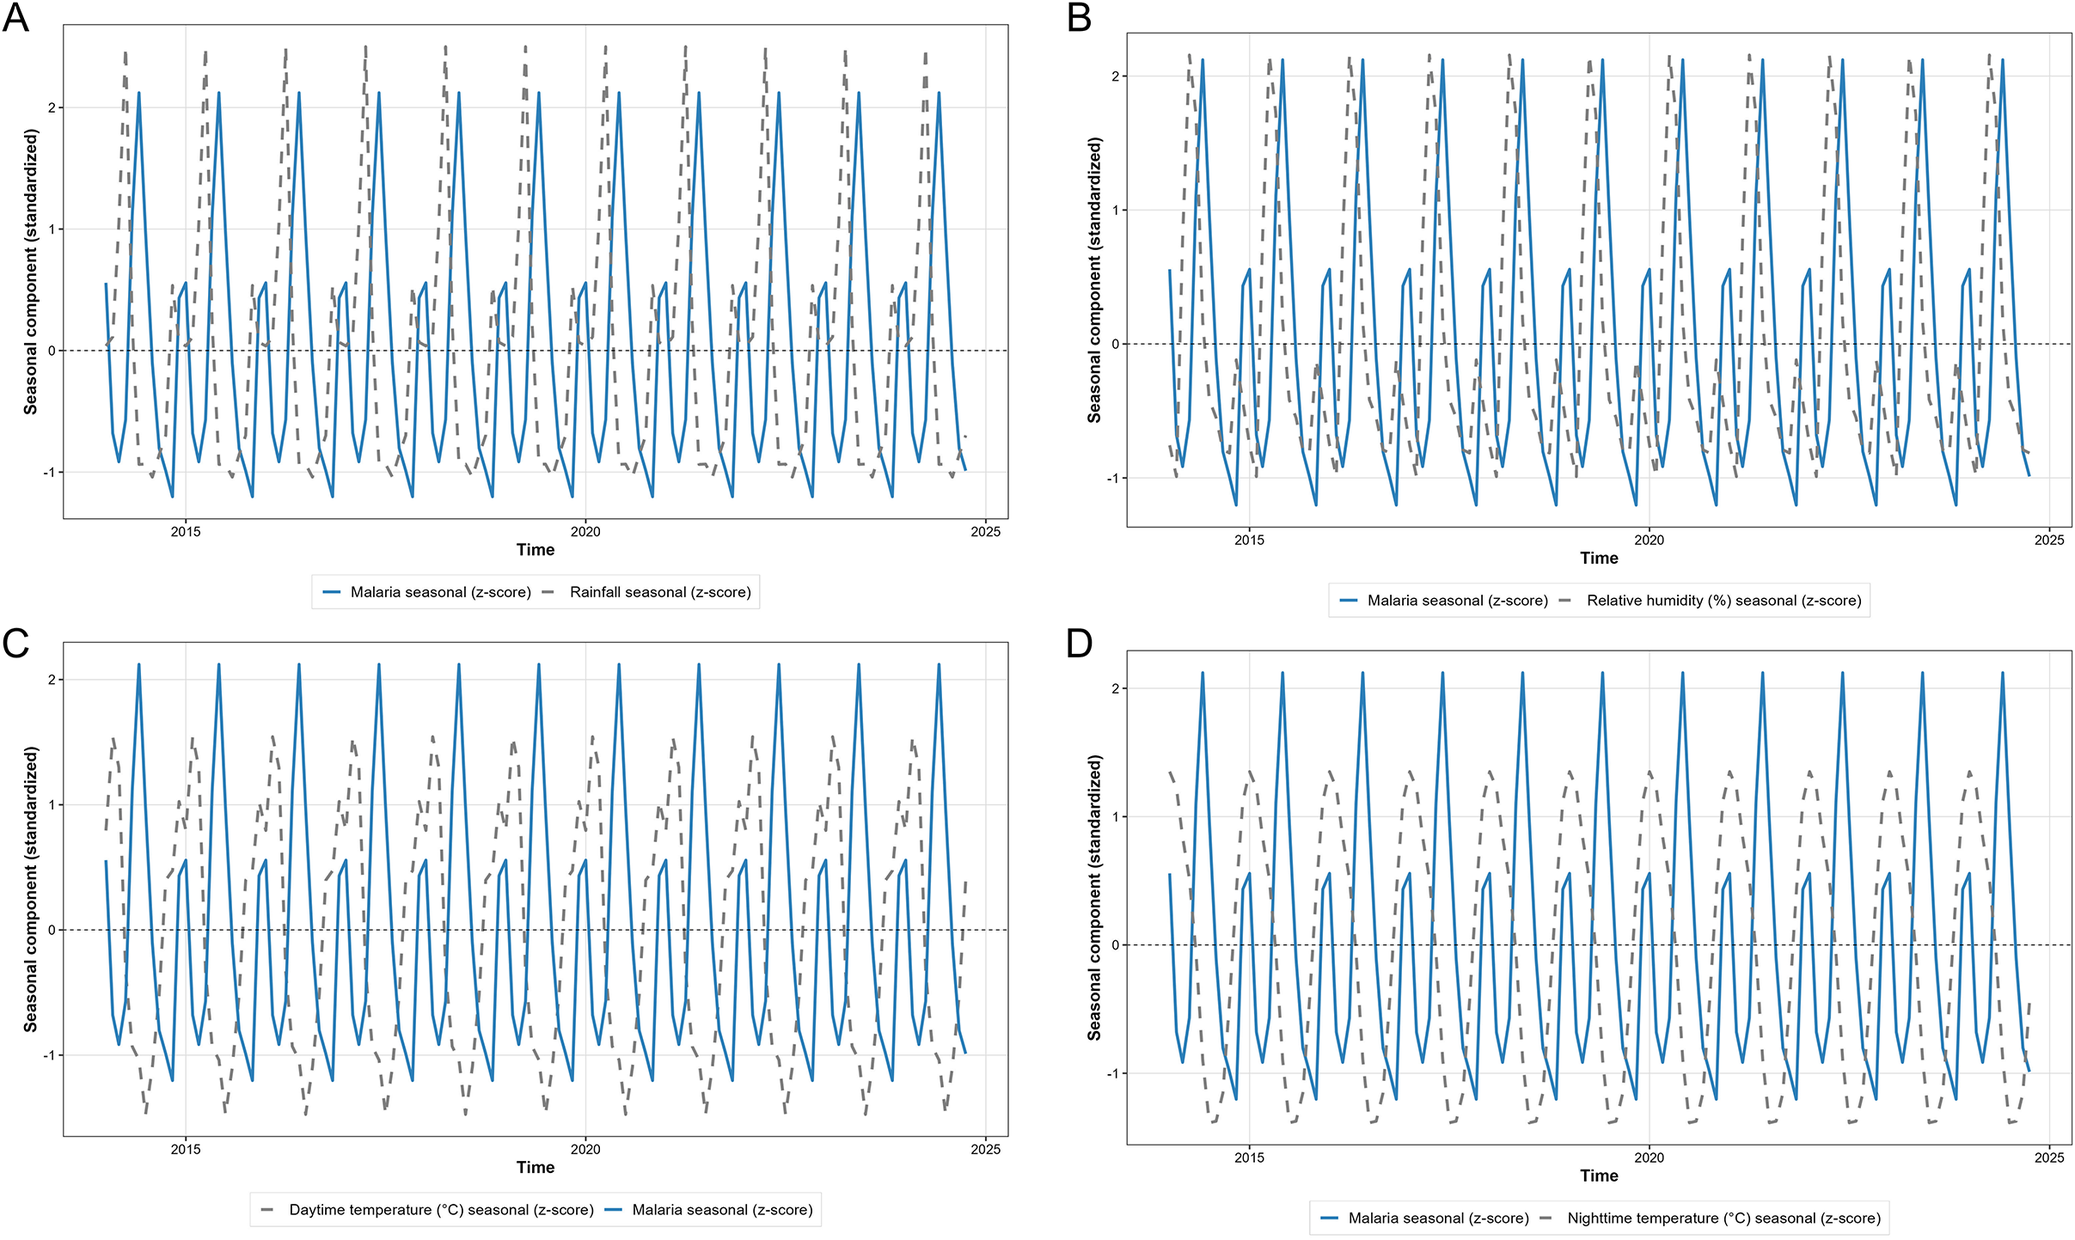
Seasonal-trend decomposition decomposition analysis comparing malaria incidence with climate variables revealed distinct seasonal relationships. The seasonal components revealed that malaria peaks lagged behind rainfall peaks by approximately 1–2 months, with rainfall seasonal peaks occurring in March and April, and malaria seasonal peaks occurring in April and May. Both daytime and night-time temperature seasonal patterns showed moderate association with malaria seasonality, with temperature peaks during the short dry season (December–February) preceding malaria peaks by 2–3 months. Relative humidity seasonal patterns revealed a similar lagged relationship to that of rainfall (Figure 6).
Standardized seasonal components of malaria incidence and climatic variables derived from STL decomposition. Panel A displays the seasonal trend of malaria incidence aligned with rainfall; Panel B shows with daytime temperature; Panel C shows with night-time temperature; and Panel D shows with relative humidity. The y-axis represents the standardized seasonal effect, demonstrating the 1- to 2-month lag between climatic peaks and malaria surges across the calendar year (x-axis).

Figure 6 Long description
A four-panel figure (A, B, C, D) mapping the standardized seasonal effect of malaria (solid line) alongside different climatic variables (dashed lines) over time. Panel A aligns malaria with rainfall; Panel B with daytime temperature; Panel C with nighttime temperature; and Panel D with relative humidity. The visualizations demonstrate a 1- to 2-month lag, where climatic peaks consistently precede the surges in malaria incidence across the calendar year.
Relationship between climatic variables and malaria incidence
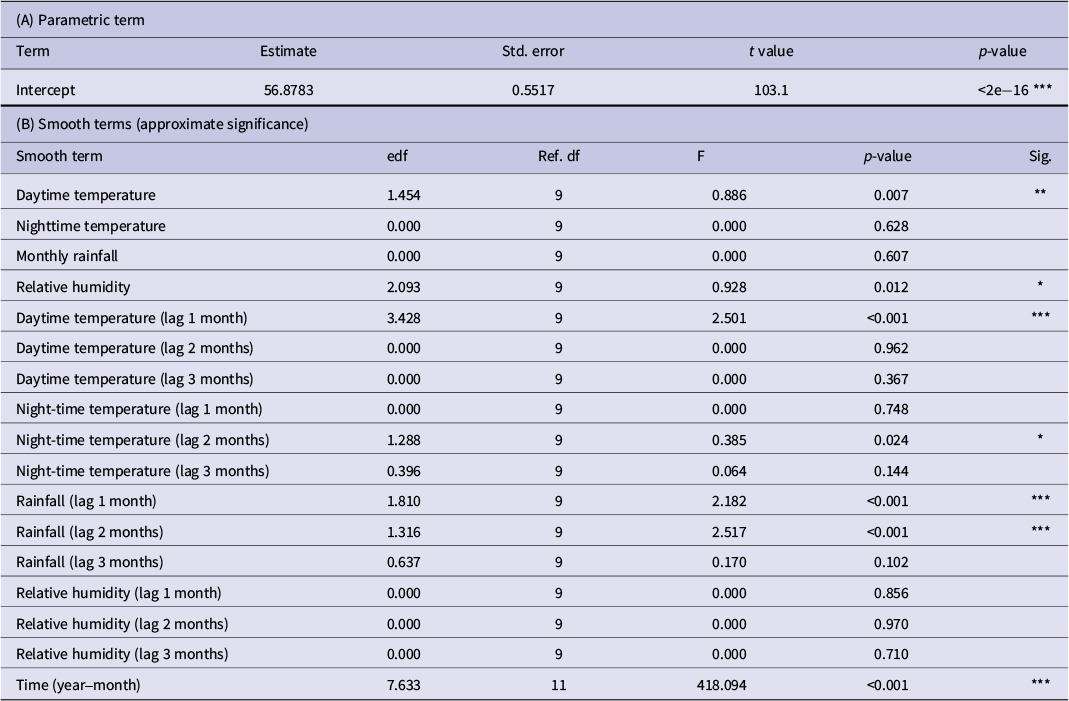
The GAM model achieved an excellent fit, with an adjusted R 2 of 0.975, explaining 97.9% of the deviance in malaria incidence (Table 1). The model included 127 observations spanning the entire period and utilized shrinkage cubic regression splines with restricted maximum likelihood (REML) estimation. The temporal trend component (year-month) was highly significant (edf = 7.633, F = 418.094, p < 0.001), confirming a substantial long-term decline in malaria incidence that is independent of climate effects. This component was included in the analysis structure to accurately capture trends.
Associations between climatic factors and malaria incidence identified by generalized additive models

Table 1 Long description
This table presents the results of the Generalized Additive Model (GAM) analysis. It indicates that the temporal trend (year-month), daytime temperature at a 1-month lag, and rainfall at one- and 2-month lags were highly statistically significant (p < 0.001) in explaining malaria incidence variability.
Family: Gaussian (identity). Smooths: shrinkage cubic regression splines (bs = ‘cs’), REML.
Model fit: Adjusted R 2 = 0.975; Deviance explained = 97.9%; REML = 442.86; Scale = 38.651; n = 127.
Notes: edf, estimated degrees of freedom (non-linearity); Ref.df, reference df for F-test. Significance: ***p < 0.001; **p < 0.01; *p < 0.05.
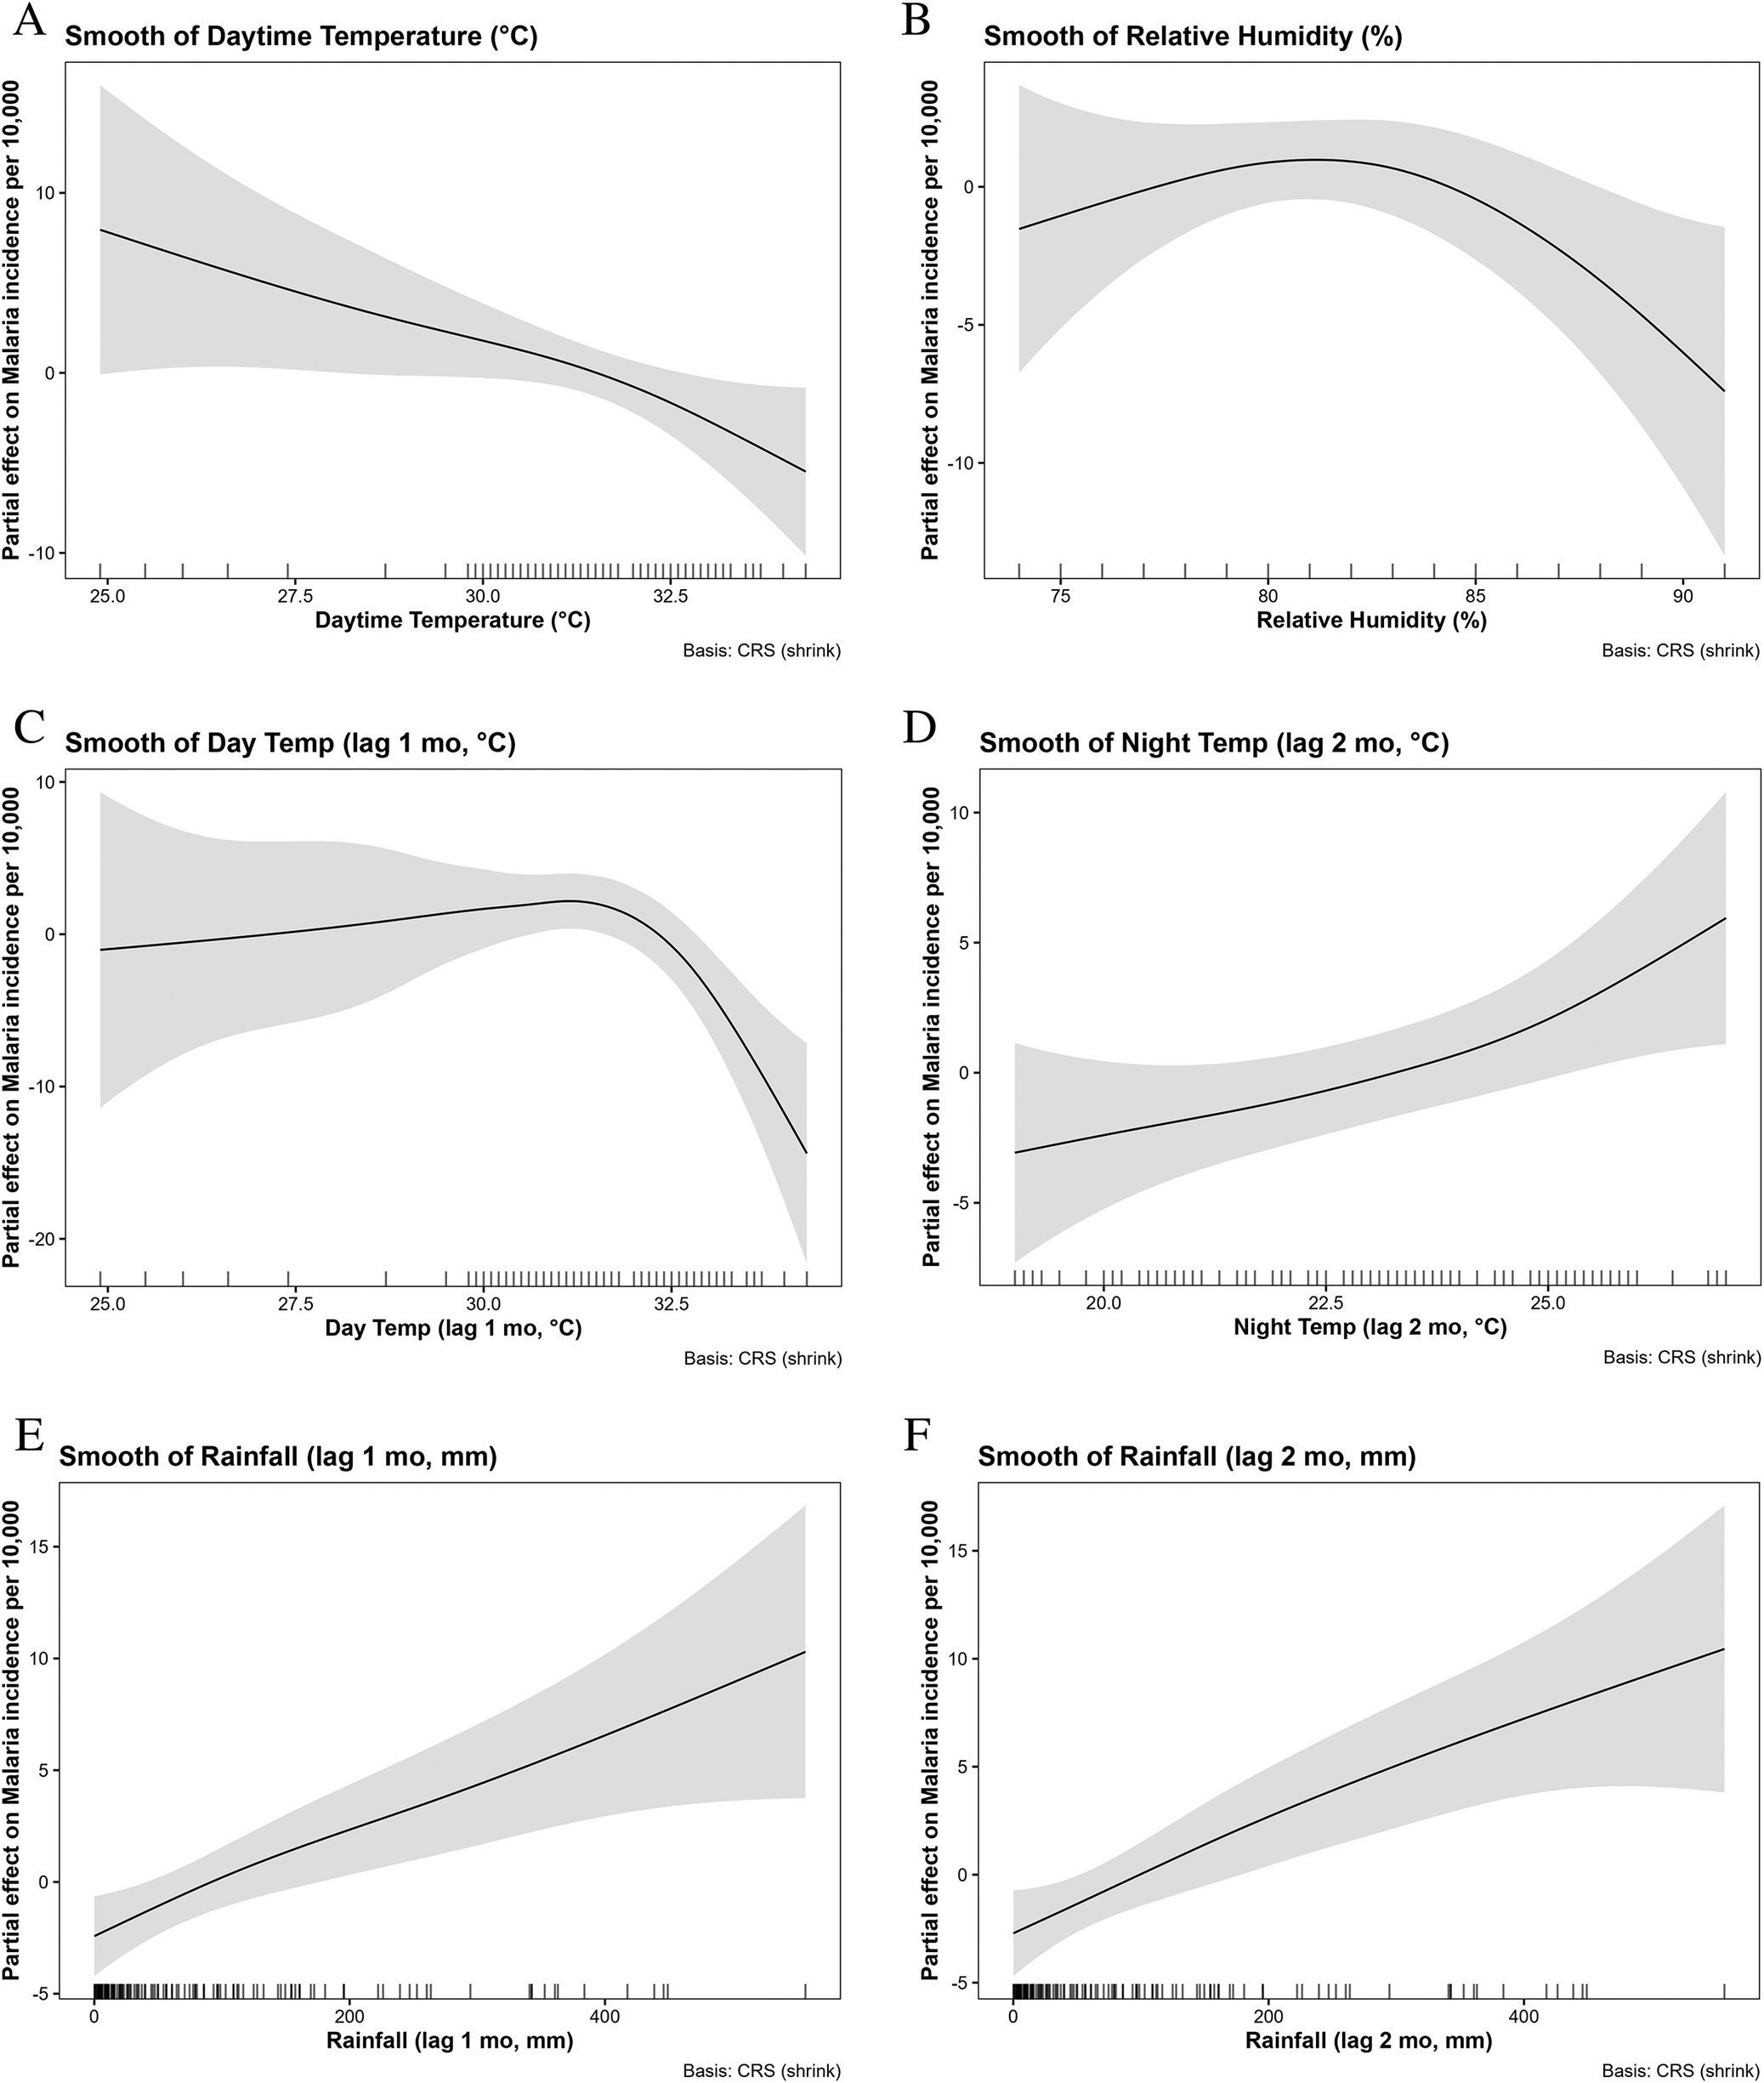
Among the current month variables, daytime temperature exhibited a significant non-linear effect (edf = 1.454, p = 0.007), with malaria incidence declining steadily as temperatures rose from ~25°C to 33°C (Figure 7a). Relative humidity also had a significant non-linear effect (edf = 2.093, p = 0.012), showing a hump-shaped relationship in which incidence increased to around 80%–83% humidity before declining at higher values (Figure 7b). In contrast, the current month’s night-time temperature and rainfall showed no significant effects.
Non-linear associations between climatic factors and malaria incidence identified by generalized additive models: (a) Smooth of daytime temperature (°C); (b) Smooth of relative humidity (%); (c) Smooth of daytime temperature at 1-month lag (°C); (d) Smooth of night-time temperature at 2-month lag (°C); (e) Smooth of rainfall at 1-month lag (mm); and (f) Smooth of rainfall at 2-month lag (mm).

Figure 7 Long description
Six panels (A through F) showing the partial effects of climatic factors on malaria incidence, with shaded 95% confidence intervals. Panel A shows a steady decline in incidence as current-month daytime temperature rises. Panel B shows a hump-shaped relationship for relative humidity. Panel C indicates incidence remains steady then sharply drops after daytime temperature (1-month lag) exceeds 31°C. Panel D shows incidence rising as nighttime temperature (2-month lag) increases. Panels E and F demonstrate robust, positive associations between rainfall and malaria incidence at 1-month and 2-month lags, respectively.
Lagged effects were more pronounced. Daytime temperature at a 1-month lag had the strongest association (edf = 3.428, p < 0.001), with a complex non-linear relationship: Incidence was relatively steady at cooler temperatures, rose to peak values around 31°C, and declined again thereafter (Figure 7c). Night-time temperature at a 2-month lag was also significant (edf = 1.288, p = 0.024), showing a broadly increasing relationship, with malaria incidence rising as night-time temperatures exceeded ~22°C (Figure 7d). Rainfall demonstrated robust positive associations at both 1- and 2-month lags (edf = 1.810, p < 0.001 and edf = 1.316, p < 0.001, respectively), with effects strengthening at higher monthly totals, particularly above 200 mm (Figures 7e–f).
Other lagged climate terms, including daytime temperature beyond 1-month lag, night-time temperature at 1 and 3 months, rainfall at 3 months, and lagged humidity, were not statistically significant and were effectively shrunk toward zero.
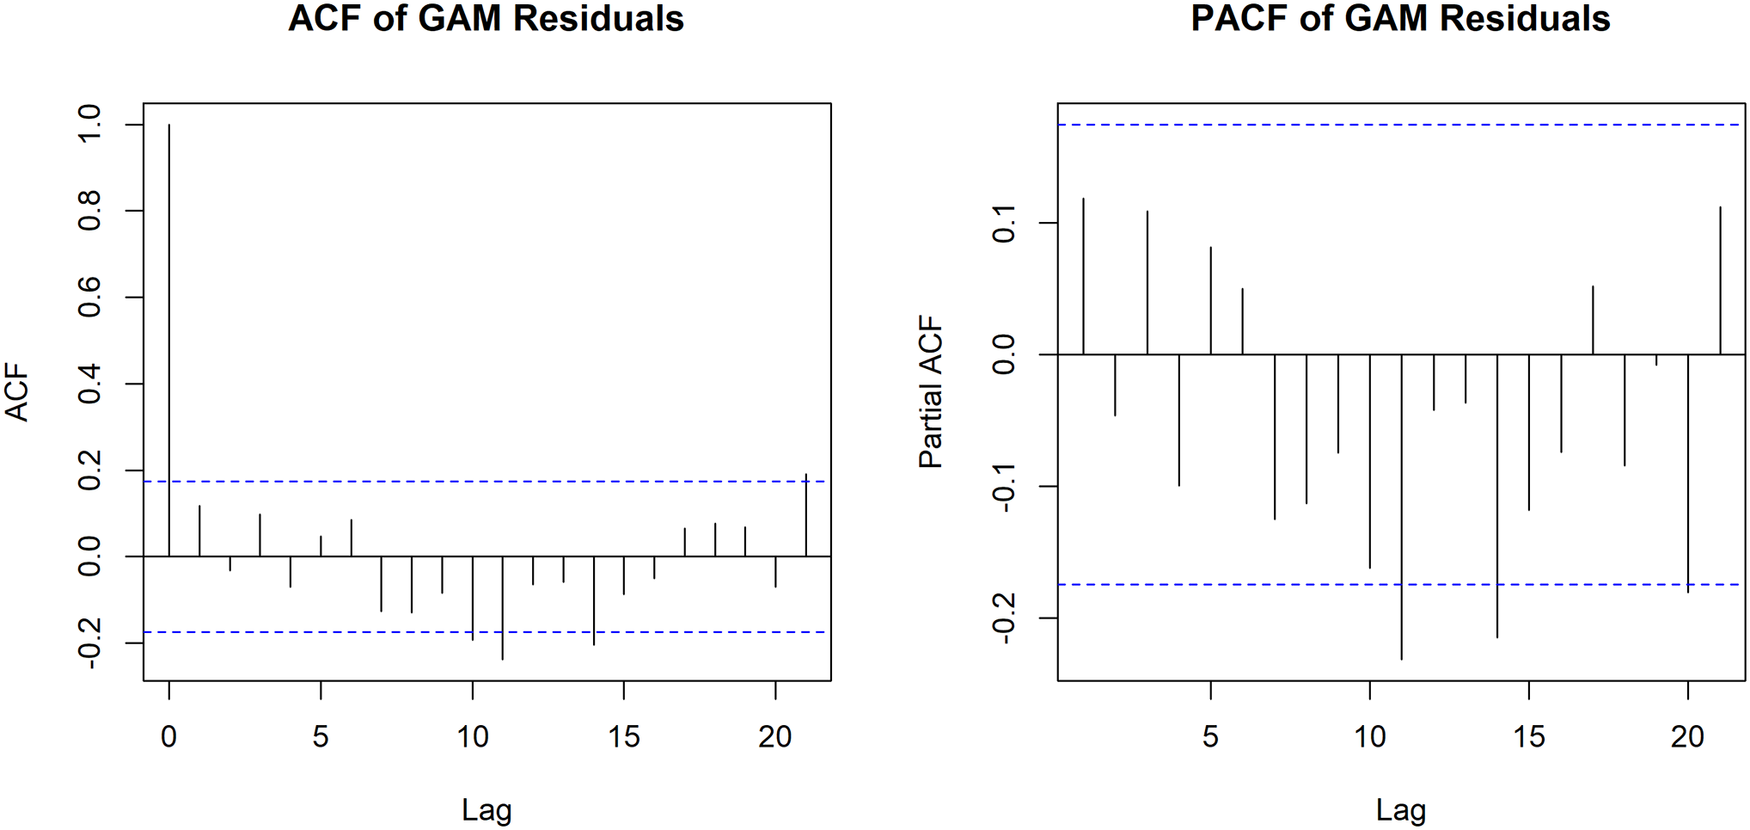
Diagnostic checks of the model residuals confirmed the adequacy of the GAM fit. Evaluation of the autocorrelation function (ACF) and partial autocorrelation function (PACF) plots demonstrated that the residuals were independent, with values falling within the significance boundaries across all lags. This indicates that the inclusion of the highly flexible temporal spline successfully accounted for serial dependence and that no significant residual temporal autocorrelation remained in the model (Figure 8).
Autocorrelation function (ACF) and partial autocorrelation function (PACF) of residuals from the final generalized additive model (GAM) of monthly malaria incidence per 10000 population.

Figure 8 Long description
Two side-by-side bar plots displaying the ACF (left) and PACF (right) of the GAM residuals across 20 lags. Dashed blue lines indicate the significance boundaries. The vertical bars representing the residual values across the lags predominantly fall within these boundaries, indicating that no significant residual temporal autocorrelation remains in the model.
Discussion
In this study, malaria incidence exhibited a general decline from January 2014 to October 2024. This downward trend aligns with findings from several studies conducted globally, which also reported reductions in malaria cases over time. For example, a study in Thailand revealed a non-linear decline in confirmed malaria cases, showing a significant decrease of 96.6% from 1061 cases in 2011 to only 36 cases in 2021 [Reference Pongsoipetch17]. The study considered infections caused by Plasmodium vivax and Plasmodium falciparum. Similarly, in Korea, the confirmed infection rates of P. vivax, P. malariae, and P. falciparum showed a consistent downward trend throughout the study period [Reference Kim18]. These reductions were primarily attributed to differences in geographical conditions and effective control strategies. In contrast, approximately 96% of malaria cases in Tanzania are caused by P. falciparum, which remains the predominant species in the country.
A similar pattern was also observed in Northwest Ethiopia, where malaria prevalence declined by 68%, 60%, and 69% in 2017, 2018, and 2019, respectively, compared to 2014 [Reference Mulugeta19]. The observed reductions were primarily attributed to intensified malaria control interventions, including the large-scale distribution of long-lasting insecticidal nets and the enhancement of surveillance systems. Despite this progress, malaria continues to pose a significant public health concern, particularly in regions where transmission remains persistent.
In contrast, some studies reported an increasing trend in malaria incidence over time. For instance, in Zanzibar, within Tanzania, malaria cases showed annual fluctuations between 2015 and 2020 but generally demonstrated an upward trend [Reference Bisanzio20]. This resurgence may be attributed to the reduced effectiveness of interventions, increased importation of cases due to travel in this popular tourist destination, and the possible influence of climate variability and extreme weather events. Similarly, in the neighbouring country of the Democratic Republic of Congo, malaria prevalence increased steadily over 19 years (2001–2019), with an average prevalence rate of 13246 cases per 100000 individuals at risk, ranging from 1178383 to 1417483 cases [Reference Panzi21]. This persistent increase was likely influenced by changing climatic conditions, including variations in rainfall and temperature, which create favourable environments for malaria transmission.
The STL decomposition revealed a strong annual seasonal cycle, with malaria incidence peaking between April and June and reaching its lowest levels between August and September. This pattern indicates higher malaria transmission during the long rainy season in Dar es Salaam. The period corresponds to the March–May (MAM) rains, with an extended peak into June, suggesting possible shifts in seasonal patterns that may influence malaria dynamics. The positive association between rainfall and malaria incidence is well established, as rainfall enhances mosquito breeding and survival conditions.
Similar seasonal trends have been documented elsewhere. In Australia and Papua New Guinea, malaria transmission increases during the rainy months when vector breeding sites expand [Reference Kuleshov22]. In Pakistan, incidence peaks in March and declines in January and August [Reference Wattoo23], while in Burkina Faso, higher malaria prevalence between July and December has been observed, with September recording the highest incidence during 2013–2020 [Reference Gadedjisso-Tossou, Adjegan and Kablan24]. Comparable studies in Kenya and Uganda have also linked malaria surges to rainfall intensity and humidity, reinforcing the importance of climatic factors in shaping transmission patterns [Reference Nyawanda25, Reference Twinomuhangi26].
The daytime temperature at a 1-month lag had the strongest association with malaria incidence among the variables assessed, exhibiting complex, non-linear relationships with peak values around 31°C, which declined thereafter. Moreover, nighttime temperature at a 2-month lag was also significantly associated with malaria incidence, showing a broadly increasing relationship, with incidence rising as nighttime temperatures exceeded ~22°C. Similarly, a study conducted in Asia and Africa found a positive linear correlation between the annual minimum temperature and the incidence of malaria in Africa [Reference Wang2]. Nonetheless, a strong negative correlation existed between malaria and temperature, particularly at 0- and 1-month lag [Reference Rouamba27]. Likewise, a study in China also exhibited a negative association between temperature and malaria incidence during the first 2 months [Reference Wang28].
The WHO emphasizes that the development and survival of Anopheles mosquitoes are strongly influenced by temperature. Optimal survival occurs between 20°C and 27°C, whereas mortality increases sharply beyond 28°C and becomes lethal above 38°C. Similarly, mosquito biting rates peak within the 20–30°C range but decline substantially below 15°C, reflecting the temperature dependence of the gonotrophic cycle. Notably, some species exhibit ‘gonotrophic discordance’, taking multiple blood meals before oviposition, which enhances transmission potential. Moreover, variations in anthropophilic, endophagic, and endophilic behaviours further influence human vector contact and malaria transmission dynamics [29].
Rainfall demonstrated robust positive associations at both 1- and 2-month lags, with effects strengthening at higher monthly totals, particularly above 200 mm. The relationship may also be influenced by changes in rainfall patterns, where unusual rainfall events result in the proliferation of mosquito breeding sites. Furthermore, mosquitoes reproduce rapidly, with their life cycle from egg to adult typically taking 7 to 14 days. However, depending on food availability and environmental conditions, this duration may prolong. Similarly, a study in Burkina Faso found a substantial positive correlation between malaria and precipitation, with malaria cases developing 1–3 months after precipitation episodes [Reference Sangaré30]. This dynamic highlights a critical distinction between Dar es Salaam and other East African urban centres. Unlike higher-altitude cities such as Nairobi, where temperature fluctuations are the primary limiting factor for transmission, coastal cities such as Dar es Salaam and Mombasa tend to exhibit transmission patterns more closely tied to rainfall variability and seasonality, which influence the availability of mosquito breeding habitats [Reference Castro31, Reference Hay32]. However, the rapid urbanization of Dar es Salaam introduces specific micro-mechanisms such as increased impervious surfaces, inadequate drainage infrastructure, and artificial water accumulation that exacerbate these climatic effects. While our macro-level ecological design did not explicitly measure these urban micro-mechanisms, the robust 1- to 2-month lagged effect of heavy rainfall strongly suggests that urban water pooling creates highly productive, artificial breeding sites. Consequently, a core innovative finding of this study is the conclusive breakthrough that even amidst a 99% intervention-driven decline in a rapidly urbanizing megacity, fundamental non-linear climate sensitivities persist and sustain transmission.
In Ethiopia, a substantial positive association between malaria cases and precipitation with a 4-month lag has previously been reported. Furthermore, a strong contemporaneous relationship was found between rainfall and the overall number of malaria cases [Reference Haileselassie33]. Conversely, studies across several Asia-Pacific countries, including Bangladesh, Bhutan, Indonesia, South Korea, Nepal, Thailand, and Vietnam, have shown that the incidence of malaria is negatively correlated with the annual precipitation [Reference Wang2]. This disparity may stem from differences in data resolution and context, as global climate datasets may not adequately capture localized climatic and ecological variations influencing malaria transmission.
In this study, relative humidity at all lag periods showed no significant association with malaria incidence. This finding suggests that even high humidity levels may not substantially influence malaria transmission when ambient temperatures remain below 18°C or exceed 35°C, as such conditions inhibit mosquito development and survival. Nonetheless, contrasting evidence from other regions suggests that humidity may play a significant role in malaria dynamics. Studies from Ethiopia and West Africa have reported positive associations between relative humidity and malaria incidence [Reference Gbaguidi7]. A 3-month lag in humidity significantly increased the overall number of malaria cases in Ethiopia [Reference Haileselassie33].
Limitations
A primary limitation of this study is the reliance on climate measurements from a single weather station (Julius Nyerere International Airport) to represent the entire 1350 km2 area of Dar es Salaam. The airport station was our best option because it provides the most complete, continuous, and World Meteorological Organization (WMO)-standardized meteorological dataset for the 10-year study period. Furthermore, because Dar es Salaam is situated on a relatively flat coastal plain, it does not experience the extreme elevation-driven microclimates seen in more mountainous East African cities. However, localized microclimatic differences – such as variations in humidity and rainfall between immediate coastal wards and inland suburban districts – inevitably exist. Consequently, relying on aggregated district-level data mapped to a single station may not fully capture these spatial heterogeneities and could underestimate small-area variations in climate-malaria relationships.
Furthermore, the lack of high-resolution spatio-temporal data for non-climatic factors prevented their direct inclusion as covariates. It is highly likely that the near 99% decline in malaria incidence observed during the study period was predominantly driven by the successful scale-up of vector control interventions. While the inclusion of a highly flexible temporal trend spline in our GAM successfully absorbed this long-term decline and statistically isolated the short-term climatic effects, this approach remains a proxy. Consequently, a major limitation of this study is the inability to explicitly model the interaction between intervention scale-ups and climate sensitivity. The lack of these explicit variables means we cannot fully uncouple the synergistic dynamics between aggressive vector control and changing environmental suitability, highlighting a critical area for future ecological studies.
Finally, the reliance on aggregated DHIS2 data introduces potential biases regarding diagnostic consistency and case reporting. While Tanzanian national guidelines mandate the use of standardized malaria rapid diagnostic tests (mRDTs) or microscopy across all health facilities, operational realities and diagnostic capacities inevitably vary between individual outpatient and inpatient institutions. Furthermore, disparities in health-seeking behaviours and potential under-reporting in lower-income suburban wards compared to affluent urban areas could introduce spatial bias, potentially affecting the accuracy of the calculated district-level incidence rates. Future studies incorporating localized socio-economic data and facility-level diagnostic audits are needed to resolve these discrepancies.
Future research directions
This study relied solely on aggregated data from the DHIS2 system, which carries inherent limitations. Future research should consider hospital-based data and incorporate experimental study designs to generate more robust and detailed evidence. Moreover, subsequent studies should adopt a more holistic approach by integrating climate-related variables with other vital determinants such as hygiene and sanitation, vector control interventions, housing conditions, and host immunity. These factors may also play a significant role in shaping malaria incidence and should be examined in conjunction with climatic influences.
Conclusion
This study highlights a massive, statistically significant decline in malaria incidence in Dar es Salaam over the past decade, dropping from a peak of over 130 cases per 10000 population in 2014 to fewer than 30 cases per 10000 by 2023. Despite this near 99% reduction, likely driven by the aggressive scale-up of vector control interventions, malaria transmission remains highly climate-sensitive and continues to exhibit strong seasonal surges. STL analysis revealed consistent annual peaks occurring between April and June, immediately following the March–May long rainy season.
Generalized additive models suggested that lagged rainfall is the most dominant climatic driver of this persistent transmission. Rainfall exhibited robust, positive associations at both 1- and 2-month lags (p < 0.001), with transmission risks accelerating when monthly rainfall exceeded 200 mm. Temperature also played a complex, non-linear role, with a 1-month lagged daytime temperature peaking in suitability at approximately 31°C. These findings underscore the pivotal role of rainfall-driven urban water pooling and highlight the urgent need for climate-informed early warning systems to target the remaining seasonal transmission pockets in rapidly urbanizing coastal cities.
Data availability statement
The dataset and R scripts supporting the findings of this study are publicly available via DOI:10.5281/zenodo.19425050. All relevant materials are accessible without restriction. For further information or inquiries, please contact the corresponding author.
Acknowledgements
We thank the Asian Institute of Technology (AIT), Muhimbili University of Health and Allied Sciences (MUHAS), the District Health Officers in Dar es Salaam, and the Tanzania Meteorological Authority (TMA) for their support of this study. During the preparation of this work, we used Grammarly AI to improve the paper’s readability and clarity.
Author contribution
Conceptualization: I.M., J.G.M., R.P.S. Data curation: I.M. Formal analysis: I.M., J.G.M., K.L., V.O. Investigation: I.M. Methodology: I.M., J.G.M., H.M., R.P.S. Project administration: H.M. Resources: I.M., H.M. Software: J.G.M., K.L., V.O. Supervision: R.P.S. Validation: I.M., J.G.M., K.L., V.O., H.M., R.P.S. Visualization: J.G.M., K.L., V.O. Writing – original draft: I.M., J.G.M. Writing – review & editing: I.M., J.G.M., K.L., V.O., H.M., R.P.S. All the authors have read and approved the final manuscript and agree to be accountable for all aspects of the work.
Funding statement
This research did not receive any specific funding.
Ethical standards
The Institutional Review Board of Muhimbili University of Health and Allied Sciences (MUHAS) approved this research under reference number DA.282/298/01.C/2540. The study used only aggregated secondary data from routine surveillance systems, with no access to or analysis of individual patient identifiers.

 Open access

