


Introduction
For decades political scientists have hotly debated longitudinal trends in political trust rates and their implications for the quality of democracy. Some argue that we witness a structural erosion of political trust (Crozier et al., Reference Crozier, Hungtington and Watanuki1975; Pharr et al., Reference Pharr, Putnam and Dalton2000; Torcal & Montero, Reference Torcal, Montero, Torcal and Montero2006). Others challenge this idea, arguing that longitudinal trends follow trendless fluctuations (Levi & Stoker, Reference Levi and Stoker2000; Norris, Reference Norris2011; Van Ham & Thomassen, Reference Van Ham, Thomassen, van Ham, Thomassen, Aarts and Andeweg2017). Some consensus exists about a structural decline of political trust in countries such as the United States between 1960 and 1980 (Citrin & Stoker, Reference Citrin and Stoker2018) and regions such as Central and Eastern Europe after the democratic transition in the 1990s (Zavecz, Reference Zavecz, Zmerli and van der Meer2017). However, such consensus is absent for trends in longstanding democracies in most other regions, including Western and Southern Europe.
Because any short‐term downward trend potentially indicates the beginning or re‐emergence of a broader political trust crisis, the trend debate has become never‐ending (Thomassen, Reference Thomassen, Poguntke, Roßteutscher, Schmitt‐ Beck and Zmerli2015). The concern can be broken down into two elements: (1) the structural decline of political trust, and (2) the assumption that such a decline is problematic. This combination fuels the discussion, whenever political trust is in recess.
Yet, declines in political trust are not inherently problematic. While decreasing trust can signal alienated or cynical citizens who detach from democratic institutions, it can also signal the engagement of critical citizens who monitor democratic institutions. Political trust in part reflects qualities of the object of trust – democratic institutions – such as quality of government, proportional representation, output performance and recurrent elections (Marien, Reference Marien2011; Van Erkel & Van der Meer, Reference Van Erkel and van der Meer2016).
This has important implications. On the one extreme, political trust may decline in direct response to the objects’ declining political trustworthiness (scandals, recession). Declining trust rates are then the canary in the coalmine, signalling a problem of trustworthiness but not a fundamental disconnect of citizens. Rather they reflect a critical, monitoring citizenry (Norris, Reference Norris2011). On the other extreme, political trust may decline more strongly than expected based on political performance, remain low even as performance recovers or decline without any clear change in political performance at all. In such instances, low political trust rates indicate the rise of unresponsive distrust or alienation that is more difficult to correct.
The emphasis on simple, aggregate trends in political trust obscures this crucial difference, and is an important reason why the crisis debate is constantly reinvigorated. This research note proposes a more informed way of engaging in this debate; a methodological tool to assess empirically to what extent trends in political trust follow expectations (responsive to democratic performance) or are instead worrisome (unresponsive to performance): residuals to multilevel explanatory models of longitudinal changes in political trust. These residuals enable us to isolate to what extent observed trust rates diverge from expected trust rates, as deduced from object‐driven explanatory models of political trust. We illustrate the relevance of this tool on the Eurobarometer data before and after the Great Recession (1999–2019), as well as on other datasets as a robustness check.
Object‐driven explanations of political trust
Political trust is driven both by traits of the subjects who trust (citizens) and by traits of the object that is trusted (democratic institutions). We can identify three main sets of explanations that find their roots in the object of political trust itself. First, structural explanations are at the root of relatively consistent cross‐national differences. Corruption is the most prominent of these explanations (Dahlberg & Holmberg, Reference Dahlberg and Holmberg2014); the electoral system provides another, weaker explanation (Marien, Reference Marien2011). Second, long‐term longitudinal explanations help us understand within‐country fluctuations of political trust over time. Most notably, they include economic performance, endemic corruption scandals and elections and government formations (Ares & Hernandez, Reference Ares and Hernandez2016; Van Erkel & Van der Meer, Reference Van Erkel and van der Meer2016). Finally, short‐term explanations explain sudden spikes and drops in trust by specific events or by specific leaders’ popularity. The structural and longitudinal explanations provide the benchmark to which we can interpret actual trends in political trust.
The Great Recession and the following European debt crisis had a particularly large impact on political trust in Europe after 2008 (Kroknes et al., Reference Kroknes, Jakobsen and Grönning2015). Political trust rates plummeted, particularly in countries hit hardest by the crisis, such as Spain and Greece (Ellinas & Lamprianou, Reference Ellinas and Lamprianou2014; Torcal, Reference Torcal2014). The decline in political trust in the years after 2008 reflected the severity of the recession itself (Obydenkova & Arpino, Reference Obydenkova and Arpino2018; Van Erkel & Van der Meer, Reference Van Erkel and van der Meer2016) rather than participation in the European Union‐led bail‐out programmes (Cordero & Simon, Reference Cordero and Simon2016; Schraff & Schimmelfennig, Reference Schraff and Schimmelfennig2019). The effect of economic recovery on political trust received less attention in the literature. Hooghe and Okolikj (Reference Hooghe and Okolikj2020) show that political trust generally improved as economies recovered and do not find evidence that trust is more responsive to economic recession than to recovery. Yet, this general pattern may not hold in all countries. Fear for structural disconnect between citizens and their democratic institutions was highest in countries hit hardest by the Great Recession and the subsequent debt crisis. Torcal and Christmann (Reference Torcal and Christmann2021, p. 11) argue that trust in representative institutions in Spain remained low despite the economic recovery after the Great Recession: ‘The crisis might have served as a performance test for the Spanish democracy, the perceived failure of which led to a decline in peoples’ evaluations of the responsiveness of the political system, which, combined with a series of political corruption incidents hindered the recovery of trust in representative institutions’.
It is precisely these types of arguments – whether declines in trust indicate structural alienation with democratic institutions or simply responsiveness to institutional performance – that we can and should disentangle. The tool we propose serves that purpose.
Method
The model
Whereas explanatory models of longitudinal data allow us to test hypotheses, residuals to these models form a way to deepen our understanding of the underlying trends. First, they indicate model imperfections, allowing for a more comprehensive set of determinants. Second, they provide a starting point to identify and interpret case‐specific peculiarities, such as scandals that briefly affect political trust rates (Ares & Hernandez, Reference Ares and Hernandez2016). Third, and crucial to this contribution, they enable the comparison of empirical trends against modelled expectations, based on performance indicators of the object. The proposed residual analyses become more useful when the explanatory model (1) is more comprehensive, (2) contains more measurement points and (3) employs a rather‐similar systems design with many countries.
The first step entails the estimation of expectations based on the performance of the objects of political trust. For that purpose, we require multilevel models on a repeated cross‐national, longitudinal dataset with frequent time points (cf. Bargsted et al., Reference Bargsted, Somma, Castillo, Zmerli and van der Meer2017; Hooghe & Okolikj, Reference Hooghe and Okolikj2020; Van Erkel & Van der Meer, Reference Van Erkel and van der Meer2016). To isolate within‐country longitudinal fluctuations, we eliminate all cross‐national varianceFootnote 1 and joint wave varianceFootnote 2 from the explanatory models (via dummy variables for countries and for survey waves, and by centring the contextual independent variables on the country mean) so that the only remaining levels of variance are that of individuals (level 1) nested in country‐waves (level 2).
To illustrate the use of residual analyses, this research note estimates models with relatively basic assumptions. First, people within each country hold relatively constant longitudinal benchmarks over time. While this is an effective assumption (cf. Bargsted et al., Reference Bargsted, Somma, Castillo, Zmerli and van der Meer2017; Hooghe & Okolikj, Reference Hooghe and Okolikj2020; Van Erkel & Van der Meer, Reference Van Erkel and van der Meer2016), the model can be extended with more complex assumptions that allow benchmarks, effect sizes and time lags to change with time. Second, the explanatory models contain a comprehensive set of longitudinal determinants of political trust (cf. Van Erkel & Van der Meer, Reference Van Erkel and van der Meer2016): economic performance, corruption, government status and elections. While comprehensive, this list of object‐driven determinants is imperfect, as scholars still lack complete understanding of determinants of trust, and their conditionality across time and systems. Nevertheless, the explanatory model functions as a better benchmark to assess empirical trends than simple descriptive figures. Moreover, the tool we introduce here can be tested for its robustness and modified in response to new insights. Our conclusions are, for instance, robust to the inclusion of an interaction between perceived corruption and economic performance measures (Obydenkova & Arkino, Reference Obydenkova and Arpino2018; Torcal, Reference Torcal2014). One aspect of the multilevel models requires specific attention, namely influential cases at level 2. A single country‐wave (or a small group of country‐waves) can disproportionally affect the estimated effects, directly impacting the residuals. Hence, we re‐estimate models that eliminate their influence via fixed dummies.
The second step is the estimation of the residuals to the explanatory model, that is, the extent to which individual country‐wave combinations have higher or lower political trust rates than model expectations. We present these residuals in trend figures to assess longitudinal patterns. Because residuals at level 2 are shrunk to the mean (reflecting the uncertainty in their multilevel estimates – especially when L1‐variance is high and L2‐variance is low), these residuals cannot be interpreted in absolute terms. Yet, we can interpret their direction, trend, duration and relative size.
Data: Eurobarometer
We illustrate our tool by replicating the model of Van Erkel and Van der Meer (Reference Van Erkel and van der Meer2016). We extend that model with waves after the onset of the Great Recession. Otherwise, we stay as close as possible to that model specification to estimate residuals.
Our main analyses therefore rely on the Eurobarometer, a repeated cross‐sectional survey that covers the different European Union (EU) member states. Like VE&VdM, we focus on the 15 traditional EU member states, who were all a member at the start of our data collection in 1999. Items on political trust were included on a mostly biannual basis. Hence, the Eurobarometer includes 37 waves between the Spring of 1999 and the Spring of 2019, except for Greece (which lacks a wave in 1999) and the United Kingdom (which lacks the final two waves, due to the exit from the EU).Footnote 3 The sample contains 465,981 respondents (L1) in 552 country‐wave combinations (L2).
Our political trust measurement is based on two dichotomous items: ‘Do you tend to trust or not tend to trust the national government?’ and ‘Do you tend to trust or not tend to trust the national parliament?’ In line with VE&VdM we code respondents as trusting when they trust both institutions. Lack of trust in either institution indicates mistrust. Since the dependent variable is dichotomous, we employ logistic regression analysis.Footnote 4
Economic performance is measured via unemployment rate, economic growth, inflation rate and balance of the government budget; all reported by Eurostat. Level of corruption is measured via the corruption perception index (CPI) of transparency international; high scores indicate low levels of perceived corruption. The representative element of democracy is measured as parliamentary elections (in the last 6 months) and the formation of a new government (in the last 6 months). All longitudinal determinants are included with a 6‐month lag before the individual level survey data.Footnote 5 At the individual level, the models control for age, gender, employment status and years of education. Missing values are eliminated listwise. For an overview of the operationalization and distribution of the L1 variables, see Supporting Information Appendix A.
Results
Descriptive trends
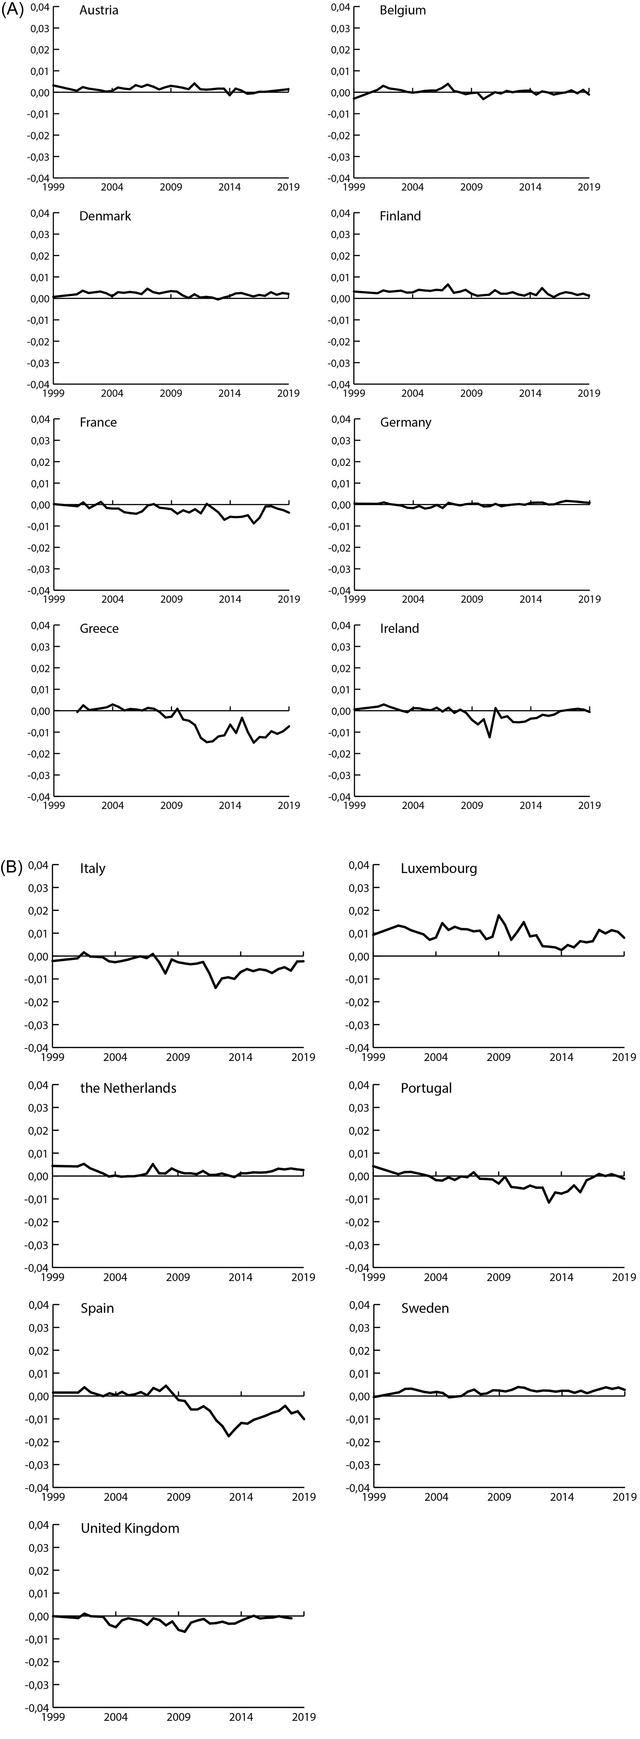
Figure 1 shows the residuals for every country‐wave combination in an empty regression model, that models variance at all three levels of analysis (individuals, within‐country changes, between‐country differences). We cannot interpret these residuals in an absolute sense, as multilevel models tend to shrink them to the mean: for instance, the seemingly small residuals in Germany reflect fluctuations over 25 percentage points (for the raw trust rates, see Supporting Information Appendix B).
Trust in government and parliament, residuals to empty model (descriptive), Eurobarometer 1999—2019.

Figure 1 serves as a baseline for the substantive analyses. Political trust is structurally higher in some countries (e.g., Luxembourg, Finland and Denmark) than in others (e.g., France, Italy and the United Kingdom). Yet, this study is primarily concerned with the trends in the residuals. The trend in countries such as Germany and Sweden do not suggest strong impact of the Great Recession on trust rates after 2008. Other countries, such as Portugal and Ireland, experienced strong, declining trust rates after 2008 but recovered by 2015. Finally, in a third group of countries trust rates fell after 2008 but never recovered to pre‐recession levels. This is most evident in Greece and Spain, and possibly France (where trust rates remained depressed besides a peak in 2017).
Explanatory model of longitudinal variance in political trust
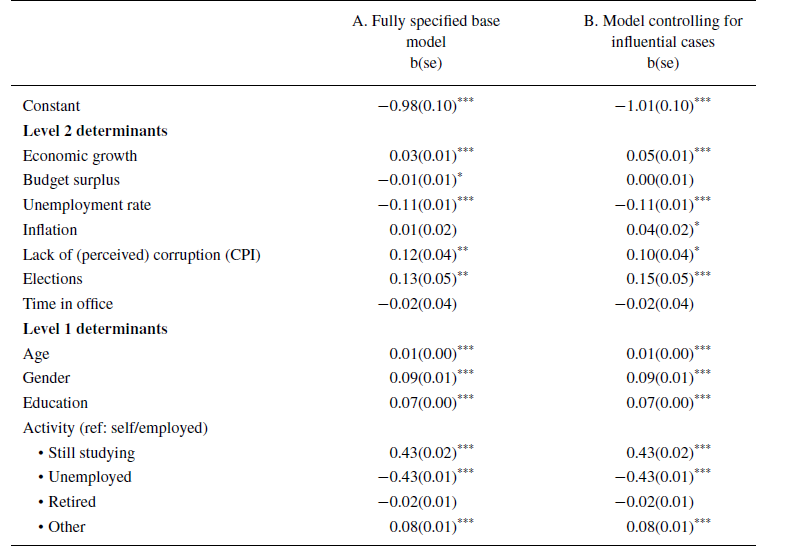
The differential decline after 2008 seems to align with the severity of the economic downturn, which was much more severe in some countries than others. Our multivariate, explanatory model between 1999 and 2019 confirms these empirical regularities. Model A in Table 1 shows the estimates of the multilevel logistic regression analysis that isolate within‐country fluctuations, without correction for influential cases; Model B, the estimates after correction for influential cases.
Multilevel logit random intercept models

nlevel2:552; nlevel1:465,981
Note: controlling for country and EB‐wave dummies
The results strongly mirror the conclusions of VE&VdM and other studies. We find a substantial and robust positive effect of economic growth and a substantial and robust negative effect of unemployment rates on political trust. Budgetary deficits and inflation rates have less consistent effects on political trust.Footnote 6 Additionally, political trust gets a boost in response to declining corruption perceptions and in response to recent parliamentary elections; new governments do not provide an additional boost in political trust.
Citizens thus respond to traits of the object of trust. This provides the crucial baseline to which to compare the trends in the 15 countries. Our diagnosis of the state of political trust depends on the extent to which low political trust rates are aligned with model expectations, or instead systematically underperform in comparison to these expectations.
Residuals
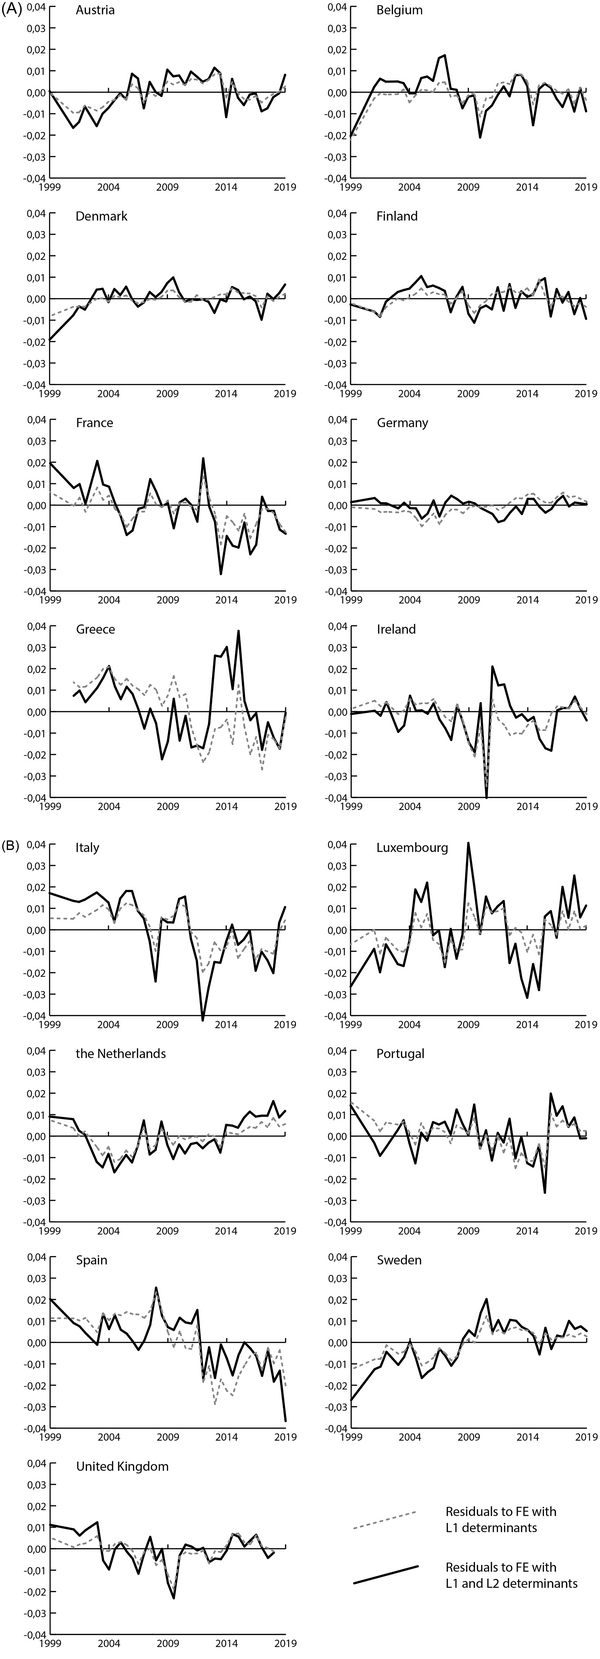
Figure 2 shows two sets of residuals for each country. The grey interrupted lines represent the residuals to the model without the seven object traits from Table 1 (but with fixed effects and individual level determinants). The black uninterrupted lines represent the residuals to the model where these seven object traits were included as determinants. We cannot directly compare the sizes of these lines, as they are derived from different logistic models.
Trust in government and parliament, residuals to model A (fully specified model), Eurobarometer 1999–2019.

One benefit of residual lines is their insight into country‐specific peculiarities. Because general patterns (cross‐national trends, composition effects and the estimated effects of the object traits) are isolated in the model, the residuals reveal short‐term peaks and drops more clearly. Sudden large residuals provide an indication that a single event briefly affected political trust rates. Figure 2 shows examples of these in France (spikes during the presidential elections of 2002, 2007, 2012 and 2017)Footnote 7, Portugal (drop during the stagnating government formation in late 2015), Italy (drop after the breakdown of the government coalition in November 2011) and Belgium (drops in 2010 and 2014 during stagnating government formations). The identification of ad‐hoc drops and spikes is a first use of residual analysis in longitudinal trust research.
Yet, the second benefit of residual analysis is crucial to this research note: signalling longer trends towards or away from object‐based expectations. In most countries the residuals show trendless fluctuations: there is no middle‐ or long‐term trend in which trust rates increasingly diverge from expectations for a longer period of time. This suggests that, generally, the explanatory model tends to work as well before the Great Recession as it did during years of economic decline and recovery. In most countries the drop in political trust during the Great Recession can be attributed to critical citizenry, who responded to bad performance but restored their trust in the face of (economic) recovery. These countries experienced upward and downward fluctuations, but no structural disconnect.
Two countries form clear exceptions: France and Spain. In France, political trust rates eroded slowly after 2008 (despite short‐lived peaks in 2012 and 2017, coinciding with presidential elections). Yet, political trust began lagging behind model expectations more systematically after 2012. The decline cannot be blamed solely on the notorious unpopularity of President Hollande. Political trust peaked briefly around the election of President Macron in 2017, but did not structurally recover. Rather, the presidential election peak itself was substantially lower in 2017 than in previous election years.
In Spain, trust rates dropped with the start of the Great Recession in 2008 (Figure 1), but only began to lag behind expectations after 2010 (Figure 2). Political trust remained lower than model expectations ever since. This echoes Torcal and Christmann (Reference Torcal and Christmann2021), who identified a lasting disconnect in response to the corruption scandals in the early 2010s.
Greece paints a more ambiguous picture. Although political trust rates dropped severely during the severe economic crisis (Figure 1), Greek trust rates from 2013 until 2015 are higher than expected from the explanatory model (Figure 2). This suggests that the vast decline in trust in Greece during the Great Recession was not structurally out of line with what one could expect from economic performance. Yet, the two divergent residual lines may also reflect a potential limitation of the model: bottom effects due to the immense crunch of the Greek economy, extreme unemployment rates, problematic government finances, and bailout. The two residual lines only converge by late 2016, remaining mostly negative in the few years since.
Eliminating the influence of influential cases
Visual inspection suggests three clusters of influential cases: Ireland 2010Q3 until 2011Q3 on GDP growth, Ireland 2015Q3 until 2016Q3 on budgetary deficits, and Greece 2013Q1 until 2014Q1 on unemployment rates. When eliminating the influence of these cases by controlling for them via dummies (Model B, Table 1), we find some changes to the estimates. Most notably, the effect of budget deficit loses significance, whereas the effect of inflation becomes significant.
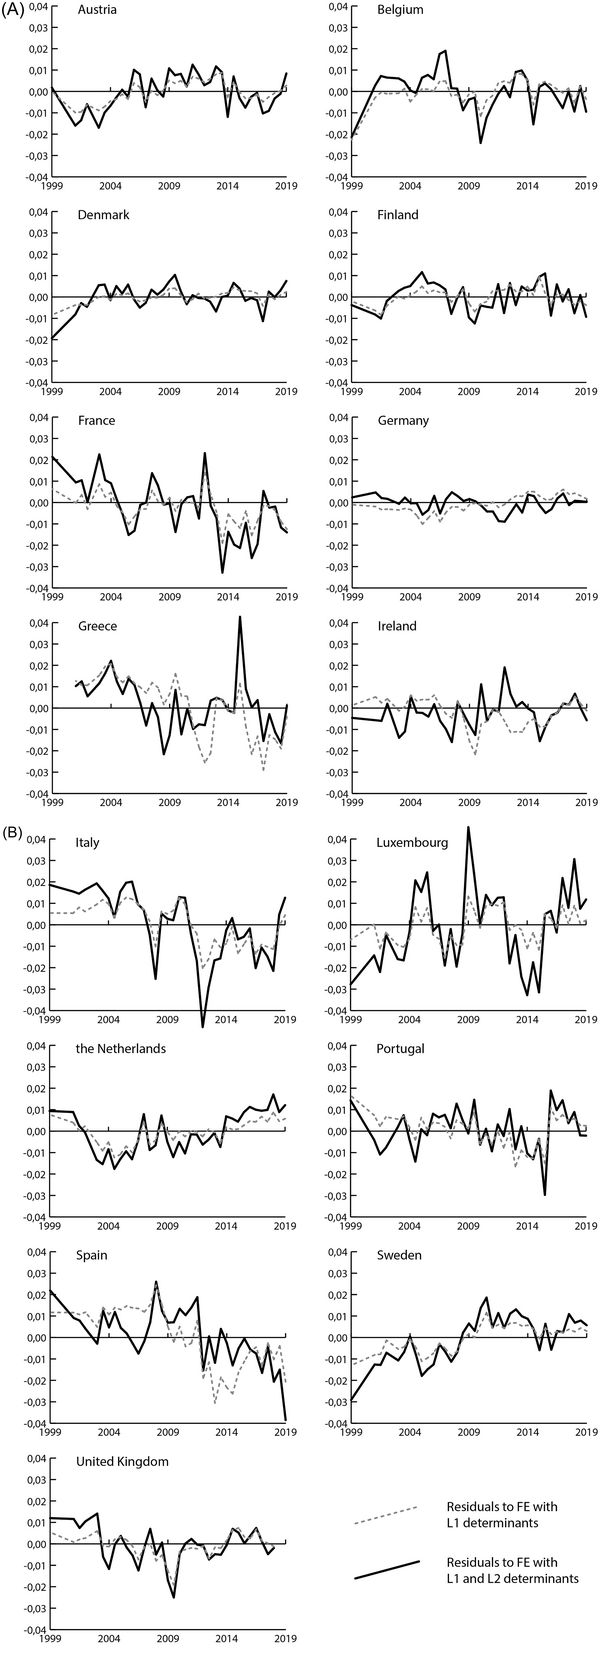
Figure 3 shows the residual lines to the models that control for the influential cases. Despite changes in the estimated effect sizes, the residual lines are remarkably similar – except evidently for Greece and Ireland. France and Spain continue to stand out as countries with lower than expected political trust rates, whereas we do not find such a clear residual trend for the already ambiguous‐at‐best case of Greece.
Trust in government and parliament, residuals to model B (controlling for influential cases at L2), Eurobarometer 1999–2019.

Other robustness checks
We performed three more checks on the robustness and versatility of the instrument. First, we tested the model on a different dataset, the European Social Survey, with a similar setup but with fewer and more selective time points (see Supporting Information Appendix C). While we reach substantively very similar conclusions, the lack of detailed coverage across countries and time makes the residual analyses in the European Social Survey less rigorous compared to the Eurobarometer.
Second, we test the model on eleven Central and Eastern European countries in the Eurobarometer between 2004 and 2019 (see Supporting Information Appendix D). The explanatory model works well. Although the residual analyses do not suggest clear red flags, political trust lags somewhat behind model expectations in two countries: Romania and Slovakia.
Third, we ran separate models for trust in government and trust in parliament on the Eurobarometer data (see Supporting Information Appendix E). We reach highly similar conclusions.
Conclusion
Political science research is engaged in a perpetual debate whether downward trends in political trust signal a crisis and are thus a cause for concern (Thomassen, Reference Thomassen, Poguntke, Roßteutscher, Schmitt‐ Beck and Zmerli2015). To break out of that loop, we need to distinguish unresponsive distrust from critical distrust. The former reflects an alienated citizenry that distrusts despite the actual performance of democratic institutions. The latter reflects a monitoring citizenry, whose political trust waxes and wanes in response to the institutional performance. Whereas the former is an inherent cause for concern with a disconnect, the latter is merely the canary in the coalmine that signals problems with the trustworthiness of the object.
Descriptive trends cannot distinguish between the two. This research note provides a more informed way to understand trends in political trust, by focusing on residuals to well‐fitting explanatory, multilevel models of cross‐national, longitudinal data. Residuals reveal whether a country's trust rate systematically underperforms in comparison to the explanatory model (warning sign of excessive distrust) or not (signalling responsive distrust).
We illustrated the usefulness of these residual analyses on two European cross‐national, longitudinal datasets between 1999 and 2019. We find two red flags – France and Spain – where political trust failed to recover after the Great Recession, even in light of improving economic and institutional performance. This suggest an enduring disconnect between citizens and their democratic institutions. Possibly, the combination of economic recession and corruption scandals ruptured public trust (cf. Schraff & Schimmelfennig, Reference Schraff and Schimmelfennig2019, p. 373; Torcal & Christmann, Reference Torcal and Christmann2021). Yet, we find largely responsive trust rates in other countries that suffered harshly from the recession; residual trust rates in Ireland and Portugal – and more ambiguously Greece – rebounded after the Great Recession in line with rising institutional performance. This suggests engaged and critical citizens who continue to respond to the trustworthiness of the object.
Modelling residual trends
Residual analyses to multilevel, explanatory models of cross‐national, longitudinal data help making sense of country‐specific trends in political trust. They can flag when political trust lags behind what we would expect from the object's performance.
Yet, these analyses can only be informative under specific requirements. First, they require a rather firm grasp of the object‐driven determinants of political trust, such as output performance and quality of governance. The more comprehensive our understanding of (the timing and conditionality of) object‐driven explanations of political trust, the more informative the residual trends to substantive research. To the extent that scholarly inquiry on object‐driven explanations is unresolved, residual analyses are less useful to understand trends in political trust. Disruptive events affecting a large number of countries, such as the Covid‐19 pandemic (cf. Bol et al., Reference Bol, Giani, Blais and Loewen2021; Schraff, Reference Schraff2021) or the threat of war in 2022, also affect model estimates. During such events, residual analyses still help to signal empirical patterns, but are less useful to distinguish responsive from nonresponsive (dis)trust.
A second requirement is the rather detailed coverage of country‐wave combinations. Residual analyses provide more insight when the number of time points and countries is large, given sample quality. Lack of coverage makes residual analyses more sensitive to the timing of data collection, and less useful to disentangle long‐term trends from short‐term fluctuations. By the nature of residuals, long‐term trends are more useful indicators of potential red flags than short‐term fluctuations. Selective lack of coverage – when countries’ participation in the survey is not independent from the model – can even undermine the validity of the model.
Third, the approach faces a limitation. We cannot interpret the cluster level residuals in multilevel research in absolute terms. Yet, we do not need to. Instead, we can interpret their direction, trend, duration and relative size.
Beyond these requirements, the tool we introduced is versatile. One can adapt assumptions to the regression models (e.g., missing values), model the residual trends themselves (linearly or non‐linearly), make L2 effects conditional (e.g., on expectations or other benchmarks), focus on specific subgroups of respondents (such as sophisticated or interested citizens), apply the tool to trust in local or supranational government (cf. Close et al., Reference Close, Dodeigne, Hennau and Reuchamps2023, but see De Blok et al., Reference De Blok, van der Brug and van der Meer2022) or extend the model. We propose two such extensions. First, residual analyses may be used not only to assess lower‐than‐expected levels of trust, but also levels of trust that are higher than expected. Blind trust in politics (overconfidence), too, can pose a risk to democracy, for instance by encouraging support for far‐reaching policies (Hetherington & Nelson, Reference Hetherington and Nelson2003). Second, we can consider models that allow the estimation of object traits to simultaneously explain not only within‐country changes but also between‐country differences, such as random effects within‐between (REWB) models (Bell et al., Reference Bell, Fairbrother and Jones2019). Residuals to these models would provide different insights to those presented above.
All in all, our analyses suggest that in most countries under study, the trends in political trust tend to reflect political performance. Generally, we find no growing disconnect between citizens and democratic institutions. Only France and Spain offer reasons for concern. Their political trust rates are not only low in absolute numbers, but also lag behind the rates that we would expect given the performance of their democratic institutions.
Acknowledgements
We would like to thank the participants of the October 2020 online conference on political trust as well as the anonymous reviewers for their comments.
Conflict of Interest
The authors declare that the research was conducted in the absence of any commercial or financial relationships that could be construed as a potential conflict of interest.
Ethical Approval
As this paper relies exclusively on secondary data from renowned sources (Eurobarometer, European Social Survey), the project required no separate ethics approval by the Ethics Approval Board of the Amsterdam Institute for Social Science Research according to its guidelines.
Data availability statement
All data sets used in this study are publicly available. Data and code for replication purposes are submitted to the EJPR.
Funding information
This work was supported by the Dutch Science Foundation NWO (Grant Number 452‐16‐001, 2016).
Online Appendix
Additional supporting information may be found in the Online Appendix section at the end of the article:


 Open access