

In and outside Iran, a popular consensus has emerged that the Islamic Republic is waging a war on wages. Online graphs depicting the declining value of the minimum wage since 1979 have become as ubiquitous, and as much clickbait as visualizations of the decimation of the rial. Commentators on the left and the right often interpret wage suppression as part of a broader neoliberal project, one that has encountered limited institutional resistance due to the ways in which societal interests are captured, commandeered, and articulated by regime-linked entities. For example, in a book coauthored with an Iranian activist-in-exile, Andreas Malm, who later gained prominence for How to Blow Up a Pipeline, describes “the Pasdaran’s [Revolutionary Guards] control over the working class” through the “monopoly held by the Workers’ House on ‘labor representation.’”Footnote 1 Similarly, Alireza Nader, writing for RAND, a conservative think tank, argues that “the Islamic Republic has kept close tabs on the labor class through government-monitored, ideologically centered unions,” resulting in “salary cuts and mass layoffs of low-skilled laborers.”Footnote 2
Yet, inside the Islamic Republic, formal labor leaders, state-licensed employer delegates, and government officials almost uniformly agree that wages are too low. Across factional lines, these insiders advocate for higher minimum wages as a means to stimulate domestic consumption and production. In recent negotiations, one labor leader claimed that “the official [minimum] rate is one of the lowest wages in the world.”Footnote 3 After agreeing to an almost 50 percent increase in minimum wages, a senior employer delegate emphasized that “labor is the most important component of production for employers,” adding, “The peace of mind of our human resources and their productivity are very important to us; a workforce that is at peace has better productivity and efficiency for companies and improves growth prospects.”Footnote 4 This cross-elite support for nominal wage growth is guided, in part, by the Supreme Leader. In public addresses, Khamenei has reiterated that in Islam, work and workers possess “intrinsic value.”Footnote 5 He has called for increasing the share of wages in production costs “in a way that does not harm the employer,” arguing that such a balance “will encourage the worker.”Footnote 6 For Khamenei, wage-earners, through “companionship, harmony, and cooperation” with employers and “entrepreneurs,” can realize the “resistance economy.”Footnote 7
In this context, the Supreme Labor Council (Shuwra-yi ʿAli-yi Kar, hereafter SLC), the central body that, each year, sets the national minimum wage, has become the site of intractable conflict. In early 2025, one labor leader argued that a minimum wage increase, high in the double-digits, would vanish “as rapidly as the February snow on the mountains [surrounding Tehran]” due to “unbridled inflation and the sharp rise in the price of gold and foreign exchange.”Footnote 8 Government experts have called for reform, rejecting “the way that attempts are made exclusively at the end of each year and in long and intensive meetings to conclude the important issue of minimum wage setting through bargaining.”Footnote 9 The Chairman of the Social Commission of the Majles, after declaring that “inflation is our red line in determining workers’ wages,” hinted at the sources of contention: “The decision-making of the Supreme Labor Council affects about 65 percent of our society today; therefore, [minimum wages] must be very carefully calculated and made in accordance with the existing conditions in the interest of people’s livelihoods (ṣufrihhā-yi mardum).”Footnote 10
This article analyzes the politics of pay in the Islamic Republic. I argue that the concentration of authority in the SLC obscures the extent of conflict over wage distribution and the involvement of diverse actors, both within and outside the state. Rather than a regime bent on retrenchment, labor discipline, and wage repression, the Islamic Republic resembles an unruly wage containment state: a state in which ruling elites utilize centralized price-setting institutions to manage popular demands for higher pay.
Wage containment is not unique to Iran. In recent decades, low wage growth has become the global norm rather than the exception. In contemporary Iran, however, the wage question is especially politicized. Labor market price-setting is highly centralized, rigid, and comprehensive, determined through negotiations among nonmarket actors within the SLC. These actors are not only broadly unrepresentative of the constituencies they claim to speak for (employers, workers, and citizens), but they also lack power, inviting massive outside interference. Even if they claim to advocate for the interests of Iranian workers and entrepreneurs, state elites clash routinely over how those constituencies are best served.
Systemic conflicts over wage-setting are the product of three characteristics that define the Iranian containment state. The first involves historical legacies. Introduced in the mid-1940s in response to secessionist-communist threats, price-setting institutions were expanded in the 1960s and 70s as technocratic mechanisms aimed at wage moderation. Modeled on Western systems, similar institutions—like tripartism and collective bargaining—exist on paper in many other MENA countries. But even as the technocratic veneer has long eroded, legacies of Arab socialism in much of the region led to more top-down, partisan control over policymaking than in Iran. Whereas many MENA countries undertook reforms of their wage-setting institutions during the 1990s and 2000s, Iran, less beholden to foreign institutions and capital, either postponed or failed to implement such changes. As in other parts of the region, sociopolitical instability in the 2010s and early 2020s further undermined the political will and unity needed to pursue contentious reform agendas. Iran’s wage-setting system is not streamlined or up-to-date—labor market institutions have been historically layered on top of each other in often jumbled ways: a result of both pre- and post-revolutionary state-making processes that commonly unfolded in response to bottom-up contention.
Second, the unintended rise of the SLC within the Iranian state reflects both institutional persistence and capitalist transformation. A key factor is the structure of Iran’s labor market. Compared to other MENA countries, Iran’s labor market is overwhelmingly private. Public sector employment officially accounts for only about 15 percent, a remarkably low figure not only for a middle-income country but especially for an oil producer.Footnote 11 Most jobs are provided by small firms and contractors, reinforcing tendencies toward wage compression around centrally mandated minimums. At the same time, successive governments have instrumentalized wage-setting, resulting in a relatively high floor. Most Iranians earn at or below the formal minimum, placing annual SLC bargaining at the heart of middle-class politics.
Not least, the political economy of sanctions has significantly shaped Iran’s wage question. Tightened in the 2010s, sanctions have placed severe financial pressure on ordinary citizens. As part of its resilience strategy, the regime has promoted economic protectionism and trade diversification. In this context, labor groups in large industries and the public sector have exerted pressure on authorities to advance wage claims. This bottom-up mobilization—enabled and reinforced by Iran’s distinctive geopolitical conditions—has spilled over into the SLC. With many households struggling to make a living, demands to raise the minimum wage inflame Iranian public discourse.
Integrating qualitative and quantitative evidence, the article draws on the secondary literature, government reports, and archival sources, notably media statements and oral histories.Footnote 12 These archival materials are integrated with quantitative analysis of statistical data sets, including microdata and aggregated data.Footnote 13 In addition, the study benefited from my field research between late 2016 and early 2021. I conducted twenty-three interviews with bureaucrats, journalists, lawyers, and formal labor leaders, both in-person and virtual (using social media like Telegram and WhatsApp), and spent several months (November 2016 to April 2017) attending meetings organized by local shop stewards and the Workers’ House, Iran’s largest labor confederation, in the months preceding annual wage determination.Footnote 14
In what follows, I first situate wage stagnation under neoliberal capitalism within broader transformations in governance across the global North and South, with a focus on the MENA and oil-exporting states. I then trace the evolution of the Iranian state and economy, from the origins of labor market institutions in the Pahlavi era to postrevolutionary developments, including the recent sanctions period. Finally, I examine how, despite persistent systemic conflict and repeated calls for reform, state elites have failed to agree on a viable path forward.
Iran’s Minimum Wage in Global Perspective
It is no secret that wage stagnation is a central feature of contemporary capitalism. In much of the global North, real salary increases slowed markedly after the 1970s. In the global South, wage growth has often lagged behind productivity gains, leading to a declining labor share in national income.Footnote 15 Against this backdrop, minimum wage policy has gained prominence as a tool to combat inequality and bolster household incomes.Footnote 16 In many countries, minimum wages have evolved beyond their original mandate of preventing exploitation and underpayment, increasingly serving as a mechanism to support squeezed middle classes. Economists now more widely acknowledge that wage floors can enhance productivity and stimulate consumption without necessarily undermining employment or driving up prices, departing from earlier neoclassical assumptions about their inefficiency.Footnote 17 Challenging older dualistic assumptions, studies find that formal minimum wage–setting impacts salaries even in the informal sector, exhibiting “near full passthrough” to informal workers.Footnote 18
At the same time, minimum wages have become deeply politicized.Footnote 19 Across the Middle East, recent examples abound of governments using minimum wage hikes to influence electoral outcomes, including in Egypt, Turkey, and Iran.Footnote 20 In Syria, the Assad regime deployed minimum wages as a strategy to consolidate power during the civil war.Footnote 21 In Iran, politicization has prompted expert commentary. In recent years, the Majles Research Center (MRC), a state institute, has authored numerous reports diagnosing the “pathology” (āsībshināsī) of wage determination, labor market policy, and collective bargaining in the Islamic Republic. Drawing on a broad spectrum of both liberal and radical Western scholarship, the reports highlight workers’ low bargaining power, the unrepresentative structure of civil associations, and entrenched institutional rigidities, urging policymakers to bring Iran’s wage-setting institutions in line with international standards.Footnote 22
The MRC reports indicate that Iran’s wage institutions exhibit several distinctive features. First, Iran sets a single, uniform national minimum rate. This diverges from systems that set floors based on region (e.g., the United States, India, and Brazil), sector (e.g., Germany and Italy), or demographic characteristics like age (e.g., Australia, Belgium, and the UK).Footnote 23 Unlike many developing countries, where minimum wages are often sectoral or dualistic—excluding agricultural workers or applying only to specific industries, as in Cambodia—Iran’s minimum wage is universal. It applies to all wage-earners, regardless of sector (public or private) or location (urban or rural).Footnote 24 Second, minimum wages are determined through collective bargaining within the SLC, following a tripartite model involving employee, employer, and government delegates. This process contrasts with legislative decision-making (as in Russia) or executive decree (as in France or the United States). As in much of the developing world, low unionization rates and limited bargaining coverage in Iran render these organizations largely unrepresentative of the constituencies they claim to represent.Footnote 25
Finally, minimum wage–setting is linked to price levels across the labor market. The minimum wage functions not merely as a floor but as a benchmark against which salary scales, pensions, and public sector pay are calibrated, resulting in a rigid, centralized, and comprehensive wage-setting regime.Footnote 26 Crucially, the minimum carries a ceiling: no worker in Iran is formally permitted to earn more than seven times the minimum wage. Formal employment carries substantial fringe benefits—including the New Year’s bonus (eydī), production bonus (pādāsh), child benefit (haq-i ūwlād), and marriage allowances (haq-i taʿahul), many of which also are set through annual SLC-level bargaining. These benefits can amount to 50 to 100 percent of take-home pay. In short, “minimum wage determination” (taʿyīn-i had-i aqal-i dastmuzd), the term commonly used in Iranian public discourse, is not an accurate descriptor of Iran’s wage-setting arrangements. It is policy speak that masks the rigidity and centralization of labor market price–setting in the Islamic Republic.
Two main criteria are used to calculate minimum wages in Iran: the cost of living and the inflation rate. These are not strict indexation mechanisms, however. Employment law merely stipulates that they are “to be taken into consideration” in wage negotiations.Footnote 27 According to MRC reports, this legal ambiguity contributes to persistent “confusion and disagreement in wage determination.”Footnote 28 One reason many experts and political leaders advocate for higher pay is the widening gap between actual living costs and the statutory minimum wage, a discrepancy that reflects both economic crisis and capitalist transformation, discussed in more detail below.Footnote 29 Notably, official calculations of living costs rely on an outdated model of the household economy, that is, the male breadwinner paradigm (whose institutional origins in Iran date back to the mid-1940s), in which the earnings of a single worker are assumed to support a four-member household consisting of the worker, his wife, and two children.Footnote 30
Government experts, scholars, and political elites in Iran broadly agree that the minimum wage is low. Unlike Western contexts, in which concerns about “wage–price spirals” dominate policy discourse, Iranian scholarship rarely prioritizes the link between inflation and minimum wage increases. Despite consistently high nominal wage increases, experts tend to locate the drivers of inflation elsewhere, notably in foreign exchange markets.Footnote 31 A consequence of these pro-labor tendencies is that recent government reports often overlook the fact that Iran’s minimum wage is extremely high in relative terms. Global policy scholarship typically recommends floors set at about 50 percent of the median wage.Footnote 32 In Iran, however, the national minimum wage nearly equals the median. When fringe benefits are included, it surpasses the median, meaning that most salaries are at or below the minimum.Footnote 33 In policy literature, this is referred to as a “maxi minimum”: a wage floor that no longer targets the poorest employed strata, but instead affects the entire wage-earning population, particularly middle classes employed in the formal sector. This means that minimum wages are part and parcel of Iran’s middle-class politics.
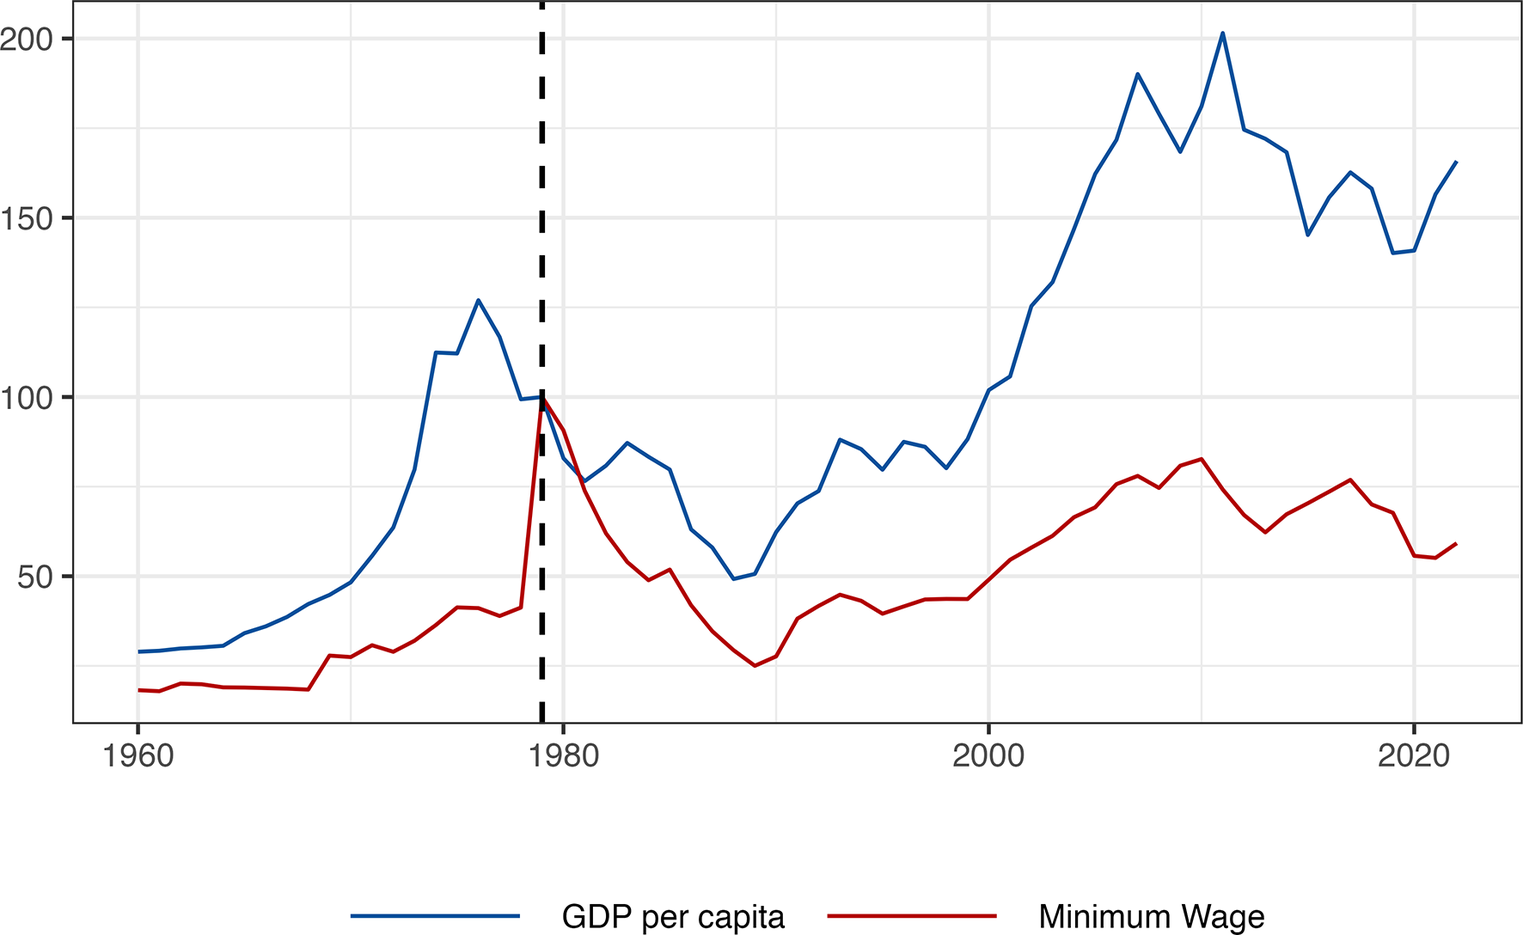
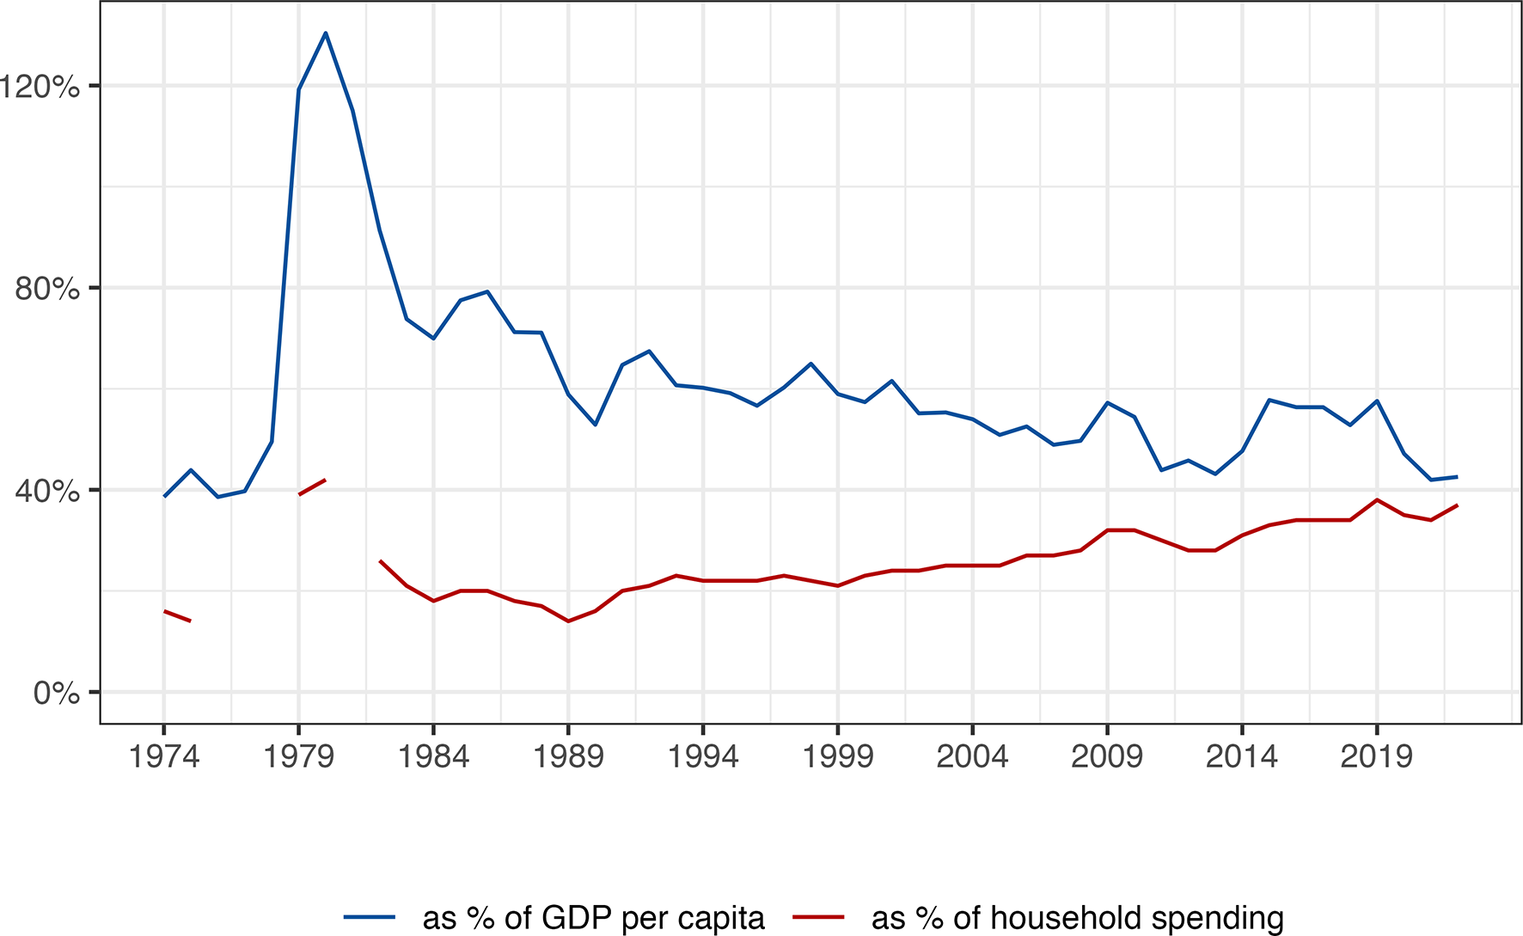
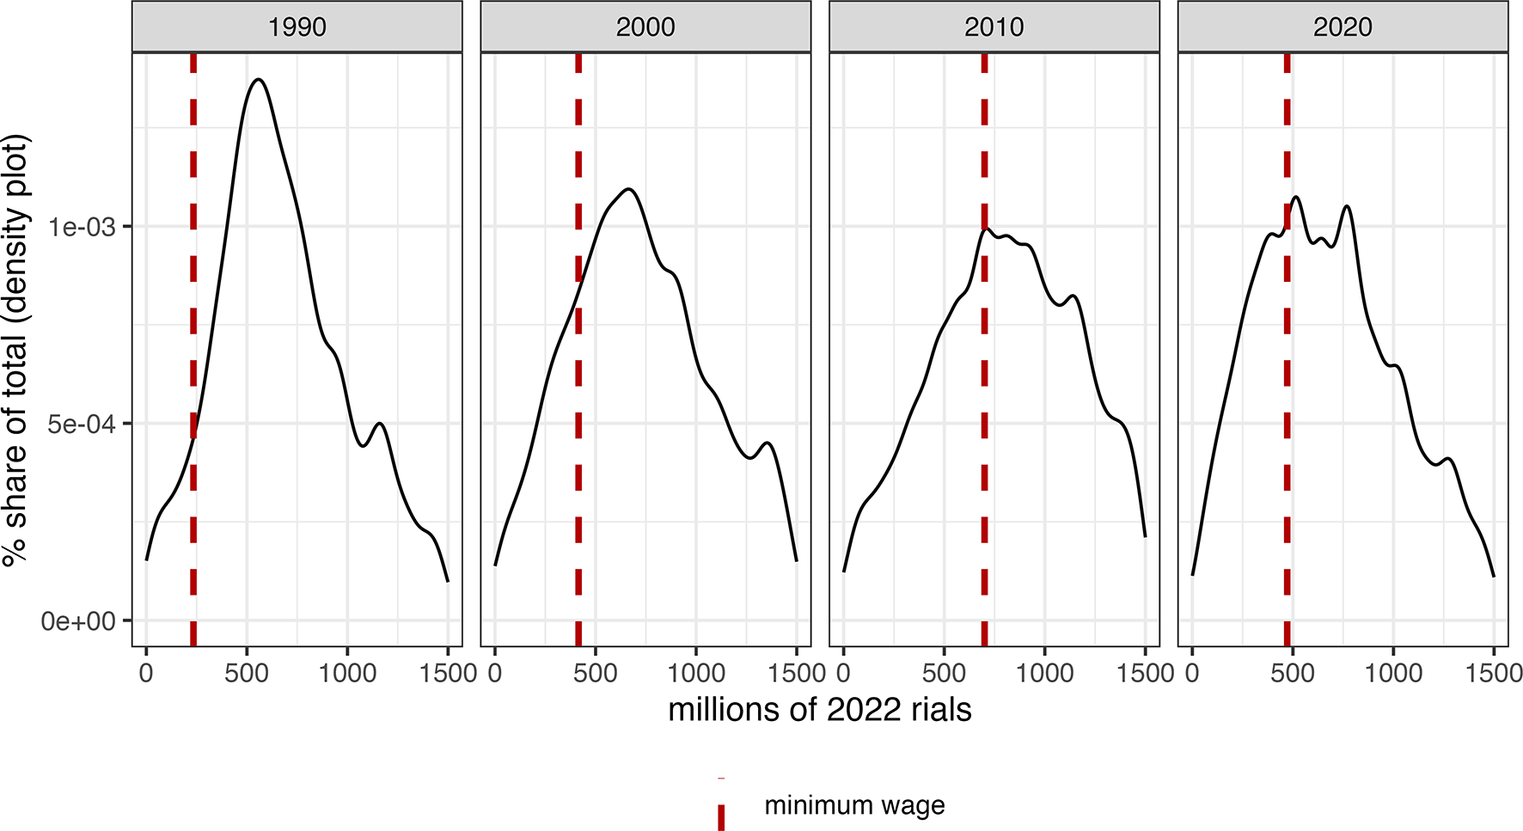
Since 1968, the SLC has raised the nominal minimum wage every single year. Between 2014 and 2024, the minimum wage rose by an average of 28 percent annually, with real wage declines occurring only in years when inflation exceeded these rates (Fig. 1). Despite this, minimum wages have increased as a proportion of household spending, indicating squeezed household budgets and Iranians’ growing reliance on the formal minimum to eke out a living (Fig. 2). As Figure 3 illustrates, the politics of wage containment over the past decade have positioned the national minimum wage squarely within the compressed middle of Iran’s earnings distribution. In short, the minimum wage is no longer a protective cushion, as it arguably was in the late 2000s. It has become a hard floor, an entry threshold into an increasingly impoverished middle class.Footnote 34
GDP per capita and minimum wages, 1960–2022 (real values, index with 1979 as base = 100).
Sources: World Bank (GDP); SLC and SCI (minimum wages); Central Bank of Iran (inflation rates).
Notes: Vertical dotted line: 1979, the Iranian Revolution. Minimum wage does not include statutory benefits; GDP includes oil. GDP figures follow the Gregorian calendar; minimum wages follow the Persian calendar. GDP, gross domestic product; SCI, Statistical Center of Iran; SLC, Supreme Labor Council.

Figure 1. Long description
A line graph with a horizontal X-axis representing years from 1960 to 2020 and a vertical Y-axis representing an index where 1979 equals 100. A vertical dashed line marks the year 1979.
* The G D P per capita (blue line) starts near 25 in 1960, rises sharply to a peak of approximately 125 in the mid-1970s, and drops to 100 at the 1979 line. Post-1979, it fluctuates, dropping to a low near 50 in the late 1980s before trending upward to a peak of 200 around 2010, followed by a volatile decline and recovery to roughly 160 by 2022.
* The Minimum Wage (red line) starts lower, near 15 in 1960, and remains relatively flat until the early 1970s. It rises to meet the G D P line at the 100 index mark in 1979. Immediately after 1979, it enters a steep decline, reaching a trough near 25 in the late 1980s. It then shows a gradual, staggered recovery, peaking near 80 around 2010, before declining again to approximately 60 by 2022.
The two lines show a high correlation until 1979, after which G D P per capita generally stays significantly higher than the minimum wage index.
The national minimum wage, in relative terms (1974–2022).
Sources: HEIS (household spending); SLC and SCI (minimum wages); World Bank (GDP).
Notes: GDP, gross domestic product; HEIS, Household Expenditure and Income Survey; SCI, Statistical Center of Iran; SLC, Supreme Labor Council.

Figure 2. Long description
A line graph with a horizontal X axis representing years from 1974 to 2022 in 5-year increments and a vertical Y axis representing percentages from 0 percent to 120 percent in 40 percent increments.
Two data series are plotted:
* The blue line represents the minimum wage as a percentage of G D P per capita. It starts near 40 percent in 1974, spikes dramatically to a peak of approximately 130 percent around 1980, and then follows a volatile downward trend. By 1984, it drops to roughly 75 percent, fluctuates between 40 percent and 60 percent through the 1990s and 2000s, and ends at approximately 42 percent in 2022.
* The red line represents the minimum wage as a percentage of household spending. This line is fragmented with gaps between 1975 to 1978 and 1980 to 1981. It begins below 20 percent in 1974. After the data gap in the early 1980s, it resumes around 25 percent and shows a gradual, steady linear increase over the decades, reaching nearly 40 percent by 2022.
A legend at the bottom center identifies the blue line as as percentage of G D P per capita and the red line as as percentage of household spending.
The minimum wage and urban wage earnings (1990–2020).
Sources: HEIS (earnings); SCI (minimum wages).
Notes: Vertical red dotted line: minimum wage. Figure only depicts urban households. Similar findings hold for rural households. All values, including the minimum wage, were adjusted to inflation, using the Persian year 2021–22 as the base. HEIS, Household Expenditure and Income Survey; SCI, Statistical Center of Iran.

Figure 3. Long description
A multi-panel density plot with four horizontal panels labeled 1990, 2000, 2010, and 2020.
Axes and Scale:
* The y-axis is labeled percent share of total density plot with scientific notation ticks at 0 e plus 00, 5 e minus 04, and 1 e minus 03.
* The x-axis is labeled millions of 2022 rials with ticks at 0, 500, 1000, and 1500.
* A vertical red dashed line in each panel indicates the minimum wage.
Data Trends:
* 1990: The minimum wage line is at approximately 250. The density curve peaks sharply to the right of the minimum wage at around 550, showing most earnings were well above the minimum.
* 2000: The minimum wage line shifts right to approximately 450. The density curve is broader and lower, peaking around 650, with a larger portion of the distribution falling below the minimum wage line compared to 1990.
* 2010: The minimum wage line shifts further right to approximately 700. The peak of the density curve aligns almost exactly with the minimum wage line, indicating a high concentration of workers earning exactly or near the minimum wage.
* 2020: The minimum wage line shifts left to approximately 500. The density curve is multi-modal and flatter, with the primary peak occurring just to the right of the minimum wage line at approximately 550, and a secondary peak near 800.
Monarchical Corporatism
Where do Iranian wage-setting institutions come from? The International Labor Organization (ILO), which counts Persia as a founding member, adopted minimum wages early on as part of its strategy to counter the Bolshevik threat. Initially slow to gain the confidence of imperial powers, the ILO intensified this campaign only in the 1930s. In the MENA region, minimum wage legislation was supported by the Popular Front in France (1936–38), which introduced relatively generous labor laws in its colonies and protectorates (although less so in its mandates).Footnote 35 Independently, the newly established Turkish Republic enacted a comprehensive labor code in 1936 that included minimum wage provisions.Footnote 36
Although labor law in much of the MENA region traces its roots to the interwar period and colonial bureaucracies, Iran’s trajectory was more contentious and delayed. During the interwar years, the Iranian government—backed by Britain—introduced social regulations, focused mostly on health and safety, but few protections.Footnote 37 Social policy under Reza Shah was exclusionary and regulatory, aimed more at consolidating control than extending rights. The turning point came after World War II. The landmark 1946 Labor Code, which laid the foundational framework for employment relations that remains largely intact today, was an emergency response to a unique convergence of crises. As the war ended, mass labor strikes roiled the country as it faced one of the worst cost of living crises in the region.Footnote 38 The Tudeh Party had successfully organized much of the urban workforce, presiding over one of the largest communist movements in the Middle East. Meanwhile, the USSR took time withdrawing its troops, in the process arming and supporting separatist communist movements in northwest Iran.Footnote 39 An independent Azerbaijan Peoples’ Republic was declared in Tabriz, soon followed by a Kurdish republic in Mahabad. Among the Tehrani establishment, the alarm bells rang: Iran’s territorial integrity was threatened.
In this moment of crisis, the ruling coalition led by Prime Minister Ahmad Qavam decided to collaborate with organized labor and the Tudeh to counter the Soviet-secessionist threats. This pact culminated in the 1946 Labor Code, modeled in part on legislation passed months earlier by the Azeri separatist government.Footnote 40 The code introduced generous worker protections, including the establishment of a national minimum wage and the SLC. Detailed regulations, which introduced the cost of living as a benchmark for minimum wage calculations, were approved in the same year.Footnote 41 As often happens with social policy, the code, formally adopted by the Majles in 1949, survived the 1953 coup. In fact, the 1959 Labor Code reinforced many of its core principles, providing a template that the shah from the early 1960s leveraged for his own populist-developmentalist agenda, the White Revolution.Footnote 42
Rentier state theory (RST), widely critiqued in Middle East studies, centers on fiscal capacity and taxation.Footnote 43 Its core argument is that resource-exporting states tend toward autocracy because they are under little pressure to tax their citizens. Yet resource-rich states do confront significant pressures to stimulate domestic demand, a dynamic that neoclassical economics associates with the “Dutch disease,” whereby wage and exchange rate appreciation undermine export competitiveness. In this framework, rentier states inflate wages not because they must tax, but because they must spend.
In Iran and much of the MENA region, however, it was not RST or neoclassical economics but theories of import substitution that shaped postwar wage policy. These approaches viewed wage inflation as a virtue, capable of stimulating demand for domestically produced goods and services.Footnote 44 In oil-rich countries like Iran, rising wages were seen as a natural outcome of market demand for scarce “skilled” labor (that is, higher-status, educated, and trained).Footnote 45 Educational policy would be central to narrowing wage differentials between the formal and informal sectors.
Throughout the 1960s and 70s, Pahlavi Iran adhered closely to this developmentalist playbook. Drawing inspiration from European (especially French) law and US policy, state elites constructed an elaborate system of collective bargaining. Requiring “more than elementary literacy” on behalf of managers and employers, the resulting legislation was often too complex for firms to implement.Footnote 46 But this mattered little to a government intent on projecting Iran as a leader of the developing world. Monarchical corporatism culminated in the establishment of the National Labor Conference (Kunfirans-i Milli-yi Kar) in Tehran in 1969, timed to coincide with the fiftieth anniversary of the ILO. Tripartism, the ILO’s core principle, was embraced by the Iranian state as integral to this project.
With US and ILO support, the 1959 Labor Code introduced a bottom-up associational system centered on local syndicates (sandīkā), established at the firm and county (shahristān) levels. These resembled autocratic versions of German-style works councils more than independent trade unions. Tasked with defending workers’ rights and improving company efficiency, the sandīkā functioned as a business union and as a transmission belt for state policy. Crucially, the 1959 code also confirmed the Labor Ministry as the principal government body involved in the SLC and collective bargaining.Footnote 47 The ministry’s powers, and its perceived tendency to adopt pro-worker positions, incurred growing concern among top technocrats employed in other parts of the Pahlavi state.Footnote 48 As one senior Pahlavi official recalled: the Labor Ministry “always sided with the workers—foolishly sided with the workers—just to say to the workers, ‘I’m on your side’; to gain popularity for themselves.”Footnote 49
From the early 1960s, the White Revolution brought further institutional change. Under the leadership of Ataollah Khosrovani—a shah confidante who served simultaneously as minister of labor and president of the ruling Iran Novin Party—new regulations were introduced to protect shop stewards and incentivize syndicate formation.Footnote 50 Although foreign-owned firms mostly complied promptly, domestic employers were less cooperative. Here, authorities often relied on the army and the secret police, the SAVAK, to encourage unionization, commonly by assigning retired military officers to establish and oversee local syndicates, a practice common to other parts of the Middle East and South Asia as well.Footnote 51 Buoyed by rising oil revenues and populist momentum, the government substantially expanded syndicates’ responsibilities to include consumer, credit, and housing cooperatives, as well as local unemployment funds, in a Ghent-like system.Footnote 52
As was common at the time, the Pahlavi vision of high road development put extreme trust in the capacity of planners to regulate markets and command progress. One example is the introduction of a comprehensive job classification scheme modeled on US practices. Large firms were required to submit detailed employee data (occupation, seniority, education) to the Ministry of Labor, which could then mandate salary adjustments based on centralized wage brackets.Footnote 53 With the Third Development Plan (1962–68), the labor bureaucracy was formally integrated into the national planning apparatus. Vocational training gained policy priority.Footnote 54 Collective bargaining was extended beyond wages to encompass economic, educational, and social governance. Sectoral and regional wage rates—negotiated by tripartite councils—were introduced across a wide range of industries and geographic areas.Footnote 55 Midsize firms participated in local councils, but only delegates from very large corporations (with over five hundred employees) were eligible to attend national SLC meetings. Iran’s wage system combined elements of the German sectoral model, based on collective agreements at the sectoral level, and the Japanese enterprise model, centered on firm-level negotiations. Lead sectors (especially oil, which had by far the highest salary thresholds) and lead firms (notably in advanced manufacturing like steel or automotives) set wage benchmarks that then guided price-setting across labor markets.
In short, late Pahlavi Iran modeled itself on the Western neocorporatist state—a vision promoted by social scientists, trade unionists, and policymakers in the global North in response to intensifying labor conflict after 1968.Footnote 56 As part of a broader effort to position Iran as a capitalist alternative to the Non-Aligned Movement, the shah and his advisers imagined an inclusive model of economic governance for Third World development. Centrally designed by officials and technocrats and locally negotiated by market participants and citizens, this project ultimately failed, undone in part by the growing gap between law and practice.
Incoherent Incorporations
Wages did not emerge as a major political concern in Iran until the global price shocks of 1973–74. As in many parts of the world, collective bargaining in 1970s Iran reached an impasse, with actors struggling to coordinate amid price inflation and unpredictability. The central issue was not minimum wages, which remained well below most formal-sector earnings, but rather wage differentials institutionalized in part by the job classification program.Footnote 57 Protests over salary scales and classification played a prominent role in the 1979 revolution. During the revolution, class and collar deeply intersected, with struggles often focused on disparities between higher-paid “skilled,” technical, and administrative workers (kārmandān) and lower status or blue collar workers (kārgarān).Footnote 58
Institutional transformation arrived swiftly after the revolution. In early 1979, the revolutionary council decided to raise the national minimum wage by 170 percent.Footnote 59 In one stroke, the minimum wage was transformed from a marginal policy into a revolutionary symbol. Sectoral and regional wage rates were abolished, deemed incompatible with the new regime’s vision of social justice.Footnote 60 As the National Labor Conference, never formally institutionalized, fell into disarray, wage-setting authority was recentralized in the SLC. Following the nationalization of large firms, the SLC gained unprecedented influence over wages in an increasingly national labor market. The revolutionary government also introduced a detailed “living cost basket,” specifying the quantities of rice, socks, yogurt, and housing that a minimum wage should afford.Footnote 61
Scholars often describe the predominant economic ideology of the postrevolutionary regime as one of “statist-populism”: a hybrid of Islamic, liberal, and socialist ideas about social justice, property, and state intervention.Footnote 62 Yet postrevolutionary elites had little consensus on how to handle Pahlavi labor legacies. Islamic economics, as articulated by figures like ayatollahs Mohammad Baqer al-Sadr and Mahmoud Taleqani, offered limited guidance.Footnote 63 Fiercely opposed to both capitalism and communism, these frameworks acknowledged labor’s role in value creation but remained largely indifferent to work relations. Abdolhassan Bani Sadr, the Islamic Republic’s first elected president (1980–81), exemplified this tension. Educated in France and influenced by ideas of the “mixed economy,” Bani Sadr propagated a vision modeled on what he called the “advanced industrial societies.” Yet many of his policy recommendations effectively already existed in Iran; they resembled legislation introduced under the shah.Footnote 64 More generally, Islamic economics faltered with the assassination of Ayatollah Mohammad Husayni Beheshti in 1981, one of its most powerful proponents.Footnote 65 What followed was a brief (but widely remembered) conservative backlash and, from 1983 onward, an uneasy stalemate.Footnote 66
Despite eliminating some technocratic features, the postrevolutionary regime largely retained the Pahlavi model. Enterprise-level institutions remained intact, and the emphasis on cross-class collaboration, especially between managers and workers, was made more explicit.Footnote 67 The 1990 Labor Code, passed after years of delay, reflected the regime’s dual priorities: it significantly expanded the state’s regulatory responsibilities, while also adopting broadly pro-labor positions.Footnote 68 Formal employment became more rigid and costly for employers, particularly in terms of layoffs and social security obligations. Yet, in substance, the 1990 code resembled its Pahlavi predecessor, modifying rather than overturning existing articles.
In Iranian public discourse, the 1980s government is often portrayed as having repressed the minimum wage. This common narrative credits the 1979 wage hike to the revolutionary workers’ movement and attributes the subsequent decline to authoritarian consolidation. Although correctly pointing to labor repression, regime consolidation, and state control, the link to minimum wages should be assessed more carefully. After all, given their dramatic rise in 1979, minimum wages did not experience extreme declines in relative terms, even if their absolute drop was more significant. As a share of the gross domestic product (GDP) and household income, they remained elevated compared to the prerevolutionary period (Fig. 1). Between 1961 and 1978, minimum wages averaged 60 percent of GDP per capita; between 1983 and 1990, they averaged around 70 percent.Footnote 69 Rather than wage repression, the 1980s witnessed the entrenchment of a new minimum wage system alongside the survival of Pahlavi-era labor law. What changed, of course, was the mass activation of civil society: worker organizations, stale and often dormant under the shah, now saw widespread popular participation.
Quiet Encroachments, Loud Retreats
The “technocratic” coalition led by President Akbar Hashemi Rafsanjani (1989–97) is often described as Iran’s first neoliberal government. Less frequently noted, however, is that many of its legislative reforms were shaped by the inclusion of labor groups within the governing coalition: teachers, doctors, engineers, and industrial workers, the latter represented by the Workers’ House. As exemplified by New Labour in the UK, market transitions in the 1980s and 1990s were often more successful when governments reached agreements with organized labor.Footnote 70
State–labor relations in the 1990s approximated the shah’s original vision. Following a postwar bump in minimum wages (largely a political move to preempt worker unrest after the sidelining of rival factions) the SLC maintained relatively stable and balanced wage increases until the turn of the millennium. Building on the 1990 code, state capacity expanded rapidly, evidenced by the proliferation of vocational training centers, inspection agencies, labor courts, dispute resolution committees, and research institutions. As ownership shifted to the private sector, the government arguably managed labor market informality more effectively than many other MENA states.Footnote 71
The politics of consensus proved short-lived, however. With marketization, commodification, and precaritization, wage-setting became increasingly central to the lives of ordinary Iranians.Footnote 72 As consumerism expanded and the postrevolutionary social contract began to fray, minimum wages gained new significance for the middle class (Figs. 2, 3). Internal divisions emerged over the pace and direction of market reform, especially as labor actors began to perceive the reforms as weakening their bargaining position.Footnote 73 Hopes for a reset under Mohammad Khatami’s first reformist government (1997–2001) were dashed amid executive gridlock, attempts to sideline the Workers’ House, and mounting pressure for further liberalization.
Between 2001 and 2010, wage policy took a new turn. Governments began using the SLC to raise wage floors above inflation rates. Afforded by rising oil revenues, these hikes were likely part of a strategy by elected officials to preempt labor opposition and mobilize working-class constituencies. This pattern is common in authoritarian contexts and where governments face strong labor oppositions.Footnote 74 In Iran, insider opposition included the Workers’ House and various public sector unions, notably teachers’ associations.Footnote 75 A pivotal moment came in 2001, when the Khatami administration ended nearly two decades of Workers’ House control over the Ministry of Labor, despite the organization’s support for Khatami’s reelection. In that year, Hossein Kamali, labor minister since 1989 and the longest-serving minister in the history of that institution, was replaced with a figure with no direct ties to the Workers’ House. This marked the beginning of a series of contentious interactions between postrevolutionary “legacy unions” and the state.Footnote 76 During Khatami’s second term (2001–5), the Workers’ House, lacking majority control over the SLC, resorted to street demonstrations to influence wage decisions, often resulting in larger increases than when it had direct institutional control in the 1990s.Footnote 77 As one Workers’ House leader told me, the organization in this period developed a strategy of “negotiation at the top, struggle at the bottom” (muzākirih dar ṣadr, mubārizih dar kaf).Footnote 78
The upward trend in real minimum wages continued under the first Mahmoud Ahmadinejad administration (2005–9). Viewing the Workers’ House and other legacy unions as aligned with reformist factions, Ahmadinejad excluded their delegates from the SLC, citing procedural irregularities.Footnote 79 With unilateral control over the council, his administration granted substantial wage increases. In 2009–10, real minimum levels were reached that had not been seen since the early 1980s (Fig. 1). Riding the global commodities boom, the 2009–10 hikes also were likely driven first by electoral imperatives, and then by security concerns following the Green Movement. But importantly, Ahmadinejad’s crackdown did not dismantle the SLC. Although his government toyed with the idea of increasing government representation within the council, it never proposed to abolish it.Footnote 80 Instead, his administration weakened the link between the Workers’ House and the High Coordinating Council for Islamic Works Councils (HCC-IWC), the national confederation of Islamic Works Councils (IWC), the successor to the Pahlavi-era sandīkā. At the same time, the government promoted alternative labor organizations, notably the so-called Workers’ Representative (Namāyandih-yi Kārgarān), a weaker type of organization that lacked perceived associations with the Workers’ House.
These policies had unintended consequences. With weakened ties to the Workers’ House, HCC-IWC leaders retained the capacity to oppose government positions within the SLC. In the early 2010s, as the fiscal burden of wage increases became apparent, the Ahmadinejad administration attempted retrenchment without securing consensus from HCC-IWC delegates, prompting a public backlash from labor leaders and their allies. This growing wave of discontent arguably contributed to popular support for Hassan Rouhani in 2013, who, like Khatami in 1997, campaigned on promises of more inclusive governance.
Wars of Renewal
In the 2010s and early 2020s, Iran’s labor arena witnessed institutional rejuvenation. Triggered in part by economic crisis, worker struggles reinvigorated the bureaucratic architecture regulating employment relations. International sanctions prompted state elites to forge pacts with occupational groups, creating openings for bottom-up claims.Footnote 81 The “resistance economy,” a corporatist campaign launched by the Supreme Leader in the early 2010s, provided an ideological framework for these shifts. To channel workplace conflict, authorities also licensed an unprecedented number of labor organizations. The number of IWCs, for instance, rose by 96 percent over a decade, from approximately 1,300 in 2012–13 to around 2,400 in 2022–23.Footnote 82
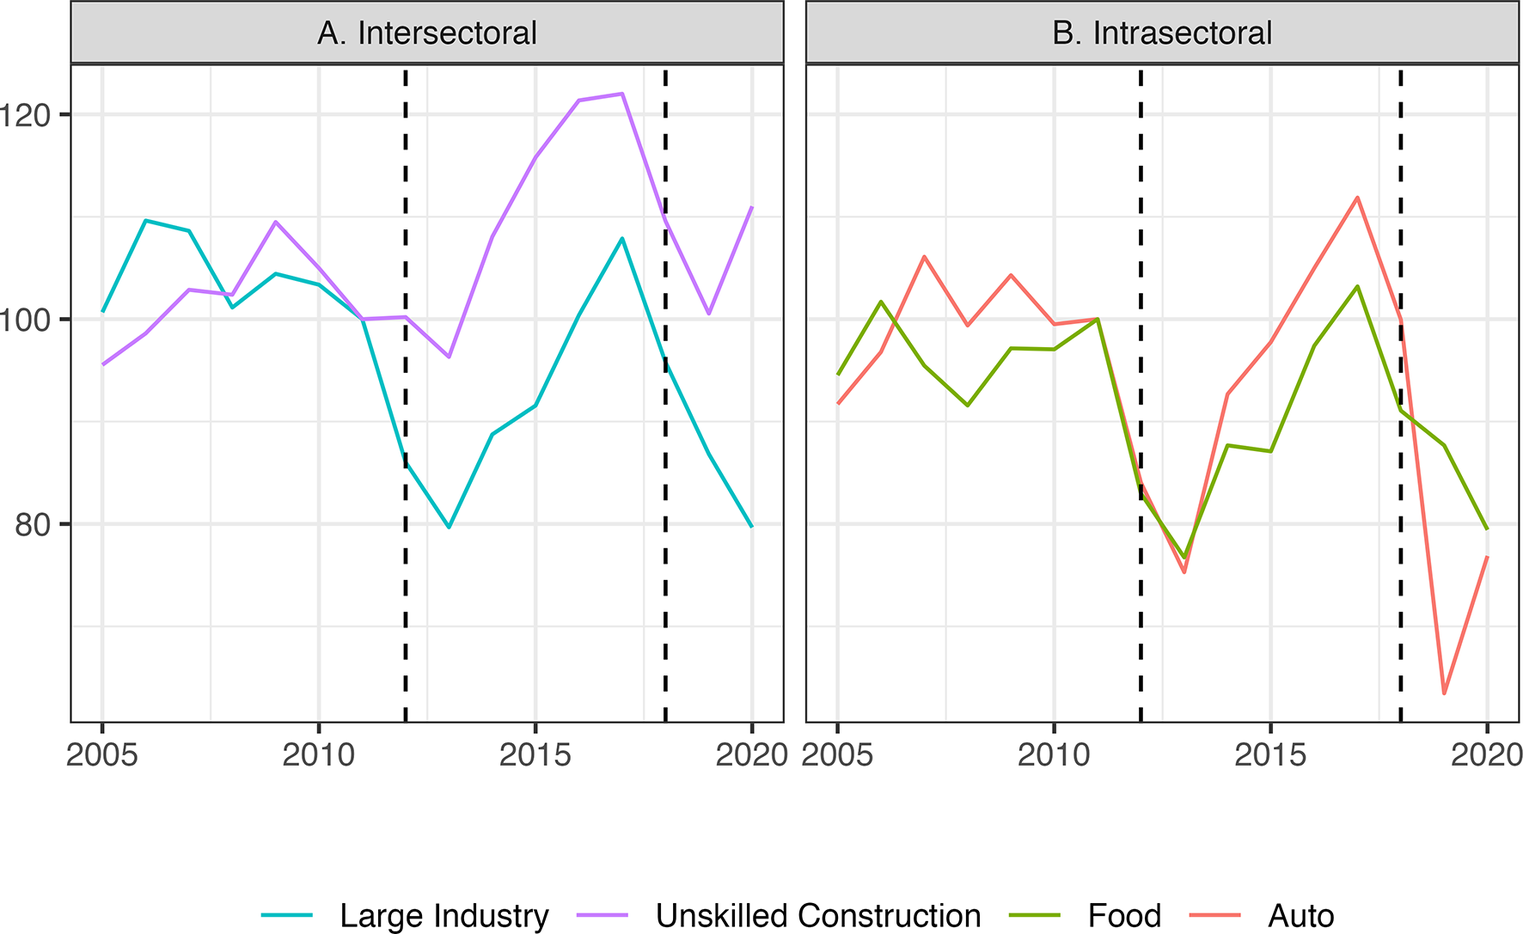
Wages, particularly delayed wages, figured centrally in the protest wave. Sanctions, inflation, and currency devaluation exerted intense downward pressure on salaries. The steepest drops occurred among the most protected occupational categories: salaried middle-class workers employed in large corporations and the formal sector. In these sectors, stringent firing regulations limited mass layoffs, prompting employers to reduce or postpone salary payments. Figure 4 illustrates this dynamic, depicting wage trajectories across the industrial and nonindustrial sectors (intersectoral) and within large industry (intrasectoral). It reveals that average real wages in large industry declined more sharply than wages in unskilled construction, particularly following the imposition of sanctions. Likewise, wages in high-tech and capital-intensive industrial sectors such as automobile manufacturing fell more following sanctions than wages in lighter industries like food production. Of course, these divergent outcomes were in part a function of market opportunities and economic resilience. But employment protections and layoff constraints also mattered: because larger firms in the formal sector faced stricter dismissal regulations, they were under greater pressure to cut wages. In other words, sanctions disproportionately affected middle class salaries, and this impact on wages was, in part, a consequence of the very labor laws that were designed to protect them.
Wage suppression in state-protected sectors, 2005–20 (index with 2011 as base = 100).
Sources: SIU-10+ (Survey of Industrial Units with Ten or More Employees, Statistical Center of Iran).
Notes: Panel A compares wages in large manufacturing (a state-protected sector) to an unprotected and mostly informal sector. Panel B uses the food and auto industries to contrast, respectively, lighter and less protected with heavier and more protected manufacturing. Vertical lines at 2012 and 2018 represent years when sanctions were tightened. Original dates in Persian years.

Figure 4. Long description
The graph consists of two panels, A and B, sharing a common Y-axis representing a wage index where 2011 equals 100, and a common X-axis representing years from 2005 to 2020. Vertical dashed lines are placed at 2012 and 2018.
Panel A, titled Intersectoral, compares Large Industry (teal line) and Unskilled Construction (purple line).
* From 2005 to 2011, both lines fluctuate near 100.
* Following the 2012 sanction line, Large Industry wages drop sharply to a trough near 80 in 2013, while Unskilled Construction remains higher, near 95.
* Between 2013 and 2017, Unskilled Construction wages rise significantly to a peak over 120, while Large Industry recovers more slowly to just over 100.
* After the 2018 sanction line, both sectors decline, with Large Industry falling steeply back toward 80 by 2020.
Panel B, titled Intrasectoral, compares Food (green line) and Auto (orange line) industries.
* Both industries track closely together from 2005 to 2011, fluctuating between 90 and 105.
* After the 2012 sanction line, both experience a sharp synchronized drop to a trough near 75 in 2013.
* From 2013 to 2017, both recover, with the Auto industry peaking higher at approximately 110 compared to Food at 103.
* Following the 2018 sanction line, both industries crash. The Auto industry shows a more extreme decline, hitting a low near 65 in 2019 before a slight uptick, while the Food industry declines more steadily to 80 by 2020.
A legend at the bottom identifies the four categories: Large Industry (teal), Unskilled Construction (purple), Food (green), and Auto (orange).
Against this backdrop, the SLC became a focal point of elite contestation. The issue was not whether to raise the nominal minimum wage—that was largely taken for granted—but how to manage wage containment: balancing increases to preserve profitability and limit fiscal costs. These debates unfolded as consumption, rather than investment, kept the economy afloat. Sanctions created a paradoxical situation for the state: if wages increase with inflation, costs of production rise; if wages do not increase, a large portion of the population falls into poverty.
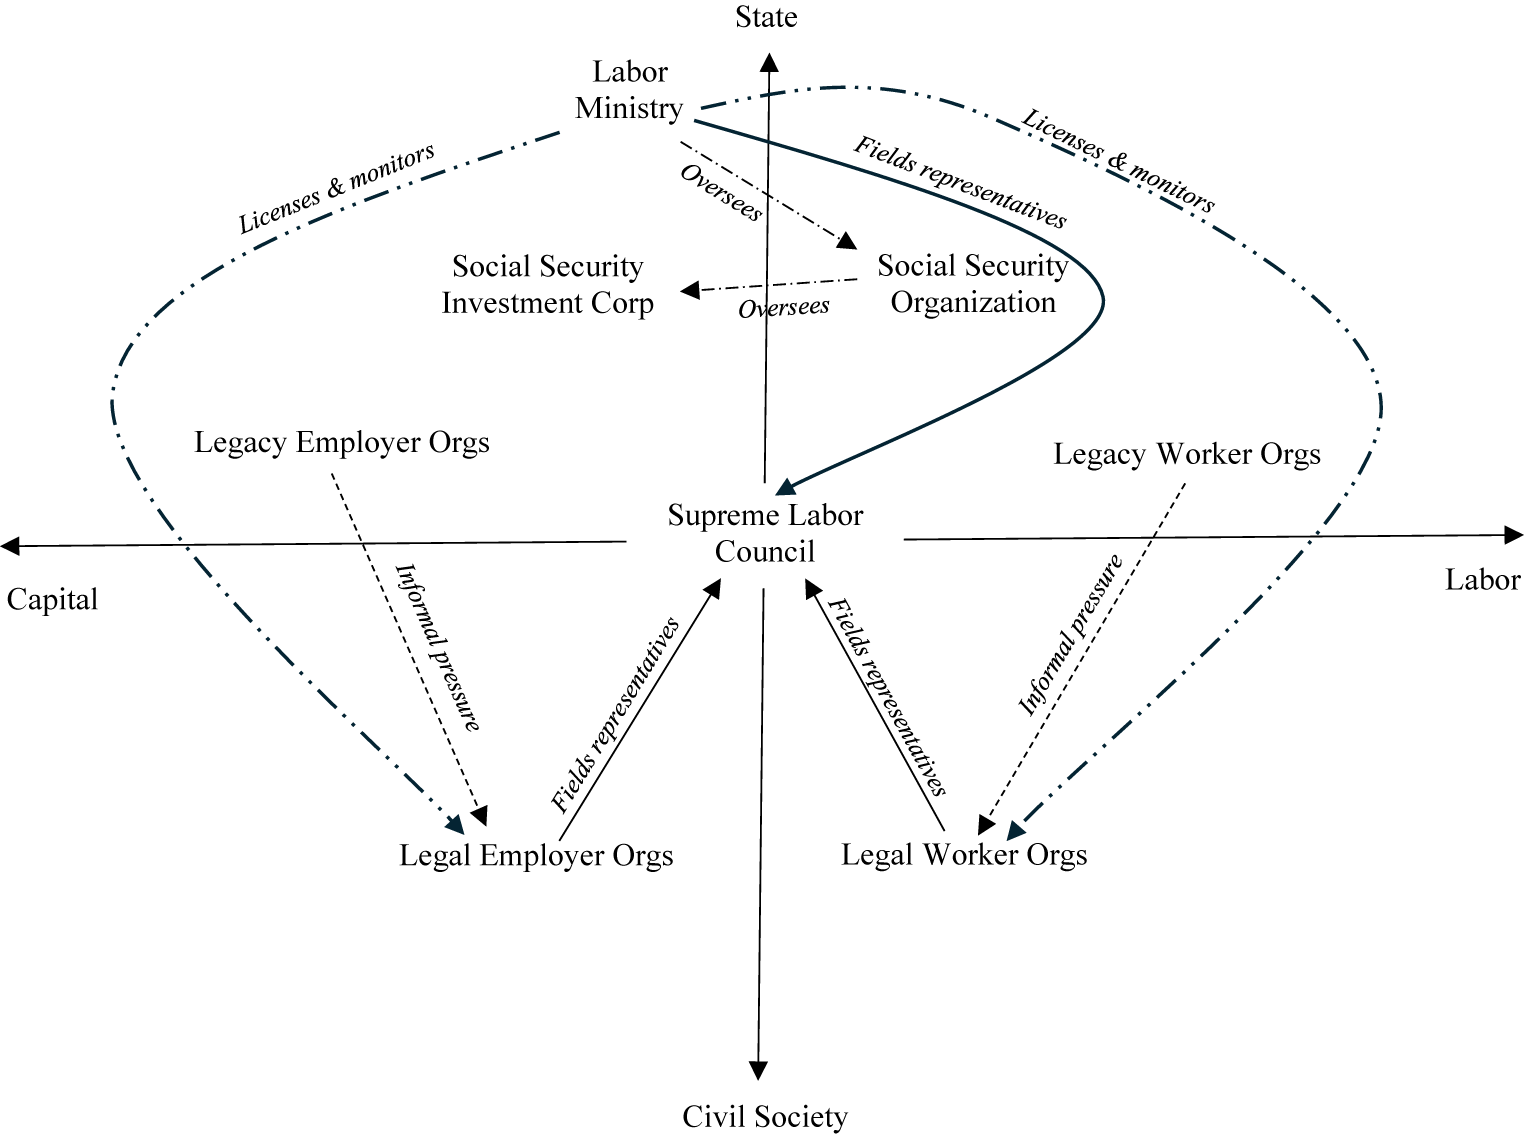
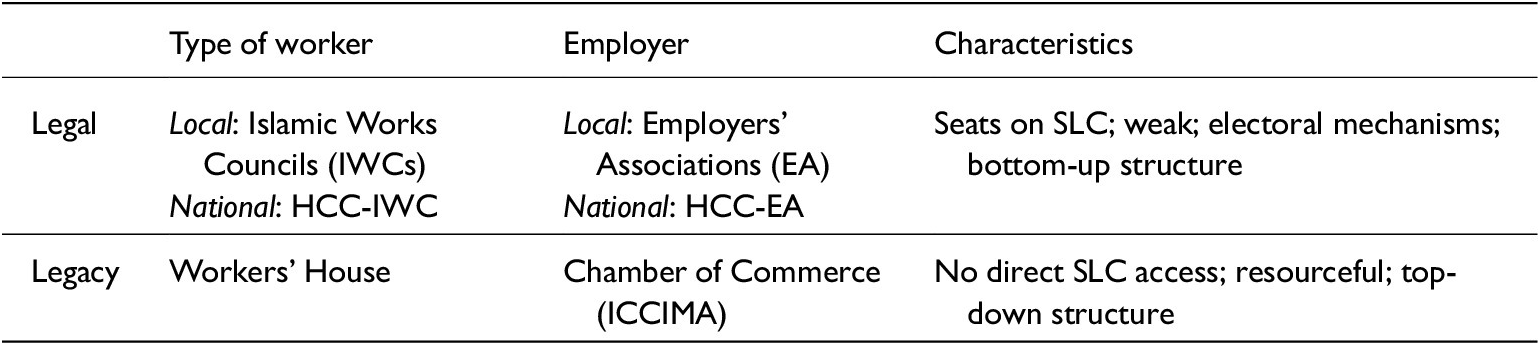
To better illustrate these dynamics, Figure 5 maps the principal actors involved in national wage-setting in Iran. In somewhat Bourdieusian fashion, the figure represents the social space surrounding the SLC. The SLC, as an organization congregating state-societal and capital-labor interests, is situated in the center, where the x-axis and y-axis meet. Both axes represent continuums. Actors representing employer interests are positioned to the left of the y-axis; labor advocates to the right. State-aligned actors occupy the upper half; societal actors are situated below. Crucially, the figure distinguishes between legacy organizations such as the Workers’ House and the Chamber of Commerce, and legal organizations like the HCC-EA (national employer’s association) and the HCC-IWC. The former are vertically structured and well-resourced but not formally included in the SLC; the latter are weaker, closer to civil society, but hold actual seats in the Council. These organizational differences are summarized in Table 1.
Mapping the social space of wage politics in Iran.

Figure 5. Long description
The diagram is structured on a cross-axis. The vertical axis runs from State at the top to Civil Society at the bottom. The horizontal axis runs from Capital on the left to Labor on the right.
At the center of the cross is the Supreme Labor Council.
In the top half (State-oriented):
- The Labor Ministry sits at the top.
- A solid line labeled Fields representatives curves from the Labor Ministry down to the Supreme Labor Council.
- Dash-dot lines labeled Licenses and monitors extend from the Labor Ministry to Legal Employer Orgs (bottom-left) and Legal Worker Orgs (bottom-right).
- Below the Labor Ministry, the Social Security Organization oversees the Social Security Investment Corp and is itself overseen by the Labor Ministry.
In the bottom half (Civil Society-oriented):
- Legal Employer Orgs (left) and Legal Worker Orgs (right) both have solid arrows pointing to the Supreme Labor Council labeled Fields representatives.
- Legacy Employer Orgs (top-left quadrant) and Legacy Worker Orgs (top-right quadrant) exert Informal pressure, indicated by dashed arrows, on their respective Legal counterparts below them.
Legal and Legacy Organizations in Iranian Wage Politics

Table 1. Long description
The table consists of four columns: Organization Category, Type of worker, Employer, and Characteristics.
* The first row describes Legal organizations. For workers, these include Local: Islamic Works Councils (I W C s) and National: H C C - I W C. For employers, these include Local: Employers’ Associations (E A) and National: H C C - E A. Characteristics include having seats on the S L C, being weak, using electoral mechanisms, and having a bottom-up structure.
* The second row describes Legacy organizations. For workers, this is the Workers’ House. For employers, this is the Chamber of Commerce (I C C I M A). Characteristics include having no direct S L C access, being resourceful, and having a top-down structure.
Notes below the table clarify that H C C stands for High Coordinating Council and S L C stands for Supreme Labor Council. It also mentions other legal organizations without S L C access such as pensioners’ organizations, guild associations, and the Workers’ Representative.
Notes: There are other legal workers’ organizations without direct access to the SLC (not discussed here) including the pensioners’ organizations (kānūn-e bāznishastigān), guild associations (anjuman-i sinfī), and the Workers’ Representative (Namāyandih-i Kārgari). HCC, High Coordinating Council; SLC, Supreme Labor Council.
For simplicity’s sake, Figure 5 includes only the most important actors. The SLC grants equal voting rights to the government (via the Ministry of Labor, or MCLS), employers (HCC-EA), and labor (HCC-IWC). Although consensus is preferred, majority decisions are binding, meaning that the MCLS and HCC-EA can override HCC-IWC opposition. In recent years, as labor leaders have become more intransigent and unruly, majority agreements between the government and employer delegates have become common.
On paper, the Labor Ministry is tasked with mediating negotiations between the legal employer and worker confederations (the HCC-EA and the HCC-IWC). Yet critics contend that the government, being one of Iran’s largest employers, often favors the HCC-EA. The ministry oversees two major corporate entities: the Social Security Organization (SSO), Iran’s main pension fund, and the Social Security Investment Corporation (Shasta), one of country’s largest institutional investors. Shasta controls vast segments of the economy, including firms with IWCs whose leaders participate in the HCC-IWC. Meanwhile, the SSO, which supervises Shasta, collects contributions and disburses pensions to much of the formal workforce. To make matters more circular and complex, employer, labor, and pensioner organizations participate in the governance of the SSO, but not in Shasta.
Employer associations (EAs) and IWCs are not civic associations in the pluralist tradition. They are corporatist entities. The boards of these organizations are elected every two to three years. Although the government no longer actively intervenes in these elections, formal licensing remains a prerequisite and MCLS monitoring is common.Footnote 83 EAs and IWCs are weakly representative and poorly articulate the interests of capital and labor. Following postrevolutionary efforts to disempower the industrial corporations favored under the shah, EAs now primarily organize smaller trades and self-employed groups (the “petty bourgeoisie,” in Marxist terms). Occupations like hairdressers, truck drivers, mechanics, shoemakers, and cab drivers constitute the bulk of EAs, not exactly the constituencies associated with haute finance.Footnote 84 IWCs are similarly limited in their representative capacity. The HCC-IWC is far from representative of Iran’s wage-earners. IWCs can only be established in enterprises with more than thirty-five employees, excluding most workers in a country in which the majority of firms employ fewer than ten.Footnote 85 IWCs also are concentrated in the industrial sector, which comprises a small fraction of the national workforce. As successors to the Pahlavi-era sandīkā, IWCs are not designed to exclusively represent labor interests. Managerial delegates frequently sit on IWC boards, a practice that is legal.
Legacy organizations arguably do a better job at articulating the interests of industrial capital and labor. The Chamber of Commerce (ICCIMA) claims to represent large private corporations, and the Workers’ House advocates for industrial labor. The chamber routinely consults with HCC-EA leaders to coordinate positions on wage policy. A similar, but more complex, relationship exists between the Workers’ House and the HCC-IWC. Although the Workers’ House communicates with and pressures the HCC-IWC, legal labor organizations often assert their independence, an outcome of persistent state attempts to break these linkages. They do not blindly follow Workers’ House recommendations. One senior HCC-IWC leader told me that he sees the new cohort of legal worker activists as part of a “third wave” (mūwj-i sivvum), separate from the elite factionalism to which the Workers’ House firmly belongs.Footnote 86 In contrast to past decades, IWC leaders try to minimize their reliance on Workers’ House resources, often organizing their own separate meetings.
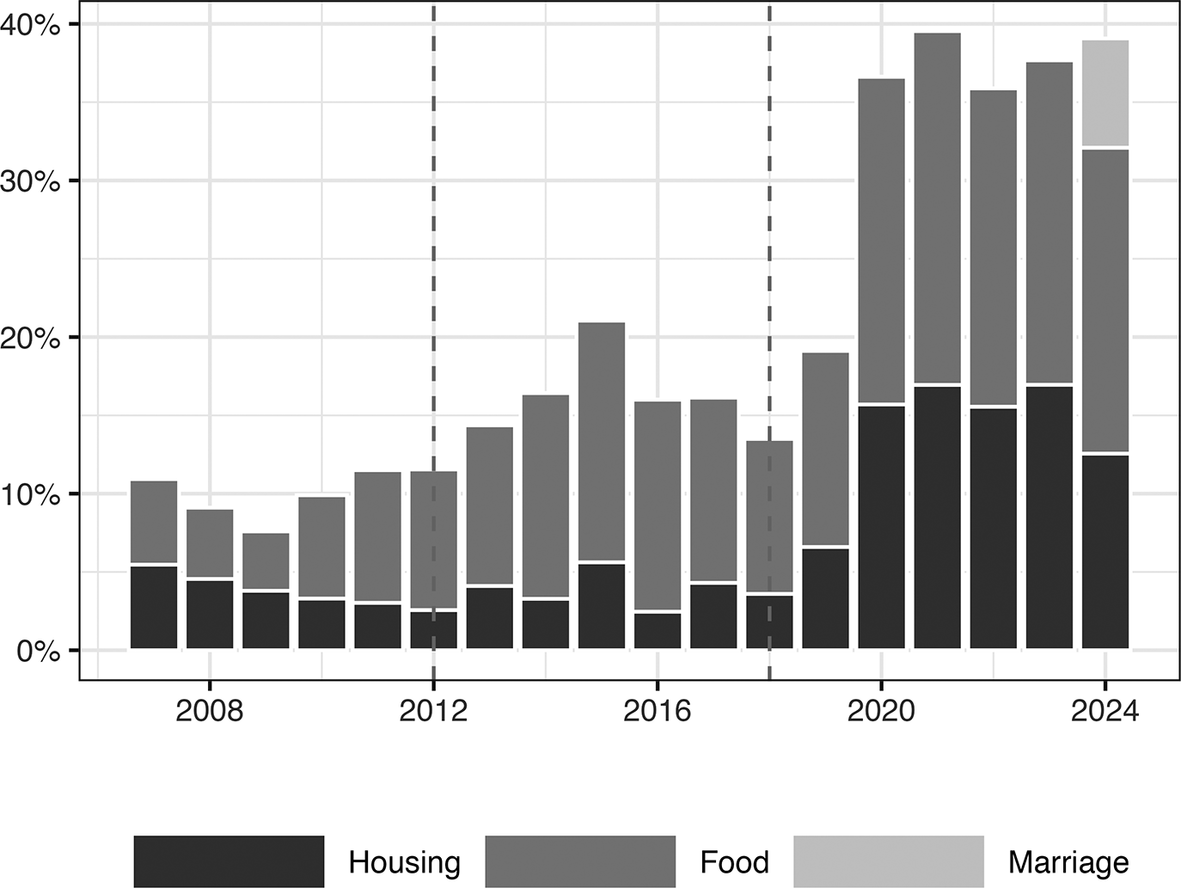
Over the past decade, the three parties included in the SLC have largely occupied the hybrid roles expected of them. The government has generally sought consensus but often leaned toward the HCC-EA; labor leaders have pushed for wage increases aligned with living costs; and employer groups have demanded more modest adjustments, warning that mass unemployment will ensue if labor costs increase excessively (even though, in reality, authorities would likely block major layoffs and instead provide employers with credit facilities).Footnote 87 The different SLC parties have found it easier to agree on fringe benefits, which are largely subsidized by the government. As shown in Figure 6, benefit levels have increased significantly, both absolutely and as a share of the minimum wage.
Collectively bargained benefits as a percentage of the minimum wage, 2007–24.
Source: SLC.
Notes: These benefits are determined by collective bargaining in the SLC. Vertical dotted lines represent years in which sanctions were significantly tightened. Original data uses Persian years. SLC, Supreme Labor Council.

Figure 6. Long description
A stacked bar chart with the Y-axis representing percentage from 0 percent to 40 percent in increments of 10 percent. The X-axis represents years from 2007 to 2024. The legend at the bottom identifies three categories: Housing (darkest gray), Food (medium gray), and Marriage (lightest gray).
* From 2007 to 2011, total benefits fluctuate between 8 percent and 11 percent, with Housing and Food making up roughly equal halves.
* A vertical dashed line appears at 2012. Between 2012 and 2017, total benefits rise gradually from 11 percent to approximately 21 percent in 2015, before dipping back to 13 percent in 2018.
* A second vertical dashed line appears at 2018. Following this, there is a sharp increase in total benefits.
* From 2019 to 2024, total benefits jump significantly, peaking near 40 percent in 2021. In this period, Housing benefits increase to roughly 15 percent of the minimum wage, and Food benefits increase to over 20 percent.
* In 2024, a new category, Marriage, appears as a light gray segment at the top of the bar, contributing approximately 7 percent to the total 39 percent benefit level.
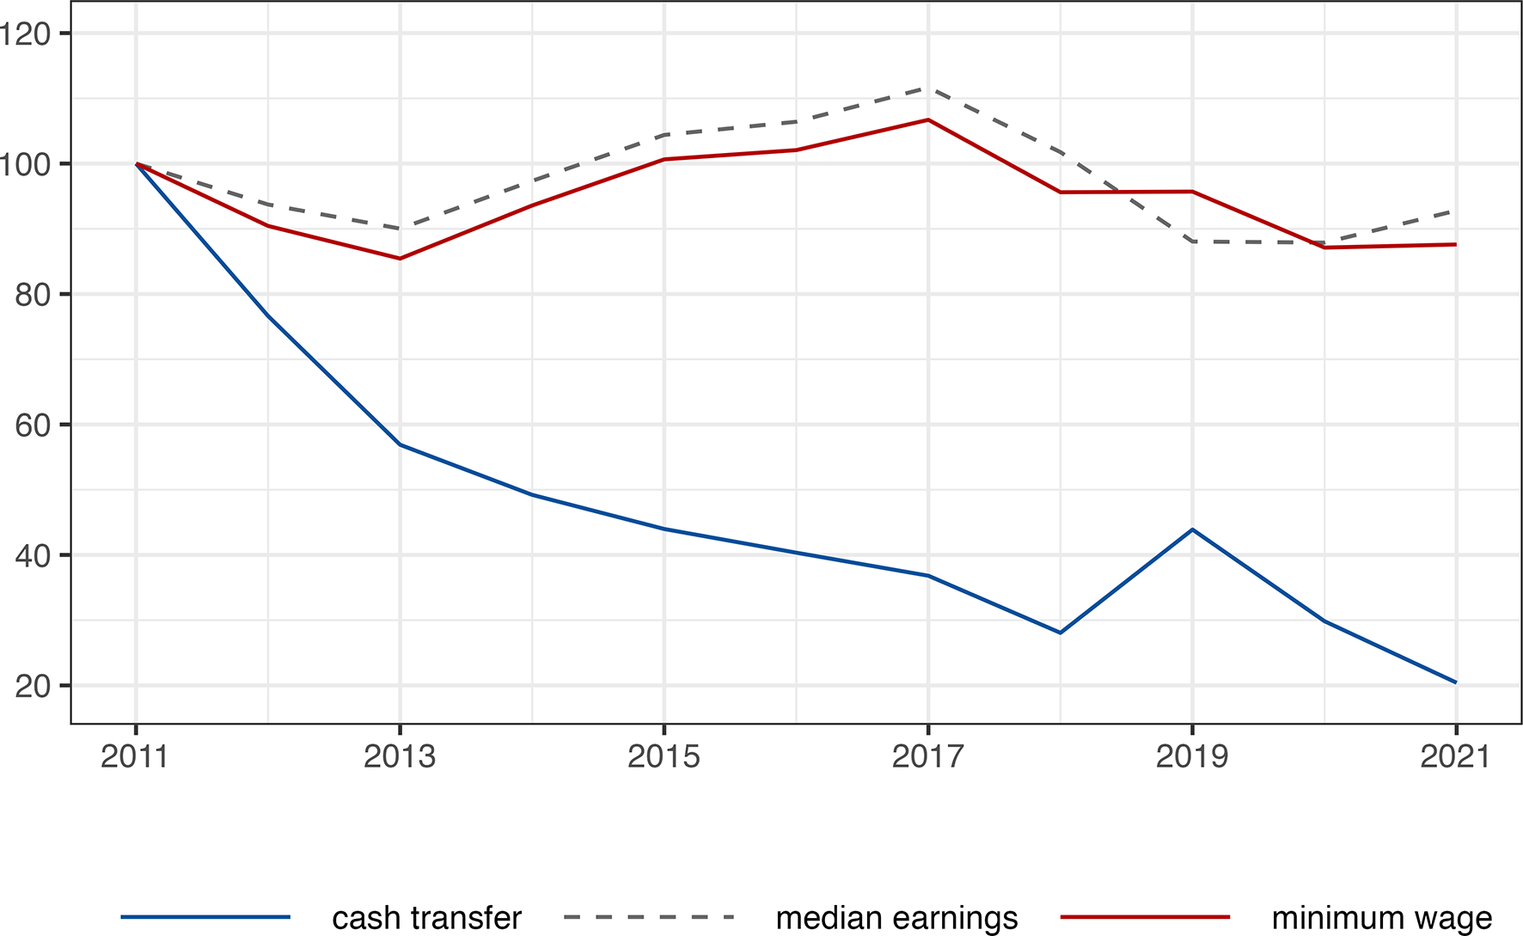
Despite some retrenchment, contentious bargaining within the SLC has helped to preserve minimum wage levels. Whereas the real value of the minimum wage has declined, total minimum compensation, which includes SLC-determined benefits, has remained largely stable (Fig. 7). This suggests that minimum wage protection has played a meaningful role in sustaining household incomes during the past decade. As illustrated in Figure 7, minimum wage protection contrasts with cuts to other social programs such as cash transfers (yārānih), which eroded as the government refused to adjust payments in line with inflation. In other words, the SLC and collective bargaining have emerged as critical mechanisms for resisting welfare retrenchment and defending key components of Iran’s welfare state.
Total minimum compensation and cash transfers, 2011–21 (real values, index with 2011 as base = 100).
Source: HEIS; SLC.
Notes: Median earnings were calculated for full-time workers ages 16 to 65 years. The minimum wage represents full base pay, including statutory benefits. Original figures in Persian years. HEIS, Household Expenditure and Income Survey; SLC, Supreme Labor Council.

Figure 7. Long description
The horizontal x-axis represents years from 2011 to 2021 in two-year increments. The vertical y-axis represents an index value starting at 100 in 2011 and ranging from 20 to 120.
* The cash transfer line, shown in solid blue, begins at 100 in 2011 and shows a steep, continuous decline to approximately 57 in 2013, continuing downward to a low of 28 in 2018. It has a brief spike to 44 in 2019 before falling to its lowest point of 20 in 2021.
* The median earnings line, shown as a dashed grey line, starts at 100 in 2011. It dips slightly to 90 in 2013, then rises steadily to a peak of approximately 111 in 2017. It then drops sharply to 88 in 2019 and ends at approximately 93 in 2021.
* The minimum wage line, shown in solid red, starts at 100 in 2011. It follows a similar path to median earnings but remains slightly lower for most of the period. It dips to 85 in 2013, rises to a peak of 107 in 2017, then plateaus at 96 through 2019 before ending at approximately 88 in 2021.
Resisting Reform
Frustrated by protracted negotiations and repeated breakdown of consensus, Iranian officials have launched several attempts—none successful—to reform the institutional framework governing wage determination. In 2024, following weeks of stalled negotiations, then–Labor Minister Sowlat Mortazavi (2022–24), a former mayor of Mashhad, was so dissatisfied with the entire process that he proposed transferring the SLC’s wage-setting authority to parliament. The plan was quickly abandoned, as it would have required politically costly amendments to the 1990 Labor Code.
A similar effort emerged in 2021, when parliament briefly considered a proposal (ṭarḥ) to introduce regional wage rates. The initiative was spearheaded by the Imam Hossein Employment Vow Charity Institute (Muʾasisih-yi Khayriyyih Nazr-i Ishtighal Imam Husayn), a little-known Islamic charity and handicraft business in Isfahan province. The organization argued that minimum wages benchmarked to major urban centers like Tehran were too high for rural areas. Using seemingly progressive language, its director, Akbar Akhavan Moghadam, claimed that high wage floors had depressed rural employment, particularly among women. He proposed a dualistic system based on “regional wages” (dastmuzd-i mantaqihī).Footnote 88 Relatively effective, the campaign quickly gained notoriety among leftwing intellectuals, becoming a symbol of their disdain of the perceived convergence between Islamism and neoliberalism in postrevolutionary Iran.Footnote 89 In 2023, a senior labor leader in the SLC criticized the parliament’s Seventh Development Plan, arguing that “its approach to wages has the same perspective as the Employment Vow Charity Institute.”Footnote 90
In contrast, government experts have generally opposed legislative reform, advocating instead for the full utilization of the labor code’s “existing capacities” (ẓarfiyathā-yi mūwjūd). Recent reports from the Majles Research Center emphasize that current employment law already de jure permits differential wage rates based on sector, age, and firm size. Implementing these provisions in practice would constitute meaningful reform without requiring new legislation. Importantly, these experts reject proposals for wage differentiation as “indefensible,” citing concerns such as the violation of agricultural workers’ rights. In doing so, they align with the formal labor opposition and the HCC-IWC.Footnote 91 Still, these experts acknowledge the need for action. As one MRC report concludes: “Even three decades after the approval of the Labor Code, no regulations in this field have been approved.”Footnote 92
Conclusion
To conclude an already long article, I have demonstrated why and how minimum wages have been catapulted to the forefront of Iranian politics. Crucially, I showed that minimum wage politics are not driven by workers’ associational power, at least not in the conventional way this concept is understood. Labor unions in Iran are weak and unrepresentative. Rather, I argued that the politics of pay are shaped by the incorporation of labor interests into the Iranian state and by the complex linkages between state institutions and civil society. Policymakers protect employment law not because they are representative agents, but because they have been given the mandate to advocate for worker interests, a mandate that they can exercise because their authority over certain rules and regulations, notably wage determination, is relatively insulated from other parts of the state and from capitalist interests.
At the same time, policy drift has turned the minimum wage into a central vector of elite contestation in the contemporary political economy of the Islamic Republic. In the context of economic sanctions and stagnation, the minimum wage sets both the level of poverty and the level of consumption. Originally intended to be no more than a technocratic instrument to prevent the worst forms of exploitation, Iran’s minimum wage has become a key tool for regulating inequality and household incomes, and in this broadly conforms to global trends. This transformation was gradual: a product of high modernist development in the 1960s and 1970s, the 1979 revolution, the 1980–88 war, and competitive electoral politics in the 1990s and 2000s. Over time, these processes combined to compound the reach and rigidity of wage regulations, and, alongside this, the centrality of the Supreme Labor Council.
Contemporary Iran is no conventional case of authoritarian wage moderation. There is no strong organized movement calling for wage repression or for slashing labor costs. Elites across the Islamic Republic call for (nominal) minimum wage increases while fiercely disagreeing on exact price hikes. However, if authorities often outwardly agree with struggling citizens that wages are too low, in Iran’s wage containment state, actors inside and outside the Supreme Labor Council ultimately converge on one thing: that popular demands for higher wages need to be contained. This short-term strategy is decided every year through collective bargaining. There are many reasons to believe that wage setting is backfiring and actively hurting the regime’s legitimacy. At the same time, it provides an annual spectacle whose principal agents have greater interest in continuing to play the game than in reforming the system.
Acknowledgments
For their helpful comments, time, and energy, I would like to thank Ahmad Ashraf, Kevan Harris, Massoud Karshenas, Homa Katouzian, Ali Mirsepassi, Ali Saei, Andrea Wright, Foruzan Afshar, Behrooz Ghamari-Tabrizi, Shozab Raza, and fellow postdocs at the Princeton Mossavar-Rahmani Center for Iran and Persian Gulf Studies. I thank Menno Fenger and Social Policy and Administration, as well as two anonymous reviewers for their feedback on an early draft. I am grateful to Social Science Research Council for its financial support. Above all, I would like to thank the two anonymous IJMES reviewers for their excellent comments and feedback. The views and mistakes in this article are solely my own.

 Open access