


INTRODUCTION
In archaeology the recovery and subsequent dating of multiple human remains can be problematic when they are unstratified, presenting a modeling challenge for the radiocarbon (14C) statistical analysis programs available, such as OxCal (Bronk Ramsey Reference Bronk1995), BCal (Buck et al. Reference Buck, Christen and James1999), or CALIB (Stuiver et al. Reference Stuiver, Reimer and Reimer2018). These programs take as input the 14C age determinations derived from organic remains and convert to calendar dates through a process of calibration via the universally agreed current IntCal curves (Hogg et al. Reference Hogg, Hua, Blackwell, Niu, Buck, Guilderson, Heaton, Palmer, Reimer and Reimer2013; Reimer et al. Reference Reimer, Bard, Bayliss, Beck, Blackwell, Bronk, Buck, Cheng, Edwards, Friedrich, Grootes, Guilderson, Haflidason, Hajdas, Hatté, Heaton, Hoffmann, Hogg, Hughen, Kaiser, Kromer, Manning, Niu, Reimer, Richards, Scott, Southon, Staff, Turney and van der Plicht2013). The calibration curve is not linear, and areas of plateau and inversion add to the modeling challenges.
In this paper OxCal is used to model simulated data in scenarios that are otherwise challenging. In a Bayesian 14C modeling framework (Buck et al. Reference Buck, Kenworthy, Litton and Smith1991; Bayliss et al. Reference Bayliss, Bronk, van der Plicht and Whittle2007; Bronk Ramsey Reference Bronk2009), a method is here proposed that allows meaningful results of modeled 14C determinations from unstratified multiple human bones such as may be found in tombs, mausoleums or cairns. In the statistical literature, where there is a series of events and the intervals between them are of interest, the intervals under investigation are known as waiting times. Common among the models used is the Log-Normal distribution, which is described by a median value and a long tail skew to the right (Limpert et al. Reference Limpert, Stahel and Abbt2001). The gap years (waiting time) between deaths is posited here as being Log-Normal. A Poisson distribution may also be suggested where the times between events being modeled are random, though the Log-Normal would appear to be a better fit (Figure 1). There are other candidate distributions, e.g. Gamma, Exponential. The Log Logistic is also a candidate, however for small populations it can be emulated by the Log-Normal (Dey and Kundu Reference Dey and Kundu2010) and is not considered further in this paper.
An example frequency count histogram of Gap Years (waiting times) between deaths, with a best fit Log-Normal (filled) and a Poisson (dashed) overlay Density curve. The Log-Normal is generally a better fit to the data.

Approximate death dates are estimated from analysis of 14C determinations of skeletal remains. Such determinations are then calibrated to convert to a calendar date within an uncertainty range commonly quoted with 95.4% probability. The calibrated date uncertainty may be further refined by modeling using Bayesian analysis, where additional prior information may be incorporated, such as stratification and event grouping (Buck et al. Reference Buck, Kenworthy, Litton and Smith1991; Bronk Ramsey Reference Bronk2009).
The most frequently used elements in Bayesian chronological models are Phases and Sequences. A Phase has a prior that a set of dates have uniform probability of occurring within some unknown interval α to β. A Sequence model adds information about the ordering of events within the Phase, this normally means that it is known a priori which sample follows another, but unless information is provided on the length of the gaps between events, this does not change the expected distribution of waiting times. In this method the events in a model can be divided up between boundaries. “The events between these boundaries are assumed to be uniformly distributed (with Poisson distributed intervals), but only over a limited time span. A bias is applied, the net effect of this is that the effective prior for the span of any group of events is now uniform, that is any span is treated as equally likely” (Bronk Ramsey Reference Bronk2009:3).
Fundamental to the arguments presented in this paper is that no sequential information exists, so the number of possible orderings of the events may be as great as N! The only event information that could be ordered would be from the radiocarbon determinations prior to calibration. By simulating real calendar dates, a comparison of Sequences can be explored to determine whether an alternative to the Phase model helps inform the uncertainty in challenging calibration curve areas.
This paper examines the period between death events in a restricted group such as may be found in a mausoleum, tomb, or burial group and proposes that, in appropriate circumstances, this gap frequency distribution may provide a useful prior. The term “Select Group” is coined here to denote a grouping where the individuals have a common association, not necessarily a blood relationship, kith as well as kin. The term goes beyond statistical sampling and thinning of data from a general population, to claim, in essence, that the Select Group is a unique selection of individuals chosen and buried for reasons that may be obscure to the modern eye, perhaps familial, dynastic, ritualistic, or selected in response to pressures on living conditions, etc.
Perhaps unconventionally, the result is introduced early, in Figure 2, as a guide during the subsequent diverse arguments.
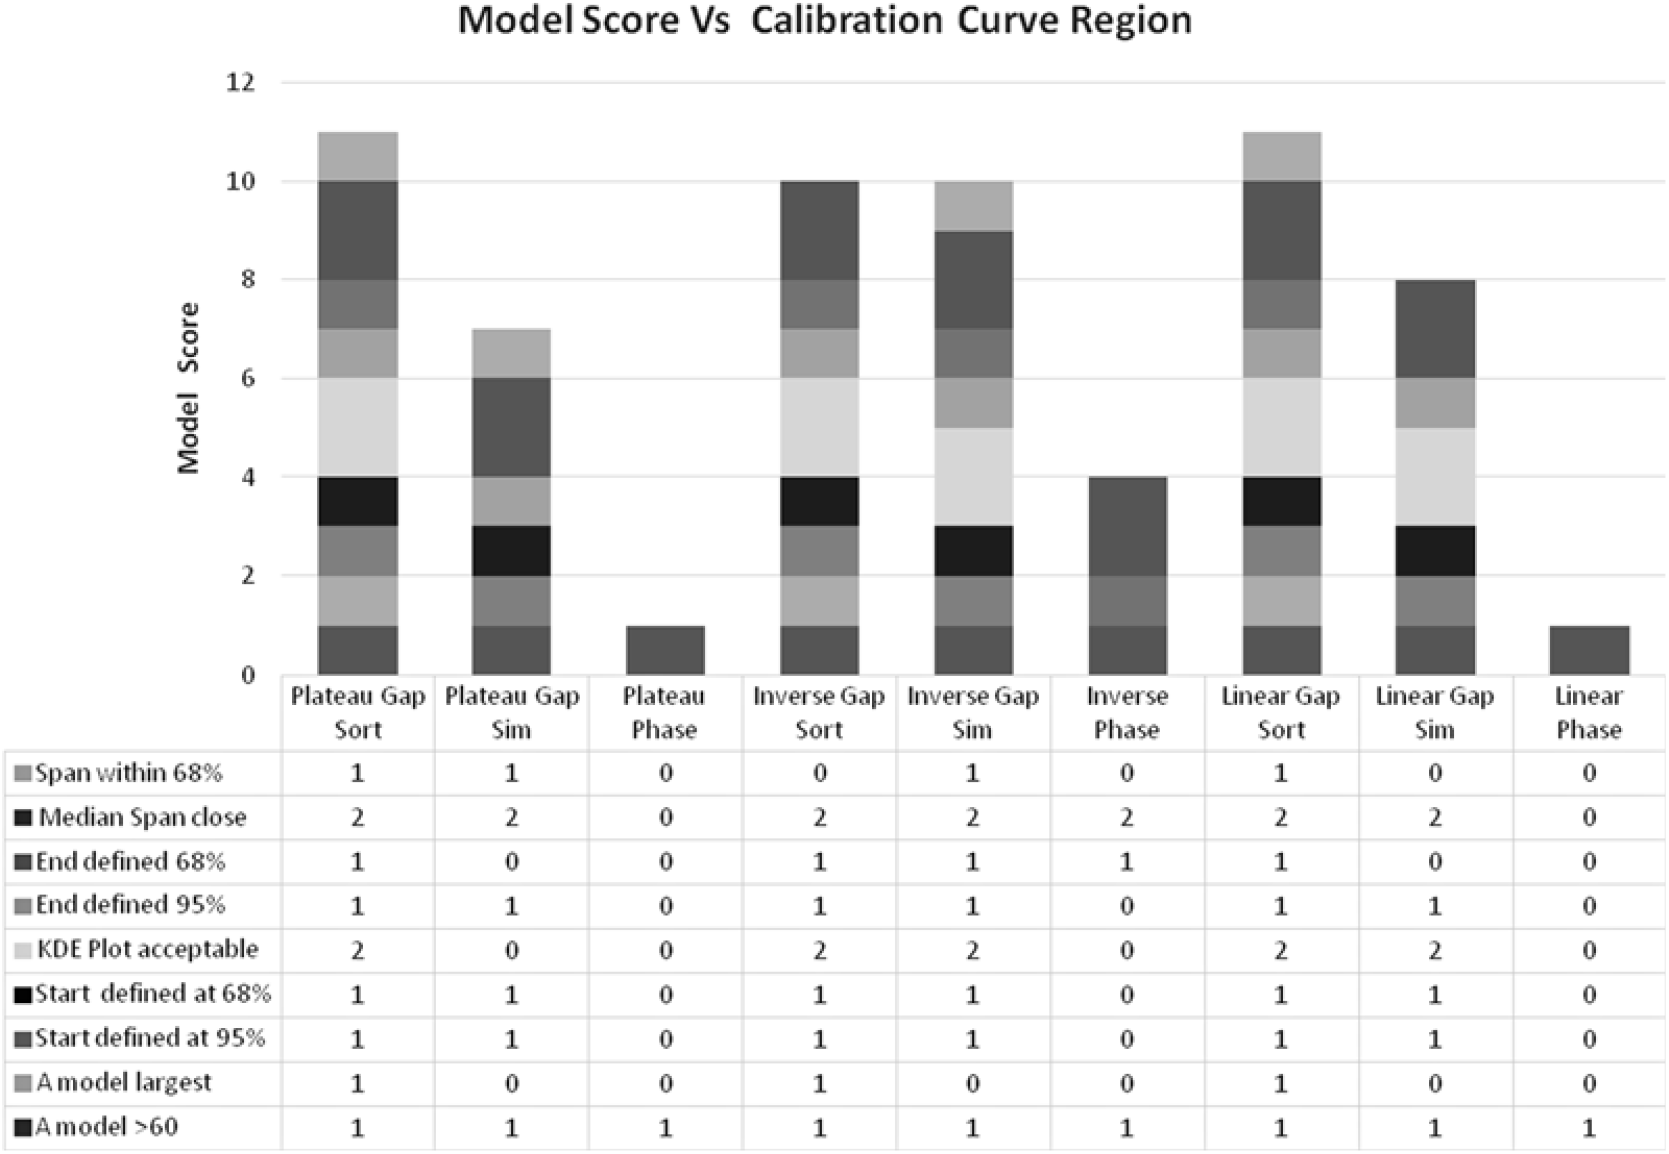
Comparing models of select group deaths on plateau, inversion and linear parts of the radiocarbon calibration curve. The Single Phase models (histogram positions 3, 6, and 9) perform poorly.
Although the concepts discussed are lightly mathematical, the content of the paper tries to avoid in-depth mathematics. The aim is to introduce a heuristic tool that may be useful to archaeologists who are already au fait with Bayesian modeling methods. In modern terms, a way to picture a Select Group is to consider a single family mausoleum where all or most of the dates are known, within a wider burial ground.
In order to test a factual source of information, data were gathered from Scottish Monumental Inscription Records (Mitchell Reference Mitchell1969; Mitchell and Mitchell Reference Mitchell1969). These cemetery collections record the calendar year of death AD on the headstone of the interred; some headstones provide a single name, others many names.
Data that record year of death were gathered and analyzed in order to establish whether the count of the Gap years, the waiting times, between deaths could be described by a mathematical distribution within a Select Group (Table 1). The data are compared with four distributions, i.e. Log-Normal, Poisson, Exponential and Gamma, using the R statistical program (R Core Team 2018), using the Akaike Information Criterion (AIC) (Akaike Reference Akaike, Petrov and Csaki1973), which statistically identifies the best fit (lowest value AIC) in model comparisons.
The Akaike Information Criteria (AIC) for the Select Group Monumental Inscription data. The lowest value (bold) indicates the best fitting distribution. The Log-Normal is a better fit model than Poisson.

FREQUENCY DISTRIBUTION OF WAITING TIME BETWEEN EVENTS FROM SCOTTISH CEMETERY MONUMENTAL INSCRIPTION RECORDS
It is required to test a hypothesis that the years between deaths in a Select Group can be modeled with a mathematical representation of a distribution. The following question is posed for a set of waiting time events:
Can the pattern of years between deaths be modeled by a particular distribution? The data are recovered from books on the Scottish Monumental Inscriptions pre 1855 (Mitchell Reference Mitchell1969; Mitchell and Mitchell Reference Mitchell1969). In all, nine sets are gathered, of 22 dates from each of nine pages. The nine sets of 22 consist of well-populated headstones on each page. These are selected to make up the 22 required from one or two headstones only. This forms the nine sets of the Select Groups. A Log-Normal distribution is posited as a potential model for a Select Group. The members are not necessarily blood relatives, but there will be some association that warrants their inclusion in the group headstone. The essence of a Select Group is the recognition that it is limited in size, not representative of a random selection from a larger population, but may be isolated from the general population burials, if indeed the general population burials are in evidence, which often they are not.
The source of the data is identified by the Monumental Inscription Record abbreviation and page number, e.g. SWM25, denoting a Group of 22 from South-West Midlothian page 25, or WL31, denoting a Group of 22 from West Lothian page 31. The Select Groups are saved as sg.csv comma-separated variable files for importing to the R Statistical program.
Data in calendar years AD are listed in supplementary Appendix 2. The number of times a gap of a particular length occurs (in years) between two events is calculated. For each Group, the resulting frequency histogram of number of events for each waiting time interval is tested. Log-Normal, Poisson, Exponential, and Gamma distributions are compared. Since the data are “binned” at yearly intervals, gaps of zero are avoided by adding a minor offset of 0.5 between any duplicate dates. This does bias towards a Log-Normal distribution; however, such occurrences are infrequent and could be practically eliminated by considering narrower “bin” sizes.
The Log-Normal model distribution is consistently more appropriate than the Poisson in Select Groups. The Exponential and Gamma are marginally better in only a few cases. It is therefore concluded that the Log-Normal provides a more consistent result overall. Using OxCal Bayesian Analysis (Bronk Ramsey Reference Bronk2009), and applying an interval between dates as an a priori constraint, with a Log-Normal Likelihood, can be shown to provide realistic insights that go beyond the common assertion that “the radiocarbon dated bones were unstratified thus Bayesian analysis was not possible” (Cook Reference Cook2000; Schulting et al. Reference Schulting, Sheridan, Crozier and Murphy2010).
Figure 1 shows the frequency count of the GapYears between deaths of a typical Select Group, shorter intervals between deaths are towards the left of the distribution, longer intervals are less frequent and the distribution tails off or skews to the right. A Log-Normal distribution and a Poisson distribution are shown for comparison. Note that the age at death is not an element of the analysis, only the gap (waiting time) between ordered deaths. The data are listed in Appendix 2 (see supplementary materials).
On this (AIC) evidence it can be proposed that the Intervals (GapYears) are modeled a priori by an uncertainty described by a Log-Normal distribution for between deaths gaps in a Select Group.
Modeling Unstratified Dates with Log-Normal Intervals
The Log-Normal distribution is available within the OxCal Bayesian Analysis program and can be characterized by two parameters, the scale or location parameter and the shape parameter. For a more in-depth explanation, see Appendix 1 in the supplementary materials.
In the context of Bayesian chronology’s terminology, groups of dated events may be considered as Sequences or Phases. The Sequence () term is used to define elements or groups that are in a particular order. A Phase () defines an unordered grouping. The fact that events are related in some way almost always means that they are part of some group of events that needs to be treated as a whole. Failure to do this will mean that the events are assumed to be entirely independent apart for the constraint applied. A model with more than two events that makes this assumption always results in a wider spread than is realistic (Steier and Rom Reference Steier and Rom2000). OxCal will generate a warning if no groups have been defined and yet constraints are imposed. The most frequently used assumption is that a group of events is randomly sampled from a uniform distribution—that is a random scatter of events between a start boundary and an end boundary (Buck et al. Reference Buck, Litton and Smith1992).
In considering an OxCal Bayesian model of a Select Group of individuals, for sequences of death events over time, with intervals between events, a model that has interval priors modeled with a Log-Normal Likelihood distribution might provide an alternative realistic scenario.
In applying the model to an appropriate set of radiocarbon determinations, the Interval between each is a priori the scale and shape parameters of the Log-Normal Likelihood distribution. Gap years created by multiple R simulations of random birth years plus random life expectancy, emulating the Select Groups, elicited factors of “3” and ln(2) as empirical rules of thumb. This would a priori be the LnN(ln(3 × mean time between events) and ln(2)), as a first approximation. For example if there are 20 events between 4600 BP and 4300 BP for a mean time of (4600–4300)/20 i.e. a mean value of 15 years between events, the Interval Likelihood would be LnN(ln(3 × 15),ln(2)).
Recalling that in Bayesian analysis:
The Prior times the Likelihood is proportional to the Posterior.
Then, given that a priori intervals exist, the analysis will modify each Likelihood interval to optimize the posterior intervals and the radiocarbon data. An illustration of Bayesian modeling using Log-Normal Likelihood Intervals is given in supplementary Appendix 3, the data are simulated from the real calendar dates of SGWL174 projected onto a plateau region of the calibration curve. The user supplies the variables b, (2 by default) n, the number of dates and d, the difference between the max and min R_Dates.
Having excluded the possibility of a multiple mass co-eval burial, say by performing an OxCal Combine function or other means, e.g. DSplit (Kintigh Reference Kintigh2015) to perform tests (Ward and Wilson Reference Ward and Wilson1978; Wilson and Ward Reference Wilson and Ward1981) it then would be an archaeological judgment whether a group of events constituted a Select Group (e.g. a Tomb or multiple burial site). Using Interval priors and Log-Normal Likelihoods does not preclude the inclusion of stratigraphic or other information in the model if such is available.
To illustrate the use of the model (supplementary Appendix 3) the Select Group of 22 dates from WL174 is employed. These dates range from 1724 AD to 1880 AD, a spread of 156 years. They are then shifted in time, as a group, to a period of the Radiocarbon Calibration Curve that displays a Plateau. A radiocarbon determination is simulated for each date, e.g. R_Date(“A1”, 4510, 25).
N.B. The OxCal function R_Simulate() creates a new random radiocarbon simulation of a calendar date each time it is used. In this paper, in order to repeat the same simulations for subsequent runs, the Simulated R_Dates are first created outside OxCal, using the Excel functions R=NORMINV(RAND(),0,1) as the random element of the simulation e.g. R_Date(BP(calBP(4510))+25×R, 25). Two versions of the same Simulated dates are used, i.e. Sorted (SORT) and raw Simulated (SIM), in order to compare the effects on different models.
An example of the effects of Inversion, Plateau, and Linear portions of the calibration curve on single radiocarbon dates is shown below in Figure 3; for example, a single determination at 4500 ± 25 BP on a plateau can acquire a 300-year calibrated uncertainty.
The effects of Inversion, Plateau, and Linear curve on a single radiocarbon calibration.

The logic in suggesting that the R_Dates are ordered before creating the Select Group Sequential model requires justification by the following argument:
If the R_Dates are on a steep Linear part of the calibration curve, then the possibility of achieving the correct ordering is quite high, as by definition we have a Select Group with a priori intervals between dates, which aids the dispersion of the R_Dates across the steep, monotonic, parts of the curve. Anomalous ordering if all the R_Dates are on the Linearity would show as poor Individual Indices.
Three models are then compared, where the 22 calendar dates (externally simulated R_Dates) are placed within start and end boundaries. An error term of 25 is applied in each case.
1. A Single Phase model, where only the simulated radiocarbon determinations are known.
2. A single Sequence model (SORT), sorted by simulated R_Date mean, with Log-Normal Likelihood intervals between each date which, as demonstrated earlier, is a good a priori scenario for Select Groups.
3. A single Sequence model (SIM), simulated from ordered calendar dates but without R_Date sorting, with Log-Normal Likelihood intervals between each date.
The results of each model are compared in Figure 4.
The above unmarked figures from top down A1, A2, A3, B1, B2, B3: A1, A2, A3, compare three simulated models on a Plateau. A1—Group as Sequence (SORT): R_Dates sorted. A2—Group as Sequence (SIM): R_Dates not sorted. A3—Group as a Phase. All simulate the same repeatable 22 ordered calendar dates. B1, B2, B3, compare the SPANS of three simulated models on a Plateau. A1—Group as Sequence (SORT): dates sorted. A2—Group as Sequence (SIM) not sorted. A3—Group as a Phase. The actual calendar span is 156 years.
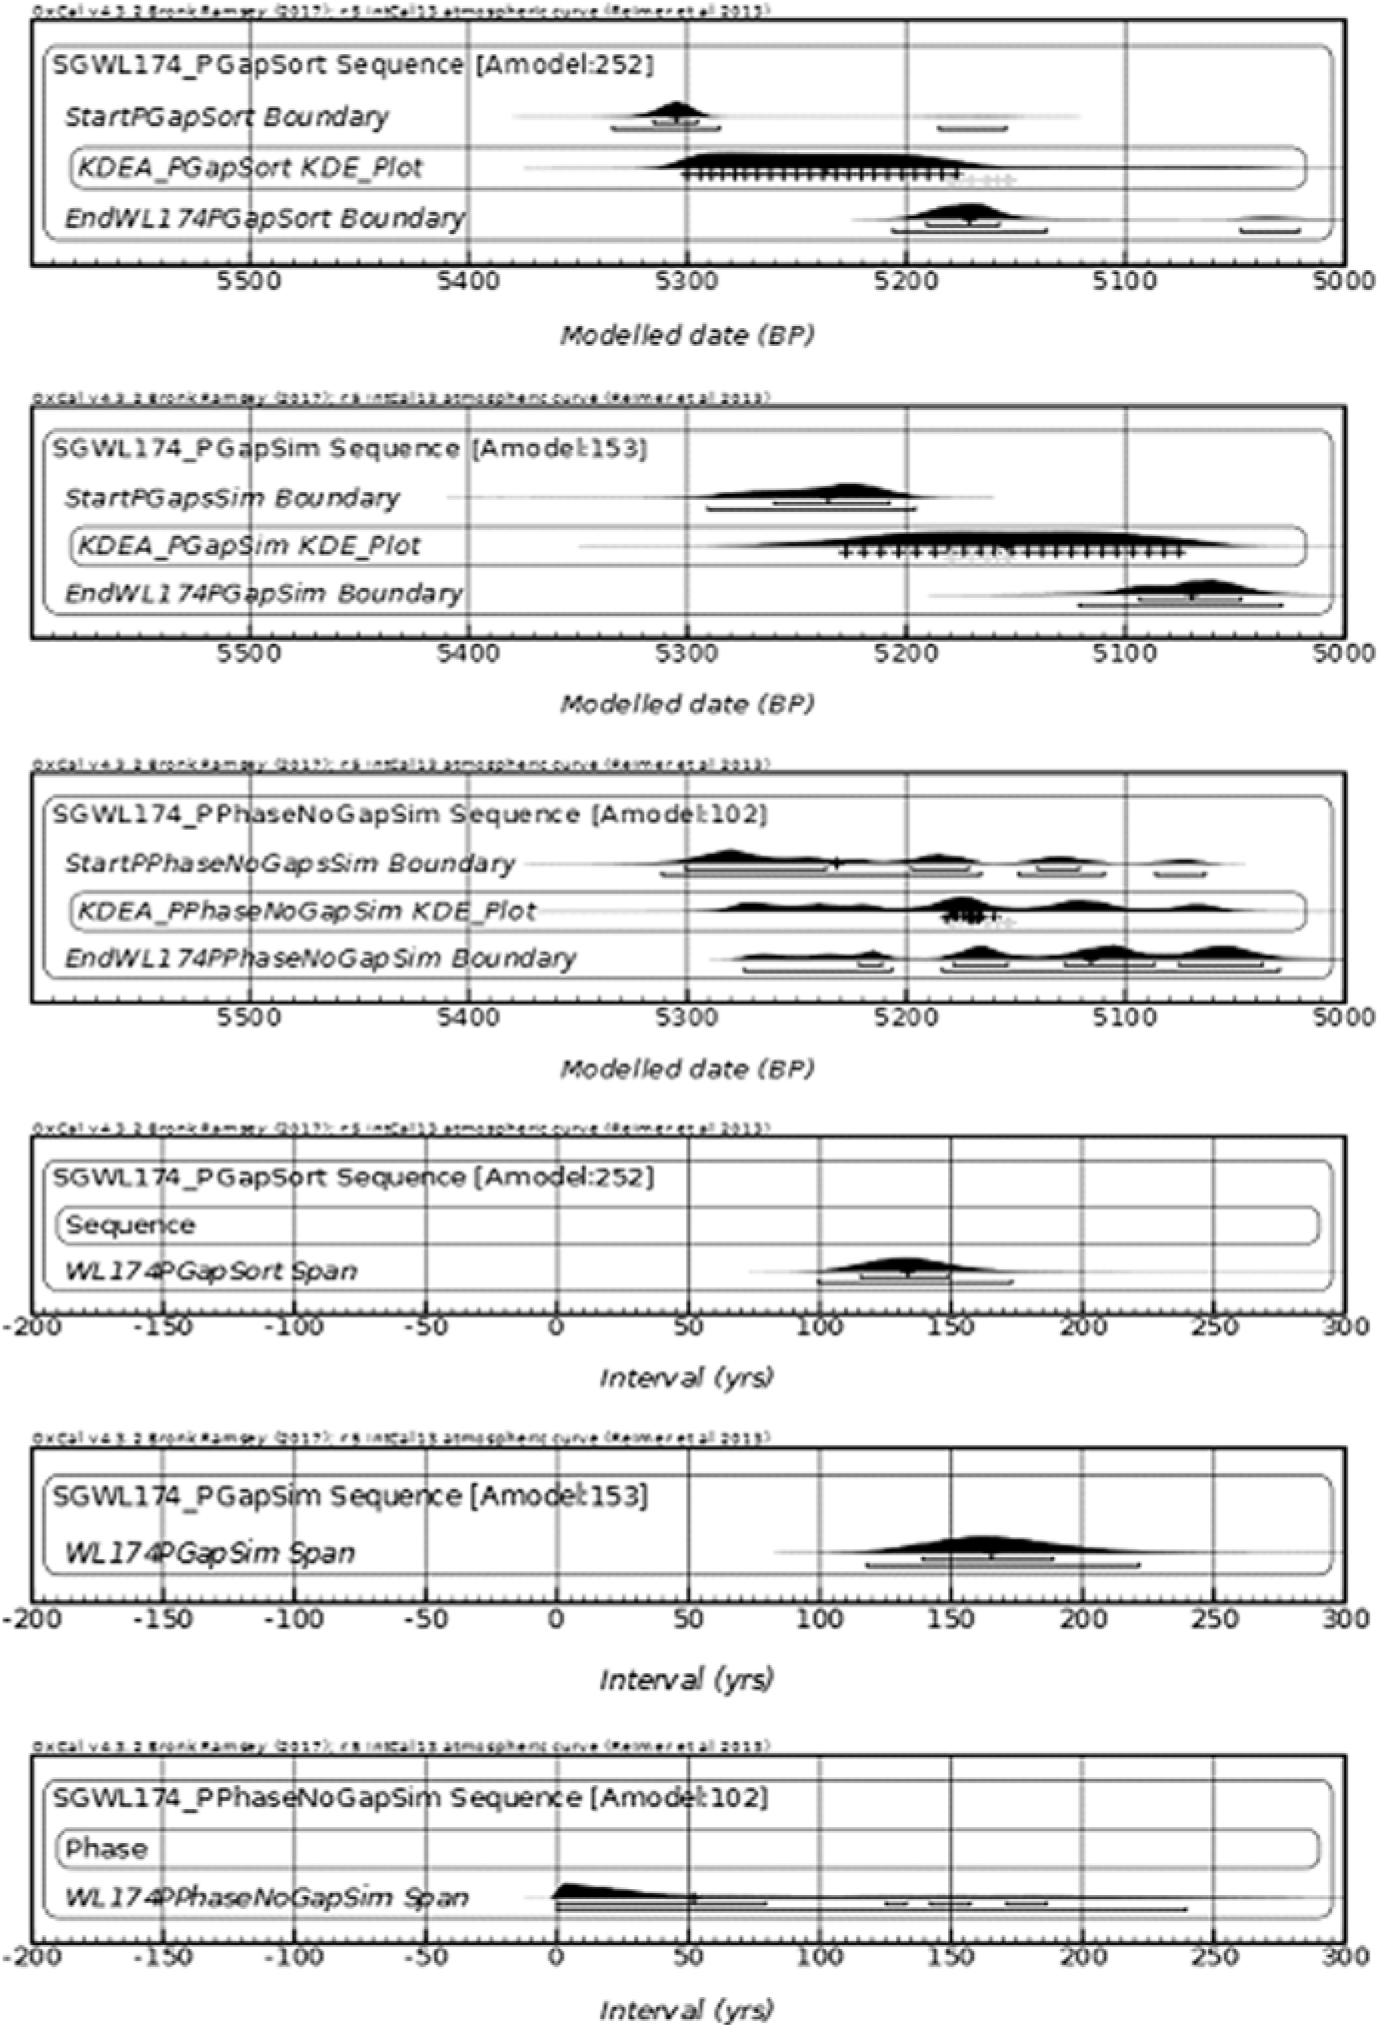
A kernel density estimate (KDE) plot (Bronk Ramsey Reference Bronk2017), summarizing the 22 posterior dates in each model is shown for clarity, in lieu of the 22 individual dates.
The analyses shown are set on a calibration curve Plateau, this being the most problematic in spreading the uncertainties in the calibrated dates, but the results can also be shown to be effective for Select Groups on Inversions and Linear portions of the curve (Figure 2).
In the above (Figure 4), figures A1 through B3, it can be seen that in the case of 22 simulated dates projected on a Calibration Curve Plateau, only in the models of a Sequence with Log-Normal intervals does the true span and range of dates approach that of the original calendar dates simulated from the Monumental Inscription records for SGWL17 (156 years). Figures A1, A2, A3, for clarity, show KDE plots (Bronk Ramsey Reference Bronk2017), of the posterior modeled distribution of all 22 dates as an alternative to showing individual date distributions.
The 22 dates in A1 and B1 of Figure 4 are sorted, or ordered, by the mean of the simulated R_Date (SORT). In A2 and B2 these same R_Dates are not ordered and contain the initial simulation randomization (the original calendar dates are ordered) (SIM). The results are similar except that the A_model Agreement Index in the unordered simulated Log-Normal case (SIM) is lower (252 vs. 153), since some random Individual Indices have poor agreement. In the two Sequence models A1 and A2, with the same number of parameters and data, i.e. simulated from the same calendar dates, a Factor can be used to compare models. Bronk Ramsey (Reference Bronk2009:356–357) describes the implementation and explains that the F_models are “not, strictly speaking Bayes’ Factors but they can be compared between different models in a similar way.” Millard (Reference Millard2015), summarizes this as: “According to Bronk Ramsey (Reference Bronk2009), the A_model is a transformation of F_model and F_model is an approximation to a pseudo-Bayes Factor. Bayes Factors can be used to compare models. F_model compares a given model to a null model with no constraints. So, for all models incorporating exactly the same set of radiocarbon dates, the null model is exactly the same. Thus using that F_model = (A_model/100)^sqrt(n) where n is the number of likelihoods, then for two models A and B, we have that F_modelA/F_modelB = (A_modelA/A_modelB)^sqrt(n) and this can be used as an approximation to a Bayes Factor between the two models. Bayes Factors greater than 5 or 10 are generally reckoned to be strong evidence to prefer one model over another.”
Here, (A_modelA/A_modelB)^sqrt45 is (252/153)^6.7 = Approx. Bayes Factor 24.
From which it may be suggested that, lacking additional stratification or other ordering information, ordering the R_Dates by their Mean may be preferred. The true order of calendar dates on a plateau is likely unknowable with N! i.e. 22! = 1.124e+21 possible permutations. The important information of span and boundaries range may be recovered, as well as a realistic portrayal of the KDE plot time dispersion of the burials, though not necessarily the original calendar order.
In comparing the Spans the Single Phase model KDE Plot of Figure 4, Figure B3 depicts all dates as having their medians clustered around 5180 BP and a span between 0 and 240 years at 95.4% uncertainty, most likely below 50 years. It does not appear to be a good representation of the original SG_WL174 span of 156 years. The Sequence (SORT) with Log- Normal Likelihood intervals between dates provides an a priori constraint on the analysis. In the MCMC analysis the posterior Intervals are adjusted to accommodate the spread of the dates. The Span has a 95.4% uncertainty of 100–175 years, which is a reasonable match for the expected Span of 156 years.
N.B. the Phase model does produce a posterior ordering which can be useful. Employing a hermeneutic spiral philosophy, where the posterior data from one model is input as a prior to a subsequent model (Bayliss et al. Reference Bayliss, Bronk, van der Plicht and Whittle2007:4–5; Hodder Reference Hodder1992: Fig.22), a refinement would be to run a Phase with the Order command, exporting the table view. csv file to Excel and data sorting by modeled median date column. Importing the rearranged R_Dates as a Sequence with Log Normal intervals may improve the model. In the SGWL174_PGapSort example, the A_model index of 252, span 134 (100–175 at 95.4%), then improved to A_model index of 266, span 155 (111–197 at 95.4%) This is an approximate Bayes’ Factor of 1.4, and hardly significant, though the span median of 155 is in better agreement with the original calendar data span of 156.
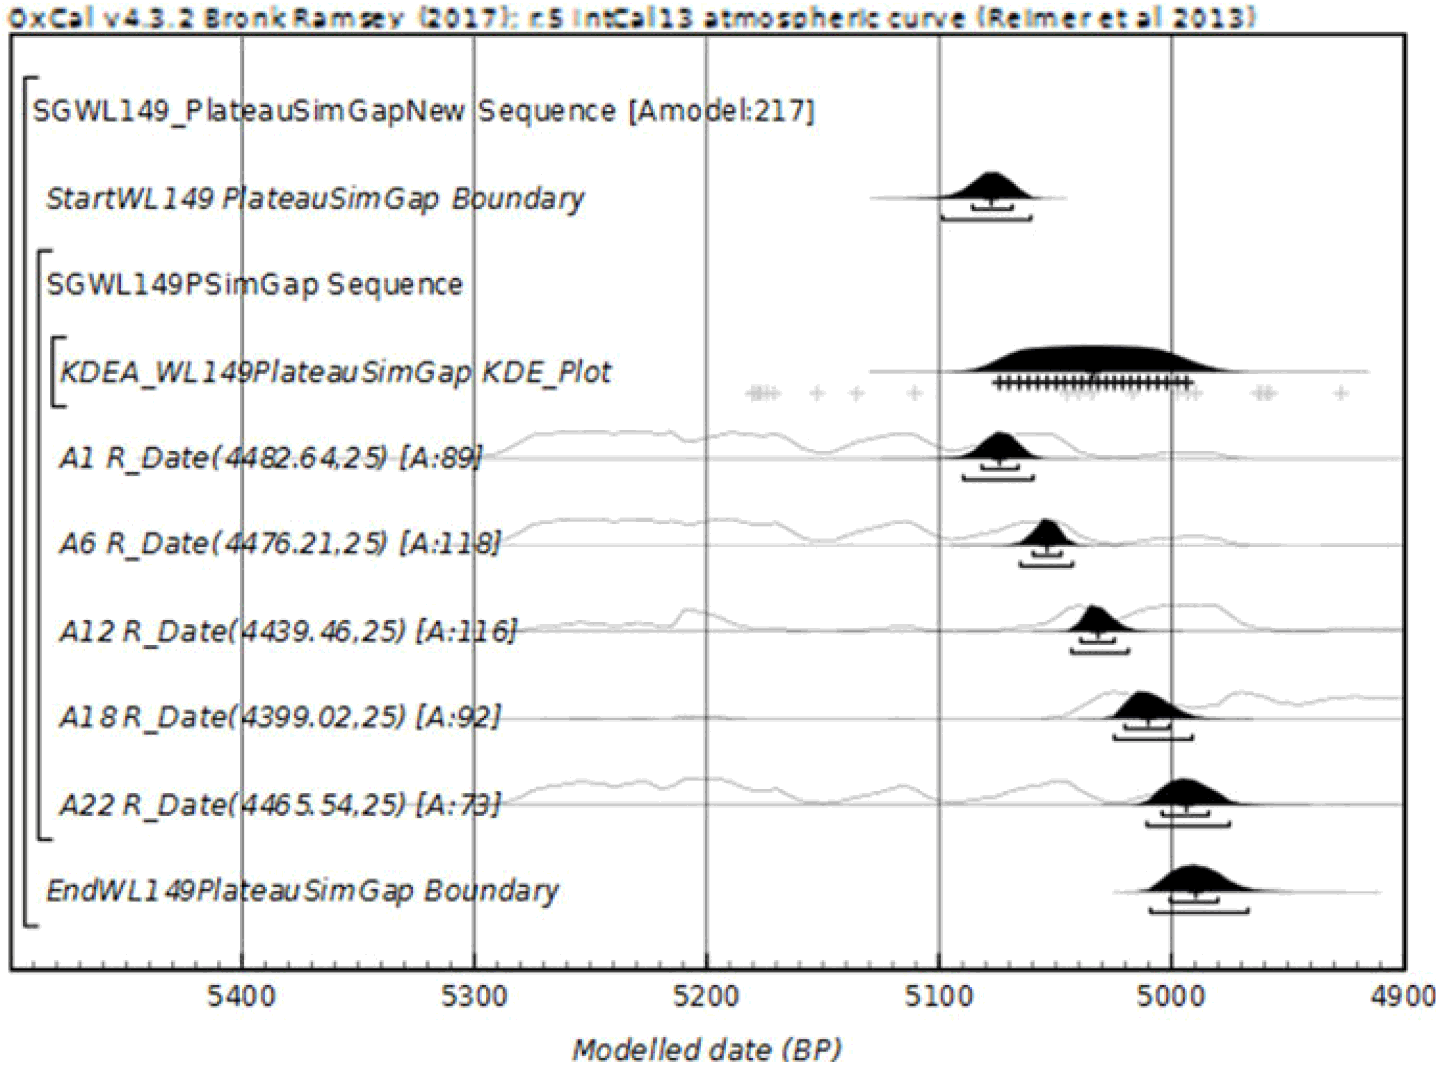
Figure 5 of another Select Group, WL149, projected on a plateau, is also shown below. For clarity only 5 of 22 dates are shown.
A second Select Group, only five dates shown for clarity. Over a Plateau, 22 simulated calendar dates of SG WL149 with Log-Normal Intervals. Expected span 92 years, range 5092 BP–5000 BP.
In modeling multiple dates over a calibration curve plateau, it may be considered that the order of the dates in a Sequence in the absence of stratification is less important; each radiocarbon determination creates a very wide uncertainty in the calibrated date.
However, if it is anticipated that the multiple deaths are not a single event and with the additional knowledge that the a priori gaps between them can be modeled using a Log- Normal Likelihood distribution, the outcome of the model can provide renewed insights. Ordering the dates by the Mean of the radiocarbon determination can be a useful first approximation, in addition to any stratification or other prior information.
However, if the R_Dates are on a curve Plateau then many permutations can produce the same or similar wide uncertainties, the calibration curve is not monotonic and we have no way of identifying the correct order, unless additional information is available, such as stratification or familial relationships. Therefore, ordering by the R_Date Mean in the absence of such additional information is proposed. The Likelihood interval uncertainties interleaved with the R_Dates then present a strong constraint on the posterior dates, the MCMC analysis finding a solution commensurate with the ensemble of calibrated R_Dates and the defined Likelihood intervals. The result is a wider Span than found in a simple Sequence without Intervals, where the dates are minimally spread over the posterior model. (A simple Sequence model created by placing “//” before the intervals to effectively delete them from the SIM or SORT models results in an implausibly short span with median about 60 years due to omission of the appropriate log-normal intervals. Not illustrated.) In the Select Group scenario, on a Plateau region of the curve, lacking the correct ordering is less important than achieving a coherent KDE and span of the dates that takes the Log-Normal Likelihood intervals into account. The model may be wrong, but not importantly wrong (Bayliss et al. Reference Bayliss, Bronk, van der Plicht and Whittle2007). The Tomb itself is not necessarily being dated, as bones may have been kept elsewhere for some time prior to the tomb build and subsequent deposition. Even stratification may be unhelpful if prior storing of bones is a factor.
There is a strong similarity in this model with the OxCal Age Depth model “V-Sequence Equivalent,” which uses a Gaussian N(10,5) as the interval Likelihood, but the N(μ,σ) depth Interval Likelihood is unsuitable and is replaced with a Log-Normal time Interval Likelihood.
APPLYING LOG-NORMAL LIKELIHOOD INTERVALS TO REAL DATA
Archaeological papers sometimes point out that the lack of stratification in tomb burials makes the use of Bayesian Analysis challenging, particularly if the radiocarbon determinations straddled a plateau (Hedges et al. Reference Hedges and Parry1980; Cook Reference Cook2000; Schulting et al. Reference Schulting, Sheridan, Crozier and Murphy2010; reappraised in Walsh et al. Reference Walsh, Knüsel and Melton2011). This paper offers a method of improving on that claim. The object here is not to challenge the original conclusions of such reports, but to offer an alternative method of interpreting the data in difficult circumstances. Only the originators of the papers are in a position to judge, as they will have all the relevant information. However, a detailed simulation has been performed here, using real data from the Monumental Inscription Records of Select Groups burials, projected onto challenging areas; a Plateau, an Inversion and a Linear portion of the calibration curve. In each of the three curve areas, three models are compared: (a) Simulated dates ordered as a Sequence with Log-Normal intervals, (SORT); (b) Simulated dates (R_Dates unordered) as a Sequence with Log-Normal intervals, (SIM); (c) Simulated dates as a Single Phase.
Comparisons of the three models ask the following questions, scoring 1 for yes and 0 for no:
A_model >60 (A_model Index meets the minimum agreement index of >60)
A_model largest (In each curve area, the model with the largest A_model Index)
Start defined at 95% (Is the start boundary well defined at 95% probability)
Start defined at 68% (Is the start boundary well defined at 68% probability)
KDE Plot acceptable (The KDE Plot matches the full range of the calendar dates simulated) End defined at 95% (Is the end boundary well defined at 95% probability)
End defined at 68% (Is the end boundary well defined at 68% probability)
Median Span close (Is the Median Span of dates close to the original calendar dates span)
Span within 68% (Does the Span include the span of original dates at 68% probability)
Plots such as Figure 4 (the Plateau scenario) were consulted in deciding these scores. The terms “well defined” and “close” call on sensible interpretation by a decision maker, comparing plots of the simple Phase model with the SORT and SIM models, judging whether or not sufficient improvement is gained to support adoption of the alternative Select Group model.
The KDE Plot and Median Span items are weighted “2” to reflect their importance in the model comparisons. The results are shown in Figures 2 and 6. In all cases the Single Phase model scores worse. The Sorted Sequence (SORT) with Log-Normal intervals scores best. The unsorted Sequence (SIM) with Log-Normal Intervals gives acceptable results but is susceptible to the random variability when simulated. It is also only a check in this exercise.
Select Group Bayesian model score for each of three regions of the calibration curve, Plateau, Inversion and Linear. A Single Phase model (histogram positions 3, 6, and 9) scores lower in each case.

The method may deviate from a strictly conventional Bayesian analysis. However, considered as a heuristic alternative model, it has merit with few additional overheads when using the suggested format in supplementary Appendix 3. In use it is suggested that a Phase model is first conducted, and then compared with a Sequence with Log-Normal intervals. Additional effort employing a hermeneutic spiral to re-sort the R_Dates may prove fruitful.
CONCLUSIONS
By considering that there is a strong case for the a priori intervals between human deaths in a Select Group, to be Log-Normal in their Likelihood distribution, a Bayesian model can be posited that analyses this information, such that the a priori constraint, times the Likelihood, leads to a plausible Posterior scenario. In the absence of stratigraphic information, such a model can produce a realistic scenario sometimes not seen in a Single Phase model. It can be particularly useful when the radiocarbon calibration curve is in an area of plateau or inversion.
An archaeological recognition of the Select Group would be required, such as a multi burial tomb, mausoleum or burial group. The possibility of a single mass death event would need to be discounted (in which case a Single Phase model might be more appropriate). R_Dates on a plateau can be almost indistinguishable, hence obtaining a correct order in the Sequence can be challenging. However, the archaeological question is often about the Start and End boundaries and the Span between. These R_Dates have been shown to be less susceptible to alternative orderings within a Sequence on a Plateau and ordering by the Mean of the Radiocarbon Determination is suggested as a first approximation. Any stratigraphic or other a priori constraints available would also be applied.
“All models are wrong, some models are useful” (Box Reference Launder and Wilkinson1979).
The three sample models are suggested in supplementary Appendix 3. The user provides the data for the variables “b” i.e. “2,” “n” the number of dates and “d,” the max and min R_Dates. Intervals LnN(ln(a),ln(b)) are then simply placed between each (sorted) R_Date and calculated automatically.
ACKNOWLEDGMENTS
I wish to thank Christopher Bronk Ramsey for his criticisms and insightful comments on an earlier draft of this article as well as his guidance on the use of the OxCal program and method of simulating R_Dates outside the OxCal program, without which this analysis would not have been possible. I am grateful to Neil Curtis for his editorial guidance and to Meg Hutchison and William Risk for their comments and encouragement and to Tom Dye and several others for their constructive comments. In particular, thanks are due to A. J. Timothy Jull and the two anonymous reviewers, whose extensive and constructive comments guided several revisions. Needless to say, I am solely responsible for any errors or omissions.
SUPPLEMENTARY MATERIAL
To view supplementary material for this article, please visit https://doi.org/10.1017/RDC.2019.48.


 Open access

