


1. Introduction
The working capital channel is a crucial element of modern monetary policy models since it allows monetary policy to have real effects through the marginal cost of the firm and helps to explain the price puzzleFootnote 1 (Ravenna and Walsh, Reference Ravenna and Walsh2006; Henzel et al. Reference Henzel, Hülsewig, Mayer and Wollmershäuser2009; Christiano et al. Reference Christiano, Trabandt and Walentin2010). Despite its relevance, surprisingly, few studies have investigated the quantitative relevance of this channel using microeconomic data or addressed whether or not it is the same across firms. In this paper, I contribute to the literature by filling this gap. Specifically, I first develop a macro-finance model to understand the working capital channel. I then use that model to estimate this channel based on microeconomic data at the firm level for the entire sample in Compustat and seven industries. The estimations show that the working capital channel is not as strong as assumed in the literature, and this channel is heterogeneous across industries. These results suggest that the effects of the monetary policy through this channel depend on the type of industry and open the question of whether the price puzzle is still solved at the industry level.
What is the economic mechanism behind these results? Corporate cash. It is well-known in corporate finance literature that firms use cash to finance short-term necessities (Riddick and Whited, Reference Riddick and Whited2009), complementing short-term loans. Furthermore, the precautionary motive incentivizes firms to accumulate cash to face financial decisions in adverse states of the nature of the economy, such as an increase in the short-term interest rate (Potì et al., Reference Potì, Pattitoni and Petracci2020; Gao et al. Reference Gao, Harford and Li2013, Reference Gao, Whited and Zhang2021). This corporate finance characteristic has not been considered in monetary policy models, implying that the working capital channel is assumed to be larger than it is empirically.
Since working capital loansFootnote 2 are essential for business continuity, the effects of interest rate movements can be transmitted by working capital loans to the real and financial decisions of the firm. In short, the mechanism of the working capital channel is as follows: A positive shock in the interest rate generates an increase in the marginal cost of production inputs, which are financed by working capital loans. As a result, a firm optimally decreases working capital demand, decreasing production. In contrast, if the firm had sufficient cash to finance the working capital necessities, working capital loans are unnecessary. Hence, the impact of the interest rate on the firm’s decision disappears. Therefore, understanding the size of this channel—that is, how much working capital is financed via working capital loans—is crucial for understanding the effects of monetary policy.
Given the relevance of the working capital in a firm’s decisions, several general equilibrium macroeconomic models have explicitly analyzed the supply-side effects of monetary policy through the working capital channel (Blinder, Reference Blinder1987; Christiano and Eichenbaum, Reference Christiano and Eichenbaum1992; Christiano, Reference Christiano1997; Ravenna and Walsh, Reference Ravenna and Walsh2006; Christiano et al. Reference Christiano, Trabandt and Walentin2010, Reference Christiano, Eichenbaum and Trabandt2015; Mendoza, Reference Mendoza2010; Jermann and Quadrini, Reference Jermann and Quadrini2012; Mahmoudzadeh et al. Reference Mahmoudzadeh, Nili and Nili2018). These models rationalize the working capital channel assuming that firms must pay their production factors before receiving revenues from sales and must borrow to finance these payments. These models have two features in common: They use aggregate data and assume that a firm finances the totality of its variable cost through working capital loans. This means that the working capital channel is complete in the economy. But what if firms do not take out loans and use cash instead? Additionally, the amount borrowed could probably be quantitatively different across industries.
I address this issue with an alternative technique. I estimate a structural model of corporate investment with working capital loans using SMM. To do this, I follow three steps. First, I solve the model numerically and analyze the policy functions to understand the role of the working capital channel when the firm suffers an interest rate shock. Second, I identify what moments depend on the value of the main parameter that I estimate—the proportion of working capital requirement that is financed by loans, $\phi$
. I then evaluate six empirical moments: the mean and variance of profitability, investment rate, and working capital loans. Finally, I estimate
$\phi$
. I then evaluate six empirical moments: the mean and variance of profitability, investment rate, and working capital loans. Finally, I estimate $\phi$
by SMM for the entire sample, which includes all firms listed in Compustat (except firms related to financial services, utilities, and government administration), allowing
$\phi$
by SMM for the entire sample, which includes all firms listed in Compustat (except firms related to financial services, utilities, and government administration), allowing $\phi$
to vary across seven industries.
$\phi$
to vary across seven industries.
If I impose that $\phi$
is constant across industries, the estimation suggests that its value is 0.758. This means that firms, on average, finance 75.8% of their working capital requirements with loans. Furthermore,
$\phi$
is constant across industries, the estimation suggests that its value is 0.758. This means that firms, on average, finance 75.8% of their working capital requirements with loans. Furthermore, $\phi$
looks to vary in the data. The Retail Trade sector has the lowest value of
$\phi$
looks to vary in the data. The Retail Trade sector has the lowest value of $\phi$
(0.482), while three sectors (Agriculture, Construction, and Wholesale Trade) have a full working capital channel (
$\phi$
(0.482), while three sectors (Agriculture, Construction, and Wholesale Trade) have a full working capital channel ( $\phi =1$
). This means that a positive interest rate shock will have greater effects on Agriculture, Construction, and Wholesale Trade firms, than on retail firms. Meanwhile, for the Manufacturing sector, which represents almost 60% of the data,Footnote
3
$\phi =1$
). This means that a positive interest rate shock will have greater effects on Agriculture, Construction, and Wholesale Trade firms, than on retail firms. Meanwhile, for the Manufacturing sector, which represents almost 60% of the data,Footnote
3 $\phi$
is strong (0.701).
$\phi$
is strong (0.701).
This paper fits into both the theoretical and empirical literature on corporate borrowing (Riddick and Whited, Reference Riddick and Whited2009; Jermann and Quadrini, Reference Jermann and Quadrini2012; Michaels et al. Reference Michaels, Page and Whited2019; Mahmoudzadeh et al. Reference Mahmoudzadeh, Nili and Nili2018). I contribute to this literature by considering the additional assumption of requiring working capital and, hence, the possibility that an interest rate shock affects the firm’s decisions. From a methodology perspective, this paper belongs to the growing literature of structural estimation in corporate finance (Hennessy and Whited, Reference Hennessy and Whited2007; DeAngelo et al. Reference DeAngelo, DeAngelo and Whited2011; Nikolov and Whited, Reference Nikolov and Whited2014; Michaels et al. Reference Michaels, Page and Whited2019). Furthermore, this paper is related to the monetary policy literature (e.g. Ravenna and Walsh, Reference Ravenna and Walsh2006; Christiano et al. Reference Christiano, Trabandt and Walentin2010). The main assumption of this literature is that the working capital channel is full—that is, the firm needs to finance the totality of its variable cost with working capital loans—and this literature usually uses only aggregate data.
The paper is organized as follows. Section 2 presents preliminary evidence of the working capital channel. Section 3 and 4 present the model and simulations. The estimation process and results are described in Section 5 and Section 6. Section 7 concludes.
2. Preliminary evidence
In this section, I provide evidence of the effects of interest rates on working capital loans at the aggregate level. More precisely, I regress the working capital ratio on the interest rate and three control variables (log of total assets, profitability ratio, and investment rate). Corporate variables are defined in Table 1, while the interest rate is a 3-month T-bill. I follow the specification of the regression model outlined by Gao et al. (Reference Gao, Whited and Zhang2021), with an important difference being that while these authors consider the dependent variable as a definition of corporate cash, I consider it as the working capital ratio. Thus, the regression model that I inspect is as follows:
 \begin{eqnarray} \text{working capital ratio}_t &=& \beta _0 + \beta _1 \text{ interest}_t + \beta _2 \text{ interest}^2_t + \beta _3 \text{ log(total assets)}_t\nonumber \\ & & + \beta _4 \text{ operating income/total assets}_t \nonumber \\ & & + \beta _5 \text{ capital expenditure/total assets}_t \end{eqnarray}
I use annual data for estimation, with the sample covering the period from 1971 to 2018.Footnote 4 Table 1 contains the results from estimating equation (1) for seven industries. Interestingly, the interest rate is statistically significant in explaining the five industries’ working capital ratios. Second, the relationship between interest rate and the working capital ratio seems nonlinear for the three industries. Third, the estimated coefficient of the interest rate is positive for six industries, suggesting a positive correlation with the working capital ratio. While this might seem puzzling at first glance, there is evidence that short-term leverage exhibits this behavior (Narayan et al. Reference Narayan, Bui, Ren and Ma2021). It is important to note that working capital loans fall under short-term debt. A tentative explanation for this finding is that firms may accumulate cash as a precautionary measure, leading them to prefer using loans to finance working capital needs even when interest rates increase. These results suggest that the working capital channel is different among industries, which I estimate in the following sections using SMM.
Working capital loans and interest rates: Aggregate-level evidence

This table reports estimation results from estimating the regression model in equation (1) on the interest rate and three control variables at an annual frequency (log(total assets), ratio of operating income to total assets, and ratio of capital investment on total assets). Heteroskedasticity-consistent standard errors are reported in parentheses. The significance levels are indicated by $^*$
,
$^*$
, $^{**}$
, and
$^{**}$
, and $^{***}$
for 10%, 5%, and 1%, respectively.
$^{***}$
for 10%, 5%, and 1%, respectively.
I complement the previous analysis by estimating a one-lag vector autoregressive (VAR) model using annual data covering the period 1971 to 2018. The VAR model is described as follows
 \begin{equation} Y_t = \alpha + \beta Y_{t-1} + \epsilon _t, \end{equation}
where $Y_t$
is a vector of four variables: profitability ratio, working capital ratio, investment rate, and interest rate (3-month T-bill rate). Following the standard procedure of VAR estimation (e.g. Christiano et al. Reference Christiano, Trabandt and Walentin2010), I compute the impulse-response functions (IRFs) of working capital ratio to interest rate shock for seven sectors, shown in Figure 1. The IRFs reveal important patterns. Firstly, the effect of interest rates on working capital loans varies in size and direction among sectors. Secondly, the working capital ratio of the Agriculture, Mining, and Retail Trade sectors responds positively to an increase in interest rates, implying that the debt in current liabilities over total assets increases when the interest rate rises. One potential reason behind this behavior is that these sectors have strong working capital requirements and limited cash availability. Even when the interest rate increases, they prefer to use working capital loans. For instance, mining firms require high working capital amounts per period, even when positive cash flows from the project will be obtained in some future periods. Thirdly, the Construction, Manufacturing, Wholesale Trade, and Services sectors display negative IRFs, suggesting that an increase in interest rates would reduce the working capital ratio. One conjecture is that these sectors could more easily use cash to meet working capital requirements, thus reducing their dependency on banking loans if the cost of debt increases. Overall, the IRFs illustrate the heterogeneity of the working capital ratio among sectors.
$Y_t$
is a vector of four variables: profitability ratio, working capital ratio, investment rate, and interest rate (3-month T-bill rate). Following the standard procedure of VAR estimation (e.g. Christiano et al. Reference Christiano, Trabandt and Walentin2010), I compute the impulse-response functions (IRFs) of working capital ratio to interest rate shock for seven sectors, shown in Figure 1. The IRFs reveal important patterns. Firstly, the effect of interest rates on working capital loans varies in size and direction among sectors. Secondly, the working capital ratio of the Agriculture, Mining, and Retail Trade sectors responds positively to an increase in interest rates, implying that the debt in current liabilities over total assets increases when the interest rate rises. One potential reason behind this behavior is that these sectors have strong working capital requirements and limited cash availability. Even when the interest rate increases, they prefer to use working capital loans. For instance, mining firms require high working capital amounts per period, even when positive cash flows from the project will be obtained in some future periods. Thirdly, the Construction, Manufacturing, Wholesale Trade, and Services sectors display negative IRFs, suggesting that an increase in interest rates would reduce the working capital ratio. One conjecture is that these sectors could more easily use cash to meet working capital requirements, thus reducing their dependency on banking loans if the cost of debt increases. Overall, the IRFs illustrate the heterogeneity of the working capital ratio among sectors.
Impulse-response function of working capital ratio. Positive interest rate shock.

3. A Model with working capital channel
To motivate my empirical work and understand the economic forces underlying the working capital channel, I present a discrete-time, infinite-horizon, partial-equilibrium investment model with working capital loans. First, I describe technology and working capital loans. Then, I describe the manager’s objective function and the firm’s policy functions.
3.1 Production technology and investment
The real side of the firm is characterized by a production technology that uses capital $k$
and labor
$k$
and labor $n$
. Revenue per period is given by
$n$
. Revenue per period is given by $y = zk^{\alpha }n^{1-\alpha }$
, in which
$y = zk^{\alpha }n^{1-\alpha }$
, in which $\alpha$
and
$\alpha$
and $1-\alpha$
are the production elasticity of capital and labor, respectively, and
$1-\alpha$
are the production elasticity of capital and labor, respectively, and $z$
is a productivity shock. Since this paper aims to investigate how any movement in interest rate could affect the firm’s decisions through the working capital channel, I normalize
$z$
is a productivity shock. Since this paper aims to investigate how any movement in interest rate could affect the firm’s decisions through the working capital channel, I normalize $z$
to be equal to 1 in the model. Furthermore, Investment,
$z$
to be equal to 1 in the model. Furthermore, Investment, $I$
, is defined as
$I$
, is defined as
 \begin{equation} I \equiv k' - (1-\delta )k, \end{equation}
in which $\delta$
is the capital depreciation rate,
$\delta$
is the capital depreciation rate, $0\lt \delta \lt 1$
,
$0\lt \delta \lt 1$
, $k'$
is the next period capital stock, and
$k'$
is the next period capital stock, and $k$
is the current capital stock. I assume that investment is partially irreversible to capture the fact that the firm’s investment is lumpy (e.g. Doms and Dunne, Reference Doms and Dunne1998; Caballero, Reference Gali and Gertler1999). Following Michaels et al. (Reference Michaels, Page and Whited2019), I normalize the price of investment goods to one, and the price of selling capital (negative investment) is expressed by
$k$
is the current capital stock. I assume that investment is partially irreversible to capture the fact that the firm’s investment is lumpy (e.g. Doms and Dunne, Reference Doms and Dunne1998; Caballero, Reference Gali and Gertler1999). Following Michaels et al. (Reference Michaels, Page and Whited2019), I normalize the price of investment goods to one, and the price of selling capital (negative investment) is expressed by $\theta _{i} \in (0,1)$
. Irreversible investment suggests that the firm sells capital at a lower price than it paid to buy it. As a result, the cost of investment is
$\theta _{i} \in (0,1)$
. Irreversible investment suggests that the firm sells capital at a lower price than it paid to buy it. As a result, the cost of investment is $C(I)$
defined as
$C(I)$
defined as
 \begin{equation} C(I) \equiv I\cdot 1_{[I\geq 0]} + \theta _i I\cdot 1_{[I\lt 0]} \end{equation}
3.2 Working capital loans
It is well-known in corporate finance literature that a firm needs to cover the cash flow mismatch between the payments made at the beginning of the period and the realization of revenues (Mahmoudzadeh et al. Reference Mahmoudzadeh, Nili and Nili2018; Michaels et al. Reference Michaels, Page and Whited2019). These funds in advance needed by the firm are known as working capital. I model this fact assuming that a firm needs to finance a fraction $\phi$
of its total variable cost in advance. I assume that total variable cost is generated by labor input
$\phi$
of its total variable cost in advance. I assume that total variable cost is generated by labor input $wn$
, in which
$wn$
, in which $w$
is the real wage per hour and
$w$
is the real wage per hour and $n$
represents the number of working hours. As a result,
$n$
represents the number of working hours. As a result, $\phi wn$
represents the working capital needed by the firm, which would be financed by working capital loans at the beginning of the period. Considering that
$\phi wn$
represents the working capital needed by the firm, which would be financed by working capital loans at the beginning of the period. Considering that $R$
is the gross interest rate for working capital loans, the total variable cost faced by the firm is
$R$
is the gross interest rate for working capital loans, the total variable cost faced by the firm is $R \times (\phi wn)$
, which is paid at the end of the period. Furthermore, the gross interest rate
$R \times (\phi wn)$
, which is paid at the end of the period. Furthermore, the gross interest rate $R$
follows a discrete Markov process.Footnote
5
$R$
follows a discrete Markov process.Footnote
5
 \begin{equation} R' = R_{ss}(1-\rho ) + \rho R + \varepsilon ', \quad \varepsilon \sim N\left(0,\sigma _{\varepsilon }^2\right), \end{equation}
in which $R_{ss}$
is the steady-state value of
$R_{ss}$
is the steady-state value of $R$
,
$R$
, $\rho$
is the persistent parameter, and
$\rho$
is the persistent parameter, and $\varepsilon$
is the interest rate shock. The innovation
$\varepsilon$
is the interest rate shock. The innovation $\varepsilon$
has a normal distribution with mean zero and variance
$\varepsilon$
has a normal distribution with mean zero and variance $\sigma _{\varepsilon }^2$
. How
$\sigma _{\varepsilon }^2$
. How $R$
is modeled allows us to consider the real mean value of
$R$
is modeled allows us to consider the real mean value of $R$
, which is obtained from the data. The set of possible values for
$R$
, which is obtained from the data. The set of possible values for $R$
is bounded since
$R$
is bounded since $R$
cannot be lower than one because the net interest rate would be negative. In addition,
$R$
cannot be lower than one because the net interest rate would be negative. In addition, $R$
cannot be greater than two because if so, the net interest rate would be greater than 100%, which is not common in the data. Then,
$R$
cannot be greater than two because if so, the net interest rate would be greater than 100%, which is not common in the data. Then, $R$
has a lower and upper bound. In particular, I assume that
$R$
has a lower and upper bound. In particular, I assume that $R$
in
$R$
in $[1,1.08]$
with a Markov transition probability function associated to (5) as
$[1,1.08]$
with a Markov transition probability function associated to (5) as $q(R', R)$
. Importantly, innovations in interest rates are crucial for firms since most bank loans have floating rates tied to monetary policy rates. This connection allows monetary policy to affect the liquidity and investment decisions of firms (e.g. Ippolito et al. Reference Ippolito, Ozdagli and Perez-Orive2018).
$q(R', R)$
. Importantly, innovations in interest rates are crucial for firms since most bank loans have floating rates tied to monetary policy rates. This connection allows monetary policy to affect the liquidity and investment decisions of firms (e.g. Ippolito et al. Reference Ippolito, Ozdagli and Perez-Orive2018).
An important characteristic of working capital loans is that they are a kind of short-term debt. The firm needs cash to finance the labor payments at the beginning of the period before the realization of profits which are obtained at the end of the period. Then, the working capital loans are paid with the cash flows derived from revenue. As a result, working capital loans can be considered short-term or intra-period debt. Additionally, it is common to observe in the data that banks do not require collateral for working capital loans. Because of that, I do not consider a collateral constraint for working capital loans in the model as previous studies do (Mahmoudzadeh et al. Reference Mahmoudzadeh, Nili and Nili2018).
To illustrate the relevant role of the working capital channel in the firm’s behavior, I describe what happens in the economy when there is a positive interest rate shock. The first effect of this shock is the increase in the working capital cost. The firm faces a tradeoff. On the one hand, the firm could reduce its working capital demand by reducing labor demand. This reduces the total variable cost and hence increases the cash flow. On the other hand, with lower labor, the production decreases, negatively affecting the investment and the next period’s capital stock. With more insufficient capital stock in the next period, the profits would be lower, negatively affecting the expected discount value of cash flow. Furthermore, if the shock persists over time, it will contribute dynamically to pushing down labor in the future. This strengthens the initial effects on discounted expected cash flow. Therefore, the manager must decide the optimal value of the labor force, balancing the benefits and costs in the presence of gross interest rate shock.
Working capital channel. Positive interest rate shock.

The proportion of $wn$
financed by working capital loans,
$wn$
financed by working capital loans, $\phi$
, is essential to determine the relevance of the interest rate shock on a firm’s decisions. Figure 2 shows the dynamic effects of the interest rate shock through a working capital channel. This channel is controlled by
$\phi$
, is essential to determine the relevance of the interest rate shock on a firm’s decisions. Figure 2 shows the dynamic effects of the interest rate shock through a working capital channel. This channel is controlled by $\phi$
. Two extreme cases emerge in this model. The first is when a firm does not need money in advance to finance the variable cost. In this case,
$\phi$
. Two extreme cases emerge in this model. The first is when a firm does not need money in advance to finance the variable cost. In this case, $\phi$
is zero, and the working capital channel is irrelevant to transmitting effects from interest rate shocks. In fact, in this setting, the interest rate does not affect the firm’s decisions. The second case is when a firm finances all its variable costs with working capital loans. In this case,
$\phi$
is zero, and the working capital channel is irrelevant to transmitting effects from interest rate shocks. In fact, in this setting, the interest rate does not affect the firm’s decisions. The second case is when a firm finances all its variable costs with working capital loans. In this case, $\phi$
is one, and the firm is sensitive to any movement in the interest rate. Therefore, any movement in the interest rate affects a firm’s decisions, so the working capital channel is very important. In this context, the relevant empirical questions are as follows: How big is
$\phi$
is one, and the firm is sensitive to any movement in the interest rate. Therefore, any movement in the interest rate affects a firm’s decisions, so the working capital channel is very important. In this context, the relevant empirical questions are as follows: How big is $\phi$
for the entire economy? And is
$\phi$
for the entire economy? And is $\phi$
different across industries? Given the relevance of the working capital channel, measuring
$\phi$
different across industries? Given the relevance of the working capital channel, measuring $\phi$
is of the first order of importance.
$\phi$
is of the first order of importance.
3.3 The firm’s objective function
Because I assume there are no agency costs between shareholders and managers; there is no difference between the manager’s and shareholders’ objective functions. In particular, the risk-neutral manager maximizes the cash flows, $d$
, that go to shareholders. Under the standard accounting identity, I can express distributions to shareholders as
$d$
, that go to shareholders. Under the standard accounting identity, I can express distributions to shareholders as
 \begin{equation} d(k,k',n,R) \equiv zk^{\alpha }n^{1-\alpha } - C(I) - \text{cash} - R_{-1}\text{loan}_{-1} \end{equation}
The first term of equation (6) represents operating profits at the end of the period $t$
. These profits are then spent on investment
$t$
. These profits are then spent on investment $C(I)$
, on cash, and on paying the previous debt,
$C(I)$
, on cash, and on paying the previous debt, $R_{-1}\text{loan}_{-1}$
. That debt was obtained at beginning
Footnote
6
of the period
$R_{-1}\text{loan}_{-1}$
. That debt was obtained at beginning
Footnote
6
of the period $t$
since the firm needs to finance its variable cost in advance (working capital requirements).
$t$
since the firm needs to finance its variable cost in advance (working capital requirements).
The common assumption in monetary policy models is that the entire labor cost $ w'n'$
is financed in advance only with loans:
$ w'n'$
is financed in advance only with loans: $loan= w'n'$
. I relax this strong assumption by assuming that working capital loans finance a fraction
$loan= w'n'$
. I relax this strong assumption by assuming that working capital loans finance a fraction $\phi$
of the total labor cost.
$\phi$
of the total labor cost.
 \begin{equation} \text{loan} = \phi w'n' \end{equation}
My goal is to allow the data to tell us what the value of $\phi$
is across industries and the entire Compustat sample. Additionally, complementary to loan financing, I allow the firm to finance its working capital requirement with cash. As a result, the firm uses cash and loans at the current period to pay its future labor costs in advance.
$\phi$
is across industries and the entire Compustat sample. Additionally, complementary to loan financing, I allow the firm to finance its working capital requirement with cash. As a result, the firm uses cash and loans at the current period to pay its future labor costs in advance.
 \begin{equation} \text{cash} + \text{loan} \geq w'n' \end{equation}
Equation (8) reflects that the firm faces a cash-in-advance constraint since there exists a mismatch between the working capital payment at the beginning of the period and the realization of the profits at the end of the same period. Considering equation (7) for $t$
and
$t$
and $t-1$
and equation (8) with equality into the shareholder’s distribution identity (equation 6), we have:
$t-1$
and equation (8) with equality into the shareholder’s distribution identity (equation 6), we have:
 \begin{equation} d(k,k',n,n',R) \equiv zk^{\alpha }n^{1-\alpha } - C(I) - R_{-1}\phi w n - (1-\phi )w'n', \end{equation}
where $R_{-1}\phi w n$
is the interest and principal payment of the working capital loans in
$R_{-1}\phi w n$
is the interest and principal payment of the working capital loans in $t-1$
that should be paid in
$t-1$
that should be paid in $t$
. Additionally,
$t$
. Additionally, $(1-\phi ) w'n'$
represents the fraction of the working capital requirement financed with cash in
$(1-\phi ) w'n'$
represents the fraction of the working capital requirement financed with cash in $t$
. I assume that investment can be financed by internal sources, after paying working capital loans, and by issuing equity (negative
$t$
. I assume that investment can be financed by internal sources, after paying working capital loans, and by issuing equity (negative $d$
).
$d$
).
Furthermore, if there is equity issuance, the shareholders incur an issuing cost $\lambda$
. A positive firm’s cash flow is distributed to its shareholders, while a negative cash flow implies that the firm obtains funds from shareholders. In the latter case, the firm would pay a linear cost,
$\lambda$
. A positive firm’s cash flow is distributed to its shareholders, while a negative cash flow implies that the firm obtains funds from shareholders. In the latter case, the firm would pay a linear cost, $\lambda$
. Thus, the shareholder’s final cash flows are given by
$\lambda$
. Thus, the shareholder’s final cash flows are given by
 \begin{eqnarray} d^*(k,k',n,n',R) &=& d(k,k',n,R), \quad \quad \text{if} \quad d(k,k',n,R) \geq 0 \end{eqnarray}
 \begin{eqnarray} d^*(k,k',n,n',R) &=& (1+\lambda )d(k,k',n,R), \quad \quad \text{if} \quad d(k,k',n,R)\lt 0 \end{eqnarray}
In a compact form, $d^*(k,k',n,n',R)$
would be:
$d^*(k,k',n,n',R)$
would be:
 \begin{equation} d^*(k,k',n,n',R) = d(k,k',n,n',R)\cdot (1+\lambda \cdot 1_{d\lt 0}) \end{equation}
The manager’s objective function is the expected present value of cash flows given by (12), which can be expressed recursively as
 \begin{equation} V(k,n,R) = \underset{\{k',n'\}}{\text{max}}\left\{d^*(k,k',n,n',R) + E[S'\cdot V(k',n',R')] \right\} \end{equation}
in which $V(k,n,R)$
is the value of the firm’s equity and
$V(k,n,R)$
is the value of the firm’s equity and $S' = \beta c_{t}/c_{t+1}$
is the stochastic discount factor,Footnote
7
which the manager uses to discount the firm’s cash flows. The manager makes choices
$S' = \beta c_{t}/c_{t+1}$
is the stochastic discount factor,Footnote
7
which the manager uses to discount the firm’s cash flows. The manager makes choices $\{k',n' \}$
so that the shareholders obtain the maximum cash flows. Assuming a finite state space
$\{k',n' \}$
so that the shareholders obtain the maximum cash flows. Assuming a finite state space $A$
,
$A$
, $E[S'\cdot V(k',n',R')]$
can be expressed as
$E[S'\cdot V(k',n',R')]$
can be expressed as $\sum _{A} [q(R',R) \cdot S' \cdot V(k',n',R')]$
in which
$\sum _{A} [q(R',R) \cdot S' \cdot V(k',n',R')]$
in which $q(R',R)$
represents the probability of jumping from one state in
$q(R',R)$
represents the probability of jumping from one state in $t$
to another state in
$t$
to another state in $t+1$
.
$t+1$
.
3.4 Firm’s policy functions
The main goal of this paper is to understand how the working capital channel affects the firm’s decisions by estimating this structural model directly. With this goal in mind, two steps are important in analyzing the economic implications of the model carefully. The first is to understand the estimation results and the second is to identify the model parameters. Both steps require understanding the economics behind the model. To do this, I analyze the manager’s maximization problem by examining the first-order conditions for optimal investment and labor. From first-order conditions, I obtain the labor demand expressed as
 \begin{equation} (1+\lambda 1_{d\lt 0})(1-\phi )w' = E\left[ S'\left( (1-\alpha )z'k'^{\alpha }n'^{-\alpha } - R \phi w' \right)\left(1+\lambda 1_{d'\lt 0}\right)\right] \end{equation}
To explain the intuition of the role of the interest rate on labor demand, I consider equation (14) without the equity issuance friction ( $\lambda =0$
). As a result, the labor demand becomes:
$\lambda =0$
). As a result, the labor demand becomes:
 \begin{equation} \underbrace{(1-\phi )w' + E\left[ S' R \phi w'\right]}_{\substack{\text{Present value of the} \textbf{marginal cost} \\ \text{of 1 additional unit of labor}}} = \underbrace{E\left[ S'\left( (1-\alpha )z'{k'}^{\alpha }{n'}^{-\alpha } \right)\right]}_{\substack{\text{Present value of the}\, \textbf{marginal benefit} \\ \text{of 1 additional unit of labor}}} \end{equation}
The left side of equation (15) is the present value of the marginal cost of an additional labor unit. Two terms compound it: the first is the fraction of the cost of one labor unit financed with cash $(1-\phi )w'$
, and the second is the present value of the loan that the firm should pay to finance the remaining fraction of labor cost
$(1-\phi )w'$
, and the second is the present value of the loan that the firm should pay to finance the remaining fraction of labor cost $E\big [ S' R \phi w'\big ]$
. The firm compares that marginal cost with the present value of the marginal benefit of an additional labor unit (right side of equation 15). This marginal benefit is the marginal productivity of labor represented by
$E\big [ S' R \phi w'\big ]$
. The firm compares that marginal cost with the present value of the marginal benefit of an additional labor unit (right side of equation 15). This marginal benefit is the marginal productivity of labor represented by $(1-\alpha )z'{k'}^{\alpha }{n'}^{-\alpha }$
.
$(1-\alpha )z'{k'}^{\alpha }{n'}^{-\alpha }$
.
Equation (15) shows the direct effect of the working capital channel on labor demand. An unexpected increase in interest rate pushes up the marginal cost of labor and hence decreases the labor demand. The effect of that shock is controlled by $\phi$
—the proportion of variable cost
$\phi$
—the proportion of variable cost $ w'n'$
financed by working capital loans. The second critical equation is the optimal investment which is expressed as
$ w'n'$
financed by working capital loans. The second critical equation is the optimal investment which is expressed as
 \begin{equation} \left[1_{I\geq 0} + \theta 1_{I\lt 0}\right]\left(1 + \lambda 1_{d\lt 0}\right) = E\left[S'\left[\alpha z'k'^{\alpha -1}n'^{1-\alpha } + (1-\delta )\left(1_{I'\geq 0} + \theta 1_{I'\lt 0}\right)\right]\left(1 + \lambda 1_{d'\lt 0}\right)\right] \end{equation}
If the investment is totally reversible ( $\theta =1$
) and there is no friction in issuing equity (
$\theta =1$
) and there is no friction in issuing equity ( $\lambda =0$
), the equation (16) turns out a standard investment equation without frictions:
$\lambda =0$
), the equation (16) turns out a standard investment equation without frictions:
 \begin{equation} 1 = E\left[S'\left(\alpha z'k'^{\alpha -1}n'^{1-\alpha } + (1-\delta )\right)\right] \end{equation}
Two additional equations. Furthermore, it is necessary to define two additional conditions to close the model. The first one is the equilibrium in the goods market, which is represented by
 \begin{equation} y = c + I, \end{equation}
in which $y$
is the firm’s production function
$y$
is the firm’s production function $zk^{\alpha }n^{1-\alpha }$
or revenues,
$zk^{\alpha }n^{1-\alpha }$
or revenues, $c$
is consumption, and
$c$
is consumption, and $I$
is the investment as defined in the previous subsection. The labor supply is the second condition to define the equilibrium in the labor market. I assume that the labor supply is characterized as
$I$
is the investment as defined in the previous subsection. The labor supply is the second condition to define the equilibrium in the labor market. I assume that the labor supply is characterized as
 \begin{equation} w = \frac{\theta _n c}{1-n}, \end{equation}
in which $w$
is the real wage,
$w$
is the real wage, $\theta _n$
is a parameter that measures the relevance of labor (or leisure) in a utility function, and
$\theta _n$
is a parameter that measures the relevance of labor (or leisure) in a utility function, and $n$
is labor. I summarize the model’s equations in Table A1, shown in Appendix A.2.
$n$
is labor. I summarize the model’s equations in Table A1, shown in Appendix A.2.
4. Simulations
I solve the model numerically and study the role of the working capital channel. I first find the policy functions considering the calibration of all parameters and three different levels of the interest rate shock. I then explain how the working capital channel works by assuming three cases: in the first case, the firm finances all its variable costs with cash, and then there is no working capital loan or channel. The second case is that a firm partially finances its variable cost with working capital loans; in the last case, it finances all of its variable cost with working capital loans. After that, I explore how model parameterization can affect the moments of some simulated variables. The last analysis results provide information to identify the parameter $\phi$
, which I estimate later.
$\phi$
, which I estimate later.
4.1 Numerical policy functions
In this section, I examine the policy functions $\{k',n' \} = g(k,n,R)$
to gain more insight about the model. Furthermore, the firm value
$\{k',n' \} = g(k,n,R)$
to gain more insight about the model. Furthermore, the firm value $v$
—which is calculated as the expected discount cash flows
$v$
—which is calculated as the expected discount cash flows $v = \sum _{t=0}^{\infty } S_t d_t$
—is analyzed as well as profitability
$v = \sum _{t=0}^{\infty } S_t d_t$
—is analyzed as well as profitability $y/k$
, investment rate
$y/k$
, investment rate $i/k$
, and working capital ratio
$i/k$
, and working capital ratio $\phi w'n'/k$
. The firm’s optimal response expressed in the dynamic behavior of these variables allows us to understand how the working capital channel transmits the interest rate shock to the firm’s decisions.
$\phi w'n'/k$
. The firm’s optimal response expressed in the dynamic behavior of these variables allows us to understand how the working capital channel transmits the interest rate shock to the firm’s decisions.
To analyze the policy functions, it is necessary to assign the corresponding value to every model parameter. The literature related to dynamic models suggests two main approaches to do so. The first is to estimate these parameters, and the second is to calibrate them. Since I am interested in estimating the parameter that controls the working capital channel—that is, $\phi$
, I am using the structural model and data from Compustat for estimating it, which is explained carefully in the following sections. However, since this section aims to understand how interest shock affects firm decisions through the working capital channel, I calibrate all parameters according to previous studies and assume an intermediate value of
$\phi$
, I am using the structural model and data from Compustat for estimating it, which is explained carefully in the following sections. However, since this section aims to understand how interest shock affects firm decisions through the working capital channel, I calibrate all parameters according to previous studies and assume an intermediate value of $\phi$
(
$\phi$
( $\phi =0.5$
). This last assumption means the firm finances half its variable cost with working capital loans.
$\phi =0.5$
). This last assumption means the firm finances half its variable cost with working capital loans.
4.1.1 Calibration
The average share of capital in total production, $\alpha$
, is around 0.77 according to Nikolov and Whited (Reference Nikolov and Whited2014). The value of the depreciation rate is 10% annually, a standard assumption in business cycle literature. The discount factor parameter
$\alpha$
, is around 0.77 according to Nikolov and Whited (Reference Nikolov and Whited2014). The value of the depreciation rate is 10% annually, a standard assumption in business cycle literature. The discount factor parameter $\beta$
is 0.96 according to the steady-state value of gross interest rate
$\beta$
is 0.96 according to the steady-state value of gross interest rate $R_{ss} = 1.04$
. The equity issue cost as the percent of distributions
$R_{ss} = 1.04$
. The equity issue cost as the percent of distributions $\lambda$
is 0.04 based on Michaels et al. (Reference Michaels, Page and Whited2019), and I also use their estimate for the parameter that drives investment irreversibility
$\lambda$
is 0.04 based on Michaels et al. (Reference Michaels, Page and Whited2019), and I also use their estimate for the parameter that drives investment irreversibility $\theta$
, which is 0.534. Christiano et al. (Reference Christiano, Trabandt and Walentin2010) suggest that the persistence and the standard deviation of the interest rate shock in terms of monetary policy are 0.87 and 0.51, respectively. However, not all the volatility of the monetary shock is transmitted to the interest rate of loans. As a result, I assume that the relevant volatility of the interest rate shock for the firm is one-third of the corresponding monetary policy, but the persistence is the same. In other words, I assume that
$\theta$
, which is 0.534. Christiano et al. (Reference Christiano, Trabandt and Walentin2010) suggest that the persistence and the standard deviation of the interest rate shock in terms of monetary policy are 0.87 and 0.51, respectively. However, not all the volatility of the monetary shock is transmitted to the interest rate of loans. As a result, I assume that the relevant volatility of the interest rate shock for the firm is one-third of the corresponding monetary policy, but the persistence is the same. In other words, I assume that $\rho$
and
$\rho$
and $\sigma _{\varepsilon }$
are 0.87 and 0.51/3, respectively. Additionally, I calibrate
$\sigma _{\varepsilon }$
are 0.87 and 0.51/3, respectively. Additionally, I calibrate $\theta$
—which measures the relevance of labor (or leisure) in the utility function—to be consistent with the value of the steady state of labor
$\theta$
—which measures the relevance of labor (or leisure) in the utility function—to be consistent with the value of the steady state of labor $n_{ss} = 0.2$
. As a result,
$n_{ss} = 0.2$
. As a result, $\theta _n$
is equal to 3.36. Finally, I do not consider income effects on labor supply. To do that, I keep the level of consumption at its steady-state value (
$\theta _n$
is equal to 3.36. Finally, I do not consider income effects on labor supply. To do that, I keep the level of consumption at its steady-state value ( $C_{ss} = 0.25$
), which allows us to get the consumption-output ratio in steady state equal to 75% and the investment-output ratio in steady state equal to 25%. Considering that consumption takes its steady-state value all the time, the upward-sloping labor supply curve under interest rate shocks allows us to study the effects of this shock on labor through the response of labor demand.
$C_{ss} = 0.25$
), which allows us to get the consumption-output ratio in steady state equal to 75% and the investment-output ratio in steady state equal to 25%. Considering that consumption takes its steady-state value all the time, the upward-sloping labor supply curve under interest rate shocks allows us to study the effects of this shock on labor through the response of labor demand.
Policy function. The figure depicts the optimal response of the labor, investment rate, profitability, and working capital ratio in response to the interest rate shock $R$
for every level of capital. Low R, medium R, and high R correspond to
$R$
for every level of capital. Low R, medium R, and high R correspond to $R=1$
,
$R=1$
, $R=1.04$
, and
$R=1.04$
, and $R=1.08$
respectively.
$R=1.08$
respectively.

4.1.2 Simulated policy functions
With the previous calibration of the model and considering $\phi =0.5$
, I solve the model numerically by iterating the Bellman equation, which produces the value function
$\phi =0.5$
, I solve the model numerically by iterating the Bellman equation, which produces the value function $V(k,n,R)$
and policy function
$V(k,n,R)$
and policy function $\{k',n' \} = g(k,n,R)$
. I leave details of the numerical solution for Appendix A.3. Since investment rate, profitability, and working capital loans depend on
$\{k',n' \} = g(k,n,R)$
. I leave details of the numerical solution for Appendix A.3. Since investment rate, profitability, and working capital loans depend on $\{k,n,R\}$
, I can analyze these variables when firms are affected by a positive interest rate shock. In particular, these policy functions are shown in Figure 3. This figure shows the firm’s optimal response in the same period when the interest rate shock occurs for every level of the firm’s capital. Three main conclusions emerge from these simulated policy functions. First, interest rate shock is important to determine labor, profit, and working capital loans for the firm. The intensity of that shock moves the optimal level of these variables. Second, high-interest rate shock reduces the level of these variables because the marginal cost of financing the working capital requirements increases. The optimal response to this shock is to reduce labor demand with effects on production, revenue, and profitability. Finally, the investment ratio seems not to react under interest rate shock.
$\{k,n,R\}$
, I can analyze these variables when firms are affected by a positive interest rate shock. In particular, these policy functions are shown in Figure 3. This figure shows the firm’s optimal response in the same period when the interest rate shock occurs for every level of the firm’s capital. Three main conclusions emerge from these simulated policy functions. First, interest rate shock is important to determine labor, profit, and working capital loans for the firm. The intensity of that shock moves the optimal level of these variables. Second, high-interest rate shock reduces the level of these variables because the marginal cost of financing the working capital requirements increases. The optimal response to this shock is to reduce labor demand with effects on production, revenue, and profitability. Finally, the investment ratio seems not to react under interest rate shock.
4.2 Analysis of working capital channel
A crucial quantitative question is how big the working capital channel is. I address this question with annual data for firms listed in Compustat, which will be discussed later. Before that, it is important to understand how the endogenous variables respond in different settings of the working capital channel. Figure 4 shows three cases for the working capital channel. In the first one, this mechanism is absent. Hence any movement in interest rate does not affect the firm’s decisions, and all variables remain in their steady-state values. This setting corresponds to the case in which the firm finances all its variable costs with cash, which is paid at the end of the period. In this case, we do not have the cash flow mismatch problem.
Relevance of working capital channel in the firm’s decisions (Impulse response function). This figure shows how a firm’s value, investment rate, profitability, and working capital ratio behave in three cases: no working capital channel ( $\phi =0$
), a moderate working capital channel (
$\phi =0$
), a moderate working capital channel ( $\phi =0.5$
), and a full working capital channel (
$\phi =0.5$
), and a full working capital channel ( $\phi =1$
).
$\phi =1$
).

The second case is when the firm finances in advance, at the beginning of the period, 50% of its variable costs with working capital loans ( $\phi =0.5$
). In this case, the interest rate shock affects the economy through the working capital channel. As shown in the bottom-left-side panel of Figure 4, the firm optimally reduces its labor demand since the labor marginal cost has increased. The underlying effect is the reduction of revenue and, hence, profits. All of these effects reduce the current and future cash flows with a negative impact on the firm’s value, as shown in Figure 4.
$\phi =0.5$
). In this case, the interest rate shock affects the economy through the working capital channel. As shown in the bottom-left-side panel of Figure 4, the firm optimally reduces its labor demand since the labor marginal cost has increased. The underlying effect is the reduction of revenue and, hence, profits. All of these effects reduce the current and future cash flows with a negative impact on the firm’s value, as shown in Figure 4.
The last case is when a firm finances all its variable costs in advance with working capital loans. In this case, the effect of interest rate shock is stronger than in previous cases since the working capital channel transmits all the shock to the firm’s decisions. As a result, the labor demand, firm’s value, profitability, and investment rate decrease significantly (see Figure 4).
5. Data, identification, and estimation
5.1 Data
The data come from Compustat. I consider a sample period from 1971 until 2018 with annual frequency. The sample does not consider firms associated with financial services, utilities, and government administration. Furthermore, I eliminated any row in the sample where the main variables (operating income, total assets, capital expenditure, and debt in current liabilities) have no information. Additionally, I winsorize profitability, investment rate, and the working capital ratio at the 1st and 99th percentiles. After these filters, the final panel has 86,911 observations for 5,739 firms from 1971 to 2018 at an annual frequency. I consider working capital loans as Debt in Current Liabilities. This variable represents liabilities due within one year, including the current portion of long-term debt. In particular, this variable is the sum of accounts payable, other current liabilities, debt in current liabilities, and income taxes. Table 2 contains the variable definitions.
Since there exists the possibility that the working capital ratio varies across industries, I split the sample by type of industry. Table 2 shows descriptive statistics for the entire sample and every industry.
Data definitions

5.2 Identification
Model identification is a cornerstone of the SMM technique. The identification requires choosing moments sensitive to variations in the structural parameters. In technical terms, identification requires that the relationship between the model parameters and the moments be one-to-one and onto. I illustrate the identification procedure by an example in Appendix B.2.
I now describe six potentially informative moments to identify the three parameters of interest ( $\phi$
,
$\phi$
, $\alpha$
, and
$\alpha$
, and $\delta$
). In particular, I explore two moments (mean and variance) associated with three main variables: profitability, investment rate, and working capital ratio. I chose these variables due to their connections with the structural parameters in the theoretical model and because I have available data in Compustat, which allows me to construct these variables.
$\delta$
). In particular, I explore two moments (mean and variance) associated with three main variables: profitability, investment rate, and working capital ratio. I chose these variables due to their connections with the structural parameters in the theoretical model and because I have available data in Compustat, which allows me to construct these variables.
5.2.1 Identification of $\phi$

I evaluate the sensitivity of the described six moments to $\phi$
, the fraction of working capital financed by loans. As shown in Figure B3 (see Appendix B.2), the mean of the profitability goes down monotonically when
$\phi$
, the fraction of working capital financed by loans. As shown in Figure B3 (see Appendix B.2), the mean of the profitability goes down monotonically when $\phi$
increases. This is because the interest payment increases with the amount of debt. Since greater
$\phi$
increases. This is because the interest payment increases with the amount of debt. Since greater $\phi$
means higher debt, the firm must pay more interest. As a result, the level of profit decreases. However, if the magnitude of this change is not significant, then this moment is not informative to identify
$\phi$
means higher debt, the firm must pay more interest. As a result, the level of profit decreases. However, if the magnitude of this change is not significant, then this moment is not informative to identify $\phi$
.Footnote
8
$\phi$
.Footnote
8
Regarding the mean of working capital, it goes up when $\phi$
increases. Since the definition of working capital loans is
$\phi$
increases. Since the definition of working capital loans is $\phi wn$
, any increase in
$\phi wn$
, any increase in $\phi$
naturally increases this variable. For this reason, we can see this increasing pattern. The next two important moments I evaluate are the profitability and working capital ratio variance. Both moments increase in
$\phi$
naturally increases this variable. For this reason, we can see this increasing pattern. The next two important moments I evaluate are the profitability and working capital ratio variance. Both moments increase in $\phi$
since the first is affected by labor variable cost, and the second is affected directly by
$\phi$
since the first is affected by labor variable cost, and the second is affected directly by $\phi$
. However, both variances vary from 0 to almost
$\phi$
. However, both variances vary from 0 to almost $5 \cdot 10^{-4}$
, which suggests that changes in
$5 \cdot 10^{-4}$
, which suggests that changes in $\phi$
do not produce significant changes in both variances. Therefore, these moments are not informative, even if they are monotonic. Finally, the two moments of investment rate are not informative over the range of
$\phi$
do not produce significant changes in both variances. Therefore, these moments are not informative, even if they are monotonic. Finally, the two moments of investment rate are not informative over the range of $\phi$
.Footnote
9
For instance, the mean of the investment ratio does not react when
$\phi$
.Footnote
9
For instance, the mean of the investment ratio does not react when $\phi$
varies. This suggests that these investment moments do not have information to identify
$\phi$
varies. This suggests that these investment moments do not have information to identify $\phi$
. A conclusion of the identification process of
$\phi$
. A conclusion of the identification process of $\phi$
is the mean of profitability, and the mean of the working capital ratio delivers relevant information to identify
$\phi$
is the mean of profitability, and the mean of the working capital ratio delivers relevant information to identify $\phi$
. I will use these moments in the estimation section to find
$\phi$
. I will use these moments in the estimation section to find $\phi$
.
$\phi$
.
5.2.2 Identification of
$\alpha$

I now study how sensitive the same previous six moments are to $\alpha$
, the elasticity of output to capital (see Figure B4 in Appendix B.2). Since
$\alpha$
, the elasticity of output to capital (see Figure B4 in Appendix B.2). Since $\alpha$
is present in revenue,
$\alpha$
is present in revenue, $zk^{\alpha }n^{1-\alpha }$
, changes in the value of
$zk^{\alpha }n^{1-\alpha }$
, changes in the value of $\alpha$
should also be reflected in changes in revenue. As a result, I expect that both moments (mean and variance) of profitability experience movements when
$\alpha$
should also be reflected in changes in revenue. As a result, I expect that both moments (mean and variance) of profitability experience movements when $\alpha$
varies, as shown in Figure B4. However, the variance of profitability faces small movements when
$\alpha$
varies, as shown in Figure B4. However, the variance of profitability faces small movements when $\alpha$
increases, which does not help to identify this parameter. On the other hand, the profitability mean is monotonically decreasing in the entire range of
$\alpha$
increases, which does not help to identify this parameter. On the other hand, the profitability mean is monotonically decreasing in the entire range of $\alpha$
, providing information for the identification process. When I evaluate the mean and variance of the investment rate, I find that both moments do not contain information to identify
$\alpha$
, providing information for the identification process. When I evaluate the mean and variance of the investment rate, I find that both moments do not contain information to identify $\alpha$
. In particular, the mean and variance of the investment rate are constant over the range of
$\alpha$
. In particular, the mean and variance of the investment rate are constant over the range of $\alpha$
. Finally, working capital ratio moments seem informative since both are decreasing monotonically. Nevertheless, only the mean of working capital changes significantly with the movement of
$\alpha$
. Finally, working capital ratio moments seem informative since both are decreasing monotonically. Nevertheless, only the mean of working capital changes significantly with the movement of $\alpha$
. What is the economic intuition about that? The working capital ratio is
$\alpha$
. What is the economic intuition about that? The working capital ratio is $\phi w n/k$
, where
$\phi w n/k$
, where $n$
is the firm’s labor demand. When
$n$
is the firm’s labor demand. When $\alpha$
increases, the marginal productivity of capital increases as well, but the marginal productivity of labor decreases. Since labor demand is essentially controlled by marginal labor productivity, the firm optimally decides to reduce its labor demand, hence the working capital ratio. For this reason, we can see that an increasing
$\alpha$
increases, the marginal productivity of capital increases as well, but the marginal productivity of labor decreases. Since labor demand is essentially controlled by marginal labor productivity, the firm optimally decides to reduce its labor demand, hence the working capital ratio. For this reason, we can see that an increasing $\alpha$
is associated with a decreasing working capital ratio mean. Finally, from this identification analysis, I conclude that the mean of both profitability and working capital contains information to identify
$\alpha$
is associated with a decreasing working capital ratio mean. Finally, from this identification analysis, I conclude that the mean of both profitability and working capital contains information to identify $\alpha$
.
$\alpha$
.
5.2.3 Identification of
$\delta$

In the case of $\delta$
, which represents the capital depreciation rate, the first moment of investment rate, profitability, and working capital ratio are informative to identify this parameter. In particular, the mean of the investment rate seems to be more informative due to varying significantly over the range of
$\delta$
, which represents the capital depreciation rate, the first moment of investment rate, profitability, and working capital ratio are informative to identify this parameter. In particular, the mean of the investment rate seems to be more informative due to varying significantly over the range of $\delta$
. Furthermore, as shown in Figure B5 (see Appendix B.2), the variances of both profitability and working capital ratio are monotonic but with minor changes. Consequently, they are not informative. Finally, the variance of investment rate does not vary, avoiding the identification of
$\delta$
. Furthermore, as shown in Figure B5 (see Appendix B.2), the variances of both profitability and working capital ratio are monotonic but with minor changes. Consequently, they are not informative. Finally, the variance of investment rate does not vary, avoiding the identification of $\delta$
. The identification analysis of
$\delta$
. The identification analysis of $\delta$
suggests that the mean of profitability, investment rate, and working capital contain information to identify this parameter.
$\delta$
suggests that the mean of profitability, investment rate, and working capital contain information to identify this parameter.
Structural parameter estimates

This table presents the estimated structural parameters, with standard errors in parenthesis; $\alpha$
is the capital share in total profits,
$\alpha$
is the capital share in total profits, $\delta$
is the depreciation rate, and
$\delta$
is the depreciation rate, and $\phi$
is the proportion of working capital which is financed by working capital loans. I estimate these parameters for the entire sample and seven industries (Agriculture, Mining, Construction, Manufacturing, Wholesale Trade, Retail Trade, and Services)
$\phi$
is the proportion of working capital which is financed by working capital loans. I estimate these parameters for the entire sample and seven industries (Agriculture, Mining, Construction, Manufacturing, Wholesale Trade, Retail Trade, and Services)
*This industry includes forestry and fishing as well.
I summarize the identification process in Table 3. One conclusion is that the mean of the working capital ratio is connected to three parameters: $\alpha$
,
$\alpha$
, $\phi$
, and
$\phi$
, and $\delta$
. Additionally, the profitability mean depends on
$\delta$
. Additionally, the profitability mean depends on $\alpha$
and
$\alpha$
and $\delta$
. Furthermore,
$\delta$
. Furthermore, $\delta$
is related to the mean of the investment ratio. I express these relationships between moments and parameters in the following equations to see how the identification process works.
$\delta$
is related to the mean of the investment ratio. I express these relationships between moments and parameters in the following equations to see how the identification process works.
 \begin{eqnarray} \text{Mean(working capital ratio)} &=& f_1(\alpha, \phi, \delta, \Psi ) \end{eqnarray}
 \begin{eqnarray} \text{Mean(profitability)} &=& f_2(\alpha, \delta, \Psi ) \end{eqnarray}
 \begin{eqnarray} \text{Mean(investment rate)} &=& f_3(\delta, \Psi ), \end{eqnarray}
where $f_1$
,
$f_1$
, $f_2$
, and
$f_2$
, and $f_3$
represent functions that map moments to parameters. Potentially, moments could depend on several parameters, not only those I want to study, such as
$f_3$
represent functions that map moments to parameters. Potentially, moments could depend on several parameters, not only those I want to study, such as $\alpha$
,
$\alpha$
, $\phi$
, and
$\phi$
, and $\delta$
. Then, the variable
$\delta$
. Then, the variable $\Psi$
contains all the remaining parameters present in the model, which are calibrated, such as the persistence of interest rate
$\Psi$
contains all the remaining parameters present in the model, which are calibrated, such as the persistence of interest rate $\rho$
and the standard deviation of the innovation of interest rate
$\rho$
and the standard deviation of the innovation of interest rate $\sigma _{\varepsilon }$
. As I mentioned in the paragraphs above, the identification process requires that moments of some variables are related to the parameters that I want to estimate. In this case, we can proceed recursively. From equation (22), we can obtain
$\sigma _{\varepsilon }$
. As I mentioned in the paragraphs above, the identification process requires that moments of some variables are related to the parameters that I want to estimate. In this case, we can proceed recursively. From equation (22), we can obtain $\delta$
. Next, from equation (21), we can exactly identify
$\delta$
. Next, from equation (21), we can exactly identify $\alpha$
since we know
$\alpha$
since we know $\delta$
. Equation (20) allows me to identify the value of
$\delta$
. Equation (20) allows me to identify the value of $\phi$
given the value of
$\phi$
given the value of $\delta$
and
$\delta$
and $\alpha$
. In conclusion, for identifying the three parameters (
$\alpha$
. In conclusion, for identifying the three parameters ( $\alpha$
,
$\alpha$
, $\phi$
, and
$\phi$
, and $\delta$
), I can use three informative moments: the mean of working capital ratio, the mean of profitability, and the mean of investment ratio. The model is exactly identified since I have three parameters and three moments. Given that the variance of profitability reacts to all three parameters to different degrees, I will use it in the estimation process. The model is overidentified in that last case since I have more moments than parameters.
$\delta$
), I can use three informative moments: the mean of working capital ratio, the mean of profitability, and the mean of investment ratio. The model is exactly identified since I have three parameters and three moments. Given that the variance of profitability reacts to all three parameters to different degrees, I will use it in the estimation process. The model is overidentified in that last case since I have more moments than parameters.
5.3 Estimation
I estimate the model parameter of the working capital channel $\phi$
, the capital-output elasticity
$\phi$
, the capital-output elasticity $\alpha$
, and the depreciation rate
$\alpha$
, and the depreciation rate $\delta$
using SMM. The remaining parameters of the model are calibrated based on previous studies. The SMM estimation technique is well-known in econometric literature. Its basic idea is to adjust the parameter of interest (for instance,
$\delta$
using SMM. The remaining parameters of the model are calibrated based on previous studies. The SMM estimation technique is well-known in econometric literature. Its basic idea is to adjust the parameter of interest (for instance, $\beta$
) to get similar properties for the observed endogenous variables,
$\beta$
) to get similar properties for the observed endogenous variables, $y_t$
, and their simulated counterparts,
$y_t$
, and their simulated counterparts, $y_t^s$
(Gouriéroux and Monfort, Reference Gouriéroux and Monfort1996). In particular, SMM finds
$y_t^s$
(Gouriéroux and Monfort, Reference Gouriéroux and Monfort1996). In particular, SMM finds $\theta$
such that the empirical moments of variables
$\theta$
such that the empirical moments of variables $y_t$
are as close as possible to the moments of the simulated variable
$y_t$
are as close as possible to the moments of the simulated variable $y_t^s$
, which come from the structural model. To be explicit about how I am applying this procedure to the structural model described before, I split the procedure into two sets of steps in the spirit of Strebulaev and Whited (Reference Strebulaev and Whited2012): moments and estimation procedure (see Figure 7 in Appendix B).
$y_t^s$
, which come from the structural model. To be explicit about how I am applying this procedure to the structural model described before, I split the procedure into two sets of steps in the spirit of Strebulaev and Whited (Reference Strebulaev and Whited2012): moments and estimation procedure (see Figure 7 in Appendix B).
First, I choose a set of moments that I initially want to match. Since in the model, I have three main variables (profitability, investment rate, and working capital ratio), the moments chosen are the average and variance of these variables. As a result, I have six moments. In this step, I do not know if I will finally require the model to match all six moments. The identification process will tell us what moments of the six we need.
Second, I identify what moments are relevant to estimate the three parameters $\phi$
,
$\phi$
, $\alpha$
, and
$\alpha$
, and $\delta$
. From the six moments chosen in the first step, I evaluate which provides information about the parameters. Since I am estimating three parameters, I must choose at least three moments from the available six.
$\delta$
. From the six moments chosen in the first step, I evaluate which provides information about the parameters. Since I am estimating three parameters, I must choose at least three moments from the available six.
The third step is to simulate the chosen moments from the identification step and save them in $m(y^s,\beta )$
and do the same for variables in the real data and save their moments in
$m(y^s,\beta )$
and do the same for variables in the real data and save their moments in $M(y)$
. To obtain the simulated moments, I choose the starting value of the set of parameters. The next step is to calculate the covariance matrix of the empirical moments. The inverse of this matrix represents the GMM weight matrix. I denote this matrix as W.
$M(y)$
. To obtain the simulated moments, I choose the starting value of the set of parameters. The next step is to calculate the covariance matrix of the empirical moments. The inverse of this matrix represents the GMM weight matrix. I denote this matrix as W.
Thus far, we have a subset of moments related to the parameters of interest $\phi$
,
$\phi$
, $\alpha$
, and
$\alpha$
, and $\delta$
. Furthermore, we have empirical and simulated moments and the GMM weight matrix. Now, I begin the estimation process. Specifically, SMM chooses
$\delta$
. Furthermore, we have empirical and simulated moments and the GMM weight matrix. Now, I begin the estimation process. Specifically, SMM chooses $\phi$
,
$\phi$
, $\alpha$
, and
$\alpha$
, and $\delta$
such that these parameters minimize the SMM objective function
$\delta$
such that these parameters minimize the SMM objective function $Q(y,y^s,\phi,\alpha,\delta )$
. This function is the sum of the square of the difference between the empirical moments and the simulated moments weighted by the inverse of the covariance matrix of empirical moments
$Q(y,y^s,\phi,\alpha,\delta )$
. This function is the sum of the square of the difference between the empirical moments and the simulated moments weighted by the inverse of the covariance matrix of empirical moments $W$
.
$W$
. $Q({\cdot})$
is defined as follows.
$Q({\cdot})$
is defined as follows.
 \begin{equation} Q(y,y^s,\phi,\alpha,\delta ) \equiv (M(y) - m(y^s,\phi,\alpha,\delta ))' W (M(y) - m(y^s,\phi,\alpha,\delta )) \end{equation}
After estimating $\phi$
,
$\phi$
, $\alpha$
, and
$\alpha$
, and $\delta$
, I adjust the standard errors and test statistics for simulation error. Finally, I use a specification test, which refers to a general test of the overidentifying restrictions of the model, which can be written as:
$\delta$
, I adjust the standard errors and test statistics for simulation error. Finally, I use a specification test, which refers to a general test of the overidentifying restrictions of the model, which can be written as:
 \begin{equation*}\frac {NJ}{1+J}Q(y,y^s,\phi,\alpha,\delta )\end{equation*}
In which $J$
is the ratio of the number of observations in the simulated data to the number of observations in the real data
$J$
is the ratio of the number of observations in the simulated data to the number of observations in the real data $N$
.
$N$
.
6. Results
I first present the results of estimating the model for the entire sample. I then estimate the model for seven industries: Agriculture, Mining, Construction, Manufacturing, Wholesale Trade, Retail Trade, and Services. Table 3 presents the parameter estimates. In particular, I estimate $\alpha$
,
$\alpha$
, $\delta$
, and
$\delta$
, and $\phi$
.
$\phi$
. $\alpha$
is the capital share in total profits,
$\alpha$
is the capital share in total profits, $\delta$
is the depreciation rate, and
$\delta$
is the depreciation rate, and $\phi$
is the proportion of working capital financed by working capital loans.
$\phi$
is the proportion of working capital financed by working capital loans.
6.1 Entire Sample
For the entire sample, the estimated $\alpha$
is 0.71, close to the previous estimations at the firm level: 0.773 (Nikolov and Whited, Reference Nikolov and Whited2014) and 0.868 (Michaels et al. Reference Michaels, Page and Whited2019). The estimation of
$\alpha$
is 0.71, close to the previous estimations at the firm level: 0.773 (Nikolov and Whited, Reference Nikolov and Whited2014) and 0.868 (Michaels et al. Reference Michaels, Page and Whited2019). The estimation of $\delta$
(5.6%) is also consistent with the estimation of Michaels et al. (Reference Michaels, Page and Whited2019), 8.4%. The estimated value of
$\delta$
(5.6%) is also consistent with the estimation of Michaels et al. (Reference Michaels, Page and Whited2019), 8.4%. The estimated value of $\delta$
of Nikolov and Whited (Reference Nikolov and Whited2014) is higher (13%) than I estimate here. A possible explanation is the presence of investment irreversibility in my model, absence in Nikolov and Whited (Reference Nikolov and Whited2014). Investment irreversibility encourages firms to use their physical capital more intensively, generating more depreciation. Regarding
$\delta$
of Nikolov and Whited (Reference Nikolov and Whited2014) is higher (13%) than I estimate here. A possible explanation is the presence of investment irreversibility in my model, absence in Nikolov and Whited (Reference Nikolov and Whited2014). Investment irreversibility encourages firms to use their physical capital more intensively, generating more depreciation. Regarding $\phi$
, the full sample estimation suggests that this parameter is 0.758. This means that, on average, firms in the sample finance 75.8% of their working capital requirements with loans. Although this value is not equal to one, as macroeconomic models usually assume, this value is quantitatively important.
$\phi$
, the full sample estimation suggests that this parameter is 0.758. This means that, on average, firms in the sample finance 75.8% of their working capital requirements with loans. Although this value is not equal to one, as macroeconomic models usually assume, this value is quantitatively important.
6.2 Across Industries
Industries sample estimation suggests that $\phi$
is different across industries. The Retail Trade sector has the lowest value of
$\phi$
is different across industries. The Retail Trade sector has the lowest value of $\phi$
(0.482), while three sectors (Agriculture, Construction, and Wholesale Trade) have a full working capital channel (
$\phi$
(0.482), while three sectors (Agriculture, Construction, and Wholesale Trade) have a full working capital channel ( $\phi =1$
). This means that a positive interest rate shock will affect these three industries more than the Retail Trade sector. For the Manufacturing sector, which represents almost 60% of the data,
$\phi =1$
). This means that a positive interest rate shock will affect these three industries more than the Retail Trade sector. For the Manufacturing sector, which represents almost 60% of the data, $\phi$
is strong (0.701). These results are also consistent with the preliminary evidence presented in Section 2. Specifically, regression results show the existence of the working capital channel, which is different among sectors. This is confirmed by VAR estimation, showing that an interest rate shock has different effects on the working capital ratio among sectors. It is important to mention that since
$\phi$
is strong (0.701). These results are also consistent with the preliminary evidence presented in Section 2. Specifically, regression results show the existence of the working capital channel, which is different among sectors. This is confirmed by VAR estimation, showing that an interest rate shock has different effects on the working capital ratio among sectors. It is important to mention that since $\phi$
is a structural parameter, it cannot be estimated by standard regression methods—it is necessary for a theoretical model that allows us to implement a structural estimation technique. This is the strategy of this paper.
$\phi$
is a structural parameter, it cannot be estimated by standard regression methods—it is necessary for a theoretical model that allows us to implement a structural estimation technique. This is the strategy of this paper.
What are the economic implications of these estimations? At least two important implications. First, these results suggest that the working capital channel is not full for the whole economy—it is 0.758. Although this value is not equal to one as macroeconomic models usually assume (e.g. Christiano et al. Reference Christiano, Trabandt and Walentin2010), this value is quantitatively important. Second, since the working capital channel shows heterogeneity across industries, the monetary policy would affect firms differently depending on to what industry they belong. For instance, it seems that any movement in the monetary policy interest rate would affect the Construction sector more than the Retail sector.
Given these results, the natural question is what economic forces explain these differences in the working capital channel across industries. It is reasonable to hypothesize that corporate cash could be behind these results. Sectors with strong precautionary cash demand will hedge to increments in interest rates, allowing them to finance working capital necessities with the previously accumulated cash. In this case, the working capital channel would be weakened, implying $\phi$
less than one. However, sectors with strong high opportunity costs will reduce cash demand and, hence, they will finance working capital necessities with loans. They are characterized by a high
$\phi$
less than one. However, sectors with strong high opportunity costs will reduce cash demand and, hence, they will finance working capital necessities with loans. They are characterized by a high $\phi$
(Gao et al. Reference Gao, Whited and Zhang2021). Other tentative answers could be related to the economic nature of every industry (e.g. seasonal sales, inventory accumulation), accessibility and cost of loans, capacity utilization, and financial frictions. Studying these possible explanations represents an important research agenda.
$\phi$
(Gao et al. Reference Gao, Whited and Zhang2021). Other tentative answers could be related to the economic nature of every industry (e.g. seasonal sales, inventory accumulation), accessibility and cost of loans, capacity utilization, and financial frictions. Studying these possible explanations represents an important research agenda.
Simulated moment estimation

This table presents the comparison between moments from the data and moments from the model. Mean Prof. is the “mean of profitability ( $y/k$
),” Var. Prof. is the “variance of profitability,” Mean Inv. is the “mean of investment rate (
$y/k$
),” Var. Prof. is the “variance of profitability,” Mean Inv. is the “mean of investment rate ( $I/k$
),” and Var. WC ratio is the “variance of working capital ratio (
$I/k$
),” and Var. WC ratio is the “variance of working capital ratio ( $wn/k$
).”
$wn/k$
).”
*This industry includes forestry and fishing as well.
6.3 Model Evaluation
To evaluate whether the estimations are accurate, it is important to evaluate the theoretical model’s ability to capture the moments of data. Table 4 presents the actual moments (from the data) versus simulated moments (from the model). At least four ideas emerge from this table.
First, the model generates moments close to the data for the entire sample. However, it also causes an overestimated profitability ratio and an underestimation of both the investment rate and the working capital ratio. For instance, the mean profitability in the data is 13.6%, and it is 14.0% in the model.
Second, more accurate model moments are generated for the manufacturing sector, representing almost 60% of the data. For example, the variance of the working capital ratio is 4.6%, which is very close to what the model generates (4.1%).
Third, for industries with fewer sample data, the model generates a lower value of the variance of the working capital ratio. However, the estimated investment ratio mean is generally well captured by the model across industries and for the entire sample.
Finally, it is challenging for the model to replicate the variance of profitability. This is because I require the model to generate moments with only one shock—the interest rate. A potential extension of the model would be to consider a productivity shock that allows the model to better fit with data moments. As I mentioned, since this paper aims to study the working capital channel, an exogenous interest rate shock is more accurate. However, the cost of this is that I entail the model to replicate moments that are better obtained from productivity shock. Even so, the model is doing an excellent job of capturing data moments.
7. Conclusion
In this paper, I study the quantitative relevance of the working capital channel. Since one of the main assumptions in macroeconomic models is that this channel is full and, hence, monetary policy has important effects on firms’ decisions, it is important to estimate this channel from microeconomic data. With this goal in mind, I develop a firm dynamic model with investment, financing frictions, and working capital requirements. I estimate the working capital channel using the SMM technique for the entire sample from Compustat’s annual data from 1971 to 2018.
From full sample estimation, I find that the working capital channel is not as full as it is assumed in macroeconomic models, but it is still quantitatively important (0.758). From industry estimation, I find this parameter is different across industries. All these results support the quantitative relevance of the working capital channel, but they suggest that it is not the same for every industry and is not full for the entire sample.
These results trigger important questions: what is the magnitude of the working capital over the business cycle? Is the proportion of working capital requirement financed by loans different for expansion and recessions? Is the proportion of working capital requirement financed by loans different for constrained and unconstrained firms? Or for small, medium, and large firms? Considering the magnitude of the working capital channel, how could monetary policy affect the firm’s capital structure through this channel? Is this effect different due to the firm’s characteristics? All of these questions open an exciting and promising research agenda.
Finally, I decided to use a real model in this study, in which the demand channel of monetary policy is absent, to isolate the working capital channel and study it without other effects. In this setup, I show that the working capital channel is quantitative relevant and heterogeneous across sectors. If we add the demand channel by which consumption and investment decrease due to an increase in interest rate (a monetary policy shock), production could fall. In this scenario, the firm could use cash to cover labor costs, which weakens the working capital channel. This result is in the same direction as our estimates: the working capital channel is not complete as assumed in macroeconomic models. Furthermore, estimating the working capital channel in a New Keynesian framework at the sectoral level seems promising. This is a natural extension of this paper, which I leave for future research.
Acknowledgements
I am thankful to the seminar participants at the American Finance Association (AFA) 2021, SFS Cavalcade NA 2020, Macro-Finance Research Program Summer Session for Young Scholars (The University of Chicago) 2020, MIT Finance Student Workshop, Chicago Booth Finance Brownbag, Arizona State University, Cleveland State University, and Rochester Institute of Technology. I also thank to Nathalie Moyen, Vincenzo Quadrini (AFA discussant), Michael Weber, and Yufeng Wu (SFS Cavalcade discussant). Special thanks to Seth Pruitt, David Schreindorfer, Rajnish Mehra, and Hendrik Bessembinder for their helpful comments. My profound thankfulness to Jesus Christ for His steadfast love and faithfulness.
Funding sources
This research did not receive any specific grant from funding agencies in the public, commercial, or not-for-profit sectors.
Appendix
A. Model
A.1 Timing
This section explains the timing convention used in the model. This is important since the model attempts to capture the timing lag between the working capital requirement at the beginning of a period and the profit realization at the end of the period. Figure A1 illustrates the timing characteristics of the model. First, every period has a beginning and an endpoint. Second, the end of a period represents the beginning of the next period. For instance, the end of period $t$
is the beginning of period
$t$
is the beginning of period $t+1$
. Third, a variable without an apostrophe (‘) means that this variable is at the end of the period
$t+1$
. Third, a variable without an apostrophe (‘) means that this variable is at the end of the period $t$
(e.g. labor
$t$
(e.g. labor $n$
). A variable with an apostrophe means that this variable is at the end of the period
$n$
). A variable with an apostrophe means that this variable is at the end of the period $t+1$
(e.g.
$t+1$
(e.g. $n'$
), and a variable with subscript “–1” means that this variable is at the end of the period
$n'$
), and a variable with subscript “–1” means that this variable is at the end of the period $t-1$
or equivalently at the beginning of the period
$t-1$
or equivalently at the beginning of the period $t$
(e.g. the gross interest rate
$t$
(e.g. the gross interest rate $R_{-1}$
).
$R_{-1}$
).
For instance, at the end of the period $t$
, the firm distributes its cash flow
$t$
, the firm distributes its cash flow $d$
to shareholders, uses labor
$d$
to shareholders, uses labor $n$
for production, and pays the previous loans
$n$
for production, and pays the previous loans $R_{-1}loan_{-1}$
, where
$R_{-1}loan_{-1}$
, where $loan_{-1}$
represents the debt obtained at the beginning of period
$loan_{-1}$
represents the debt obtained at the beginning of period $t$
. Furthermore, the firm decides its
$t$
. Furthermore, the firm decides its $cash$
and new debt (
$cash$
and new debt ( $loan$
) to finance in advance its labor cost
$loan$
) to finance in advance its labor cost $ n'w'$
(see Figure A1).
$ n'w'$
(see Figure A1).
Timing.

A.2 Model equations
The following table shows the equations’ model.
A.3 Numerical solution
I follow three steps to find a numerical solution of the base model.
-
1. Steady state. With the calibration, I find the steady-state value for all variables. For example, output (
$Y_{ss} = 0.3380$
), capital (
$K_{ss} = 0.8588$
), and investment (
$I_{ss} = 0.0859$
). -
2. Finite state space. I specify a finite state space for the two-state variables,
$k$
, and
$\varepsilon$
. First, using the method in Tauchen (Reference Tauchen1986), I construct a grid for the interest rate shock
$\varepsilon$
. I consider 11 points in that grid centered in the steady-state value of gross interest rate (
$R_{ss} = 1.04$
). This procedure transforms the equation (5) into a discrete state Markov chain on the interval
$[1,1.08]$
. Furthermore, I then construct a grid for
$k$
, which contains 101 points centered at the steady-state capital stock (
$K_{ss}$
). From this procedure, I have that
$k \in [\underline{k}, \overline{k}]$
. The lower bound of this grid,
$\underline{k}$
, is 0.5 times the steady-state value of capital stock evaluated in the lower bound of
$\varepsilon$
. In the same way, the upper bound of
$k$
is the steady-state value of capital stock evaluated in the upper bound of
$\varepsilon$
. I follow the same strategy for
$n$
. -
3. Method to solve the model. I solve the model using value function iteration on the Bellman equation (13), which generates the value function
$V(k,\varepsilon )$
and the policy function
${k',n'} = g(k,n,\varepsilon )$
. Additionally, other important policy functions are obtained, such as
${\text{profitability, investment rate, and working capital ratio}} = g(k,n,\varepsilon )$
.


-
Michaelides and Ng (Reference Michaelides and Ng2000) find that good finite sample performance requires a simulated sample that is approximately ten times as large as the actual data sample.
Model equations

Impulse-response function. The figure depicts the optimal response of the firm’s value, investment rate, profitability, and working capital ratio in response to the interest rate shock $R$
. These results are obtained from a calibrated model assuming
$R$
. These results are obtained from a calibrated model assuming $\phi =0.5$
and three levels of
$\phi =0.5$
and three levels of $R$
shock: low shock is 50% lower than the medium shock (
$R$
shock: low shock is 50% lower than the medium shock ( $\sigma _{\varepsilon }= 0.51/3$
) and high shock is 50% greater than the medium shock.
$\sigma _{\varepsilon }= 0.51/3$
) and high shock is 50% greater than the medium shock.

A.4 Impulse-response functions
How does a firm respond over time when an interest rate shock occurs? Since the policy functions show us what the current firm’s optimal response is when shocks occur, the impulse-response function shows us how this optimal response behaves over time. Usually, the impulse-response function considers that the shock occurs in $t=1$
, and its persistence decreases over time until it returns to the steady-state value. The dynamic of the interest rate shock is described by Equation (5). In particular, I study the firm’s optimal response in three intensive interest rate shock levels, illustrated in Figure A2. If the shock is strong,Footnote
10
the working capital channel transmits and amplifies this shock to the firm’s behavior. In this case, the firm’s value, profitability, investment rate, and working capital ratio reduce their values. Why do these variables decrease? This is because the firm optimally adjusts the degree of labor demand in its production process since the marginal labor cost has been increased. This reduction in labor generates lower profits, investment, and working capital debt.
$t=1$
, and its persistence decreases over time until it returns to the steady-state value. The dynamic of the interest rate shock is described by Equation (5). In particular, I study the firm’s optimal response in three intensive interest rate shock levels, illustrated in Figure A2. If the shock is strong,Footnote
10
the working capital channel transmits and amplifies this shock to the firm’s behavior. In this case, the firm’s value, profitability, investment rate, and working capital ratio reduce their values. Why do these variables decrease? This is because the firm optimally adjusts the degree of labor demand in its production process since the marginal labor cost has been increased. This reduction in labor generates lower profits, investment, and working capital debt.
Descriptive statistics

This table presents descriptive statistics for the main variables used in the estimation for all the samples and every industry except for utilities, finance, and public administration firms. The sample is based on Compustat Annual Industrial Files. The sample covers the period from 1971 to 2018 at an annual frequency.
*This industry includes forestry and fishing as well.
Identification

This table summarizes the characteristics of six moments (mean and variance for three variables) for every parameter.
Hypothesis test: $\phi _j = \phi _i$

It is worth noting that the investment rate decreases only in the same period the shock is realized and immediately goes back to its steady-state value (upper left-side panel of Figure A2). This is because the shock is almost fully absorbed by the labor demand, which is partially financed by working capital loans. This behavior is consistent with the literature in corporate finance since short-term debts finance working capital requirements, and investment is more connected to long-term debts. As a result, any movement in short-term debt should affect the firm’s working capital decisions instead of affecting investment. Additionally, investment in my model is financed by revenues, and if it is not enough, the firm issues equity.
B. Data, identification, and estimation process
In this section, I discuss the identification strategy and the estimation technique. Figure B1 shows the steps in the identification and estimation process in the same spirit as Strebulaev and Whited (Reference Strebulaev and Whited2012). Specifically, identification involves four main tasks: (i) choose potential moments, (ii) define a vector of values for each of the parameters that I want to estimate, (iii) simulate the model with those values, and compute the simulated moments, and (iv) choose informative moments. Next, the estimation process also starts with four main tasks: (i) compute moments from the data (empirical moments), (ii) compute moments from the model (theoretical moments), (iii) use the SMM technique to estimate the target parameters, and (iv) evaluate the accuracy of our estimation.
B.1 Descriptive statistics
The identification and estimation process. This figure shows the steps in the parameters identification and estimation procedure.

B.2 Identification
In this section, I illustrate the identification process by an example. Suppose that the mean of the variable $x$
,
$x$
, $\mu _x$
, is a function of only one parameter of the model,
$\mu _x$
, is a function of only one parameter of the model, $\theta$
. This means that
$\theta$
. This means that $\mu _x = f(\theta )$
. Additionally, let’s assume that this function
$\mu _x = f(\theta )$
. Additionally, let’s assume that this function $f$
is quadratic in
$f$
is quadratic in $\theta$
, so
$\theta$
, so $f(\theta ) = \theta ^2$
. After simulating the mean of the variable
$f(\theta ) = \theta ^2$
. After simulating the mean of the variable $x$
for a range of values of
$x$
for a range of values of $\theta$
, we have panel B of Figure B2. As we can see, for a particular value of the mean of
$\theta$
, we have panel B of Figure B2. As we can see, for a particular value of the mean of $x$
,
$x$
, $\mu _x^1$
, we have two possible values of the parameter
$\mu _x^1$
, we have two possible values of the parameter $\theta$
:
$\theta$
: $\theta _1$
and
$\theta _1$
and $\theta _2$
. Which of these parameter values is correct? We can get the same value of
$\theta _2$
. Which of these parameter values is correct? We can get the same value of $\mu _x$
with both. As a result, we cannot identify exactly the value of
$\mu _x$
with both. As a result, we cannot identify exactly the value of $\theta$
. This is because the function
$\theta$
. This is because the function $f$
, which maps moments to parameters, is not one-to-one and onto. In contrast, in panel A of Figure B2, we have that
$f$
, which maps moments to parameters, is not one-to-one and onto. In contrast, in panel A of Figure B2, we have that $f$
is one-to-one and onto function,
$f$
is one-to-one and onto function, $f(\theta ) = \sqrt{\theta }$
. In this case, for every value of
$f(\theta ) = \sqrt{\theta }$
. In this case, for every value of $\mu _x$
, we have only one value of
$\mu _x$
, we have only one value of $\theta$
associated with it. This allows us to identify exactly the parameter
$\theta$
associated with it. This allows us to identify exactly the parameter $\theta$
. This example illustrates that the identification condition requires mapping between moments and structural parameters to be one-to-one and onto. Furthermore, this identification condition suggests that the relationship between moments and parameters should be steep and monotonic, which means that moments are informative about parameters.
$\theta$
. This example illustrates that the identification condition requires mapping between moments and structural parameters to be one-to-one and onto. Furthermore, this identification condition suggests that the relationship between moments and parameters should be steep and monotonic, which means that moments are informative about parameters.
Identification vs. No identification. This figure shows that the identification condition requires that the function that maps moments to parameters must be one-to-one and onto.

Identification— $\boldsymbol{\phi }$
. This figure shows how six moments vary with the value of
$\boldsymbol{\phi }$
. This figure shows how six moments vary with the value of $\phi$
.
$\phi$
.

Identification— $\alpha$
. This figure shows how six moments vary with the value of
$\alpha$
. This figure shows how six moments vary with the value of $\phi$
.
$\phi$
.

Identification— $\delta$
. This figure shows how six moments vary with the value of
$\delta$
. This figure shows how six moments vary with the value of $\phi$
.
$\phi$
.

B.3 Model evaluation
This section evaluates whether the estimation of $\phi$
is statistically different among sectors. I also calculate the confidence intervals for
$\phi$
is statistically different among sectors. I also calculate the confidence intervals for $\phi$
.
$\phi$
.
Statistical differences between the magnitudes of $\phi$
of different sectors. I test the following null hypothesis
$\phi$
of different sectors. I test the following null hypothesis
 \begin{equation*} \text {H0:} \quad \phi _j = \phi _i\end{equation*}
for sector $j$
and
$j$
and $i$
(
$i$
( $j \neq i$
). To do so, I use the
$j \neq i$
). To do so, I use the $t$
statistic, calculated as follows.
$t$
statistic, calculated as follows.
 \begin{equation*}t_{cal} = \frac {\phi _j - \phi _i}{s_p \times \sqrt {1/n_i + 1/n_j}},\end{equation*}
where $\phi _j$
(or
$\phi _j$
(or $\phi _i$
) is the estimated
$\phi _i$
) is the estimated $\phi$
for sector
$\phi$
for sector $i$
(or
$i$
(or $j$
),
$j$
), $n_i$
(or
$n_i$
(or $n_j$
) is the observation number of sector
$n_j$
) is the observation number of sector $i$
(or
$i$
(or $j$
), and
$j$
), and $s_p$
is the pooled standard deviation calculated as follows
$s_p$
is the pooled standard deviation calculated as follows
 \begin{equation*}s_p = \sqrt {\frac {(n_i - 1)s_i^2 + (n_j - 1)s_j^2}{n_i + n_j -2}},\end{equation*}
where $s_i$
(or
$s_i$
(or $s_j$
) is the standard deviation of sector
$s_j$
) is the standard deviation of sector $i$
(or
$i$
(or $j$
). Considering a significant level of 0.05 (
$j$
). Considering a significant level of 0.05 ( $\alpha = 5\%$
) and the degrees of freedom (
$\alpha = 5\%$
) and the degrees of freedom ( $df$
) defined as
$df$
) defined as $df = n_i + n_j -2$
, the criteria to reject the null hypothesis is given by
$df = n_i + n_j -2$
, the criteria to reject the null hypothesis is given by
 \begin{equation*}\text {If } t_{cal} \gt t_{\alpha,df},\quad \text {then H0 is rejected}\end{equation*}
The results of this exercise are shown in Table A4, which confirms that the working capital channel is statistically different among sectors.
95% confidence intervals. I calculate the 95% confidence interval as follows.
 \begin{equation*}\left [ \bar {\phi } -1.96 \times \text {SE} \quad,\quad \bar {\phi } + 1.96 \times \text {SE} \right ],\end{equation*}
where SE represents the standard error. Figure B6 shows the confidence interval at 95% of the estimated $\phi$
for each industry and the entire sample. There are overlapping intervals. In some cases, based on these confidence intervals, it is possible not to reject the hypothesis that
$\phi$
for each industry and the entire sample. There are overlapping intervals. In some cases, based on these confidence intervals, it is possible not to reject the hypothesis that $\phi$
could be one. However, this result does not invalidate the structural estimation of
$\phi$
could be one. However, this result does not invalidate the structural estimation of $\phi$
(Morey et al. Reference Morey, Hoekstra, Rouder, Lee and Wagenmakers2016) but suggests we should take them carefully.
$\phi$
(Morey et al. Reference Morey, Hoekstra, Rouder, Lee and Wagenmakers2016) but suggests we should take them carefully.
95% confidence intervals. This figure shows 95% confidence interval for the estimated $\phi$
by sectors. For instance, the estimated
$\phi$
by sectors. For instance, the estimated $\phi$
for the full sample is 0.758 (black point in the vertical red line) with a confidence interval at 95% represented by the vertical red line.
$\phi$
for the full sample is 0.758 (black point in the vertical red line) with a confidence interval at 95% represented by the vertical red line.


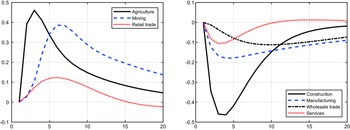

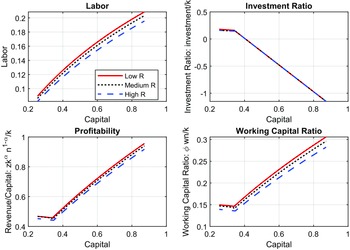


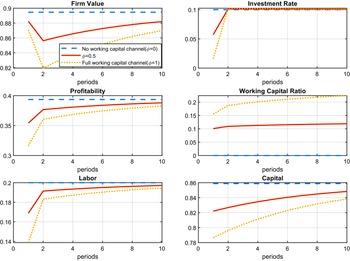


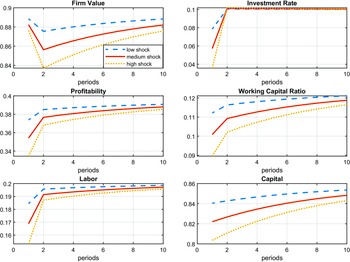


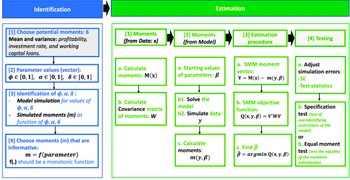

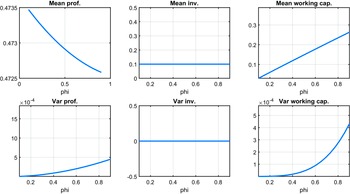


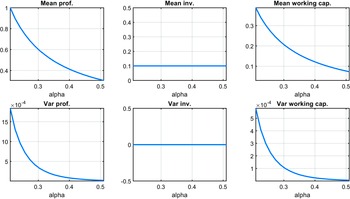


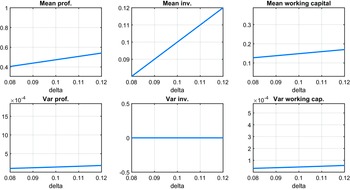


 Open access