


The onset of an illness has the potential to induce profound changes in a person’s life, resulting in adverse effects on their quality of life and well-being (De Ridder et al., Reference De Ridder, Geenen, Kuijer and Van Middendorp2008). Various psychological factors contribute to individuals’ emotional and psychological well-being, including acceptance of the illness and how the person adjusts their previous life to the current self-care demands induced by the illness and coping strategies (Kalra et al., Reference Kalra, Jena and Yeravdekar2018). The impact of the illness on the individuals extends beyond symptom manifestation, affecting the person’s functioning in several significant life domains, including social, vocational, educational, and personal areas (Bury, Reference Bury1982; Miller et al., Reference Miller, Chen and Cole2009; Tsaras et al., Reference Tsaras, Papathanasiou, Mitsi, Veneti, Kelesi, Zyga and Fradelos2018).
However, being diagnosed with a physical illness may not carry the same impact or implications as being diagnosed with a mental health disorder, which tends to have less acceptance (Choe et al., Reference Choe, Baldwin and Song2020) and more stigma (Huggett et al., Reference Huggett, Birtel, Awenat, Fleming, Wilkes, Williams and Haddock2018). Even within different mental disorders, there are also differences in the social perception of them. Psychotic disorders exhibit the highest level of social stigma, among mental disorders (Huggett et al., Reference Huggett, Birtel, Awenat, Fleming, Wilkes, Williams and Haddock2018) and acceptance challenges (Choe et al., Reference Choe, Baldwin and Song2020), leading to delayed treatment-seeking and prolonged untreated periods (Zweifel, Reference Zweifel2021). This contributes to compromised social functioning and diminished quality of life, especially among younger people (Schimmelmann et al., Reference Schimmelmann, Huber, Lambert, Cotton, McGorry and Conus2008).
The Impact of Illness Scale (IIS) was designed to measure the extent to which an illness (mental or physical) has adversely affected important areas of a person’s life as perceived by that person (Klimidis et al., Reference Klimidis, Minas and Yamamoto2001). It uses nine items to explore the limitations in daily life associated with the illness and the extent to which it interferes with important roles and daily responsibilities in nine domains of functioning, as perceived by the patient. Compared to other scales used in mental health to assess functioning, the IIS has several advantages, including its brevity and ease of administration, its simple unidimensional structure (i.e., perceived impact), and the fact that it can be applied to a wide range of clinical populations and in both care and research settings, providing the opportunity to compare different illnesses. Furthermore, the content measured by the IIS does not reference symptoms or signs of the illness. This deliberate choice is intended to avoid any possible confounding of the results. Consequently, the results will relate solely to psychosocial aspects, separating them from the underlying pathological processes. This provides a pure subjective psychosocial outcome measure, yielding accurate and specific insights into how individuals perceive the impact of their mental disorder across various vital areas.
The growing emphasis on understanding how individuals perceive the impact of their mental health conditions reflects a shift away from traditional medical models, which focus primarily on symptoms and deficits, toward a more holistic approach (Álvarez-Jiménez et al., Reference Álvarez-Jiménez, Gleeson, Henry, Harrigan, Harris, Killackey, Bendall, Amminger, Yung, Herrman, Jackson and McGorry2012). This focus on subjective experience is central to strength-based recovery models, which highlight patients’ abilities, talents, resources, and aspirations rather than their limitations (Allott et al., Reference Allott, Steele, Boyer, de Winter, Bryce, Alvarez-Jimenez and Phillips2020). By empowering individuals to set meaningful goals and leverage their personal strengths, this approach fosters resilience and well-being, moving beyond symptom treatment (Gelkopf et al., Reference Gelkopf, Lapid, Werbeloff, Levine, Telem, Zisman-Ilani and Roe2016). The model not only improves mental health but also enhances life satisfaction and a sense of purpose (Allott et al., Reference Allott, Steele, Boyer, de Winter, Bryce, Alvarez-Jimenez and Phillips2020), aligning with the principles of the IIS, which similarly values the patient’s lived experience. This shift is especially crucial for vulnerable populations, such as those experiencing first episode of psychosis (FEP), who may face negative core beliefs and challenges during a critical developmental stage (Rose et al., Reference Rose, Wykes, Farrier, Doran, Sporle and Bogner2008).
The validation of the IIS in individuals with a FEP is essential due to the distinct challenges faced by this population. FEP often occurs during critical developmental stages, leading to profound disruptions in personal, social, and vocational domains (Davidson, Reference Davidson2003; Noiriel et al., Reference Noiriel, Verneuil, Osmond, Manolios, Revah-Levy and Sibeoni2020). Additionally, experiencing psychotic symptoms and undergoing initial treatment, often involving coercive interventions, can be highly traumatic, negatively impacting self-esteem, self-perception, and social integration (Davidson, Reference Davidson2003; Dunkley et al., Reference Dunkley, Bates and Findlay2015; Lu et al., Reference Lu, Mueser, Rosenberg, Yanos and Mahmoud2017). Despite symptom remission, individuals with FEP frequently struggle with a lower quality of life, higher suicide risk, and increased psychological and physical comorbidities (Birchwood et al., Reference Birchwood, Trower, Brunet, Gilbert, Iqbal and Jackson2007; Cotton et al., Reference Cotton, Gleeson, Alvarez-Jimenez and McGorry2010). The IIS offers a unique advantage as it focuses on the patient’s subjective perception of how the illness affects various aspects of their life, which is crucial for addressing dimensions that traditional symptom-based evaluations overlook.
Moreover, there are no known validations of the IIS other than the one conducted by the original authors (Klimidis et al., Reference Klimidis, Minas and Yamamoto2001), which has significant limitations. The original validation study primarily involved a population of Turkish immigrants in Australia, with only a small subset having psychotic disorders (n = 6). This lack of specificity, combined with the cultural and demographic characteristics of the sample, raises concerns about the generalizability of the findings to populations with FEP. Migrant individuals may experience a greater life impact following psychosis, not only due to the disorder itself but also because of other factors associated with cultural shock, social stigma, and related aspects (Cheng et al., Reference Cheng, Tu, Li, Chang and Yang2015). Additionally, the original validation did not focus on differentiating between mental health conditions, thus failing to account for the unique experiences of individuals with psychosis.
However, despite these limitations, the validation study conducted by the group of Klimidis et al. (Reference Klimidis, Minas and Yamamoto2001) is currently being used to support the use of this instrument in Spanish-speaking samples with psychosis (e.g., García-Álvarez et al., Reference García-Álvarez, Lemos-Giráldez, Seco, Ordóñez-Camblor, Paino, Burón-Fernández, Vallina-Fernández, Fernández-Iglesias and Solares-Vázquez2014; Ordóñez et al., Reference Ordóñez, Fonseca and Paino2015). In consequence, validating the IIS in an FEP sample addresses these gaps, ensuring that the scale is reliable and applicable for this vulnerable population, and promotes a more personalized and holistic approach to both clinical care and research.
Therefore, the aim of the present study was to assess the psychometric properties of the IIS in a sample of people with FEP in Spain. Specifically, we aimed to (a) verify if it is unifactorial as the original version, (b) examine internal consistency, (c) explore IIS convergent and discriminant validity, and (d) analyze the temporal stability of the scale.
We expect the one-factor solution to have good fit indices, demonstrating that the IIS maintains its unidimensional structure in the FEP sample. We also anticipate that the scale will exhibit adequate internal consistency. To assess the convergent and discriminant validity of the IIS, we examined its correlation with measures capturing related but distinct constructs. Convergent validity was tested using self-report scales on internalized stigma (Internalized Stigma of Mental Illness [ISMI]; Ritsher et al., Reference Ritsher, Otilingam and Grajales2003) (Oexle et al., Reference Oexle, Müller, Kawohl, Xu, Viering, Wyss, Vetter and Rüsch2018) and negative beliefs about FEP (Personal Beliefs about Illness Questionnaire-Revised [PBIQ-R]; Birchwood et al., Reference Birchwood, Jackson, Brunet, Holden and Barton2012) (Fusar-Poli et al., Reference Fusar-Poli, Estradé, Stanghellini, Venables, Onwumere, Messas, Gilardi, Nelson, Patel, Bonoldi, Aragona, Cabrera, Rico, Hoque, Otaiku, Hunter, Tamelini, Maschião, Puchivailo and Maj2022), reflecting the subjective experience of disorder conceptually aligned with the IIS. We posit that the IIS would exhibit a small-to-moderate effect size in its correlations with those constructs, indicating that the IIS captures unique aspects not fully represented by related constructs. Discriminant validity was assessed with clinician-rated measures of symptom severity for psychopathology (Dunkley et al., Reference Dunkley, Bates and Findlay2015), representing a clinician-based evaluation of illness distinct from patients’ perceived impact as IIS does. In this case, we predict nonsignificant or minimal effect sizes, suggesting no overlap between the constructs. We also expect the scale to demonstrate good temporal stability over time.
Method
Transparency and Openness
This study’s design and its analysis were not preregistered. Data are available upon request from the authors. The data contain sensitive and confidential information that could compromise the privacy of the participants. Therefore, the data can be shared upon direct request and with the approval of the relevant ethics committee.
Participants and Procedure
The sample was recruited from an Early Intervention of Psychosis Program in Cantabria (Intervención Temprana en Psicosis de Cantabria [ITPCan]), using consecutive sampling from January 2019 to April 2023. The ITPCan program is located at the University Hospital Marqués de Valdecilla (Cantabria, Spain). Inclusion criteria were as follows: (1) age between 18 and 65 years, (2) International Statistical Classification of Diseases and Related Health Problems, 10th Revision (ICD-10) criteria for diagnosis of schizophrenia spectrum disorders (F20–F29) or mood disorders with psychotic features (F30.2, F31.2, F31.5), (3) having no prior treatment with antipsychotic medication or, if previously treated, a total lifetime of adequate antipsychotic treatment of less than 6 months, and (4) living in the catchment area. Exclusion criteria were (1) intellectual disability (F70–F79), (2) inadequate comprehension and expression in Spanish, (3) diagnosis of personality disorder (F60–F69), (4) posttraumatic stress disorder (F43.1), (5) drug dependency disorder (F10–F19), (6) organic psychosis, and (7) psychosis induced by deprivation or intoxication with toxins.
The study’s sample consisted of 141 individuals who completed the IIS questionnaire, within the cohort of 227 individuals undergoing treatment at the ITPCan program. Participants completed the IIS around 3 months into their treatment, a time frame typically associated with attaining clinical stability.
The study was approved by the local Ethics Committee for Research with Medicines and Healthcare Products of Cantabria (code: 2023.046) under the routine procedures for audit and service evaluation. All scales and questionnaires utilized in the ITPCan program, in conjunction with sociodemographic and clinical information stored in the electronic record, were subjected to evaluation by the audit.
Measures
Impact of Illness Scale (IIS)
The IIS (Klimidis et al., Reference Klimidis, Minas and Yamamoto2001) is a self-report measure of the extent to which an illness is believed to limit one’s ability to engage in social and psychological activities. The scale is composed of nine items with a Likert-scale response of four options, reflecting the perceived impact associated with the illness in various vital areas, ranging from 0 (none) to 3 (completely). The vital areas are (1) engaging in fulfilling interpersonal connections, (2) ability to engage in employment or educational pursuits, (3) participation in pleasurable leisure activities, (4) fulfilling social and religious responsibilities, (5) meeting familial obligations and meeting expectations, (6) ability to handle regular household tasks, (7) attending to personal daily necessities, (8) overall physical mobility, and (9) capacity to focus on and address matters other than the illness. The original IIS is unifactorial, measuring a single dimension of perceived impact. A total score, from 0 to 27, is obtained by summing up all the direct scores, with higher total scores indicating a more significant perceived impact. In the original study conducted by Klimidis and colleagues, Cronbach’s alpha coefficient was found to be .93 for the community sample and .82 for the sample with mental disorders.
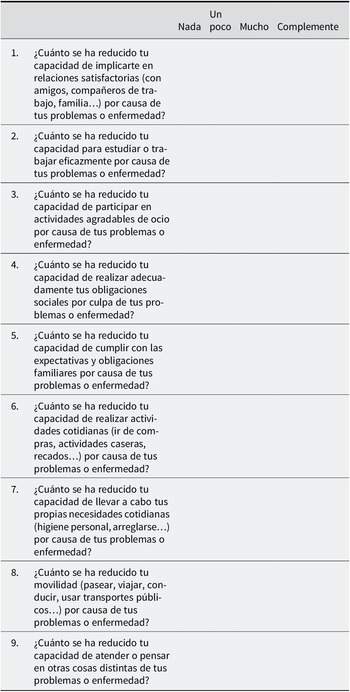
For this study, the Spanish version of the IIS was used. The fit of the Spanish translation (see Table A1 in Appendix) of the English original scale was validated through reverse translation (from Spanish back into English) by an English native speaker. The comparison between the original English scale and the back-translated version revealed no significant differences, confirming the accuracy of the translation.
Personal Beliefs about Illness Questionnaire-Revised (PBIQ-R)
This self-report scale (Birchwood et al., Reference Birchwood, Jackson, Brunet, Holden and Barton2012) comprises 20 items organized into five dimensions, covering the self-assessment that people make about their psychotic disorder: shame, loss, entrapment, control over illness, and social marginalization. Each dimension is assessed using four Likert-scale items, ranging from 1 (completely disagree) to 4 (completely agree). Scores for each dimension range from 4 to 16, with higher scores indicating stronger convictions regarding negative beliefs and a lower social rank. The scale is not intended to yield an overall composite score.
In this study, the Spanish validation of the PBIQ-R (Vázquez Morejón et al., Reference Vázquez Morejón, Jackson, Vázquez-Morejón and Leon-Perez2022) was utilized. The questionnaire demonstrated good internal consistency for the control over illness (ω = .830; α = .828), loss (ω = .816; α = .813), shame (ω = .868; α = .859) and social marginalization (ω = .828; α = .804) subscales, and excellent internal consistency for the entrapment subscale (ω = .904; α = .902).
Internalized Stigma of Mental Illness (ISMI)
A self-rated questionnaire containing 29 items measured five dimensions, comprising alienation, endorsement of stereotypes, experience of discrimination, social withdrawal, and stigma resistance. Each dimension was scored on a four-point scale ranging from 1 (completely disagree) to 4 (completely agree). The questionnaire yields scores for each subscale by summing the scores of individual items. Each subscale has its own range of scores: alienation (6–24), endorsement of stereotypes (7–28), experience of discrimination (5–20), social withdrawal (6–24), and stigma resistance (5–20). Additionally, a total score can be obtained by summing all 29 items, ranging from 29 to 116. Higher scores indicate more severe internalized stigmatization (Ritsher et al., Reference Ritsher, Otilingam and Grajales2003).
The Spanish validation of the ISMI scale conducted by Bengochea-Seco et al. (Reference Bengochea-Seco, Arrieta-Rodríguez, Fernández-Modamio, Santacoloma-Cabero, Gómez de Tojeiro-Roce, García-Polavieja, Santos-Zorrozúa and Gil-Sanz2018) was used. The total score demonstrated excellent internal consistency (ω = .933; α = .918). For the subscales, the stigma resistance subscale showed acceptable internal consistency (ω = .767; α = .758), while the endorsement of stereotypes, experience of discrimination, and social withdrawal subscales showed good internal consistency with values of ω = .843; α = .842, ω = .829; α = .829, and ω = .894; α = .891, respectively. The alienation subscale demonstrated excellent internal consistency with values of ω = .909; α = .907.
Positive and Negative Syndrome Scale (PANSS)
The PANSS is a clinical interview consisting of 30 items that evaluate the presence of psychotic symptoms in individuals with schizophrenia. This instrument is organized in three subscales: seven items measuring positive symptomatology (e.g., hallucinations, delusions, conceptual disorganization), seven items measuring negative symptomatology (e.g., blunted affect, emotional withdrawal), and 16 items measuring general psychopathology (e.g., depression, anxiety, lack of insight, poor attention). The responses were scored on a seven-level Likert scale (ranging from 1 = absent to 7 = extreme). This scale generates separate total scores for each subscale and an overall score, which is calculated by adding up the scores for each item. The positive and negative subscale scores range from 7 to 49, while the overall subscale score ranges from 16 to 112. The total score ranges from 30 to 210. A higher score indicates a greater severity of symptoms (Kay et al., Reference Kay, Fiszbein and Opler1987).
In the study, the Spanish validation of the PANSS (Peralta & Cuesta, Reference Peralta and Cuesta1994) was utilized. Using our sample, this scale showed unacceptable internal consistency for the positive scale (ω = .052; α = .156), excellent consistency for the negative scale (ω = .911; α = .902), and good consistency for the general psychopathology scale (ω = .714; α = .719).
Sociodemographic Data
Demographic data, encompassing participants’ age, gender, marital status, educational attainment, and principal occupation, were gathered after the initial contact with each participant by psychiatrists of the ITPCan program.
Statistical Analysis
Sociodemographic data underwent scrutiny through the application of descriptive statistics. Chi-square (χ2) and Student’s t-tests were performed to analyze the differences in noncontinuous and continuous sociodemographic variables between individuals who responded to the IIS and those who did not. In addition, the corresponding effect size statistics (Cramer’s V for nominal variables and Cohen’s d for quantitative variables) were calculated. A sensitivity power analysis was conducted using G*Power v3.1 software to verify that the sample size provided sufficient statistical power to detect group differences in at least a medium effect size in the sociodemographic comparisons between those who completed the IIS and those who did not. Effect sizes were interpreted according to Cohen’s (Reference Cohen1988) criteria: .20, .50, and .80 for small, medium, and large Cohen’s d and .10, .30, and .50 for small, medium, and large Cramer’s V.
Skewness and kurtosis analyses were conducted to identify the most appropriate confirmatory factor analysis (CFA) estimator. Values lower than ±2 were taken as indicators of relative univariate normality, following the criteria established by Hahs-Vaughn and Lomax (Reference Hahs-Vaughn and Lomax2020).
Factor analysis was performed on the polychoric correlation matrix, using the weighted least squares mean and variance adjusted (WLSMV), which is recommended for ordinally scaled items (Li, Reference Li2016).
Model fit was assessed using the following fit indices: root-mean-square error of approximation (RMSEA ≤ .05 for optimal; ≤ .08 for acceptable, and ≤.10 for poor) (Brown, Reference Brown2015; Kline, Reference Kline2023), comparative fit index (CFI ≥ .90: considered desirable) (Hu & Bentler, Reference Hu and Bentler1998), Tucker–Lewis index (TLI ≥ .90: considered acceptable and ≥ .95 considered desirable) (Hu & Bentler, Reference Hu and Bentler1998), and the weighted root-mean square (WRMR ≤1.0 indicating adequate model fit) (DiStefano et al., Reference DiStefano, Liu, Jiang and Shi2017). In line with recommendations for ordinal data (Flora & Curran, Reference Flora and Curran2004), CFI, TLI, and RMSEA were prioritized. The standardized root-mean-square residual (SRMR) index was not reported, as it is not available with WLSMV estimation. Instead, the WRMR was used, which has been proposed as a suitable fit index for models estimated with WLSMV and categorical data.
Given the categorical-ordered nature of the IIS scores, internal consistency was evaluated using McDonald’s total omega coefficient (ω), estimated in its standardized form based on the factor model. Omega coefficients were computed directly in Mplus, which provides point estimates and confidence intervals. We also calculated Cronbach’s α for comparison purposes with other studies, as this is the coefficient most commonly reported. Both internal consistency coefficients were interpreted according to established standards: For group difference research, a value of .8 is considered the minimum acceptable, while for high-stakes individual-level inference, a value of .9 is the minimally acceptable threshold (Nunnally & Bernstein, Reference Nunnally and Bernstein1994). Additionally, 95% confidence intervals (95% CI) for Cronbach’s α and Spearman correlations were obtained using 1,000 bootstrap samples with bias-corrected and accelerated (BCa) intervals in Statistical Package for the Social Sciences (SPSS).
In addition, the item-total corrected correlation (CITC) was calculated to assess internal consistency. This involves correlating the score of each item with the total scale score, while excluding that specific item. This method helps reduce potential bias that may occur in short scales and offers a more accurate estimate of each item’s contribution to the overall internal consistency.
To assess convergent and discriminant construct validity, Spearman’s rho correlations between the IIS and the other scales (PBIQ-R, ISMI, and PANSS) were calculated, due to the ordinal nature of the data and the fact that parametric assumptions were not met, making nonparametric correlations more appropriate. For the PBIQ-R, correlations were calculated using its subscale scores, as no total score is available; for the ISMI, the total score was employed; and for the PANSS, correlations were computed using the total scores of the Negative and General Psychopathology subscales. Due to the unacceptable low internal consistency of the Positive Affect subscale, correlations for this subscale were examined at the item level to avoid biases associated with unreliable aggregate scores. A sensitivity power analysis was performed using G*Power v3.1 software to ensure adequate statistical power for the convergent and discriminant validity tests, which were based on bivariate (Spearman) correlations. Given the modest sample size (n < 200), this analysis supports the appropriateness of the sample size for detecting medium or larger effect sizes. The power analysis was specified using a two-tailed test, an alpha level of .05, and a desired statistical power of .80, using our sample of n = 141. The values considered to estimate effect size are based on Spearman’s rho, with approximately .10, .30, and .50 interpreted as small, medium, and large effects, respectively (Cohen, Reference Cohen1988).
To examine temporal stability during this period, the intraclass correlation coefficient (ICC) values with 95% CIs were calculated based on a single measurement, absolute agreement, two-way mixed-effects model. Reliability was classified as follows: poor (ICC values < .5), moderate (.5–.74), good (.75–.9), and excellent (> .9) (Koo & Li, Reference Koo and Li2016).
All statistical analyses were performed with the statistical package IBM SPSS Statistics v.23, except for the CFA and the omega coefficient, which were performed with the Mplus v6.12 software (Muthén & Muthén, Reference Muthén and Muthén2010).
Results
Descriptive and Exploratory Analysis
Of the 227 participants, 141 individuals with available 3-month IIS data were included in the analysis. The main reasons for the unavailability of data from other patients are as follows: refusal to complete the questionnaires (12.8%), discontinuation of the program before 3 months (26.7%), severe psychotic symptoms preventing completion (23.3%), relocation to another city (11.6%), cognitive or sensory-perceptual difficulties (5.9%), and other reasons (such as failure to return completed questionnaires) (19.7%).
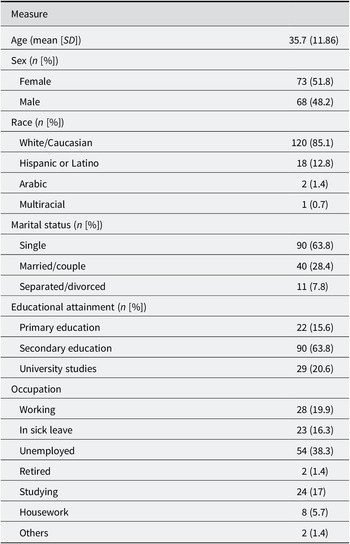
Details regarding the 141 individuals in the sample, including demographics such as age, sex, race, marital status, educational attainment, and occupation, are provided in Table 1.
Descriptive statistics for the sample (n = 141)

Table 1. Long description
The table is organized into two columns: Measure and the corresponding value.
* Age: mean 35.7 with a standard deviation S D of 11.86.
* Sex: Female 73 (51.8 percent), Male 68 (48.2 percent).
* Race: White/Caucasian 120 (85.1 percent), Hispanic or Latino 18 (12.8 percent), Arabic 2 (1.4 percent), Multiracial 1 (0.7 percent).
* Marital status: Single 90 (63.8 percent), Married/couple 40 (28.4 percent), Separated/divorced 11 (7.8 percent).
* Educational attainment: Primary education 22 (15.6 percent), Secondary education 90 (63.8 percent), University studies 29 (20.6 percent).
* Occupation: Working 28 (19.9 percent), In sick leave 23 (16.3 percent), Unemployed 54 (38.3 percent), Retired 2 (1.4 percent), Studying 24 (17 percent), Housework 8 (5.7 percent), Others 2 (1.4 percent).
No significant differences were found in gender (χ2 = 0.184; p = .668), marital status (χ2 = 4.45; p = .217), principal occupation (χ2 = 15.187; p = .056), duration of untreated illness (DUI) (t = −0.940; p = .349), overall functioning (t = 1.020; p = .309), depressive symptoms (t = 1.325; p = .187), or negative symptoms of psychosis (t = 1.589; p = .114) between the 141 (62.11%) respondents and the 86 (37.89%) nonrespondents to the IIS questionnaire. However, younger (t = −2.538; p = .012; d = −0.347) or more highly educated (completed secondary education) (χ2 = 16.502; p = .006; V = .270) individuals were more likely to complete the IIS questionnaire. Those with higher positive symptoms of psychosis (t = −3.840; p < .001; d = −0.539) or manic symptoms (t = −2.125; p = .035; d = −0.298) had a lower likelihood of completing the IIS questionnaire. The sensitivity power analysis was performed using G*Power v3.1 software with an alpha level of .05 and a two-tailed test with a sample size of n = 227. For the group comparison tests involving quantitative variables, the analysis indicated a statistical power of .98 to detect effects at least medium effect size (Cohen’s d > 0.50). For tests involving nominal variables, the power was .92 to detect effects of medium size or larger (V > .30). These results suggest a high probability of detecting effects of at least medium effect size.
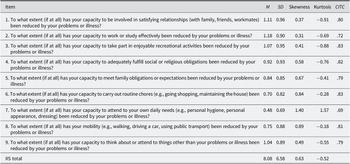
Before conducting the CFA, the mean, standard deviation, skewness, and kurtosis properties of the items of the IIS were analyzed (Table 2). All of them fall within the range of ±2, which indicates univariate normality.
IIS item means, standard deviation, skewness, kurtosis, and item-total corrected score correlations

Table 2. Long description
The table consists of six columns: Item, M (Mean), S D (Standard Deviation), Skewness, Kurtosis, and C I T C (Corrected Item-Total Correlation).
* Item 1 (Satisfying relationships): M 1.11, S D 0.96, Skewness 0.37, Kurtosis minus 0.91, C I T C .80.
* Item 2 (Work or study effectively): M 1.18, S D 0.90, Skewness 0.31, Kurtosis minus 0.69, C I T C .72.
* Item 3 (Enjoyable recreational activities): M 1.07, S D 0.95, Skewness 0.41, Kurtosis minus 0.88, C I T C .83.
* Item 4 (Social or religious obligations): M 0.92, S D 0.93, Skewness 0.58, Kurtosis minus 0.76, C I T C .82.
* Item 5 (Family obligations or expectations): M 0.84, S D 0.85, Skewness 0.67, Kurtosis minus 0.41, C I T C .79.
* Item 6 (Routine chores): M 0.70, S D 0.82, Skewness 0.84, Kurtosis minus 0.28, C I T C .83.
* Item 7 (Daily needs/hygiene): M 0.48, S D 0.69, Skewness 1.40, Kurtosis 1.57, C I T C .69.
* Item 8 (Mobility): M 0.75, S D 0.88, Skewness 0.89, Kurtosis minus 0.18, C I T C .81.
* Item 9 (Capacity to think about other things): M 1.04, S D 0.89, Skewness 0.49, Kurtosis minus 0.55, C I T C .79.
* I I S total: M 8.08, S D 6.58, Skewness 0.63, Kurtosis minus 0.52.
The response distribution for each of the nine IIS items was examined using stacked bar plots to visualize the frequency of each response category (Figure 1).
Distribution of responses per IIS item.

Figure 1. Long description
A stacked bar chart with a vertical Y axis ranging from 0 to 100 in increments of 10 and a horizontal X axis labeled Item 1 through Item 9. A legend at the bottom defines four grayscale categories from darkest to lightest: Not at all, A little, Very much, and Fully.
Data values for each item from bottom to top:
* Item 1: Not at all 32.6, A little 32.6, Very much 26.2, Fully 8.5.
* Item 2: Not at all 24.8, A little 40.4, Very much 27, Fully 7.8.
* Item 3: Not at all 34, A little 32.6, Very much 25.5, Fully 7.8.
* Item 4: Not at all 41.8, A little 29.8, Very much 22.7, Fully 5.7.
* Item 5: Not at all 41.8, A little 36.2, Very much 18.4, Fully 3.5.
* Item 6: Not at all 50.4, A little 31.2, Very much 16.3, Fully 2.1.
* Item 7: Not at all 62.4, A little 29.1, Very much 7.1, Fully 1.4.
* Item 8: Not at all 49.6, A little 29.8, Very much 16.3, Fully 4.3.
* Item 9: Not at all 31.2, A little 40.4, Very much 22, Fully 6.4.
Item 7 shows the highest concentration of Not at all responses, while Item 2 and Item 9 show the highest concentration of A little responses.
Confirmatory Factor Analyses
The CFA model demonstrated an excellent fit to the data, confirming a one-factor structure with nine items. The one-factor model had 36 free parameters and met all preestablished criteria for an excellent fit: WRMR = .506; RMSEA = .054 (90% CI [0.000, 0.091); CFI = .998; TLI = .997. Factor loadings for the one-factor model are summarized in Figure 2.
Path diagram from the CFA.

Figure 2. Long description
A path diagram for a Confirmatory Factor Analysis. On the left, a central oval contains the latent variable Perceived Impact. Nine arrows originate from this oval and point toward a vertical column of rectangular boxes on the right. Each arrow is labeled with a standardized factor loading.
From top to bottom, the relationships are as follows
* Relationships with a loading of .88
* Work/Study with a loading of .80
* Recreational activities with a loading of .90
* Social obligations with a loading of .89
* Family obligations with a loading of .87
* Routine chores with a loading of .91
* Daily needs with a loading of .83
* Mobility with a loading of .90
* Thinking beyond illness with a loading of .86
Internal Consistency
The IIS demonstrated internal solid consistency as indicated by both omega (ω = .967, 95% CI [.955, .975]) and alpha (α = .94, 95% CI [.927, .955]) estimators. Additionally, all item-total corrected correlations exceeded .40 (ranging from .69 to .83), providing further evidence for the internal consistency of the measurement scores (Table 2).
Convergent and Discriminant Validity
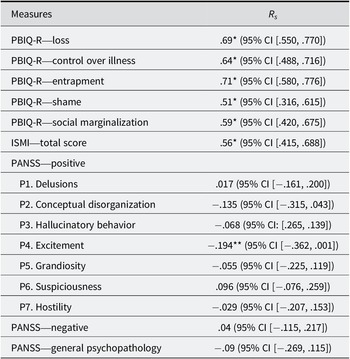
Table 3 shows Spearman’s rho correlations between the IIS scores and the other constructs. Specifically, the IIS scores showed significant moderate positive correlations with measures of internalized stigma and negative beliefs about the FEP (convergent validity), with large effect sizes (R s. = .51 to R s. = .69). On the other hand, no statistically significant correlations were observed between the IIS scores and psychopathology symptoms in the positive, negative, or general psychopathology subscales of the PANSS (discriminant validity), except for a statistically significant negative correlation with item 4 of the positive subscale (excitement; r = −.194 p = .024), which represents a small effect size yet remains consistent with the presence of discriminant validity. The sensitivity power analysis conducted with G*Power v3.1 software indicated that, with the available sample size (n = 141), the study achieved a power of .96 for the bivariate Spearman correlations, regarding convergent and discriminant validity tests. This suggests a high likelihood of detecting effects of at least medium effect size, supporting the robustness of the findings.
Spearman’s rho correlations between IIS scores and other measures of interest

Table 3. Long description
The table contains two columns: Measures and R sub s.
* P B I Q R dash loss: .69 asterisk with 95 percent C I [.550, .770].
* P B I Q R dash control over illness: .64 asterisk with 95 percent C I [.488, .716].
* P B I Q R dash entrapment: .71 asterisk with 95 percent C I [.580, .776].
* P B I Q R dash shame: .51 asterisk with 95 percent C I [.316, .615].
* P B I Q R dash social marginalization: .59 asterisk with 95 percent C I [.420, .675].
* I S M I dash total score: .56 asterisk with 95 percent C I [.415, .688].
* P A N S S dash positive sub-measures:
- P 1. Delusions: .017 with 95 percent C I [minus .161, .200].
- P 2. Conceptual disorganization: minus .135 with 95 percent C I [minus .315, .043].
- P 3. Hallucinatory behavior: minus .068 with 95 percent C I [.265, .139].
- P 4. Excitement: minus .194 double asterisk with 95 percent C I [minus .362, .001].
- P 5. Grandiosity: minus .055 with 95 percent C I [minus .225, .119].
- P 6. Suspiciousness: .096 with 95 percent C I [minus .076, .259].
- P 7. Hostility: minus .029 with 95 percent C I [minus .207, .153].
* P A N S S dash negative: .04 with 95 percent C I [minus .115, .217].
* P A N S S dash general psychopathology: minus .09 with 95 percent C I [minus .269, .115].
Note: Asterisk indicates p less than .001. Double asterisk indicates p less than or equal to .05. C I refers to bias-corrected and accelerated bootstrap confidence intervals.
Note: IIS = Impact of Illness Scale; ISMI = Internalized Stigma of Mental Illness Scale; PANSS = Positive and Negative Syndrome Scale; PBIQ-R = Personal Beliefs about Illness Questionnaire-Revised. All Spearman correlations are accompanied by 95% bias-corrected and accelerated (BCa) bootstrap confidence intervals (1,000 samples).
*p < .001; **p ≤ .05.
Temporal Stability
Data obtained from 91 participants who completed the IIS at the 1-year follow-up were used to test temporal stability. Data from the remaining participants are unavailable due to program dropouts (30%), refusal to complete the questionnaire (8%), relocation to another city (14%), severe clinical relapses preventing completion as judged by the professional (12%), and other reasons (36%) (failure to return the questionnaires, being unavailable due to travel at the time of completion, etc.).
ICC was used to assess 1-year test–retest reliability. The results indicated moderate test–retest reliability (ICC = .65, 95% CI [.51, .75]).
Discussion
This study aimed to examine the psychometric properties of the IIS in a sample of individuals diagnosed with FEP. The results demonstrated excellent psychometric properties for the IIS. Specifically, the CFA results support a single-factor solution, with excellent internal consistency reliability and coherent convergent and discriminant validity and good temporal stability.
It is worth noting that there are no validation studies available for the IIS scale other than the original study published (Klimidis et al., Reference Klimidis, Minas and Yamamoto2001). In line with the theoretical framework proposed in the original study, the CFA performed in this study clearly supported a single-factor structure for this scale. This unidimensional structure demonstrated excellent fit according to the preestablished criteria, obtaining values for the coefficients significantly higher than the minimum requirements for the validation of a psychometric questionnaire. Importantly, all factor loadings for the items in the IIS scale were above .80, and all item-total correlations were above .70. This provides a more robust statistical fit, thereby reinforcing the scale’s reliability (Bond & Fox, Reference Bond and Fox2015). The unidimensional structure of the scale in people with psychosis provides a clear understanding of its perceived impact on individuals’ lives and facilitates interpretation in both clinical and research contexts (Hattie, Reference Hattie1985). This simplicity enhances the effective use of assessment outcomes in psychosis (Kline, Reference Kline2023). In FEP, accurate and reliable assessment of one’s ability to engage in social and psychological activities is critical, as early intervention has the potential to improve the illness’s trajectory and prognosis (Álvarez-Jiménez et al., Reference Álvarez-Jiménez, Gleeson, Henry, Harrigan, Harris, Killackey, Bendall, Amminger, Yung, Herrman, Jackson and McGorry2012).
Evidence for construct validity was provided by a consistent positive correlation between IIS scores and measures of internalized stigma and negative beliefs about FEP. These measures focus on the patient’s perspective, similar to the IIS. The correlations are moderate but not perfect, suggesting that the information in both scales is not redundant. In contrast, regarding discriminant validity, there was a nonsignificant correlation between IIS scores and several PANSS scales, which provides a clinician’s assessment of the severity and range of psychotic symptoms. In our sample, the Positive Symptom subscale of the PANSS showed lower internal consistency than expected from previous studies. This appears to be influenced by the items Grandiosity (P5) and Hostility (P7), which were highly skewed, with most participants scoring at the lower end. Such restricted variability can reduce inter-item correlations and, consequently, reliability estimates. Therefore, this result likely reflects characteristics of our sample rather than a structural limitation of the PANSS instrument. We believe that the PANSS subscales overall provided robust evidence of discriminant validity, with even small or specific associations involving the Positive Symptom subscale further supporting this, although they should be interpreted with caution. A review of the healthcare literature suggests that patient satisfaction and treatment outcomes improve when patients’ perception of illness aligns with that of the clinician (Zhang et al., Reference Zhang, Day and Iorio2017). This is particularly important in mental health, especially in early psychosis interventions, where shared decision-making relies on a shared understanding of constructs, experiences, and language between patients and clinicians (Dress et al., Reference Dress, Frasso, Calkins, Curry, Kohler, Schmidt and Sisti2018). Patients’ engagement, adherence in their treatment, and satisfaction with care increase when their perceptions are taken into consideration in their treatment (Joosten et al., Reference Joosten, DeFuentes-Merillas, de Weert, Sensky, van der Staak and de Jong2008). In this context, the IIS represents a valuable tool for clinicians to assess how individuals with psychosis perceive its impact. It can also be used to corroborate whether the clinician’s perception aligns with that of their patient, by comparing it with the results of other widely used questionnaires on functioning, such as the Global Assessment of Functioning (GAF). On the other hand, it has been observed that there is often a discrepancy between the patient’s understanding of functioning and the clinician’s interpretation. The former tends to focus on aspects such as daily functioning or independence, whereas the latter encompasses a broader range of factors, including academic/occupational environments, social relationships, safety, and the burden of the symptoms (Dress et al., Reference Dress, Frasso, Calkins, Curry, Kohler, Schmidt and Sisti2018). The IIS would serve as a tool to delineate the functional impact of psychosis, without presupposing that the individual adheres to the same construct as the clinician. This approach would circumvent conceptual inconsistencies that could impede optimal therapeutic progress.
This study is the first to analyze the temporal stability of the IIS. Moderate test–retest reliability scores were observed, defined as the stability of the scale scores across repeated measures. This feature of the IIS is fundamental for psychological assessment, as it ensures that the scale is reliable in measuring the perceived impact of psychosis over time. This way, the scale provides stable and dependable results, crucial for both longitudinal research and clinical assessments. Furthermore, high test–retest reliability enables the identification of inconsistencies and potential sources of error, ensuring that any variations in scores are due to actual changes in the construct rather than extraneous factors (Kline, Reference Kline2000).
Several limitations of the present study have to be noted. First, the presence of higher positive psychotic symptoms or higher maniac symptomatology at the beginning of their treatment in the ITPCan program in individuals who did not complete the IIS at 3 months may represent a significant risk of sampling bias. Furthermore, the sample comprised solely individuals diagnosed with FEP. Further research is required to ascertain whether the data obtained in this study are comparable to those of individuals with chronic psychotic symptoms or multiple episodes of psychosis. The study by Chisholm et al. (Reference Chisholm, Freeman and Cooke2006) demonstrated that the impact of multiple episodes of psychosis exceeded that of the initial episode. Future studies should aim to replicate these findings using clinical samples with more severe symptomatology or untreated participants to enhance generalizability.
On the other hand, the sample is characterized by a high degree of heterogeneity in terms of the diagnoses. However, due to the low representation of some of the subgroups, it is not possible to test the factorial invariance and other psychometric properties for the different subgroups, since the minimum statistical power required to do so is not reached. Future research should examine the measurement invariance across various diagnosis subgroups within the psychosis spectrum. Additionally, the adaptation of the IIS was conducted using a back-translation procedure, which provides an initial step to ensure conceptual equivalence. While this method is widely used, it has been noted that back-translation alone may not fully capture the linguistic, cultural, and conceptual nuances required for a comprehensive cross-cultural adaptation (Muñiz et al., Reference Muñiz, Elosua and Hambleton2013). According to the International Test Commission (ITC) guidelines, further steps—such as independent forward translations, expert committee review, pilot testing, and empirical validation—are recommended to strengthen equivalence. Content validity was not directly assessed in this study. Future research should explore content validity through methods like focus groups with target participants and expert evaluations of item adequacy for the construct, building on our work to apply these rigorous standards and further enhance cross-cultural validity. Another relevant limitation concerns the limited theoretical development of the IIS. While our study aimed to test the factor structure originally proposed by Klimidis et al. (Reference Klimidis, Minas and Yamamoto2001) through a confirmatory approach, further research might be necessary to explore the dimensionality of the IIS using larger samples and exploratory methods to strengthen its conceptual foundations. Although the sample size was modest, WLSMV has demonstrated robust performance with sample sizes as low as 100–150, particularly in models with ordinal data, simple structure, and adequate factor loadings (Flora & Curran, Reference Flora and Curran2004; Rhemtulla et al., Reference Rhemtulla, Brosseau-Liard and Savalei2012). Finally, it is also noteworthy that the sample size for the IIS at 1 year was relatively small (n = 91). Therefore, longitudinal temporal stability must be interpreted cautiously.
Conclusion
Considering the significance of having a measurement for the impact of psychosis from the individual’s perspective, there is an unequivocal need to validate the tools available for both clinical and research purposes in the psychosis population in general and FEP in particular. Despite clinical practice guidelines emphasizing the significance of comprehensive assessment of functioning in individuals with FEP (Keepers et al., Reference Keepers, Fochtmann, Anzia, Benjamin, Lyness, Mojtabai, Servis, Walaszek, Buckley, Lenzenweger, Young, Degenhardt and Hong2020; National Collaborating Centre for Mental Health, 2014), no questionnaires have been proposed that could assess the subjective impact with satisfactory psychometric properties. This study bridges that gap, providing robust empirical evidence demonstrating the internal consistency and reliability, along with internal structure and convergent and discriminant validity of the IIS as an instrument for assessing the impact of FEP on various dimensions of an individual’s life. Employing a single standardized test like the IIS, which gauges the perceived impact of psychosis across a comprehensive range of vital areas, may represent a suitable and cost-effective approach for evaluating this essential dimension in clinical and research settings.
Data availability statement
This study’s design and its analysis were not preregistered. Data are available upon request from the authors. The data contain sensitive and confidential information that could compromise the privacy of the participants. Therefore, the data can be shared upon direct request and with the approval of the relevant ethics committee.
Acknowledgements
The authors wish to thank each and every professional who carries out their care work at ITPCan. Thanks to their invaluable work, the data for this study have been obtained. They would also like to express their gratitude to the generous individuals who have participated as patients in this project.
Author contribution
S.M.-G. played a lead role in conceptualization, writing of the original draft, and funding acquisition and an equal role in formal analysis, methodology, and writing of review and editing. L.A.M. played an equal role in formal analysis and a supporting role in the writing of review and editing. P.C.-A. and A.R.-T. played a supporting role in getting resources and in the writing of review and editing. R.P.-I. played a supporting role in getting resources, supervision, and writing of review and editing. M.C.C.-E. played an equal role in supervision and writing of review and editing and a supporting role in methodology, project administration, and supervision. C.G.-B. played a lead role in project administration and an equal role in conceptualization, methodology, supervision, and writing of review and editing. All authors critically revised the manuscript and approved the final version of the manuscript.
Funding statement
This work was supported by a grant from the Valdecilla Biomedical Research Institute (IDIVAL) (grant number MTVAL21/02) awarded to Sandra Martínez Gómez.
Competing interests
The authors declare none.
Appendix
Escala de Impacto de la Enfermedad
Nos gustaría tener una idea del grado en que los problemas o la enfermedad que has pasado ha afectado a tu vida en general en los últimos tres meses:
Spanish adaptation of the Impact of Illness Scale (IIS) for use in individuals with first-episode psychosis in Spain.

Table A1. Long description
A table with five columns. The first column contains nine numbered questions, and the subsequent four columns are Likert scale headers: Nada (Not at all), Un poco (A little), Mucho (A lot), and Completamente (Completely).
1. How much has your ability to engage in satisfying relationships (friends, coworkers, family) been reduced?
2. How much has your ability to study or work effectively been reduced?
3. How much has your ability to participate in pleasant leisure activities been reduced?
4. How much has your ability to adequately perform social obligations been reduced?
5. How much has your ability to meet family expectations and obligations been reduced?
6. How much has your ability to perform daily activities (shopping, housework, errands) been reduced?
7. How much has your ability to carry out your own daily needs (personal hygiene, grooming) been reduced?
8. How much has your mobility (walking, traveling, driving, using public transport) been reduced?
9. How much has your ability to attend to or think about things other than your problems or illness been reduced?



 Open access

