


Introduction
The global population has been aging for centuries. Since the Industrial Revolution, advancements in hygiene practices, including the widespread use of soap, along with advances in nutrition and medical practices, have contributed to a precipitous decline in mortality rates, particularly in rates of child mortality. Fewer infant deaths eventually led to a decline in the demand for childbirth, contributing to a subsequent decline in fertility rates. Fewer children allowed for increased investment per child, enhancing human capital and aggregate economic productivity over time. Economic prosperity, along with the increasing entry of women into the workforce and higher education, further increased the opportunity cost of bearing children, contributing to a decrease in fertility rates. This, and further increases in life expectancy, led to demographic aging.
For generations, this demographic transition provided a window of opportunity or “demographic dividend,” which was one of the key drivers of economic progress to which most advanced societies can attribute a significant portion of their relative success over the past two centuries (Bloom and Williamson Reference Bloom and Williamson1998; Feng et al. Reference Feng, Kugler and Zak2000; Howe and Jackson Reference Howe and Jackson2011). Initially, lower fertility led to shrinking dependency rates – the proportion of those below or above working age to the working age population – and an expansion in the relative size of the workforce. More people of working age meant a larger tax base and more potential government revenue per capita for those states with the capacity to put their young workers to productive use. This led to a virtuous cycle of lower fertility, increased human capital, economic prosperity, political stability, and further lowering of fertility (Feng et al. Reference Feng, Kugler and Zak2000).
However, around the turn of the century in many advanced societies, and with considerable regional variance in timing, this virtuous circle reversed course. It is not hyperbole to claim that rapid demographic aging constitutes a true crisis, “an exogenous event or ‘shock’ bearing down on all actors…that requires some kind of policy response” (Posner Reference Posner2015, p. 444). The economic and fiscal shocks related to demographic aging are well-known, particularly regarding the solvency and sustainability of public pension and health care systems (Van Nimwegen Reference Van Nimwegen2013). All cohorts within a society will eventually be affected by the threat of such insolvency. Further, there appears to be no demographic solutions to the crisis of rapid population aging. The three key components that determine demographic structure are fertility, longevity, and migration. To stabilize dependency rates, inward migration to most developed societies would need to be expanded by at least an order of magnitude. Such a massive expansion of immigration is a political nonstarter. Existing research suggests that policies aimed at increasing fertility are not particularly effective (Buchanan and Rotkirch Reference Buchanan and Rotkirch2013). Furthermore, fertility would need to rise to approximately 3.5 births per woman to stabilize old-age dependency rates to match past active-to-dependent population ratios.Footnote 1 The consequences for population size would be considerable. Thus, when considering that neither migration policy nor policies targeting fertility are likely to be sufficient in offsetting the fiscal effects of rapid demographic aging, retirement and pension reform are required.
What is the effect of retirement reform on political stability? Previous work has provided empirical evidence suggesting a direct impact of the inversion of age dependency trajectories on political stability across rich and middle-income societies (Stowell Reference Stowell2021). As dependency reverses course and the relative size of the labor force declines, political instability tends to ensue. The present research directly addresses retirement reform and its impact on political (in)stability. We argue that, while retirement and pension reform are fiscally necessary given the crisis of rapid demographic aging, they tend to lead to a significant increase in political instability.
We begin by providing a brief overview of the existing theoretical literature on demographic aging, retirement reform, and political instability. We then present the results of an empirical assessment of the relationship between key retirement reforms and political instability. Specifically, the empirical results suggest that efforts to increase the average retirement age, as well as efforts to boost labor force participation rates among older cohorts, are each associated with an increase in the level of political instability. We conclude with policy implications and suggestions regarding the least destabilizing routes to retirement reform in a democratic context.
Theoretical Background
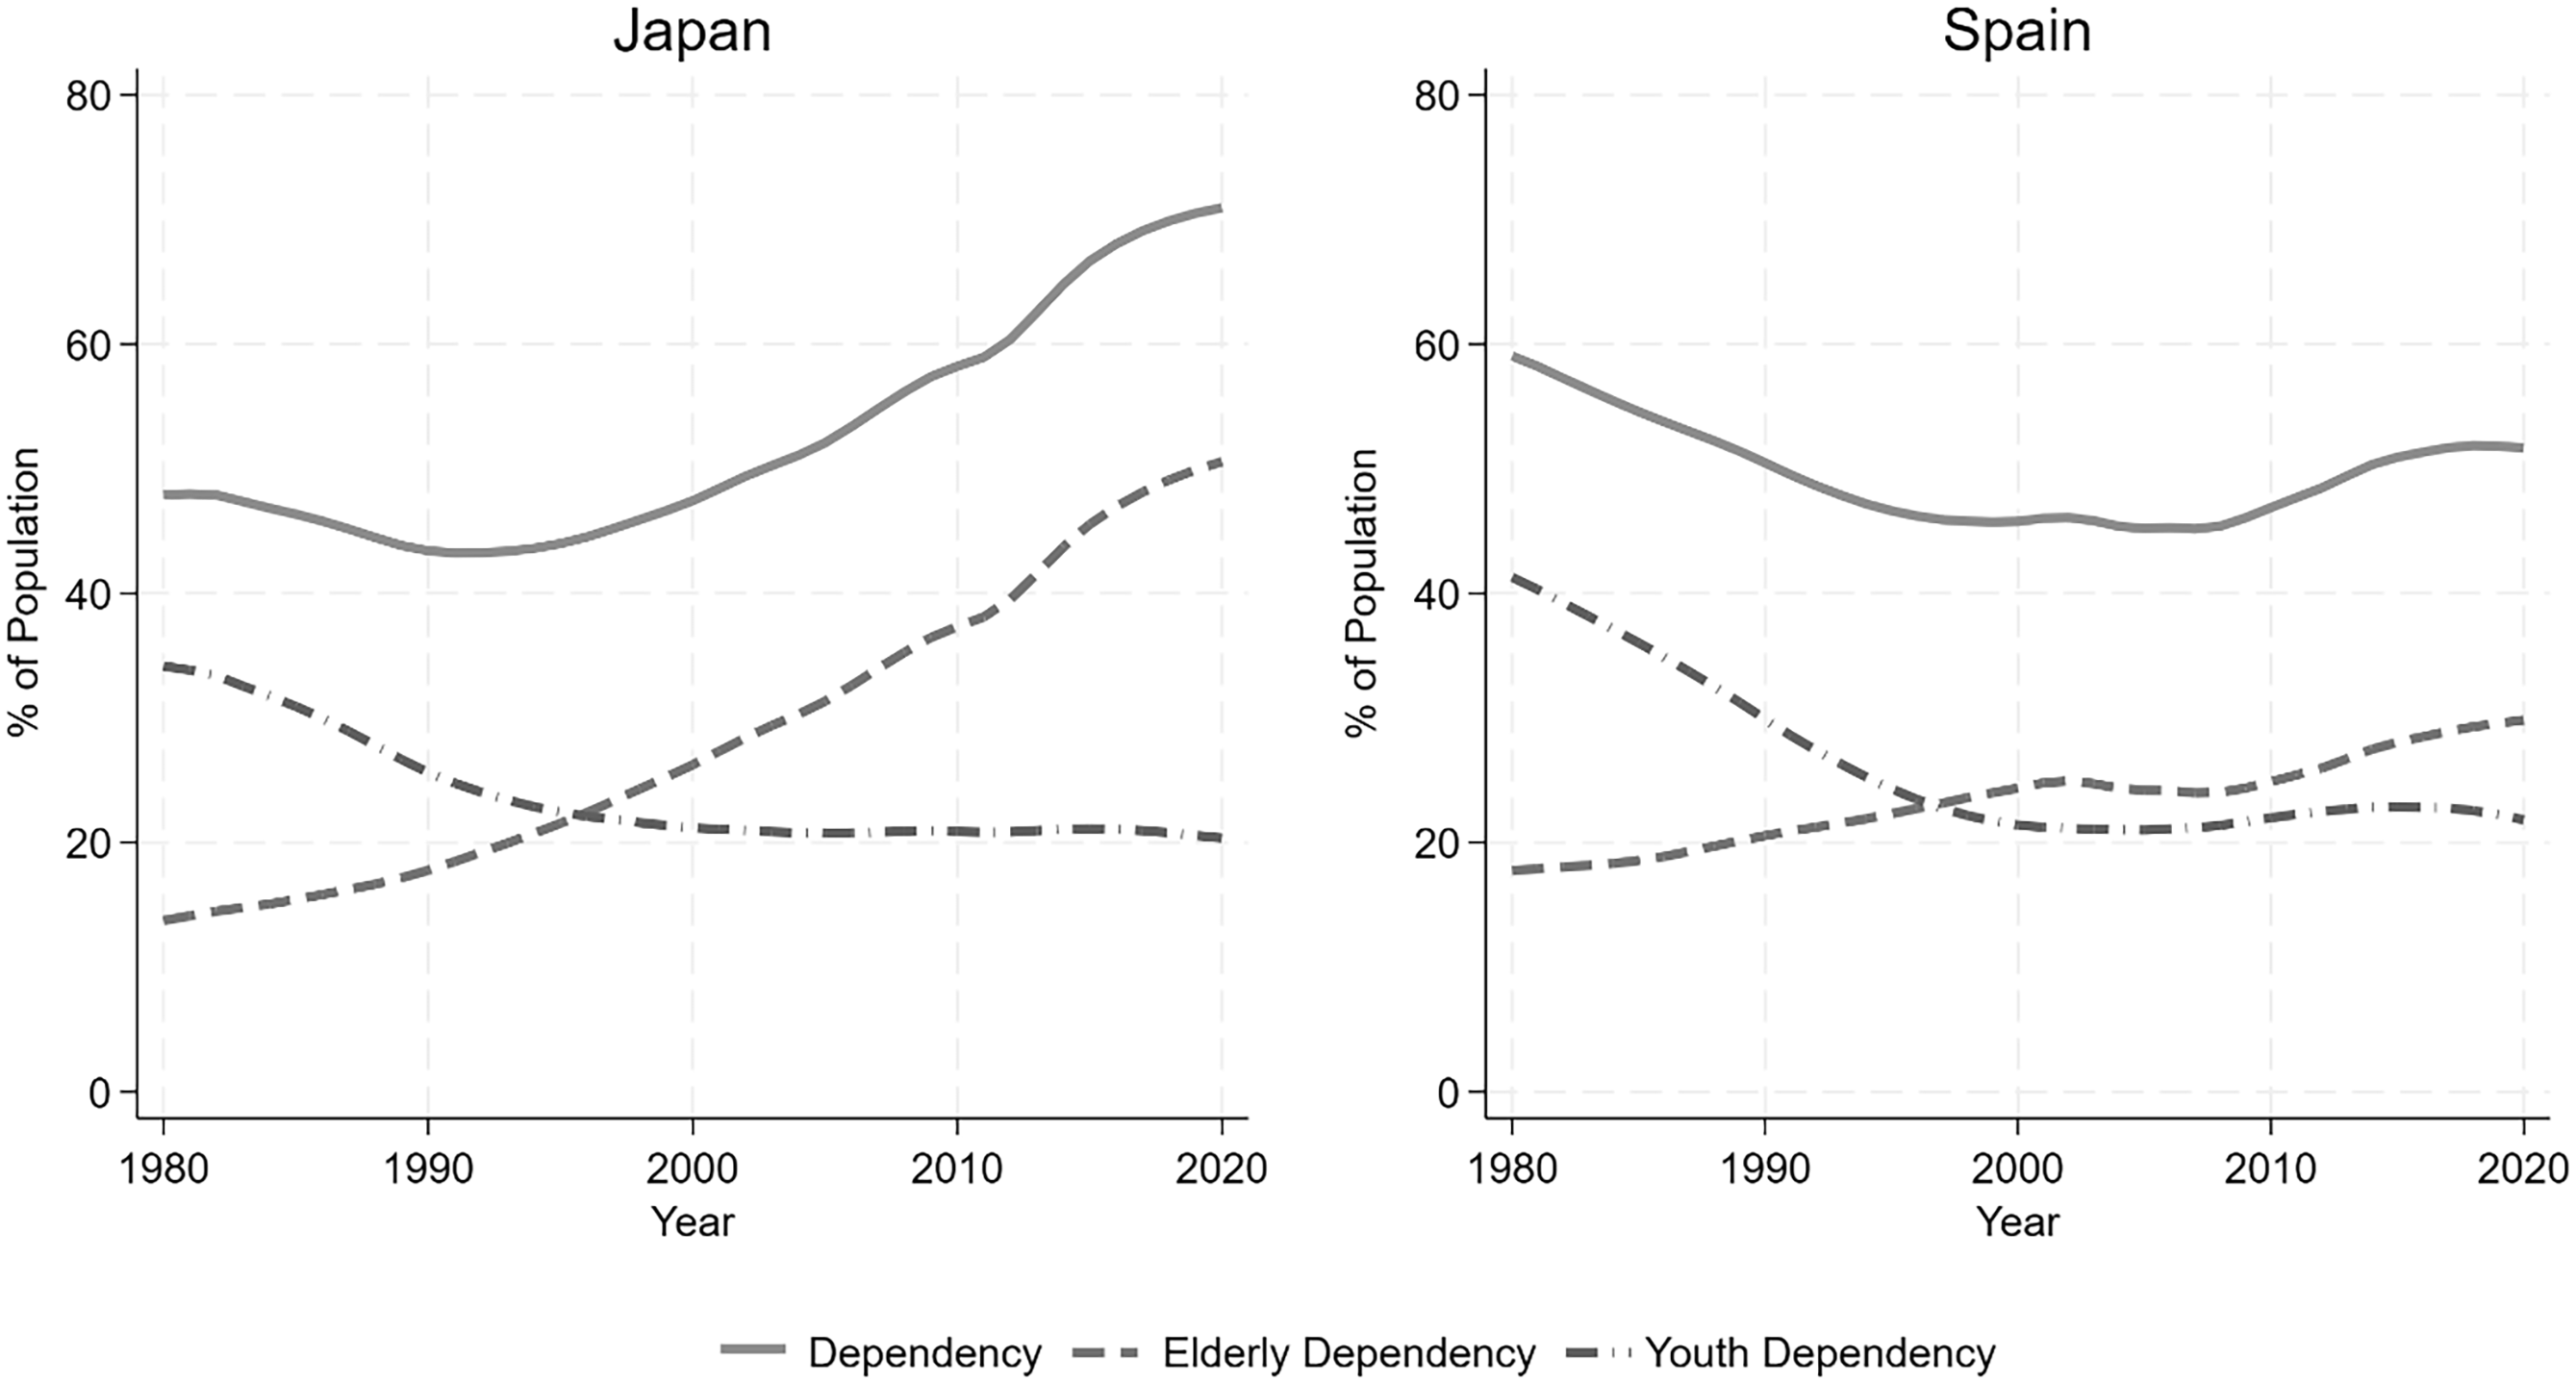
Societies are indeed aging, the proportion of the population that is aging out of the workforce is no longer replaced by the proportion of youth entering the workforce, causing dependency ratios to shrink all else being equal. Now, for the first time, we observe a sudden inversion and rapid increase in age dependency trajectories, driven by increasing longevity in the context of low and stable fertility – the Silver Tsunami (Stowell Reference Stowell2021). Figure 1 illustrates the variations in this now persistent process:

Figure 1 Long description
Panel A: The line graph for Japan shows the percentage of the population in different dependency categories from 1980 to 2020. The y-axis represents the percent of the population, ranging from 0 to 80 percent. The x-axis represents the year, ranging from 1980 to 2020. The graph includes three lines: a solid line for overall dependency, a dashed line for elderly dependency, and a dotted line for youth dependency. The overall dependency rate increases steadily from around 45 percent in 1980 to about 70 percent in 2020. The elderly dependency rate rises from around 10 percent in 1980 to about 30 percent in 2020, while the youth dependency rate decreases from around 40 percent in 1980 to about 20 percent in 2020. Panel B: The line graph for Spain shows the percentage of the population in different dependency categories from 1980 to 2020. The y-axis represents the percent of the population, ranging from 0 to 80 percent. The x-axis represents the year, ranging from 1980 to 2020. The graph includes three lines: a solid line for overall dependency, a dashed line for elderly dependency, and a dotted line for youth dependency. The overall dependency rate decreases slightly from around 55 percent in 1980 to about 50 percent in 2020. The elderly dependency rate increases from around 15 percent in 1980 to about 25 percent in 2020, while the youth dependency rate decreases from around 40 percent in 1980 to about 25 percent in 2020.
Japan was among the first countries to experience the reversal of its age dependency trajectory, while Spain followed decades behind. Further, Japan’s elderly dependent population has increased at an exceptionally fast rate, leading to a far more severe overall dependency rate and trajectory than that of Spain. This suggests that, while countries vary considerably in terms of the timing and pace of the demographic crisis, the underlying dynamics of the Silver Tsunami are consistent.
While the first comprehensive social security program was introduced in 1889 in Germany, such programs spread widely throughout the developed world only after World War II (Skocpol Reference Skocpol1992). There are myriad differences between states regarding policy specifics, but the literature tends to distinguish between them around several broad idealized categories. The first major distinction is between funded and pay-as-you-go (PAYG) programs. With funded programs, individual workers are compelled to save while working and then deplete their own capital upon retirement. In contrast, in a PAYG pension system, current pensions are paid out of current contributions. In practice, many countries have a complex mix of the two, but most of the developed world tends toward the PAYG system (Aysan and Beaujot Reference Aysan and Beaujot2009).
Retirement systems, like all welfare regimes, vary in terms of who assumes the primary responsibility for funding them – the market, the state, or the family. Aysan and Beaujot (Reference Aysan and Beaujot2009) suggest that the extent to which each of these entities assumes responsibility for the retirement system has a significant impact on the types of broad retirement reforms that tend to pass. They distinguish between three broad types of retirement reforms: recommodification, cost containment, and recalibration. Taking these two factors together, they delineate four different broad “welfare regimes.” Liberal regimes, exemplified by the US, Canada, Ireland, and the United Kingdom, tend to rely on the market to fund retirement, and therefore, the most common reforms involve recommodification, increasing the role of the market and taking funding responsibilities out of the hands of the government and family. In contrast, social democratic welfare regimes – those found in Norway, Sweden, Finland, and Denmark – tend to place responsibility on the state and are most likely to enact cost-containment reforms through incentivizing labor force participation, followed by recalibration policies such as changes to contributions and threshold ages for retirement benefits. Continental welfare regimes, such as those in Germany, France, and the Netherlands, are characterized by the state, the family, and the market each playing moderate roles. These regimes tend to emphasize cost containment through adjustments to contribution rates and benefits, as well as the number of highest-earning years used to calculate pension benefits. Finally, they highlight a unique Southern European welfare regime, seen in countries like Greece, Italy, and Spain, where the family remains the dominant role in elder care (Coleman Reference Coleman2006). These countries have the oldest populations in Europe and have the youngest pension eligibility ages – a problematic combination.Footnote 2
Alternatively, retirement reform can be categorized into three broad areas: increasing average contributions, reducing average benefits, and efforts to increase the relative size of the workforce (Wolf and Amirkhanyan Reference Wolf and Amirkhanyan2010). Increasing contributions and cutting benefits are particularly unpopular and difficult to enact legislatively. Policy efforts to increase the relative size of the workforce can come in many shapes. Two key types of reform, which will be the focus of the forthcoming empirical assessment, are efforts to increase labor force participation and raise the effective retirement age.
Other reforms may be indirectly related to retirement policies, such as increasing female participation through family-friendly employment policies, reducing incentives for extended tertiary education, or expanding immigration. We argue in the next section that the demographic trends are so severe that merely incentivizing labor force participation will be insufficient to maintain a stable workforce and our analysis suggests that increasing labor force participation rates among older economically active cohorts is associated with an increase in politically destabilizing events such as protests, strikes, riots, and anti-government demonstrations.
As an alternative or complement to efforts focused on labor force participation, increasing contributions, or reducing benefits, governments can enact policies aimed at increasing the average effective age of retirement or the “retirement age threshold.” Adapting the threshold age of retirement to demographic trends so that the ratio of active to retired populations remains constant despite a dynamic demographic environment is argued to be the most economically efficient response to the crisis of rapid demographic aging (De Santis Reference De Santis2003). The US provides an example of what this might look like.
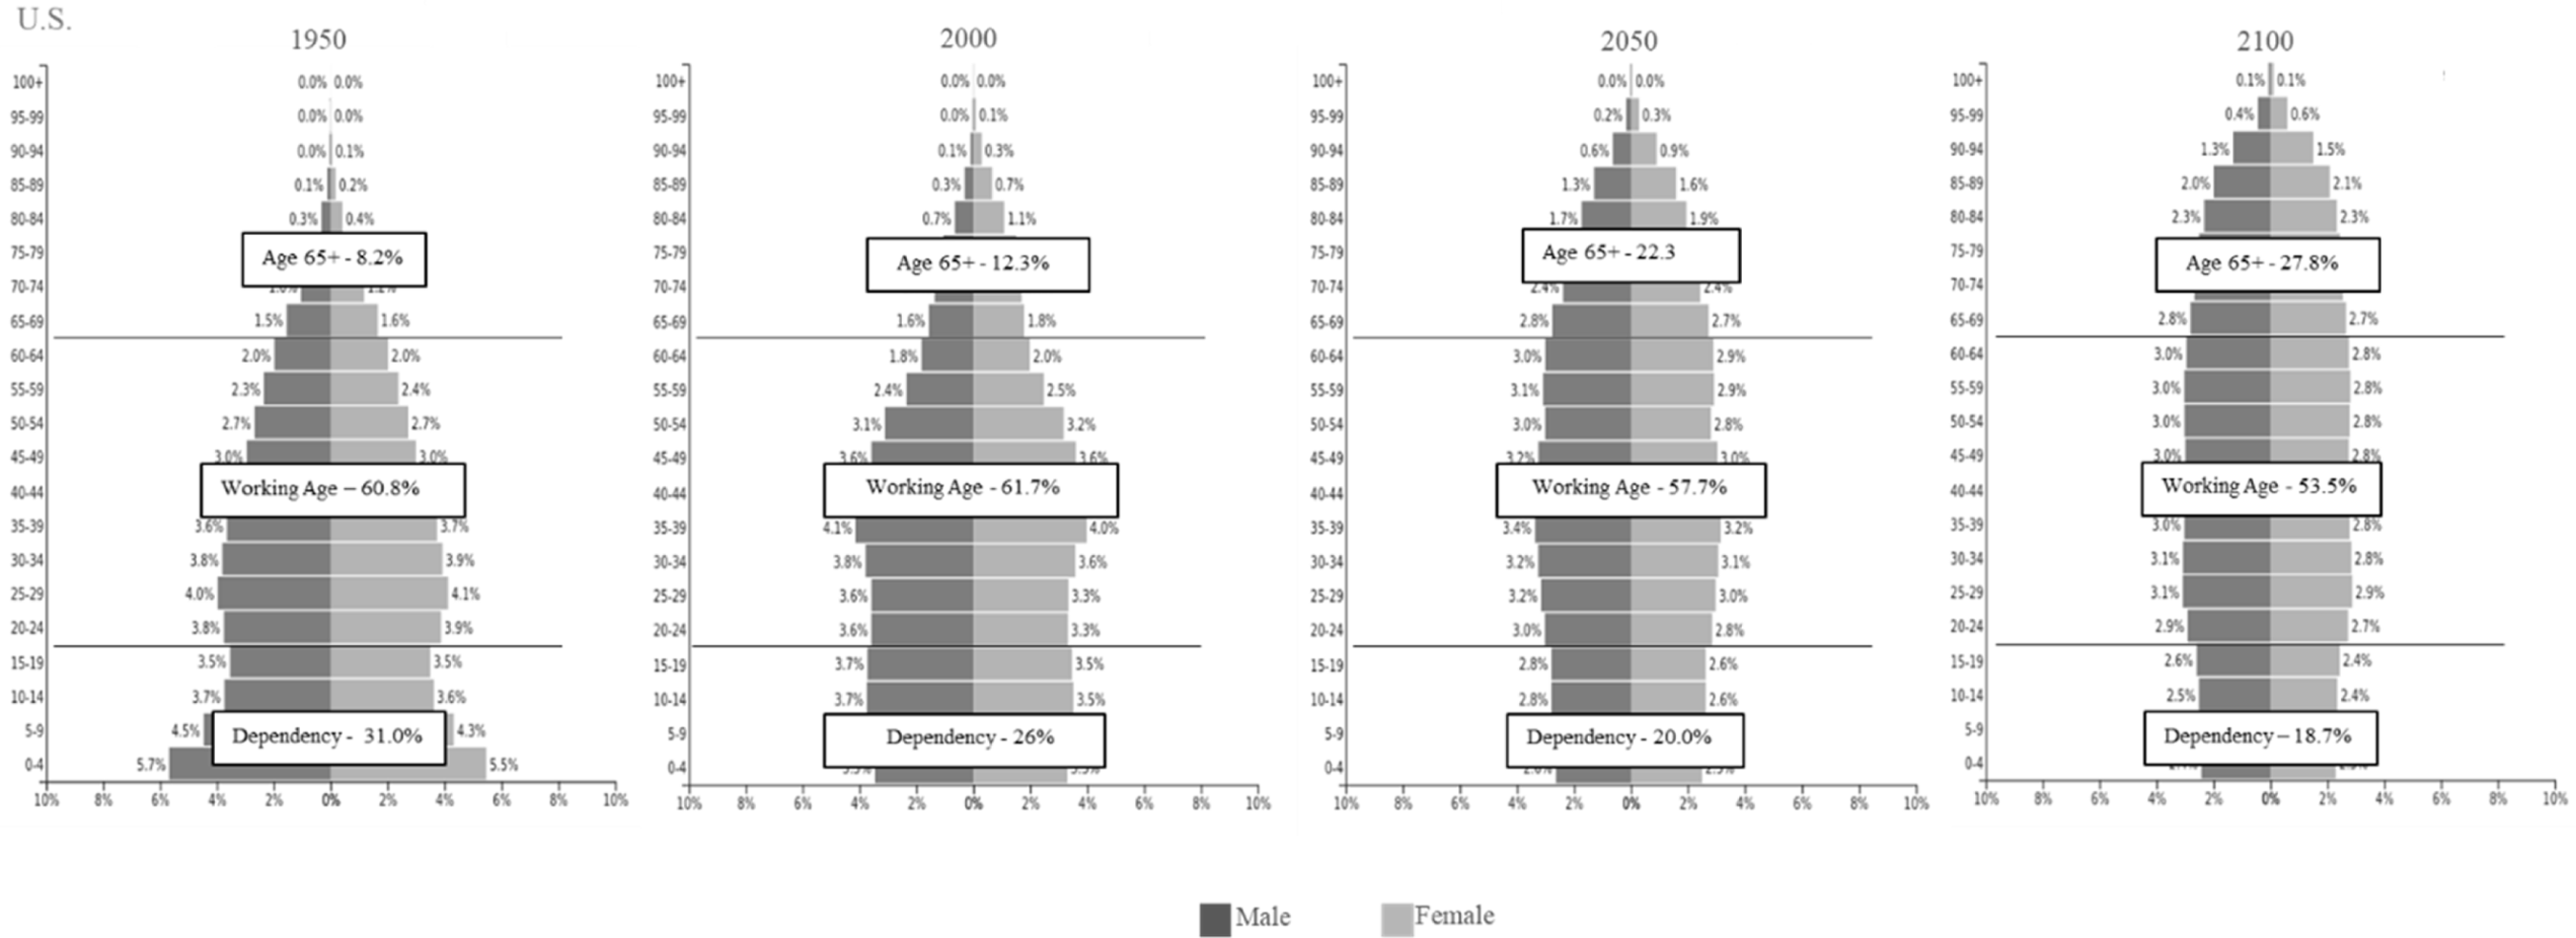
When the Social Security Act was signed into law in 1935, an American could receive full social security benefits at age 65. At that time, the life expectancy at birth in the US was 61.7 years. Assuming the average young adult entered the labor force at age 18, approximately 60 percent of the US population was economically active, there were 7.5 economically active Americans for every person aged 65 and older, and total age dependency – the population below 18 and above 64 as a proportion of the working age populationFootnote 3 – was 0.67 (Figure 2). Between then and 2000, demographic dynamics were sufficient to maintain a dependency ratio of 0.67 or lower, though retirees made up an expanding share of the dependent population. Today, despite the US life expectancy at birth having risen to 76 years – fifteen years older than at the time of the Social Security Act – the age for full social security benefits has only increased to 67. Further, given the increases in enrollment in higher education, the age at which the average American enters the workforce has undoubtedly increased. Looking ahead to the end of the century, to maintain a sub-0.67 dependency ratio, the US would need to push its age for maximum social security benefits to at least 74 years, likely more, given the expected dynamic increase in the average age of entry into the workforce.
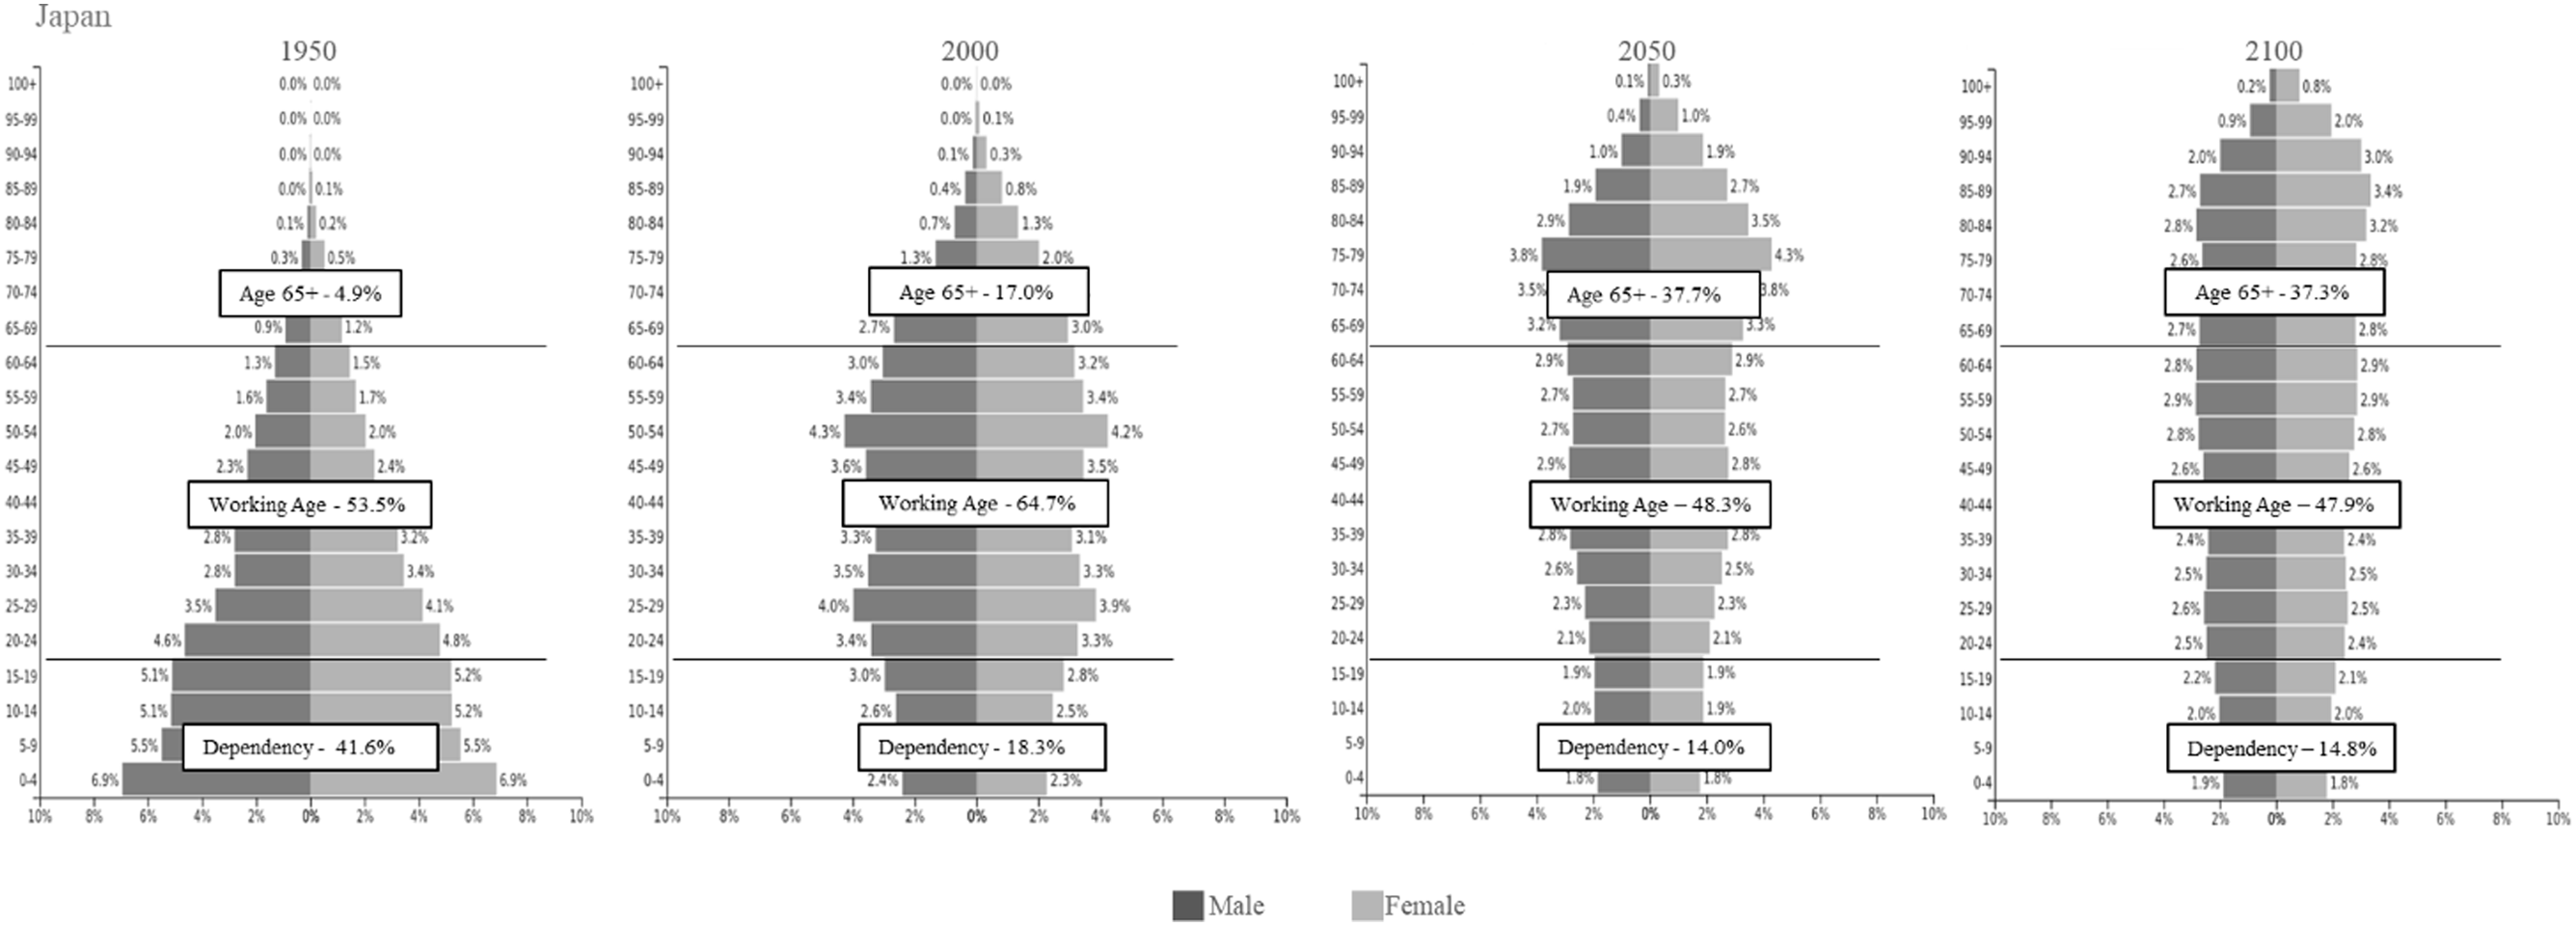
Keep in mind that, among rich countries, the US is at a significant demographic advantage due in part to its historically robust immigration policies. Japan, on the other end of the spectrum, would have to increase its retirement age to over 80 years to have a 60 percent active population, according to UN estimates, assuming the threshold for entering the workforce remains constant at 18 (Figure 3).

Demographic aging, retirement reform, and political instability
It has long been argued that demographic aging would eventually be politically destabilizing (Haas Reference Haas2007; Howe and Jackson Reference Howe and Jackson2011). Stowell (Reference Stowell2021) suggests an underlying causal mechanism stemming from the inversion and rapid increase of total age dependency and argues that this causes a double economic impact on governments. First, the contracting labor force leads to year-over-year declines in per capita government revenue. At the same time, the expanding elderly proportion of the population places increasing demands on public services such as elder care, healthcare, and retirement benefits. As this double economic impact persists, governments tend to cut other core public programs, initiating, for the first time, a net intergenerational transfer of public and private resources from younger cohorts to older generations (Wolf and Amirkhanyan Reference Wolf and Amirkhanyan2010). This reversal of intergenerational transfers reduces human capital, which has been shown to slow economic growth. Further, entrepreneurship and innovation tend to vary inversely with age. Thus, societal aging has been shown to dramatically reduce entrepreneurship, thereby hindering economic growth (Deal and Szonyi Reference Deal and Szonyi2019). A third route from societal aging to slowed growth may occur when elderly generations spend down their savings to fund their golden years, reducing aggregate savings rates and potentially exacerbating economic stagnation (Sheen Reference Sheen2013). Thus, a multipronged theoretical route exists from demographic aging to slowed economic growth, which has been argued to be a key driver of political instability (Feng et al. Reference Feng, Kugler and Zak2000).
Demographic aging may therefore tend to contribute to political instability by reducing per capita government revenue, increasing demands for costly public services, reducing savings and investment, forcing a net intergenerational transfer of resources away from younger cohorts and programs that generate human capital, and hampering economic growth. Retirement reform in one form or another is therefore necessary. However, the literature argues that reforms such as increasing taxation and intergenerational transfers carry the potential to undermine regime legitimacy. Among OECD countries, structural pension reforms aimed at long-run sustainability often include long implementation lags, which can paradoxically reduce labor force participation among older workers, especially when trust in government is low. By contrast, immediate retrenchments tend to keep those near retirement in the workforce longer (Bi and Zubairy Reference Bi and Zubairy2023). De Santis (Reference De Santis2003) argues that when political and economic conditions vary unexpectedly, promises of long-term financial arrangements can be broken. While this is acceptable within certain limits, beyond those limits, “expectations will be frustrated, the confidence of the general public will be shaken, and the whole system may crumble, with potentially dire consequences” (De Santis Reference De Santis2003, p. 594). Writing on China, Deal and Szonyi (Reference Deal and Szonyi2019) argue that the Chinese people may riot “if demographic factors produce a prolonged economic slowdown that undermines regime legitimacy” (Deal and Szonyi Reference Deal and Szonyi2019, p. 131). In sum, demographic aging and the most common policies aimed at addressing it each risk undermining the legitimacy of political institutions, a crucial factor in civil unrest and political instability (Treisman Reference Treisman2007). Evidently, we can observe that pension reforms have been mainly driven by demographic aging, with governments reversing early retirement pathways and raising statutory pension ages to sustain PAYG systems. This highlights how the pressures of an aging population tend to force a shift toward longer working lives and active aging policies, making retirement reform central to economic and social sustainability (Ebbinghaus and Möhring Reference Ebbinghaus and Möhring2022)
Furthermore, it is argued that pension reforms often overlook intergenerational social justice and contribute to intergenerational inequalities. Aysan and Beaujot (Reference Aysan and Beaujot2009) argue that the most significant impact of retirement reform is on younger generations, triggering conflict between workers and retirees. Gurr (Reference Gurr1970) argues that people are more likely to rebel when they perceive a gap between their expectations and their actual living conditions, or feel that they are not receiving the benefits to which they are entitled. This dynamic can be observed in the previous demographic transition, known as the youth bulge, where disproportionate numbers of young people enter the labor force and compete for limited resources, driving insurgency in states that lack the capacity to utilize this cohort productively (Urdal Reference Urdal2006). In a sense, the crisis of rapid demographic aging is reminiscent of the youth bulge, a situation in which an expanding elderly cohort comes into competition with younger generations for resources, driving civil dissent.
We therefore argue that, in addition to the direct economic impact of demographic aging on economic stagnation, policies that seek to address the crisis also risk contributing to political instability by undermining institutional legitimacy, creating intergenerational inequality, and fostering perceptions of relative deprivation, driving a second “clash of generations.” The following section outlines the research design aimed at examining the relationship between retirement reform and political instability in the context of rapid demographic aging.
Research design
Based on the literature outlined above, We argue that reforms to the retirement system are necessary given the fiscal pressure that demographic aging is beginning to place on the governments of wealthy and middle-income countries, but that the most common sets of policies – those aimed at increasing the retirement age threshold and those aimed at increasing labor force participation among older cohorts – are politically destabilizing. To bolster that argument, we test the following hypotheses:
H1: Increases in the average effective age of retirement contribute to an increase in the level of political instability.
H2: Increases in the labor force participation rate among older cohorts contribute to an increase in the level of political instability.
To test these hypotheses, we employ a Panel Fixed Effects regression model to estimate the impact of retirement age and labor force participation rate on political instability. Fixed effects estimation is preferred in this context because it controls unobserved, time-invariant heterogeneity in the panel data set between countries. It enables a more precise identification of within- and across-country changes over time, net of persistent country-level traits (Hsiao Reference Hsiao2022; Wooldridge, Reference Wooldridge2010). The method is suitable for capturing the changes in instability elasticity in response to changes in retirement age and elderly labor force participation rates. Robust standard errors clustered at the country level were used to account for potential serial correlation and heteroskedasticity (Cameron and Trivedi Reference Cameron and Trivedi2005; Hoechle Reference Hoechle2007; Wooldridge Reference Wooldridge2010). The unit of analysis for this research is the country-year. The data includes 41 countries from 1980 through 2020. This dataset includes all countries facing an emerging aging population problem – a silver tsunami. The sample countries are listed in Table 1.
List of countries
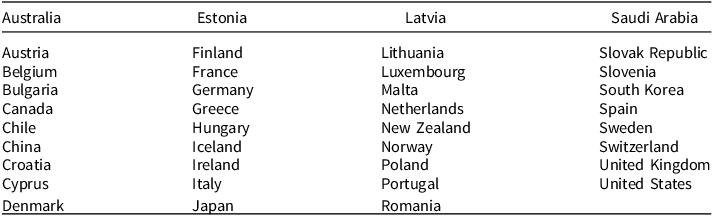
Table 1 Long description
The table lists countries facing aging population problems. It has four columns: Australia, Estonia, Latvia, and Saudi Arabia. Each column contains a list of countries. Row 1: Austria, Finland, Lithuania, Slovak Republic. Row 2: Belgium, France, Luxembourg, Slovenia. Row 3: Bulgaria, Germany, Malta, South Korea. Row 4: Canada, Greece, Netherlands, Spain. Row 5: Chile, Hungary, New Zealand, Sweden. Row 6: China, Iceland, Norway, Switzerland. Row 7: Croatia, Ireland, Poland, United Kingdom. Row 8: Cyprus, Italy, Portugal, United States. Row 9: Denmark, Japan, Romania.
Data specifications
The outcome of interest in this analysis is political instability. We argue that when the expansion of the elderly dependent population occurs at a rate faster than the entry of young people into the workforce, instability rises due to frustration among both the active and retiring cohorts. It is the inversion and sudden increase in overall age dependency rates that drives this instability. To measure political instability, we use the weighted conflict index (WCI) from the Cross-national Time Series database (CNTS 2022). The WCI is a widely used composite measure that includes anti-government demonstrations, riots, general strikes, assassinations, government crises, purges, as well as guerrilla warfare and revolutions (Abdollahian et al. Reference Abdollahian, Nicholson, Nickens and Baranick2009; Torgler and Frey Reference Torgler and Frey2013). Our analysis concentrates on the annual increase in political instability resulting from reforms to the retirement age and labor force participation among the aging population. Urdal (Reference Urdal2006) demonstrates that during the “youth bulge” phase of the demographic transition, in rapidly growing societies, persistent unemployment among young entrants to the workforce can lead to revolutionary activities and guerrilla actions. However, when employment is abundant, societies experience a window of opportunity that fosters rapid growth, as in the case of China over the past several decades. The instability studied here follows the expansion of the aging cohort, which appears later in the demographic transition, after low fertility and increased longevity create a “silver tsunami” that leads to persistent but generally low-level instability, short of guerrilla warfare or revolution. Democracies tend to be more sensitive to minor instability than authoritarian regimes, as electoral participation is generally more prevalent among the elderly than among the young. To reflect this reality, we recalculated the WCI after excluding guerrilla and revolutionary actions, as these activities are typically reserved for the young. This reduces the sample of countries to those that have an aging population of 11 percent or more. WCI exhibits a high concentration of zeros, resulting in a highly skewed distribution. To address skewness and retain zero observations, we apply a log transformation using log (WCI + 1), a standard approach for continuous variables that allows us to include zeros and mitigate skewness (Benoit Reference Benoit2011; Doane and Seward Reference Doane and Seward2011; Feng et al. Reference Feng, Wang, Lu, Tu and Wu2014). The log transformation effectively measures the elasticity of political instability, reflects a rate of change, and captures more variance of the political instability variable.
Based on the hypotheses, this analysis utilizes two key explanatory variables. The first, average effective retirement age, measures “the weighted average of (net) withdrawals from the labor market at different ages over a 5-year period for workers initially aged 40 and over” (OECD 2020). Estimates are based primarily on national labor force surveys. As there are many unique policies geared toward compelling workers to postpone retirement, from adjusting the threshold age to disincentivizing early retirement, to austerity with respect to pension benefits, the average effective retirement age should capture such policy measures in a relatively standard way across countries.
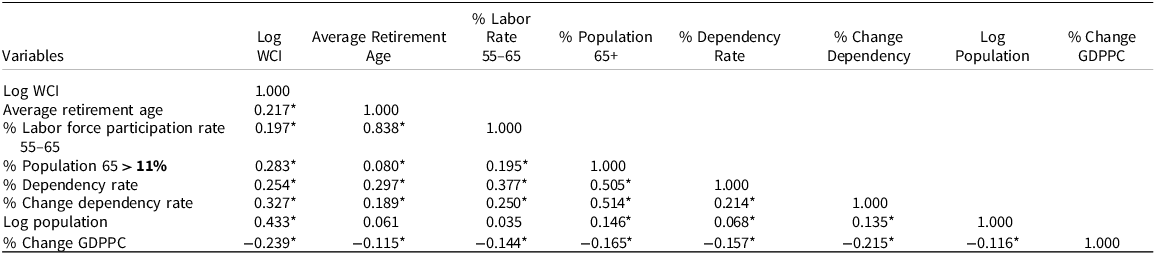
The second hypothesis approaches retirement reform from a somewhat different direction. To capture efforts to compel labor force participation among older economically active cohorts, this analysis uses the labor force participation rate for the age group 55 to 64 (International Labor Organization 2022). This variable measures the proportion of the population aged 55 to 64 that is either employed or unemployed and seeking work. As expected, this measure has a moderate to high correlation with the average effective retirement age (Table 2). Therefore, we include both but in separate models to fully capture policies geared toward improving productivity and competitiveness among older workers. For example, in South Korea, the average effective retirement age declined from 69 to 65 years between 2017 and 2020 while labor force participation rates among workers aged 55 to 64 remained effectively constant, demonstrating that the two measures capture different sets of policy incentives.
Correlation matrix

Table 2 Long description
The table presents a correlation matrix of various economic and demographic variables. It includes eight variables: Log WCI, Average Retirement Age, % Labor Force Participation Rate 55-65, % Population 65+, % Dependency Rate, % Change Dependency Rate, Log Population, and % Change GDPPC. The table has eight rows and eight columns, with each cell showing the correlation coefficient between the variables. Row 1: Log WCI, 1.000, 0.217*, 0.197*, 0.283*, 0.254*, 0.327*, 0.433*, -0.239*. Row 2: Average Retirement Age, 0.217*, 1.000, 0.838*, 0.080*, 0.297*, 0.189*, 0.061, -0.115*. Row 3: % Labor Force Participation Rate 55-65, 0.197*, 0.838*, 1.000, 0.195*, 0.377*, 0.250*, 0.035, -0.144*. Row 4: % Population 65+, 0.283*, 0.080*, 0.195*, 1.000, 0.505*, 0.514*, 0.146*, -0.165*. Row 5: % Dependency Rate, 0.254*, 0.297*, 0.377*, 0.505*, 1.000, 0.214*, 0.068*, -0.157*. Row 6: % Change Dependency Rate, 0.327*, 0.189*, 0.250*, 0.514*, 0.214*, 1.000, 0.135*, -0.215*. Row 7: Log Population, 0.433*, 0.061, 0.035, 0.146*, 0.068*, 0.135*, 1.000, -0.116*. Row 8: % Change GDPPC, -0.239*, -0.115*, -0.144*, -0.165*, -0.157*, -0.215*, -0.116*, 1.000.
*** p < 0.01, ** p < 0.05,*p < 0.1.
Countries vary considerably in terms of the timing and severity of their respective silver tsunami. To control demographic structure and age dependency trajectory, the models include age dependency, the rate of change in age dependency, and the percentage of the population aged 65+. Age dependency is defined as “the ratio of dependents – people younger than 15 or older than 64 – to the working-age population” (World Bank 2020). We also include its annual dependency rate of change to capture the inversion and rapid increase in age dependency previously argued to be a significant driver of age-related political instability. The level of dependency and its rate of change should thus be positively associated with political instability.
The models include three additional control variables commonly understood to predict political instability: WCI lagged by one year, population size, and GDP per capita growth rate. All else being equal, the inclusion of the lagged (t−1) WCI accounts for the inherent temporal dependence in the WCI index, capturing its tendency to evolve incrementally rather than in abrupt shifts. Population size is included because larger populations are expected to increase the opportunity for political dissent across the country. The GDP per capita growth rate is expected to be inversely related to political instability; wealthier populations and those experiencing more economic growth are likely to have fewer grievances against their government, all else being equal. GDP per capita growth rate and population are log-transformed to correct for positive skew. Detailed descriptive statistics are presented in Table 3.
Summary statistics
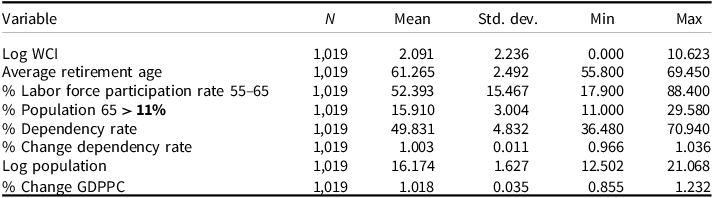
Table 3 Long description
The table presents summary statistics for several variables related to political instability. It includes 1019 entries for each variable. The variables listed are Log WCI, Average retirement age, % Labor force participation rate 55-65, % Population 65 > 11%, % Dependency rate, % Change dependency rate, Log population, and % Change GDPPC. Each row provides the number of observations (N), mean, standard deviation (Std. dev.), minimum (Min), and maximum (Max) values for each variable. For example, the Log WCI has a mean of 2.091, a standard deviation of 2.236, a minimum value of 0.000, and a maximum value of 10.623. The table provides a comprehensive overview of the statistical distribution of these variables.
Analysis and results
Table 4 contains the results of four regressions. The baseline model (1) includes the first theoretical variable, the average retirement age, which is central to our concerns. Model (2) contains the labor force participation rate for ages 55 to 64 that reflects government efforts to maximize the utilization of the workforce. Model (3) tests the first hypothesis (H1) regarding the effect of the average effective retirement age, controlling for all demographic variables discussed above. Model (4) tests the second hypothesis (H2) regarding labor force participation rate, along with the demographic control variables.
Panel regression with country fixed effects
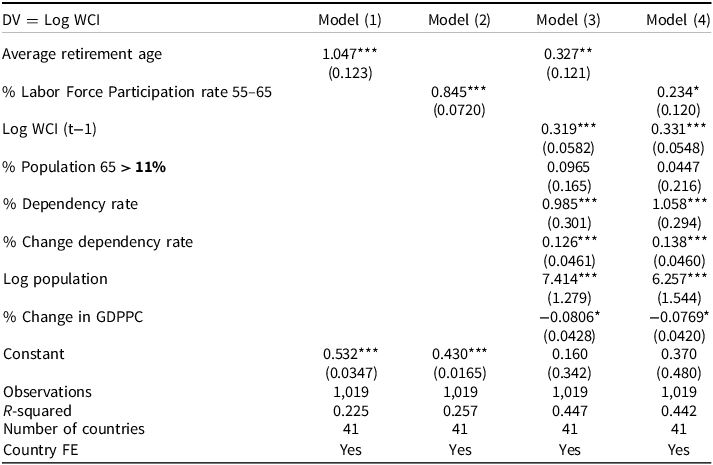
Table 4 Long description
The table presents the results of four regression models with country fixed effects. It has 12 rows and 5 columns. The columns are labeled as Model (1), Model (2), Model (3), and Model (4). The rows are labeled with different variables and their respective coefficients and standard errors. The variables include Average retirement age, % Labor Force Participation rate 55-65, Log WCI (t-1), % Population 65 > 11%, % Dependency rate, % Change dependency rate, Log population, % Change in GDPPC, and Constant. Each model shows the coefficients and standard errors for these variables. The table also includes the number of observations, R-squared values, and the number of countries used in the analysis.
Robust standard errors in parentheses. ***p < 0.01, **p < 0.05, *p < 0.1.
The four regression models offer strong support for each hypothesis assessing the influence of demographic variables on political instability. The dependent variable (log WCI) allows direct interpretation of the coefficients as percentage changes in intensity. In models (1) and (2), both average retirement age and labor force participation among adults aged 55–64 have a significant, positive association with WCI (β = 1.047 and β = 0.845, respectively), suggesting that higher late-life economic engagement correlates with greater conflict participation. When control variables are introduced in models (3) and (4), the magnitude of associations between the intensity of conflict and average retirement age and elderly labor force participation diminishes (β = 0.327 and β = 0.234, respectively), although both remain statistically significant. This suggests that the influence of our key variables is partially mediated by factors such as the elderly dependency ratio and macroeconomic conditions.
Specifically, without demographic controls, a one-year increase in average retirement age is associated with 104 percent rather than the more realistic 33 percent increase in the level of conflict severity once demographic controls are added. Likewise, a one-unit increase in the labor force participation rate of the population aged 55–64 alone corresponds to an 84 percent increase, rather than the more realistic 23 percent increase, in the level of political instability, holding all else constant. We surmise that the realistic effects of an increase in the average effective age of retirement and attempts to increase labor force participation substantively raise the level of instability in relatively stable advanced societies that are affected by rapid aging.Footnote 4
A brief discussion of the effects of control variables is warranted. The inclusion of lagged (t−1) log WCI is both statistically significant and substantively meaningful, with coefficients around 0.30. This suggests that an increase in political instability in the previous year triggers a 30 percent increase in instability in the following year. It highlights the substantial temporal effects once instability is generated. The filter used to reflect the elderly dependent population share of the total population (Pop 65 > 11%) is statistically insignificant, suggesting that demographic aging alone does not lead to conflict escalation. Conversely, both the dependency ratio and its rate of change exhibit a strong and significant positive relationship with the level of conflict intensity. These results suggest that an increasing demographic burden – especially when it accelerates – strains governance and economic resources, thereby increasing the likelihood of conflict. As anticipated, an increase in the total population (log) is associated with a scale-related increase in instability. Finally, GDP per capita growth is negatively associated with conflict at the 10 percent level, suggesting that economic expansion tends to play a modest mitigating role. Indeed, wealthier populations and those experiencing more economic growth are likely to have fewer grievances against their government. aligned with the theoretical focus of our study: understanding the severity and the rate of changes at the country-level over time.
Overall, these findings suggest that the roots of political instability lie less in demographic thresholds such as aging per se, and more in the compounded pressure of shifting dependency structures and slow institutional adjustments in response to demographic and economic changes. Temporal continuity and demographic burden, rather than aging alone, appear to be the key drivers of escalating political instability.
The silver tsunami retirement challenge
Comparing the substantive effects of the two explanatory variables suggests that, all else being equal, increasing the average effective retirement age may be more politically destabilizing than increasing labor force participation among individuals aged 55 to 64. This suggests that policy efforts to compel the postponement of retirement are likely more politically destabilizing than efforts to increase labor force participation among older economically active cohorts.
Our results support previous research regarding the direct effects of rapid demographic aging on political instability. The coefficients for age dependency and its rate of change are positive and statistically significant in each model specification. Societies with high rates of dependency, and particularly those with rising rates of dependency, tend to experience significant increases in political instability. The percentage of the population aged 65 and older remains statistically significant with the introduction of labor force participation rates. Finally, population and economic growth (as measured by the GDP per capita growth rate) behave as expected. Larger populations tend to have more opportunities to engage in politically destabilizing events, whereas economic prosperity acts as a stabilizing force.
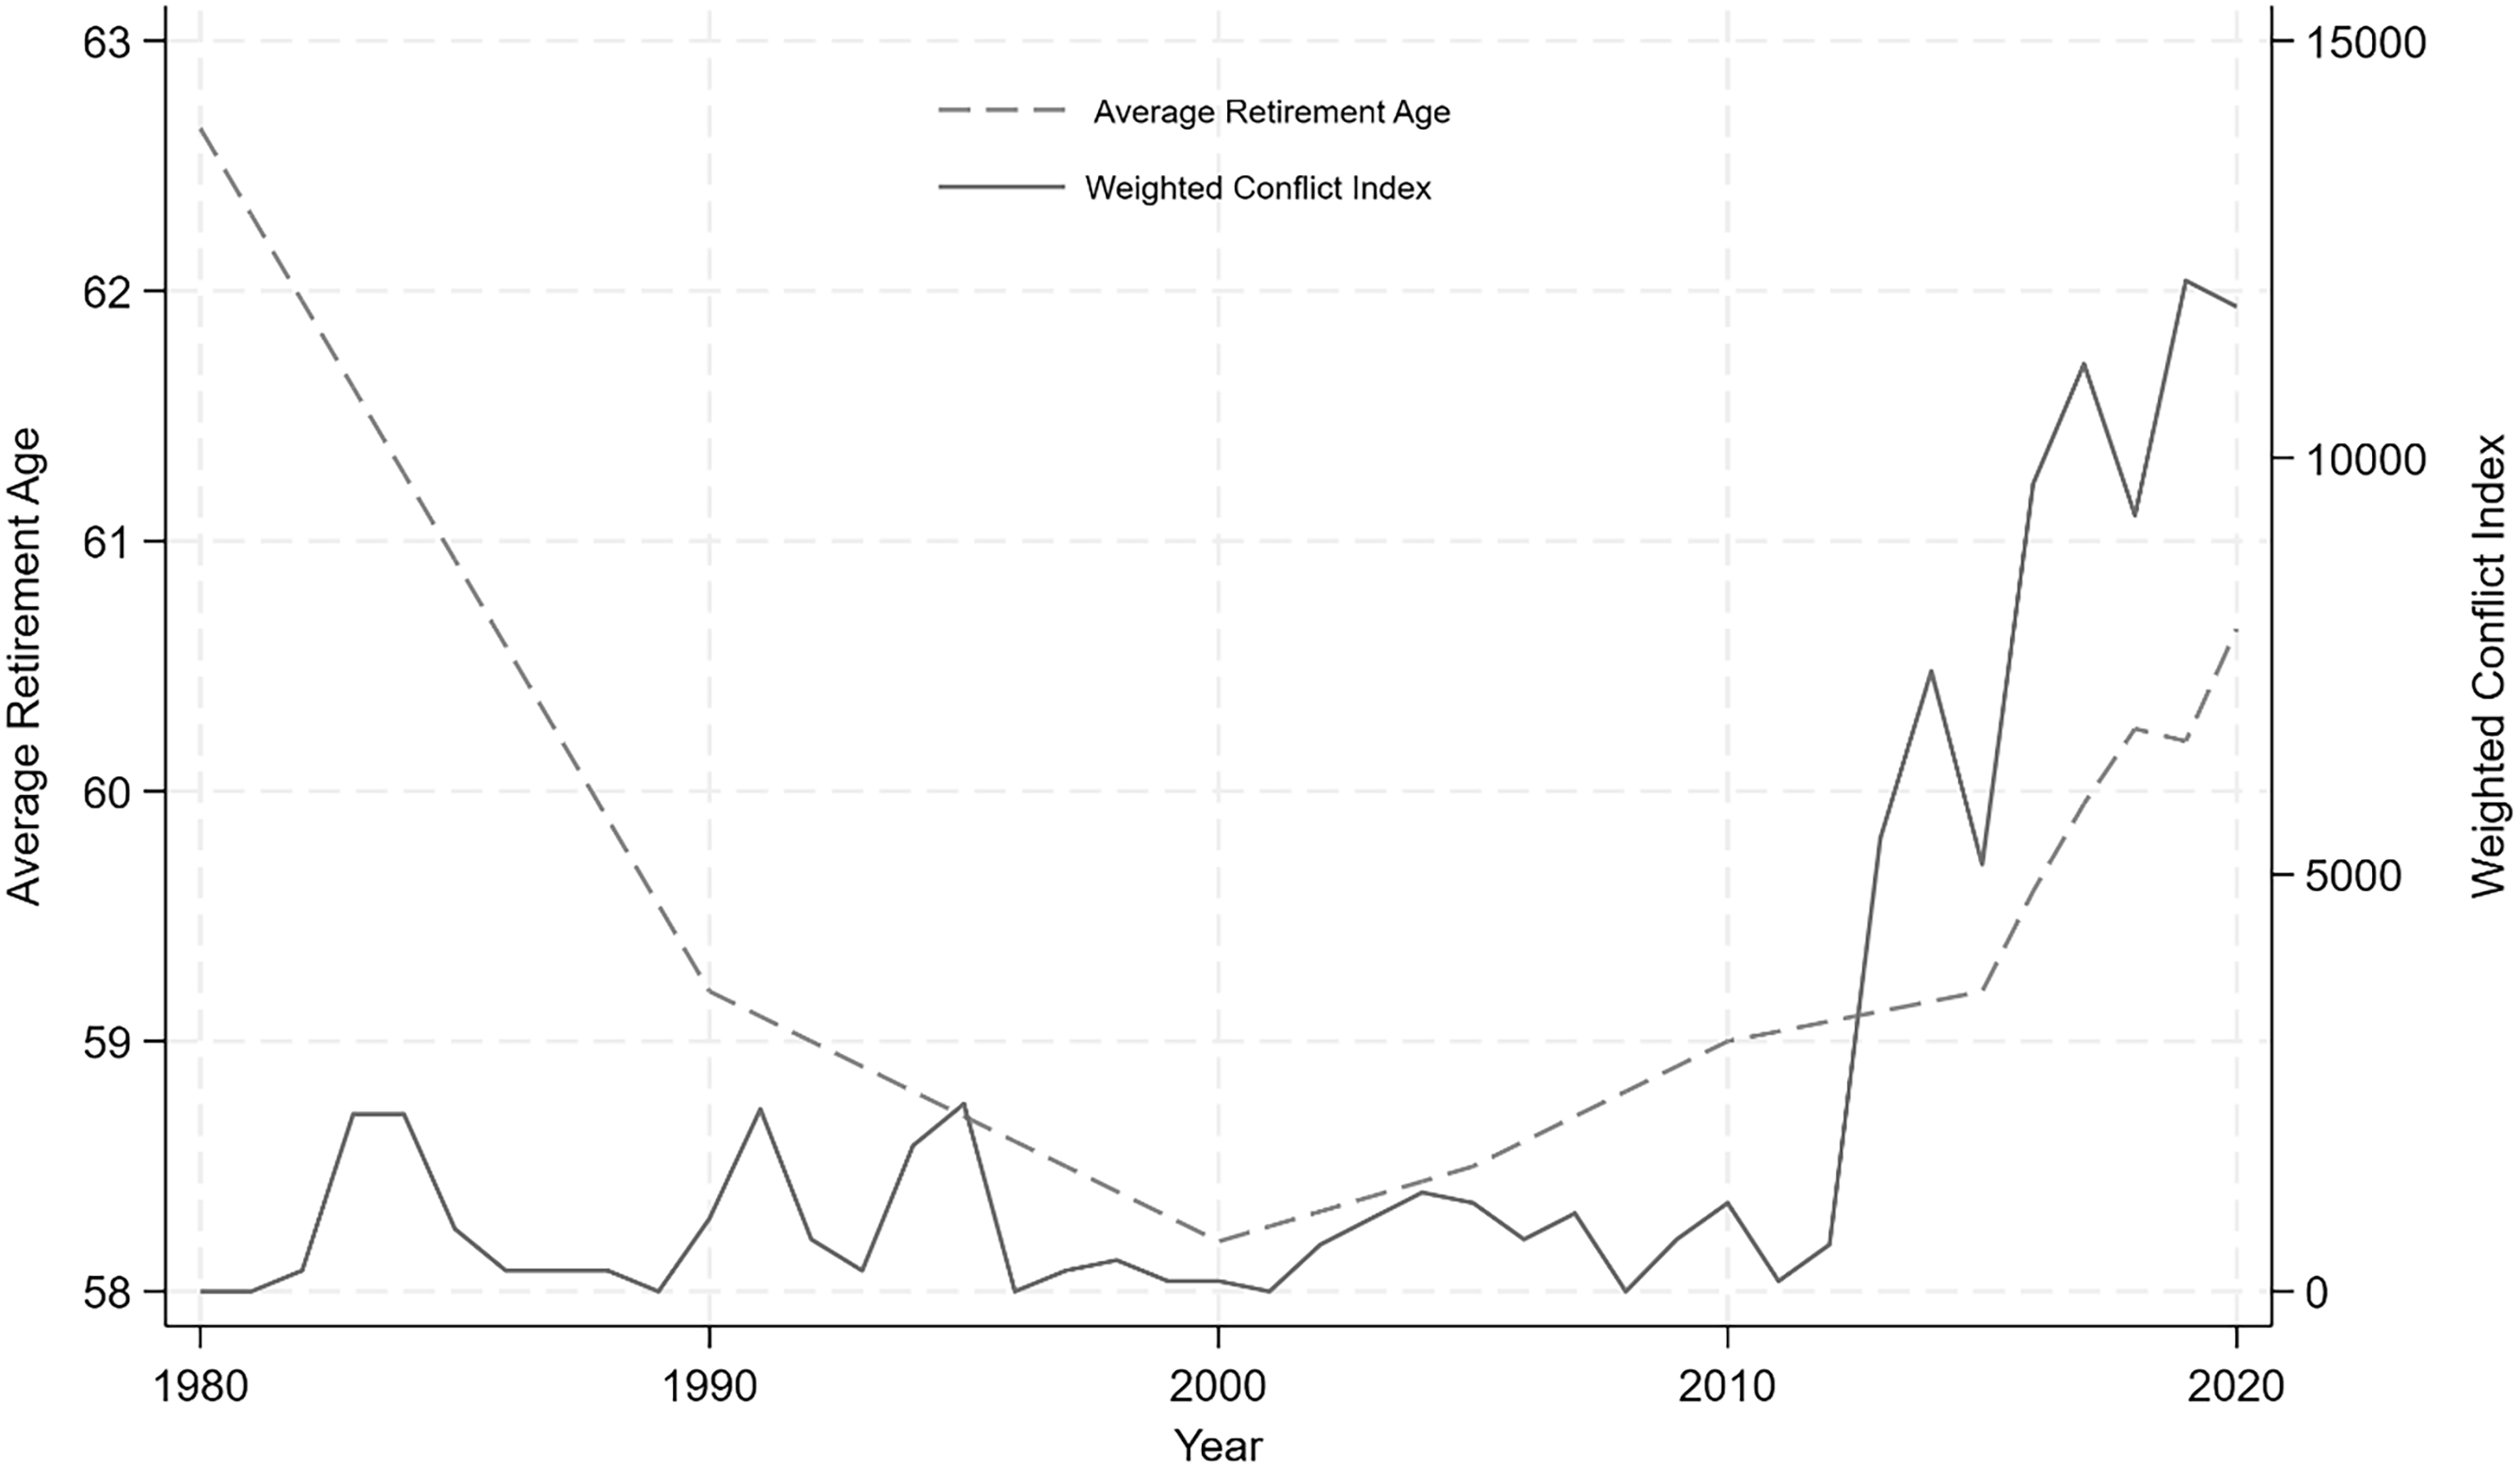
The empirical evidence supports the argument that retirement reform in response to rapid demographic aging tends to have a significant adverse effect on political stability even after controlling for demographic age structure and trajectory, population size, and economic productivity. Unfortunately, doing nothing in the face of rapidly expanding elderly dependent populations and the associated fiscal squeeze between a declining tax base and an increase in demand for public services is not an option. Policymakers, particularly in representative governments, face a tremendous challenge. Indeed, it is commonly understood that retirement reform is a “third rail” in politics that “politicians tackle at their peril” (Wolf and Amirkhanyan Reference Wolf and Amirkhanyan2010, p. 512). A cursory examination of recent French history is instructive, as shown in Figure 4.
France average effective retirement age and weighted conflict index.

In 1995, mass protests and three weeks of strikes derailed the French government’s plans to increase the retirement age for civil servants, leading to the ouster of Prime Minister Juppe. In 2003, millions of people went on strike and took to the streets in cities across France in anticipation of government plans to overhaul the pension system. The strikes led to 80 percent of flights being grounded, public transit being halted, canceled classes, cut services at hospitals, and a significant reduction in electricity output. Then, in 2007, the government attempted once more to raise the retirement age for public pensions from 65 to 67 and increase the age for early reduced pensions from 60 to 62. This event led to a 3.5-million-person strike, which briefly turned violent and inflicted significant economic damage and disruption across the country (BBC News 2010). Two years later, Prime Minister Sarkozy was ousted by Francois Hollande, who campaigned in part on rolling back Sarkozy’s pension reforms. The frequency and intensity of such events only increased over the next decade (Figure 4). Indeed, significant retirement reforms are a “third rail” of French politics. Attempts to reform France’s retirement policy contributed to the ouster of Juppe and Hollande, demonstrating the immense widespread disdain for such reforms. To the extent that retirement reform has been implemented in France over recent decades, the reforms have been exceedingly modest, and required a tremendous expenditure of political capital, creating significant disincentives for such policy reforms among elected politicians.Footnote 5
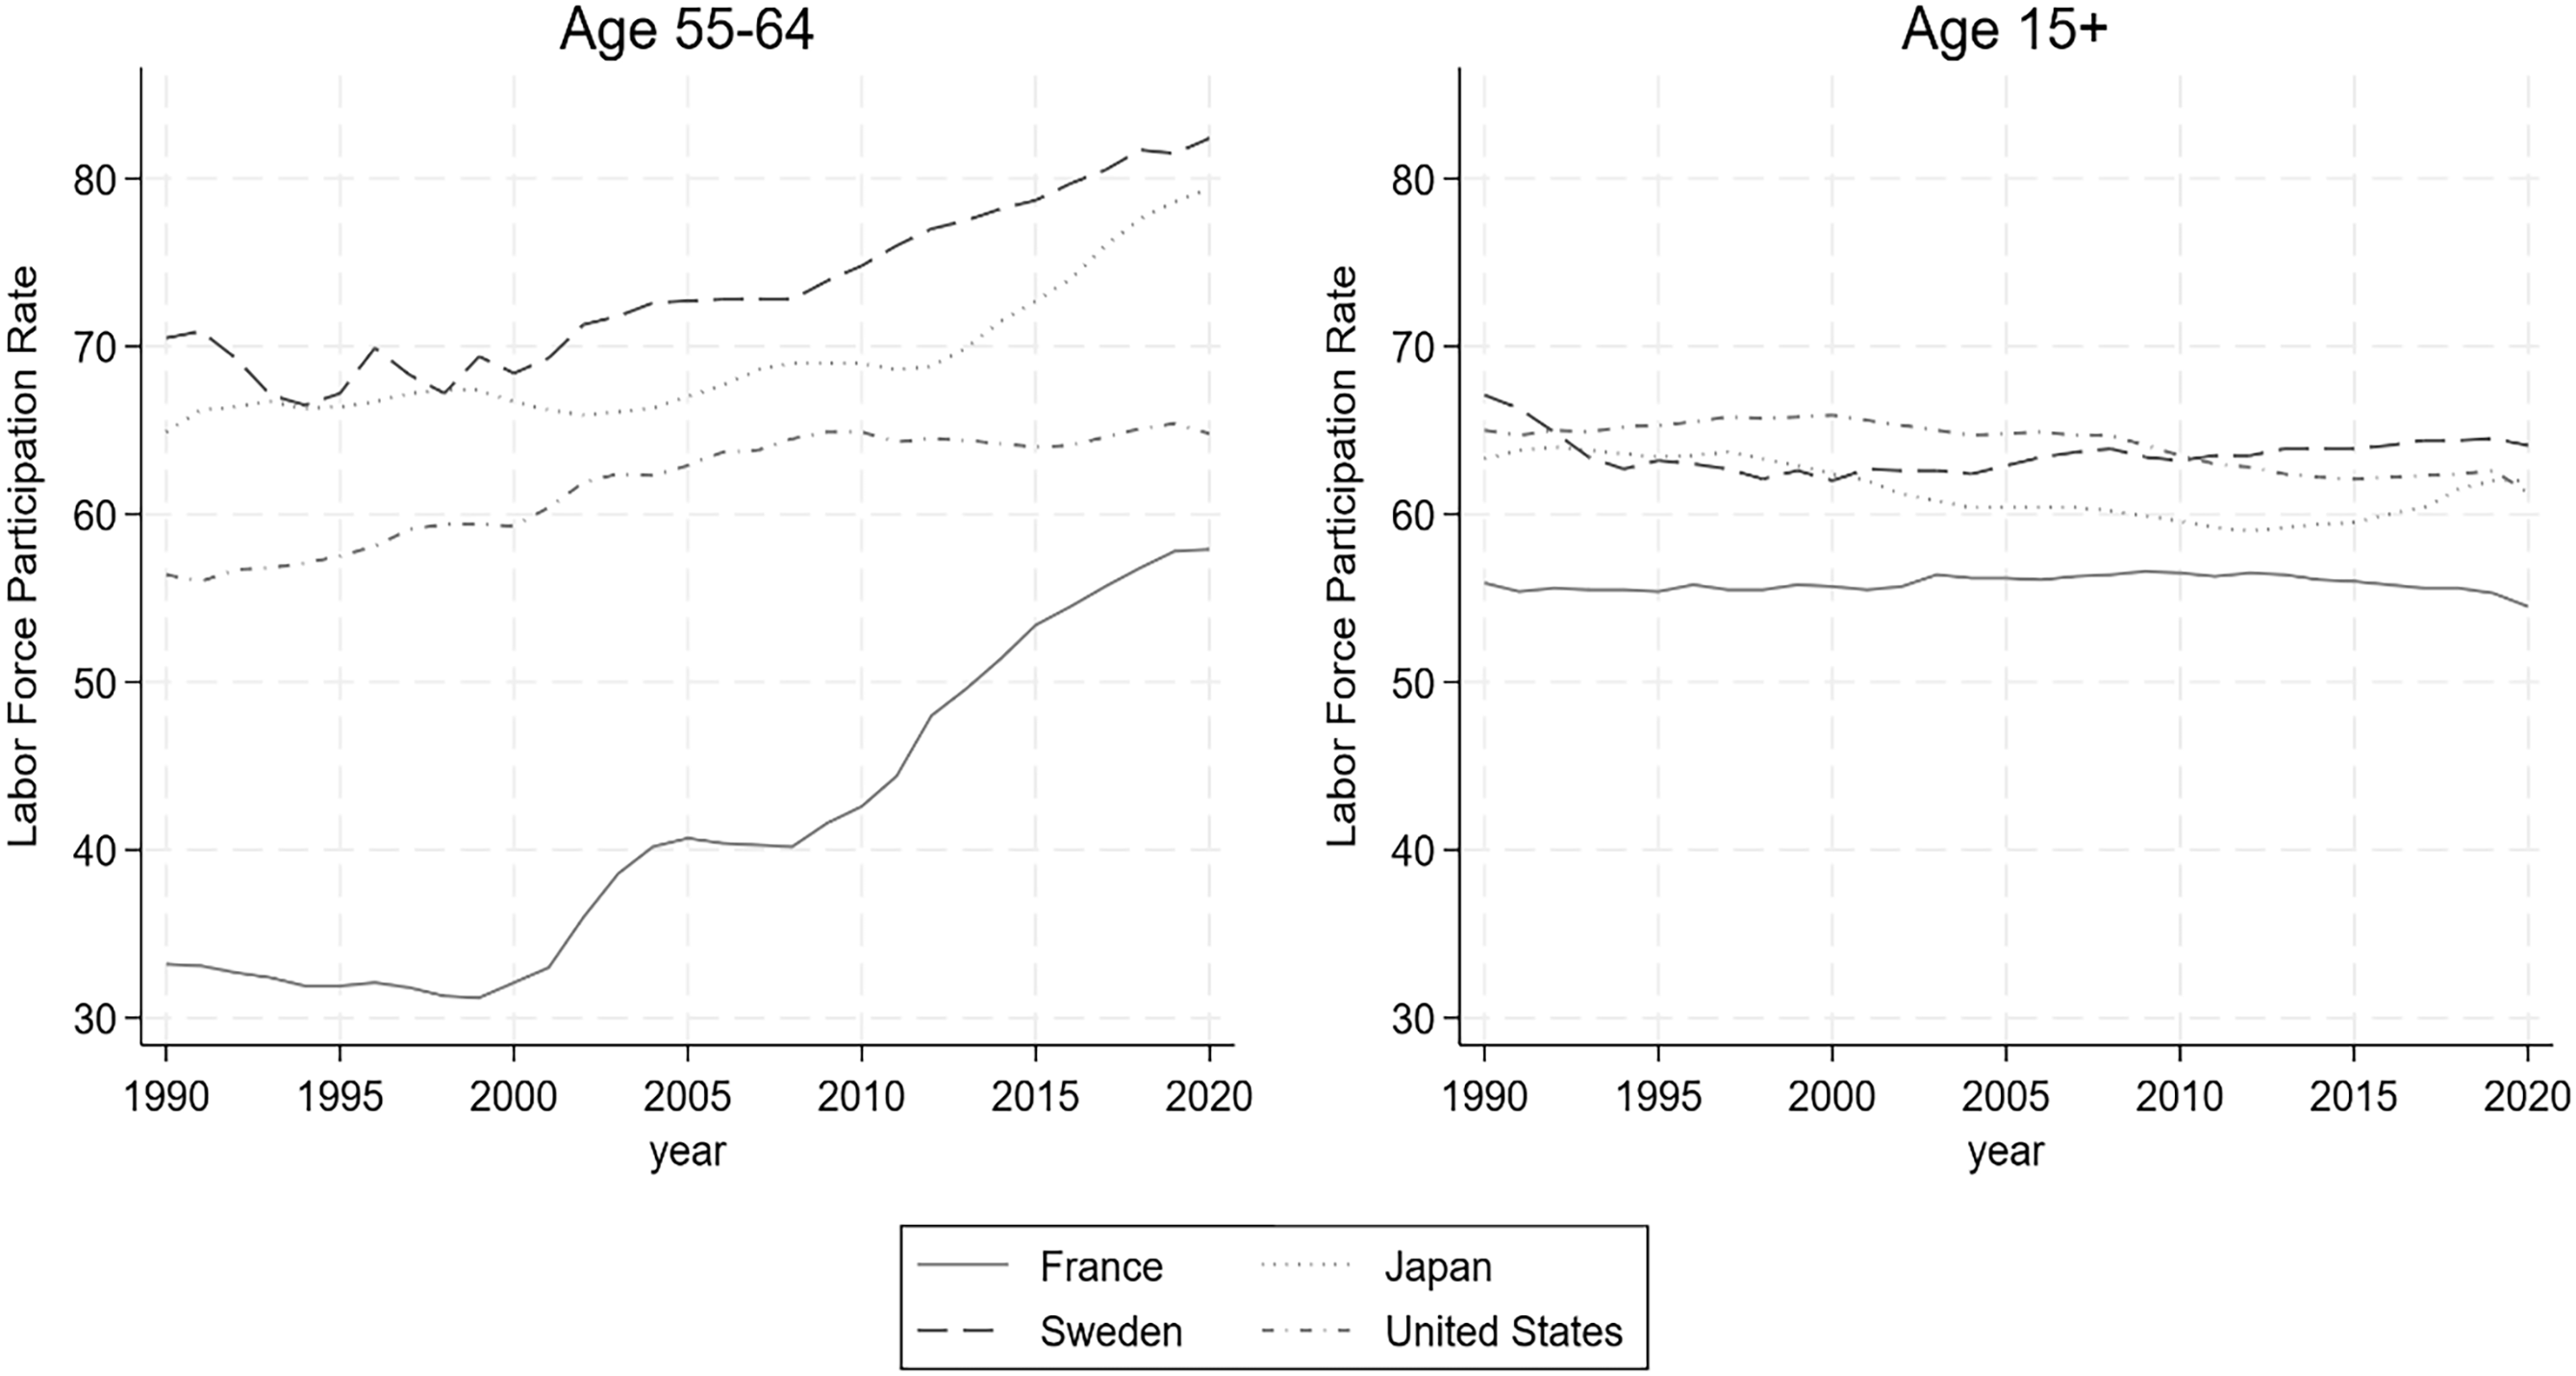
The recent history of France’s civil unrest illustrates the political difficulties associated with retirement reform. It shows the immense unpopularity of reforms aimed at increasing retirement age thresholds. As the preceding empirical analysis demonstrates, compelling workers to effectively postpone retirement tends to be far more destabilizing than efforts to increase labor force participation among older cohorts. This would likely be an effective route for France, particularly given that France maintains a low labor force participation rate compared to other developed countries among its older economically active cohort, as well as overall labor force participation, which is extremely low and declining (Figure 5). Potential policies aimed at increasing labor force participation may include incentives for employers to hire older workers, promoting active aging, and implementing lifelong learning programs that enhance the competitiveness of older workers in the labor market. Increasing labor force participation rates will not entirely reverse the trend of demographic aging in the long run. Still, they can certainly help mitigate labor force contraction in the medium term.
Labor force participation rates by age group.
Source: Data is adapted from International Labor Organization (2022).
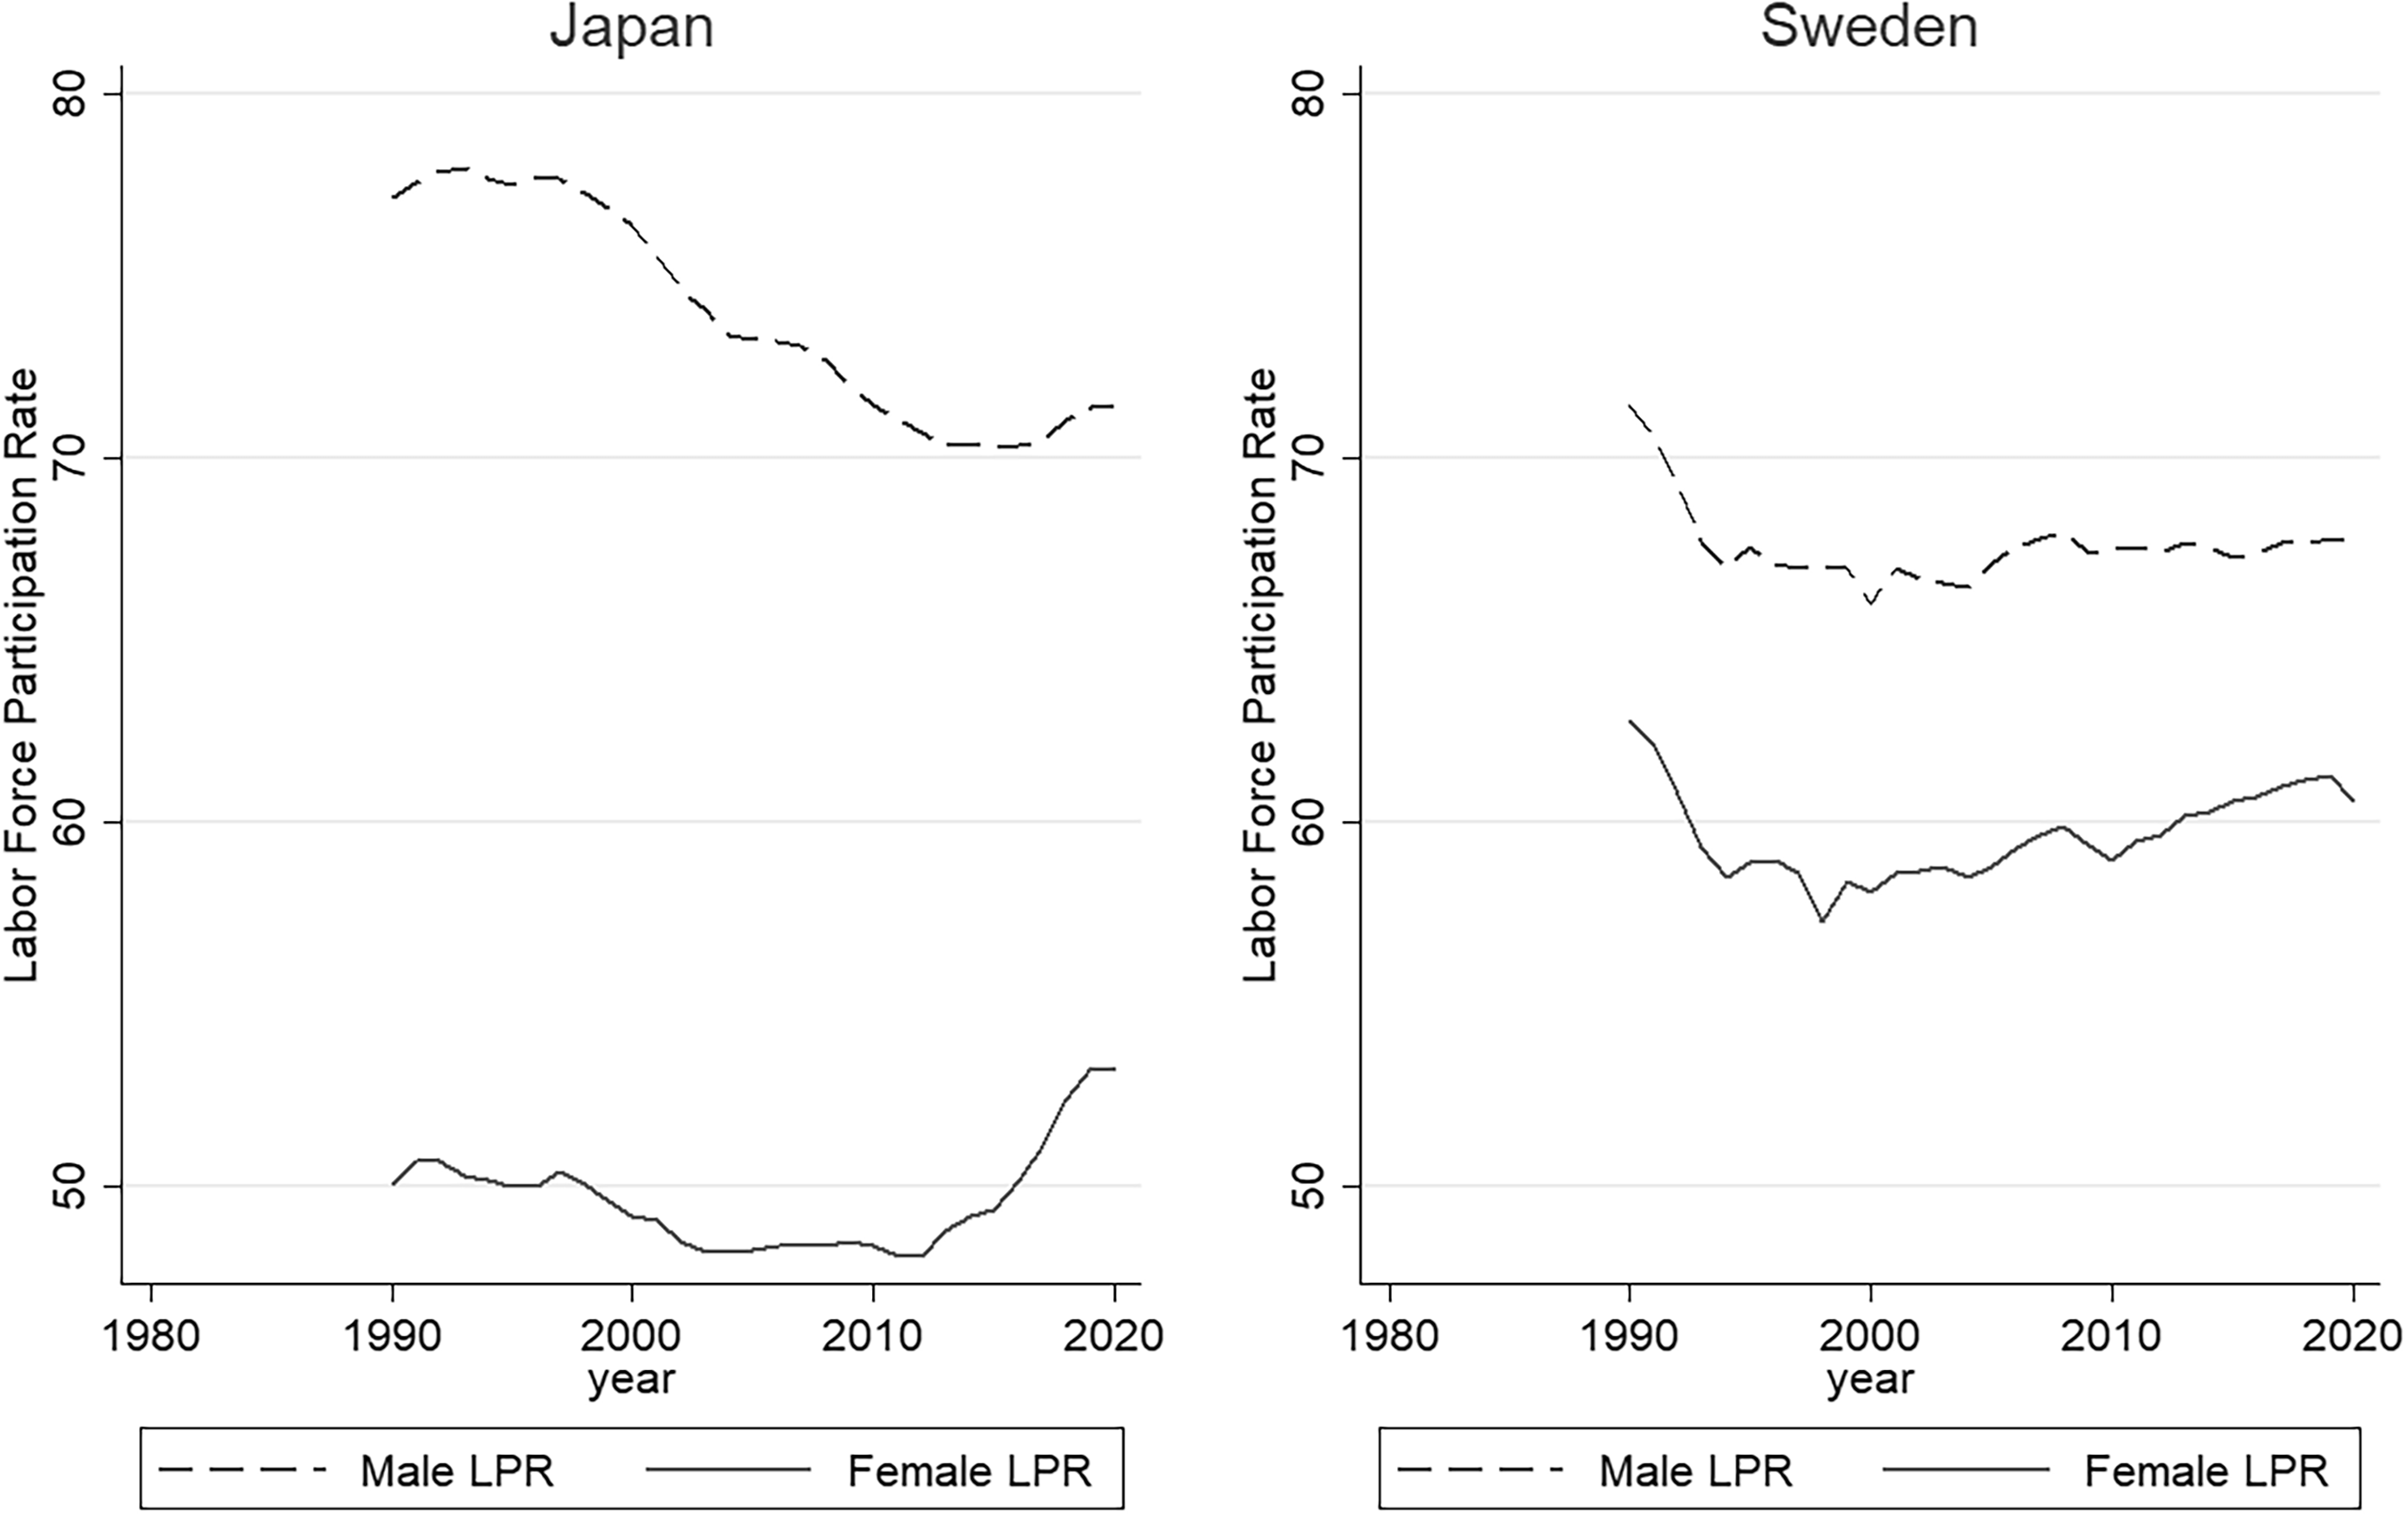
This highlights a key point. Response to demographic aging varies considerably, driven by cross-country differences in demographic structure, the composition of their labor force, and institutional welfare legacies. If a state could construct a retirement system from scratch, pegging age thresholds to demographic forecasts could maintain a consistent labor force over time. Since this is not the case, governments must choose policies carefully and strategically. For France, policy incentives to enhance labor force participation may be low-hanging fruit. Raising the effective retirement age, currently 62.5 in Italy and 63.2 in Greece, could provide a more effective pathway for long-term pension reform (OECD 2023). For countries like Japan and South Korea, which have relatively high average retirement ages and benefit from high overall male labor force participation, attempts to bolster female participation may be beneficial. Such efforts would be far less effective in social democratic welfare regimes, as Sweden or Norway has low levels of gender inequality in the labor market (Figure 6).
Labor force participation rates by gender.
Source: Data is adapted from the International Labor Organization (2022).
No single set of reforms in developed societies is likely to solve the crisis generated by rapid demographic aging. Stowell (Reference Stowell2021) argues that the Silver Tsunami may contribute to political instability and unrest driven by an aging population that expects unsustainable social security coverage. This is particularly true in democracies, where politicians and policymakers have office-seeking incentives leading to increased social security and avoidance of blame for unpopular reforms. In France, for example, attempts to limit payments or extend the retirement age have led to serious turmoil and non-confidence votes in Parliament. The unanticipated rise in population longevity and its implications for age-dependency contributed to these crises.
Attempts to increase the retirement age are directly linked to rising instability and dissatisfaction. To avert instability and dissatisfaction, we propose that the decision on retirement age be removed from political debates and replaced by non-partisan assessors. The institutional structure could follow that of central banks, which are charged with controlling inflation.Footnote 6 In many affluent, developed societies most affected by the retirement crisis, central banks operate with varying degrees of independence from their governments to adjust interest rates. Independence typically means that Central banks or a Board can set monetary policy without direct government interference to control interest rates linked to inflation. Interest rates are determined by non-partisan agents with the aim of sustaining desired inflation and employment rates. Rarely do such decisions gather broad popular support.
Conclusion
This research offers support for the argument that demographic aging and related pension reforms may contribute to an increase in political instability. Demographic dynamics have shifted, resulting in labor forces shrinking throughout the developed world while age dependency rises. Our analysis shows a strong connection between this demographic shift and political unrest. Compelling people to postpone retirement and to increase labor force participation rates among older workers is often politically destabilizing.
We argue that the substantive reforms necessary to stabilize retirement costs will need to overcome significant political obstacles, generating intergenerational mistrust and diminishing the perceived legitimacy of governing institutions. Policymakers must, therefore, overcome the problems of political expediency. Changes must take into consideration the unique demographic and labor structures, as well as historical policy legacies, and seek as many direct and indirect routes as possible to adjust to a shrinking labor force while maintaining a fiscal commitment to older generations. This is a complex problem with no single solution that fits all states. Denmark provides a potential path towards a stable solution that reduces confrontation. In May 2025, Denmark’s Parliament passed legislation to raise the retirement age to 70, with future increases tied to longevity every five years. The current retirement age is expected to continue increasing, maintaining a constant gap between the remaining years of life after retirement.
Future research would benefit from systematic, longitudinal data on policy reforms and proposals. To our knowledge, no such data exists. We therefore assume that within-country changes to average retirement age and labor force participation rates are the result of policy. It would have been preferable to assess various policy types or features to discern their respective political consequences. Putting together such a dataset would be useful.
This assessment addresses only half of the link between dissent and demographic changes. A more general proposition suggested by Gurr (Reference Gurr1970) posits that persistent frustration leads to aggression, which in turn contributes to political instability. Urdal (Reference Urdal2006) demonstrated that young cohorts are frustrated by the gap between expectations and reality, and they rebel against their governments. However, a similar “youth bulge” in China, where employment rates were high, remained relatively quiescent. Our analysis reveals that instability is generated by the older cohort in response to frustration resulting from the reductions and postponements of their expected rewards, following years of work. Dissent rises as the youth bulge generates unemployment in developing societies, while the silver tsunami impacts developed societies that promised much but delivered far less than expected. A future general restatement of the demographic impact on increasing instability should consider the non-linear relationship between rebellious young and dissenting elderly populations, as determined by the demographic transition.
A future assessment of the political impacts of retirement reform should also examine the impact of various political institutions and regime characteristics. This research alluded to difficulties associated with representative democracy and related incentives for short-sighted fiscal policies and buck-passing. These and similar assertions should be examined in light of the existing evidence.
The full extent of the challenges posed by the silver tsunami has yet to be fully felt. The consequences of inaction are sure to be severe. If done correctly, early action by policymakers can significantly soften the crisis. Postponing action or acting with a heavy hand may exacerbate undesirable political consequences. Subsequent research may be able to shed light on the most effective and least politically destabilizing policy approaches to this novel crisis.
Data availability statement
Replication materials are available in the Journal of Public Policy Dataverse at https://doi.org/10.7910/DVN/VF4EVG


 Open access