

Introduction
During the High and Late Middle Ages, Europe saw the emergence of religious movements condemned as heretics by the Church, such as the Cathars, Waldensians, Guglielmites, Lollards, and Hussites, among others (Wakefield and Evans Reference Wakefield and Patterson Evans1991). The differing appeal of religious dissidence to men and women, as well as the roles each held within these groups, has been a subject of debate among historians. Some have argued that heterodox religious movements appealed to women, offering them a space of liberation from orthodox religious hierarchies (Arnold Reference Arnold2013; Green Reference Green, Erickson and Schweizer2017; Koch Reference Koch1962). Proponents of this view have remarked on the significant number of women who appear among heretics and the prominent roles certain women held within the pastoral elite of such sects and their communities (Benedetti Reference Benedetti, Rossi and Varanini2005, Reference Benedetti, Benedetti and Cameron2022; Biller Reference Biller2001, Reference Biller, Minnis and Voaden2010; Shahar Reference Shahar2001). Conversely, critics have contended that the gender composition of these movements mirrored (at best) that of medieval society at large (Abels and Harrison Reference Abels and Harrison1979) or that movements such as Lollardy and Waldensianism, with their “scriptural fundamentalism,” reinforced the very “nonbiblical accretions” associated with women’s religiosity in orthodox faith (McSheffrey Reference McSheffrey1995).
Our understanding of medieval heretical movements relies heavily on sources produced by their persecutors – namely, the Church and the inquisitors. This reliance has prompted increasing scrutiny of how inquisitorial practices and preconceptions shaped historical narratives (Biller Reference Biller2001). Multiple factors have been identified as potential sources of distortion, including inquisitors’ preconceptions about each gender, the interaction with suspects and witnesses during the trial, the choice of questions, the narrative construction, the compilation of registers, and so on (Arnold Reference Arnold2001; Bruschi and Biller Reference Bruschi and Biller2003). Nonetheless, little is known about the precise ways in which inquisitors influenced the reality that they documented beyond what is outlined in inquisitorial manuals or inspired by Church legislation (Hill Reference Hill2019). Specifically, how did inquisitors’ implicit gender biases shape the heretical networks they uncovered? To what extent did these biases influence the knowledge we now possess about these movements?
Some studies have begun to address these questions. Vise (Reference Vise2018) and Moore (Reference Moore2019), for example, note procedural differences in Bologna around 1300, where women and men were interrogated in different locations – women in the church and men at the inquisitor’s court. This pattern, however, does not seem to have translated into specific procedural attitudes toward women. Neither of the two best-known inquisitorial manuals written in the fourteenth century dedicated anything of note to specific procedures regarding each gender (Eymerich Reference Eymerich1587; Guidonis Reference Gui and Douais1886). Other studies have observed differences between men and women as witnesses or informants. Biller (Reference Biller, Minnis and Voaden2010) notices that women made up the majority of the witnesses interrogated by inquisitor Peter Zwicker in Szczecin (present-day Poland) in the early 1390s, despite the incomplete survival of this material. He also remarked on the impact of gender homophily – the preference for reporting on members of the same gender. As he puts it, referring to the records of inquisitor Peter Sellan’s sentences against the heretics of Languedoc from 1241-2, “women noticed women” (Biller Reference Biller2001). Biller (Reference Biller, Benedetti and Cameron2022) also notes that women were among the first sources consulted by inquisitor Albert of Castellario during the trials of the Waldensians in Giaveno, Italy (1335), and draws parallels with other trials in Szczecin (1392), Strasbourg (1400), and Fribourg (1430), where women played prominent roles as reporters (cf. Merlo Reference Merlo1977: 163–64; Välimäki Reference Välimäki2019). Shahar (Reference Shahar2001) takes a more radical stance, asserting that inquisitors viewed men and women equally, disregarding traditional gender asymmetries when gathering information. This conclusion, however, is primarily based on inquisitor Jacques Fournier’s attitude toward two Waldensian women in Pamiers (Languedoc), potentially conflating the purported freedom heresy offered women with the “freedom” to discuss their faith during interrogations.
This study builds on existing scholarship by investigating whether inquisitors exhibited a biased attitude toward men and women in their investigative work. Specifically, we examine whether inquisitors showed a stronger tendency to interrogate suspects of either gender, mapped their social networks more exhaustively, and how this affected both the exposed sections of the heretic community and subsequent knowledge about those groups. Theoretically, our research draws from the sociological literature on official information gathering and the criminological literature on the persecution of deviance. We build on the concepts of census production (Emigh et al. Reference Emigh, Riley and Ahmed2016, Reference Emigh, Riley, Ahmed, de Leon, Martin, Misra and Janoski2020), tie appropriation – the process by which investigators capitalize on individuals’ social ties to muster incriminating information (Headworth Reference Headworth2019) – and (detective) discretion (Corsianos Reference Corsianos2003; Ericson Reference Ericson1981; Galligan Reference Galligan1990) to conceptualize an inquisitorial trial as an iterative process of tie appropriation where the inquisitor had the flexibility to steer their information-gathering efforts within the constraints imposed by previously collected information (i.e., who was reported and therefore became a suspect).
Empirically, our study focuses on records from the trial against the Waldensians in Giaveno, Italy, in 1335 (Merlo Reference Merlo1977). Using social network analysis tools (Borgatti et al. Reference Borgatti, Everett, Johnson and Agneessens2022; Crossley et al. Reference Crossley, Bellotti, Edwards, Everett, Koskinen and Tranmer2015), we analyze differences in the number and gender of individuals implicated by male and female witnesses. This is followed by a counterfactual exercise to assess whether accusations reported by men and women had a similar or different impact on the extent of the heretic network eventually disclosed to the inquisitor. Lastly, we use survival analysis methods (Hosmer et al. Reference Hosmer, Lemeshow and May2008; Mills Reference Mills2011) to determine whether the inquisitor exhibited a different attitude toward men and women when citing suspects for questioning. Our findings indicate that while men and women provided similar numbers of accusations, the inquisitor showed a stronger tendency to pursue leads involving men, even when similar levels of incriminating evidence were present.
Our study makes several contributions. First, in contrast to previous research highlighting the prominent role of women as valuable information sources (Biller Reference Biller, Benedetti and Cameron2022; Shahar Reference Shahar2001), our findings suggest that the inquisitor, Albert of Castellario, was more zealous in investigating men. Implicit preconceptions about each gender may have influenced the inquisitor’s information-gathering efforts and, consequently, shaped the heretical networks documented in trial records. More broadly, our findings underscore the role of information-gathering processes in shaping historical realities. Even processes aimed at meticulous documentation, such as inquisitorial investigations (Given Reference Given1997: 25–51), are susceptible to biases. This insight bridges scholarship on official information-gathering practices (Emigh et al. Reference Emigh, Riley and Ahmed2016; Reference Emigh, Riley, Ahmed, de Leon, Martin, Misra and Janoski2020) with research on the inquisitorial production of discourse on heresy (Arnold Reference Arnold2001). Second, our findings have implications for understanding the evolution of premodern heretical movements. They suggest that institutional changes within these movements may have emerged not only from internal ideological developments but also in response to sustained – and potentially gender-biased – persecution. For instance, the gendered “division of labor” observed in movements like the Waldensians (Biller Reference Biller2001, Reference Biller, Minnis and Voaden2010) may reflect adaptive responses to such persecution. Lastly, our methodological framework – combining social network analysis, counterfactual reasoning, and survival analysis – offers a robust tool for disentangling the agency of inquisitors from that of their subjects. This approach not only uncovers gender biases in inquisitorial practices but also provides a foundation for exploring other forms of bias, such as political motives, in the persecution of heretical groups (Lansing Reference Lansing1998; Rehr Reference Rehr2019).
The medieval inquisition, tie appropriation, and detective discretion
Research on official information gathering by Emigh and colleagues (Reference Emigh, Riley and Ahmed2016, Reference Emigh, Riley, Ahmed, de Leon, Martin, Misra and Janoski2020) underscores that information collected in official settings is neither an objective nor exhaustive representation of reality. Instead, it serves as a structured abstraction that reflects the power dynamics between the collector and the targets, is shaped by the standardizing strategies of state actors, and is jointly produced through interactions with the social actors under scrutiny. The records produced by the inquisitions against “heretical depravity” – the tribunals established by the medieval Church to combat heresy – exhibit similar characteristics. Inquisitorial records are shaped by the interplay of two key agencies: the inquisitors and their methods, and the individuals under investigation, whose responses and actions influence the data (Given Reference Given1997). These records function as a form of “census,” listing individuals whom inquisitors identified as heretics or suspects of heresy. They are, however, inevitably marked by limitations and biases inherent in the investigative process (Arnold Reference Arnold2003; Rehr Reference Rehr2019). Therefore, understanding the practices of the inquisition is essential before attempting to analyze the contents of these records.
What is commonly referred to as the “Inquisition” consisted of ad hoc tribunals officially subject to the Popes and staffed by members of mendicant orders. These tribunals were entrusted with the authority to identify suspects of religious heterodoxy, establish their guilt through interrogation, extract abjurations of heresy, and pronounce sentences when necessary (Given Reference Given1989; Moore Reference Moore2019). Although the Church tried to regulate certain aspects of the inquisitorial procedure – such as its procedural sequence and the administration of torture (Arnold Reference Arnold2001; Kelly Reference Kelly2015; Mansi Reference Mansi1901: col. 689ff) – the medieval inquisitions never acquired the character of a unified organization and lacked centralized oversight supervising the work of the inquisitors. As Elliott (Reference Elliott2009: 2) observes, “the term [inquisition] is more reflective of a process than of an institution.” Trials largely depended on the personal jurisdiction, zeal, and experience of individual inquisitors, as well as the procedures they chose to apply, with or without reference to the guidelines established by the Church (Kelly Reference Kelly1989; Kieckhefer Reference Kieckhefer1995).
In practice, inquisitors generally adhered to a loose structure and sequence of proceedings. After initiating a process, they commonly started with a grace period during which anyone, particularly the members of the heterodox movement, could testify in exchange for leniency. The central and typically longest stage was the investigation, which built on information acquired before and during the grace period. During this part of the trial, the inquisitor issued summonses to those named by others in previous testimonies and subjected them to interrogation. These individuals delivered their testimony under oath and were expected to confess their own crimes as well as name other suspected heretics, thereby creating an iterative process of investigation and network expansion (Given Reference Given1989; Hill Reference Hill2019).
The criminological concepts of “tie appropriation” (Headworth Reference Headworth2019) and “detective discretion” (Corsianos Reference Corsianos2003; Ericson Reference Ericson1981) help illuminate how inquisitors may have operated in practice and how they may have influenced the broader body of records collected about the targeted population.
“Tie appropriation,” as defined by Headworth (Reference Headworth2019) in his study of modern US fraud investigators, refers to the process by which outsiders leverage individuals’ social connections to gather incriminating information. Investigations often depend on the ability to exploit these connections, whether through voluntary reports driven by grievances or more intrusive methods, such as co-opting close personal relationships (Headworth Reference Headworth2019: 174–77). As outsiders to the communities they scrutinized and typically lacking records from previous campaigns (Given Reference Given1997), inquisitors similarly relied on the social ties of informants – often fellow villagers or relatives – to uncover broader heretical networks. This iterative process expanded the scope of their investigations, with each new testimony providing leads for additional interrogations. The information acquired shaped the range of suspects who could be summoned later, reinforcing the cumulative nature of the investigation.
Inquisitors also exercised significant “discretion,” a term used in legal studies to denote the power conferred on officials to use their judgment to decide which actions to take in any given situation (Corsianos Reference Corsianos2001, Reference Corsianos2003; Ericson Reference Ericson1981; Galligan Reference Galligan1990). Officials use discretion to determine what and to what extent to investigate, whom to question, and consequently, which cases receive attention (Davis Reference Davis1969; cf. Black Reference Black1973). Discretion allowed inquisitors to decide whom to summon, what to investigate, and how extensively to pursue leads. This autonomy stemmed partly from the lack of centralized oversight (Given Reference Given1989; Kieckhefer Reference Kieckhefer1995). In addition, medieval anti-heretical tribunals were modeled after the inquisitorial procedure adopted by the ecclesiastical courts in the twelfth century. This allowed the inquisitors to take action against suspects ex officio – without the need for a plaintiff – and to assume an active role in citing witnesses and accumulating evidence (Given Reference Given1989; Vallerani Reference Vallerani2012).
Even though ample discretion allowed inquisitors to map heretical networks so as to eliminate “the spaces on which the heretic masters can rely” (Merlo Reference Merlo1977: 139), and some performed their task with meticulous care (Given Reference Given1997), the extent to which inquisitors were gender-blind (or generally objective) remains an open question. Preconceptions about gender might have influenced how inquisitors used their discretion, prioritized leads or allocated investigative resources. Inconsistency in treatment suggests that our understanding of medieval heterodox movements may be skewed or unduly reliant on information provided by one gender.
This study builds on prior research addressing gender-based distortions in heretical records, moving beyond procedural variations (Vise Reference Vise2018) and gendered reporting biases (Biller Reference Biller, Minnis and Voaden2010) to explore how discretionary decisions shaped the documentation of heretical networks. Based on the concepts of tie appropriation and detective discretion, we assess whether inquisitors demonstrated a gender-biased approach. Specifically, we examine the urgency with which inquisitors summoned individuals of each gender and the extent to which male and female deponents influenced the progression of trials. This approach allows us to evaluate how gender shaped the investigative process and the heretical networks captured in trial records.
The next section introduces our case study: the 1335 trial of the Waldensians in Giaveno. We then outline our methodologies, analyze gender-based differences in accusatory patterns and the timing of summonses, and discuss the broader implications of our findings.
The trial against the Waldensians in Giaveno (1335)
Our study uses the records of the inquisitorial process against the Waldensians in Giaveno, a town in the Italian region of Piedmont, conducted during the winter of 1335. The Waldensians, also known as the “Poor of Lyons,” were adherents of an ascetic and evangelical movement established around 1170 following the conversion of Vaudès, a wealthy citizen of Lyons, to a life of poverty and preaching. Initially tolerated by the local ecclesiastical hierarchy and the papacy, conflicts over the right to preach led to their excommunication in 1184 and their formal declaration as heretics by 1215. Waldensian ideology subsequently spread to surrounding regions, reaching Italy before 1200 and the valleys of Piedmont sometime during the thirteenth century (Audisio Reference Audisio1999).
The trial was led by Albert of Castellario, a member of the Order of Preachers and the inquisitor in the Dominican province of Upper Lombardy (Grandjean Reference Grandjean1884: 711–12; Moore Reference Moore2019: 54–56). Judging from how he identified himself – Albertus de Castellario de Cuneo (Merlo Reference Merlo1977: 163) – he likely hailed from the town of Cuneo, located in the same region he would later traverse as an inquisitor. While there is little known about Albert, it is plausible that he was older than forty years of age, given that the decretal Multorum querela of the Council of Vienne (1311–12) mandated that no inquisitor be younger than forty (Friedberg Reference Friedberg1955: col. 1182, cap. 2). The Giaveno process was certainly not his first, as he had led several inquisitions between 1332 and 1334 in Perosa, Luserna, and Pinerolo, all places within his jurisdiction (Gabotto Reference Gabotto1900, Reference Gabotto1898). His dispatch to Giaveno followed the activities of certain Waldensian masters, including a prominent figure named Martin, who had seemingly evaded prosecution for two decades (Eubel Reference Eubel1898: 530 doc. 987).
The original Latin manuscript, containing notes on the summonses issued by the inquisitor, the accounts of each deposition, the enumeration of transgressions for each suspect, and the list of verdicts and imposed sentences, is currently held at the Archives of the Order of Preachers in Rome (Archivio generale dell’Ordine dei Predicatori, Rome, MS II.64, ff. 1r-111v). We used the modern edition of the register published by Merlo (Reference Merlo1977: 161–255).
This register proved most suitable for several reasons. It is one of the few medieval registers with such a breadth of information preserved nearly intact, with minimal lacunae and no significant missing sections. While the manuscript ends abruptly, leaving some doubt about missing data regarding the punishments handed down by Castellario, the depositions – crucial for our work – appear to be fully preserved. These records detail whether (and when) a person had been summoned and the accusations they brought before Albert.
This case study also benefits from the predominantly rural demographic composition of the Waldensian community (Audisio Reference Audisio2006, Reference Audisio1999). This characteristic reduced the chances that the inquisitor would prioritize individuals for economic gain or political motives (Lansing Reference Lansing1998; Rehr Reference Rehr2019). As a result, Giaveno offers an ideal setting for isolating gender effects. The records mention professions for only 19 individuals (7.1 percent of the 267 suspects or testifiers), further indicating a largely homogenous community composed mostly of peasants and laborers. With the Waldensians declared heretics over a century earlier and Giaveno’s proximity to regions previously investigated by inquisitors, we can infer a high degree of local familiarity with inquisitorial procedures and the potential consequences of denouncement.
The process in Giaveno began on January 20 and concluded around February 26, 1335. During the initial phase from January 20 to 28, Albert conducted preliminary interviews with a few locals, including two priests and several laypeople, among them two women – one notably more eager than the other in accusing others of heresy. On January 29, following standard procedure, Albert declared a three-day “period of grace,” after which the core phase of the trial commenced.
The register mentions four public summonses announced on February 2, 6, 8, and 19, containing the names of 30 individuals. In addition to these public summonses, 60 individuals were cited individually at different moments throughout the trial, as inferred from their depositions. By the end of the trial, Albert had summoned 90 individuals (60 men and 30 women), of whom 85 provided their depositions. Five individuals ignored the citations. Testimonies from other suspects indicate these individuals had left town.
In addition to these 85 testifiers, 25 other individuals also provided testimony, bringing the total to 110 people interviewed by the inquisitor. These testimonies, given by 76 men and 34 women, explicitly named 238 individuals suspected of adhering to the Waldensian heresy, some of whom also served as testifiers. In terms of unique testifier-accused pairs, the register documents 747 accusations. Overall, the trial involved 267 unique individuals – 156 men and 111 women – who appeared either as testifiers, suspects, or both. This total excludes sixteen Waldensian masters, as they were not Castellario’s main targets and did not reside in Giaveno.
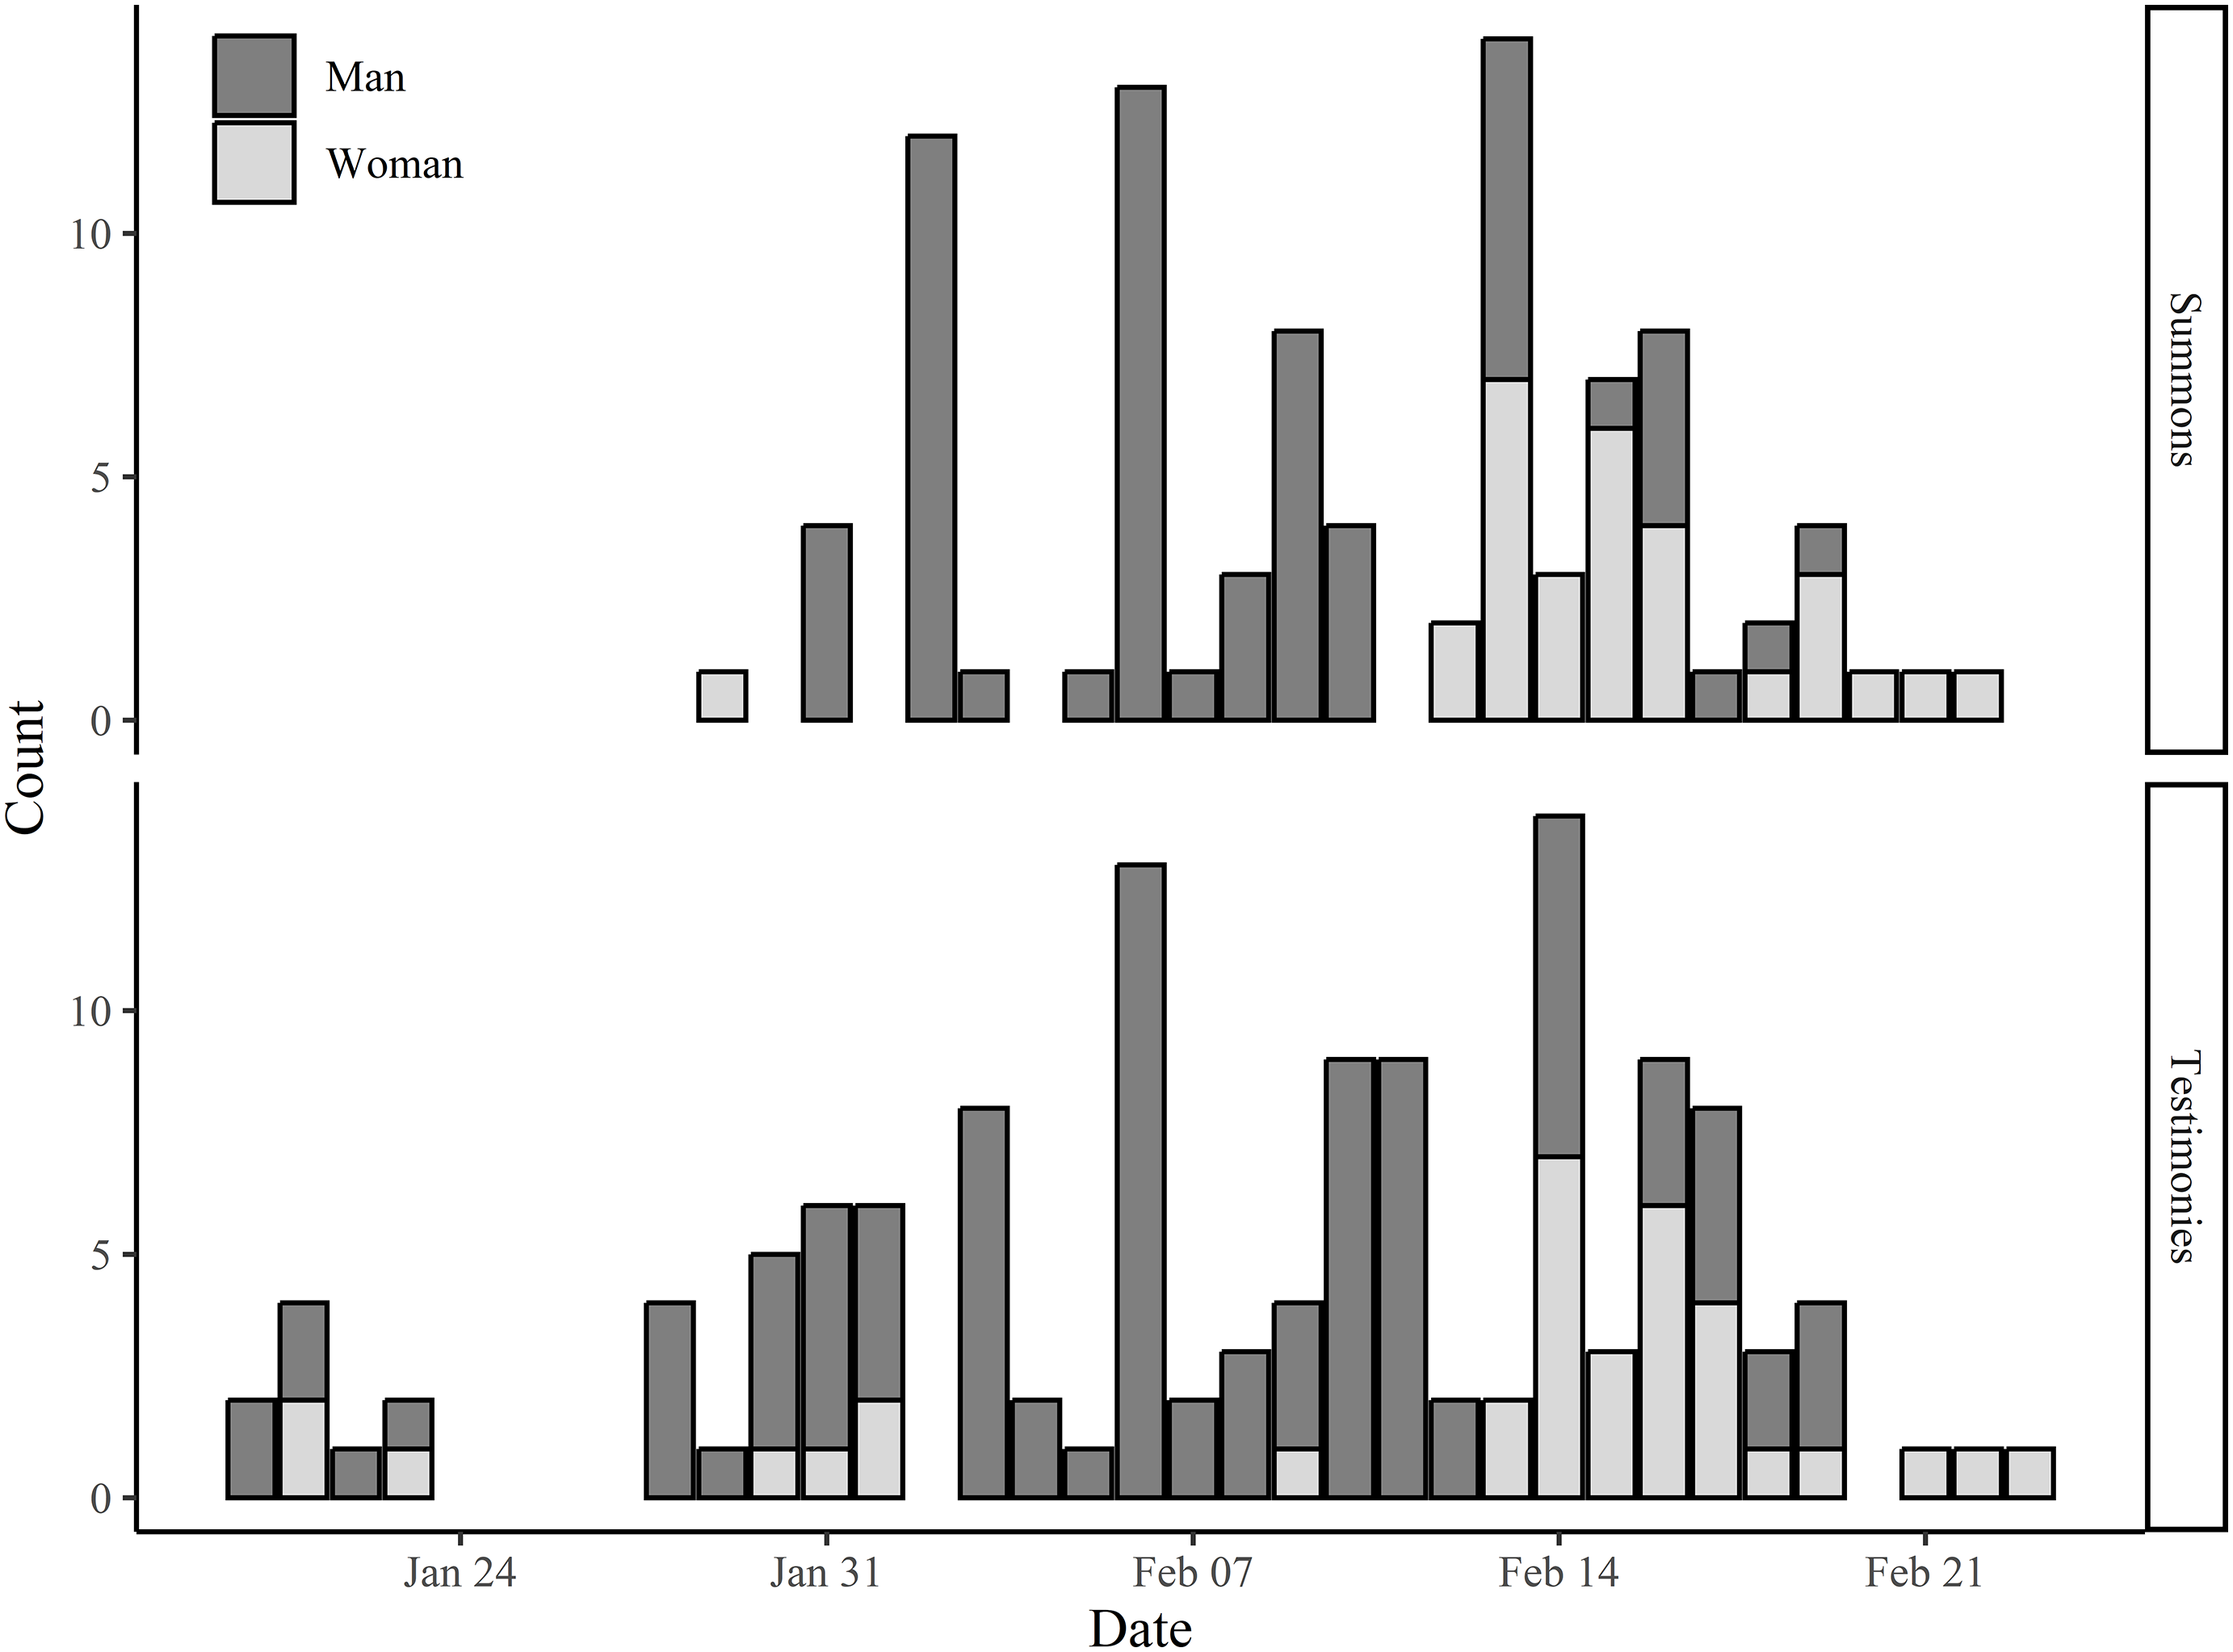
Figure 1 illustrates the number of individuals summoned and interviewed over time, differentiated by gender. When the date of an individual’s citation is unknown, we have assumed it occurred the day before their deposition. Given that the average time elapsed between public summonses and appearances before the inquisitor is 0.64 days, it is unlikely that these individuals were called to appear before the inquisitor much earlier. Both the summonses and testimonies exhibit a discernible temporal pattern. This pattern is especially evident in the summonses, which show a marked focus on men during the middle phase of the process. In contrast, women appear to have played more prominent roles at both the beginning and the conclusion of the investigation.
Number of individuals summoned and interviewed, categorized by gender and the date of their appearance.

Analytical strategy
Network analyses of the accusations reported to the inquisitor
Our analyses begin by examining the testimonies of the 110 individuals interrogated by the inquisitor. Using the names of individuals accused of heresy mentioned in these testimonies, we construct a network where a tie from person i to person j indicates that the former accused the latter (see Figure 2). Then, to explore potential differences in the quantity and nature of information provided by men and women, we apply several ego-network measures (Crossley et al. Reference Crossley, Bellotti, Edwards, Everett, Koskinen and Tranmer2015).
Network visualization of the accusations reported to the inquisitor. The graph consists of 267 nodes, representing individuals, and 747 ties, representing accusations. Each tie points from the accuser to the accused. Isolated nodes represent testifiers who neither reported anyone nor were accused by others.

In our context, out-degree measures the number of individuals a person reported. Comparing the out-degrees of female and male testifiers allows us to see whether men and women, on average, accused a different number of people. To assess whether men primarily reported men and women reported women, as Biller (Reference Biller, Minnis and Voaden2010) contends, we use two homophily measures: the EI (External-Internal) index and Yule’s Q (Crossley et al. Reference Crossley, Bellotti, Edwards, Everett, Koskinen and Tranmer2015, chap. 4). The EI index calculates homophily by subtracting the number of same-gender accusations (Internal ties) from other-gender accusations (External ties), then dividing by the total number of accusations (E+I). Values near −1 indicate strong homophily, while values near +1 indicate strong heterophily. Yule’s Q further accounts for subgroup sizes; here, −1 indicates perfect heterophily, and +1 denotes perfect homophily. For its calculation, we use the 136 men and 102 women reported during the trial.
Our focus, however, is on how the inquisitor acted on accusations rather than the number or type of accusations made by each gender. To investigate this, we analyze the entire accusation network to look for evidence of whether the inquisitor seemed more thorough in following leads from either gender. For this, we rely on the concept of reachability (Borgatti et al. Reference Borgatti, Everett, Johnson and Agneessens2022: 19–22), which reflects the idea that the value of an accusation lies not only in the accusation itself but also in its ability to open paths to other individuals. In a network, one individual can reach another if there is a sequence of directed ties connecting them. This notion of a directed path is crucial here, as inquisitors typically built their investigations by iteratively following the connections provided by their informants.
We conduct a counterfactual analysis. First, we remove all outgoing ties from the 34 female testifiers and calculate how many individuals are reachable from each remaining male testifier (76 men). This provides an estimate of the “incriminating power” of men as a group – how many individuals the inquisitor would have uncovered had he disregarded the leads provided by women. We then repeat the process by removing the accusations of 34 men to estimate the outcome had the inquisitor disregarded an equivalent number of male testimonies. If the resulting values are similar, it suggests that the 34 women had a comparable influence on the overall trial as 34 men. A difference in values, on the other hand, would point to a discrepancy in incriminating power based on gender or suggest that the inquisitor more thoroughly pursued accusations from one gender over the other.
Given the 4.54 × 10²¹ possible combinations of 34 men, we sample 5,000 instances from this vast universe of possible combinations. Using kernel smoothing (Silverman Reference Silverman1986), we transform the resulting values into probability density functions. To assess the extent to which the distributions of incriminating power overlap – comparing results after excluding either 34 men or the 34 women – we calculate the overlapping coefficient (OVL) as described by Inman and Bradley Jr. (1989).Footnote 1 Then, we conduct a two-sample Kolmogorov-Smirnov test to determine if these distributions are derived from the same population. Given that the data are count-based, which can lead to tied values, we use Monte Carlo simulations to generate more precise p-values (Schröer and Trenkler Reference Schröer and Trenkler1995).
Since not all individuals provided their testimonies under similar circumstances – particularly as four men testified after being tortured – we repeat the comparison. This time, instead of sampling 34 men from the 76 who provided their depositions, we narrowed these 76 to those whose testimonies were given under conditions comparable to those of the women. We achieved this subset of men through coarsened exact matching (Iacus et al., Reference Iacus, King and Porro2009, Reference Iacus, King and Porro2012); on three key variables: date of testimony, summoned status (whether an individual’s testimony came after being summoned to appear before the inquisitor), and torture status. The matching reduced the pool of selectable male testifiers from 76 to only 48.Footnote 2
Figure 3 visually displays the results of the matching. In Panel B, we observe that, after matching, the dates of testimonies from men and women are more aligned, as many of the excluded men appeared during the middle phase of the trial. Panel D confirms that the matched sample excludes the four men who underwent torture, ensuring that the impact of excluding the 34 women is compared only to an equal-sized group of men who were not tortured.
Panel A illustrates the balance across key variables (date of testimony, summoned status, and tortured status) when comparing all 34 women to the full group of 76 men (represented by empty white dots), and when comparing the 34 women to only the 48 matched men (represented by filled black dots). Values closer to zero indicate a better balance. Panels B, C, and D display the distribution of both genders across each dimension before matching (unadjusted sample) and after matching (adjusted sample).

Survival analysis of the summonses issued by the inquisitor
While the network analysis of accusations offers insight into the relative impact of the 34 female testifiers compared to a (matched) sample of 34 men, it does not account for the timing of events or clarify the inquisitor’s role versus the actions of those under investigation. To address these limitations, we complement this analysis with an examination of the summonses issued by the inquisitor. By assessing differences in the probability and timing with which individuals were summoned, we can evaluate whether the inquisitor’s behavior shows evidence of a preference for one gender or a consistent approach across both.
For this, we construct a person-day dataset where each individual reported to the inquisitor contributes daily observations from the day their name was first mentioned until they were summoned. Entry into the dataset begins with the individual’s first accusation, which serves as the clearest starting point (though some may have come to the inquisitor’s attention through other means). Individuals exit the data upon being summoned, and observations for those who were never summoned are censored on the final day of the trial (February 26). Our choice of entry and exit points requires the exclusion of individuals summoned on or before their first accusation, as their timing falls outside our observational range. This exclusion affected 11 individuals (7 men and 4 women). Moreover, we excluded information about a few individuals known to have passed away. The final dataset consists of 3,497 person-day observations from 219 unique individuals, covering a maximum of 35 days (from January 20 to February 26). Within this period, the inquisitor issued 79 summonses (the event of interest).
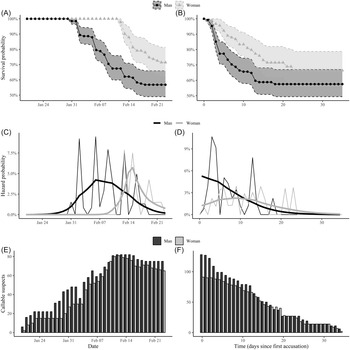
Figure 4 presents the hazards of being summoned and survival probabilities, broken down by gender, alongside the evolution of the risk set – the pool of individuals who were reported but had not yet been summoned. The left-hand panels present these values over calendar time, while the right-hand panels plot them relative to the time elapsed since each individual’s first accusation, which serves as the analysis time in our study.
Panels A and B show the survival probabilities of men and women reported to the inquisitor, with Panel A using the actual dates of the reports and Panel B using the number of days elapsed since the person was first accused. Panels C and D display the hazards by day, with dented lines representing the observed values and B-spline–smoothed curves illustrating the overall temporal trend. Panels E and F depict the risk sets of callable suspects available to the inquisitor – that is, the number of individuals reported but not yet called to provide their deposition – broken down by gender.

Panels A and C reveal a gendered difference in timing: while summonses for men began immediately after the Grace Period (January 31), summonses for women did not start until around February 12. Importantly, it appears that this gap in timing cannot be attributed solely to delay the reporting of women – by January 31, the inquisitor already had 45 male and 27 female suspects. Nor can it be explained by the inquisitor exhausting male suspects and thus turning to women (see Panel E). Panels B and D, which track summonses from the date an individual was first reported, reveal a less pronounced gender difference. Nonetheless, the continued disparity in timing and the percentage of individuals summoned suggests a more thorough pursuit of male suspects. The hazards for both men and women appear nonmonotonic, initially rising and then falling as time progresses since the first accusation.
To evaluate the presence of a discrepant behavior based on gender, we control for several potential confounders. Since individuals entered the suspect pool at different points, we control for each suspect’s “Day of accusation,” defined as the number of days since the trial began (ranging from 1 to 35). This variable helps account for any shifts in prosecutorial focus over time. We also account for the “Number of accusations received” – the total number of testifiers who implicated each suspect – which could indicate their centrality in the heretic network and thus increase their likelihood of being summoned. In addition, we include “Number of kin accused,” reflecting the possibility of summons by association (Pontikes et al. Reference Pontikes, Negro and Rao2010), as heresy was often a family affair (Given Reference Given1997).Footnote 3
To control for personal connections to key figures, we introduce two proxy variables: “Acquaintance with Martin” (a prominent Waldensian master who was of particular interest to Albert) and “Acquaintance with Francis” (another active master in and around Giaveno). Although other masters were mentioned in the records, they were linked to either Martin or Francis, so we did not include separate proxies for them. Finally, we also capture whether an individual hosted a Waldensian congregation (“Host to congregation(s)”). It seems reasonable to target organizers of heretical meetings, as such individuals were likely perceived as committed adherents if not ringleaders within the heretical movement.
All covariates, except for gender (coded as 1 for women and 0 for men) and “Date of accusation,” vary over time. However, status changes are only captured at the day level since we lack information on the order of events within each day.
Our approach to analyzing the data has been informed by several considerations, broadly categorized into those concerning the shape of the data and the role of time in the information-gathering process. The latter includes the itinerant and temporary nature of inquisitorial tribunals in general, and specifically the one in Giaveno. Time was both an essential and costly resource in such proceedings. The way the inquisitor(s) managed the allocated time and the sequence of interrogations not only provides insight into their reasoning but also influenced the trial’s overall outcomes. These aspects warrant careful consideration of interactions between covariates – particularly gender – and the timing of summonses, which may reveal fluctuations in their impact on the chances of someone being summoned as time passed since their first accusation.
Shaping of the data into person-day format, with covariates defined at one-day intervals, enables both discrete-time and continuous-time approaches to modeling the inquisitor’s summoning practices. Although the data are inherently discrete, our chosen unit of time is sufficiently precise to support the application of continuous-time methods.
We therefore assess the impact of gender and other covariates on the timing of summonses through several steps. First, we examine the proportionality of hazards for all covariates over the studied period, with particular focus on gender differences (between women and men). In proportional hazards survival models, the dependent variable of interest is the hazard – the probability of experiencing the event (in this case, a summons) – which is assumed to be proportional across covariate levels. The baseline hazard function, ${h_0}\left( t \right)$
, may vary over time, yet it is multiplicatively affected by hazard ratios (
${h_0}\left( t \right)$
, may vary over time, yet it is multiplicatively affected by hazard ratios ( $HR = {e^\beta }$
), which do not depend on time. This implies that the logit hazard functions for different covariate values remain equidistant, meaning that covariates exert constant effects regardless of time. However, proportional hazards models can be extended to allow for time-dependent effects. This is achieved by introducing interactions between covariates of interest and time (or a suitable transformation of time), allowing the regression coefficients to vary over time. For example, the hazard function can be expressed as:
$HR = {e^\beta }$
), which do not depend on time. This implies that the logit hazard functions for different covariate values remain equidistant, meaning that covariates exert constant effects regardless of time. However, proportional hazards models can be extended to allow for time-dependent effects. This is achieved by introducing interactions between covariates of interest and time (or a suitable transformation of time), allowing the regression coefficients to vary over time. For example, the hazard function can be expressed as:
 $${h_i}\left( {t|{x_i}} \right) = {h_0}\left( t \right){e^{{\beta _1}{x_{1i}} + {\beta _2}{x_{2i}} + {\beta _3}{x_{2i}}f\left( t \right)}}$$
A violation of the proportional hazards assumption, along with significant interactions between covariates and time, would indicate that the effects of the predictors change over time – in our case, reflecting shifts in their influence on the probability of someone being summoned as their time under the inquisitor’s consideration progressed. We estimate Cox proportional hazards models and test the proportional hazards assumption along with the significance of interactions with time (Grambsch and Therneau Reference Grambsch and Therneau1994; Hosmer et al. Reference Hosmer, Lemeshow and May2008; Royston and Lambert Reference Royston and Lambert2011).
We conclude our analysis with log-normal accelerated failure time models, which in several respects provide a better fit to the data. The accelerated failure time approach addresses limitations of proportional hazards models while the log-normal models accommodate nonmonotonic hazard functions.Footnote 4 Whereas parametric survival models typically assume hazard functions that either increase or decrease over time, the log-normal accelerated failure time model allows for hazard rates that may rise initially and then decline, aligning with the observed patterns in the data (see Figure 4). Moreover, unlike proportional hazards models, which assess the effect of covariates on the hazard rate, accelerated failure time models directly capture the “time-until” events and the impact of covariates on accelerating or decelerating this waiting time. In the context of log-normal accelerated failure time models, the logarithm of survival time is linearly affected by covariates, with the error term following a normal distribution. Thus, the model resembles a linear regression with the addition of possible censoring:
 $$\ln(t_i)=\beta_0+x_i\beta_x+\epsilon_i, \ \epsilon_i\sim N(0,\sigma^2)$$
Rather than estimating hazard ratios, the model estimates the parameters of the log-normal density, survival, and hazard functions, $\mu = \;{\beta _0} + {x_i}{\beta _x}$
and
$\mu = \;{\beta _0} + {x_i}{\beta _x}$
and $\sigma $
, where parameter
$\sigma $
, where parameter $\mu $
is directly affected by covariate values. This makes the accelerated failure time models particularly suitable for our framework, as we examine how the inquisitor managed his limited time and prioritized summoning certain witnesses over others (Cleves et al. Reference Cleves, Gould and Marchenko2016; Rabe-Hesketh and Skrondal Reference Rabe-Hesketh and Skrondal2022).
$\mu $
is directly affected by covariate values. This makes the accelerated failure time models particularly suitable for our framework, as we examine how the inquisitor managed his limited time and prioritized summoning certain witnesses over others (Cleves et al. Reference Cleves, Gould and Marchenko2016; Rabe-Hesketh and Skrondal Reference Rabe-Hesketh and Skrondal2022).
Results
Similar number of accusations, different degrees of incriminating power
Figure 5 compares the behavior of the 110 testifiers by gender, displaying the number of individuals reported (Panel A) and the level of gender homophily – whether testifiers were more likely to name individuals of their own or the opposite gender (Panels B and C).
Panel A shows the distribution of accusations made, categorized by the gender of the testifiers. Panels B and C illustrate the distribution of individual homophily levels in the accusations, also differentiated by the testifiers’ gender. Note that homophily levels could not be calculated for individuals who did not report anyone (11 men and 7 women), which explains the difference in sample sizes between Panel A and Panels B and C.

We find no significant difference in the number of individuals reported by gender. Among the 76 male testifiers, 65 (85.5 percent) reported at least one name, compared to 27 of the 34 female testifiers (79.4 percent). Men reported an average of 7.54 names, while women reported 5.12 (with medians of 5 and 4.5, respectively). Given that one man, Iohannes Gauterii, an outlier subjected to torture, reported 65 names, we conduct a nonparametric rank-sum test (Hollander et al. Reference Hollander, Wolfe and Chicken2013: 115–36), which renders no evidence of one gender accusing more individuals than the other (Panel A).
While the total number of accusations appears similar across genders, homophily measures reveal notable disparities. Both the EI index (Panel B) and Yule’s Q (Panel C) show that both men and women predominantly accused other men. However, due to men’s strong homophilic tendencies – their preference for accusing other men – women ended up accounting for most accusations against other women (even though they still reported more male suspects overall). This pattern helps explain Biller’s (Reference Biller, Minnis and Voaden2010) impression that women may have been more likely than men to notice other women; however, that women primarily reported men suggests that heretic networks were less gender-segregated than assumed, with men perhaps less inclined to notice women.
To understand how the inquisitor acted on this information, we compare the number of individuals reachable by each testifier after excluding the accusations reported by women and, separately, after excluding the accusations reported by a sample of 34 men (see Analytical Strategy for details). Figure 6, Panel A, presents this comparison.
Panel A illustrates the number of individuals reachable by each testifier, comparing scenarios where the accusations reported by the 34 women are excluded (dark gray) against those where accusations from a sample of 34 men out of the 76 interviewed are excluded (light gray). Panel B repeats the same comparison, but in this case, the distribution shows the number of reachable individuals when sampling only from the 48 men who match women in terms of deposition date, summoned status, and tortured status.

Excluding the 34 women’s testimonies (dark gray) produces a bimodal distribution: some density around zero and a larger mass between 150 and 200, with a median of 173. This suggests that while a few men had little effect on the trial (either due to silence or lack of inquisitor follow-up), a single man’s accusations could implicate around 173 individuals (72.6 percent of all reported). Excluding 34 male testimonies instead reveals a more dispersed distribution with lower overall values, and a median of 113. Overlap between the two distributions is low (OVL = 34.21 percent), and primarily around zero. A Kolmogorov-Smirnov test further confirms that it is highly unlikely the two distributions come from the same population.
Panel B in Figure 6 presents the results when the sample of men whose accusations are excluded is restricted to a subset of 48 men matched to at least one of the 34 female testifiers. In this scenario, the differences between excluding 34 women and 34 men narrow considerably, with the median value rising to 144 individuals (up from the previous 113). Despite this increase, the overlap between the two distributions remains modest (35.47 percent), and the Kolmogorov-Smirnov test again strongly indicates that the distributions are unlikely to come from the same population.
These analyses reveal two key findings. First, men’s accusations seem to have had a greater influence on the trial overall, as suggested by the number of individuals reached in their absence. Second, the difference in influence between men and women may have been amplified by the inquisitor’s actions, as the men excluded in the second comparison primarily testified during the trial’s middle phase – when the inquisitor heightened scrutiny. In the next section, we examine the timing of summonses to assess whether the inquisitor’s approach reflects a more rigorous investigation of one gender over the other.
Gender differences in summons timing
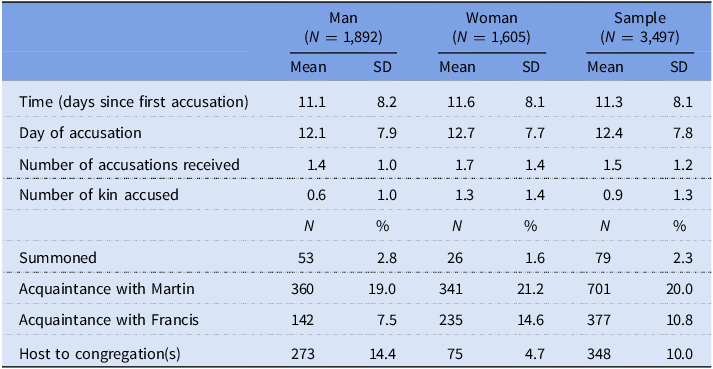
Before diving into formal testing, we first look at the evidence associated with each gender at the time of their summons. Comparing the average dates of summons shows about a one-week delay for women. In addition, when looking at the time elapsed since the first accusation, we find that men were summoned after an average of 14.5 days, compared to 18.9 days for women. This suggests that women were generally summoned later and with less urgency than men.
In terms of accusations received at the time of summons, men averaged 2.13 accusations, while women averaged 3.77. A similar trend appears in accusations against kin: men averaged 1.47 kin members accused, while women averaged 2.08. Moreover, 14 summoned men (26.4 percent) were associated with the Waldensian leader Martin, compared to 53.8 percent of summoned women. This gender disparity was even larger for association with Francis, with 17.0 percent of men versus 57.7 percent of women linked to him. These patterns suggest that the inquisitor needed more incriminating evidence to summon women than men. Only in accusations of hosting congregations did the proportions align closely: 39.6 percent of men and 42.3 percent of women.
Table 1 provides a univariate description of the person-day data overall and by gender, supporting the observation that women were generally summoned later and after more evidence was accumulated.
Descriptive statistics for the variables in the analyses. Data presented in person-day format (N = 3,497)

Figure 7 presents a bivariate analysis. Here, the strongest correlation is between summons timing and the date of accusation (Pearson r = −0.46), indicating that individuals identified later were often summoned sooner after their discovery. Predictably, all aggravating factors are positively correlated, with the strongest relationship between “Number of accusations received” and “Acquaintance with Francis” (r = 0.29). The correlation between accusations received and the number of kin members accused is modest (r = 0.16), suggesting that these variables, while related, possibly reflected distinct aspects of the evidence.
Pairwise Pearson correlation coefficient among the variables used in the analyses. Coefficients with p values greater than 0.05 are crossed out.

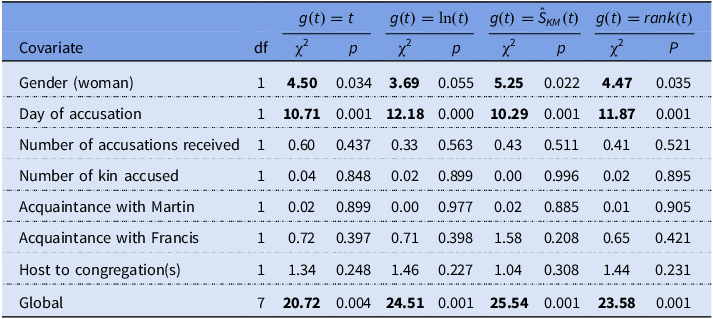
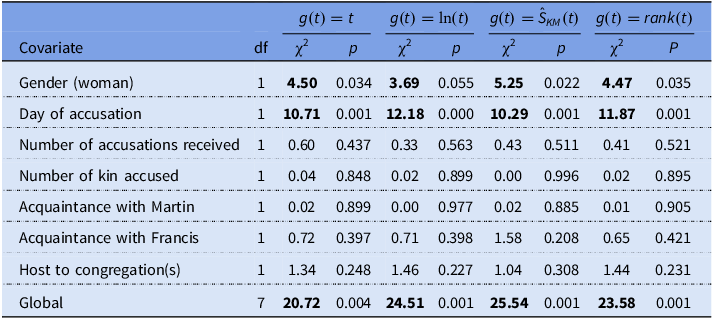
Multiple proportional hazards tests (see Table 2) for our simplest Cox proportional hazards model (Model 1, Table 3), which includes no interactions with time, indicate issues with more than one variable, as well as with the global statistics (Grambsch and Therneau Reference Grambsch and Therneau1994; Hosmer et al. Reference Hosmer, Lemeshow and May2008). This includes results that indicate nonproportionality for the effect of gender across time.
Tests of proportionality of hazards. Highlighted statistics indicate problematic covariates, with the p value close to or under 0.05
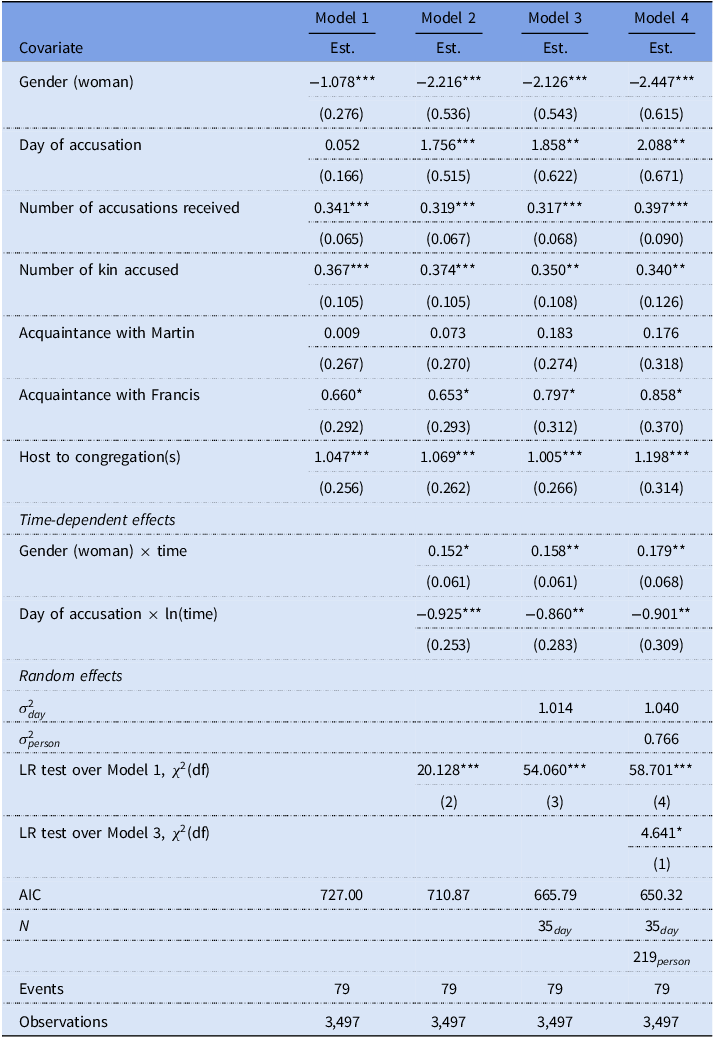
Cox proportional hazards models. For easier interpretation, the estimates show coefficients rather than hazard ratios (i.e., ${e^\beta }$
)
${e^\beta }$
)

Note: Standard errors between parentheses. *p < .05, **p < .01, ***p < .001 (two-tailed test).
Models incorporating interactions between survival time and the problematic covariates reveal significant interactions (see Model 2, Table 3). Focusing specifically on gender, the results suggest that the hazard for women is overall lower ( $\beta = - 2.216,{\rm{\;}}p \lt .001$
) but increases with waiting time (
$\beta = - 2.216,{\rm{\;}}p \lt .001$
) but increases with waiting time ( $\beta = 0.152,{\rm{\;}}p = .012$
). The plots of scaled Schoenfeld residuals from Model 1 against survival time for the predictors with significant nonproportionality agree with the results from the proportional hazards tests (see Figure 8). For gender, the plot suggests that women experienced lower hazards of being summoned compared to men during the early waiting period, with the difference diminishing as the waiting time increased.
$\beta = 0.152,{\rm{\;}}p = .012$
). The plots of scaled Schoenfeld residuals from Model 1 against survival time for the predictors with significant nonproportionality agree with the results from the proportional hazards tests (see Figure 8). For gender, the plot suggests that women experienced lower hazards of being summoned compared to men during the early waiting period, with the difference diminishing as the waiting time increased.
Smoothed Schoenfeld residual plots from Model 1 for the covariates “Gender (woman)” and “Day of accusation,” plotted against analysis time and log-transformed analysis time. The time-varying patterns suggest that the effects of both covariates change over time, with the effect of gender tending to zero as time progresses.

In Table 3, we present two additional Cox proportional hazards models (Models 3 and 4) that incorporate random effects to account for unobserved variability. Model 3 includes a random intercept by calendar day, accounting for shared circumstances across individuals on the same day of trial.Footnote 5 Model 4, moreover, adds a random intercept by individual, accounting for individual frailty. Both models yield results consistent with the simpler model, indicating that women have lower hazards initially, which increase over time. Notably, the model with both the day-level and individual-level frailty shows little improvement in deviance compared to the model with day-level frailty only. As we shall see, this finding is also replicated in the fully parametric accelerated failure time models.
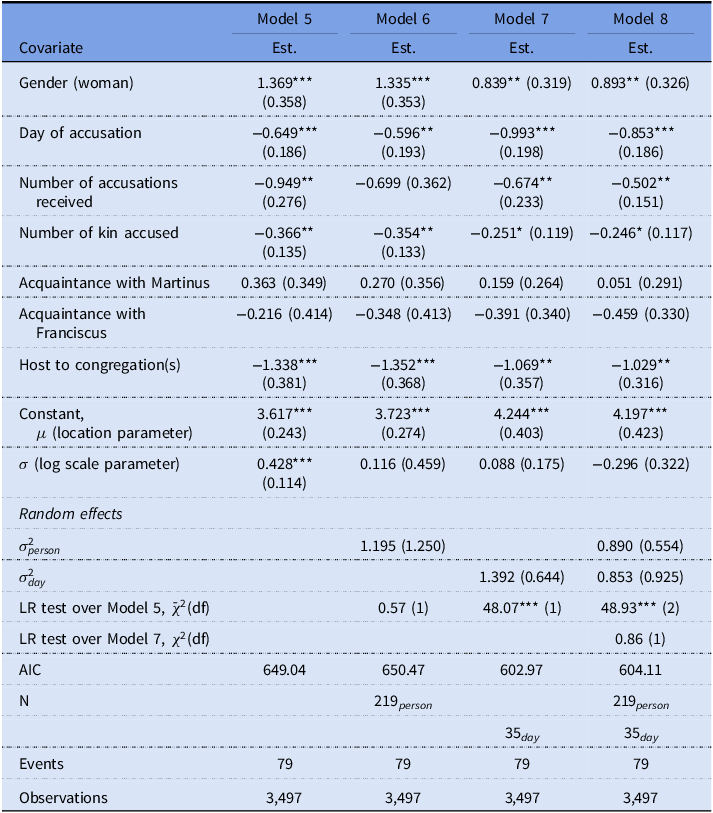
We follow this analysis with the estimation of four log-normal accelerated failure time models (see Table 4). In Model 5, we consider only the fixed effects. In mixed-effects Models 6 and 7, we add random intercepts to account for individual variation and variation in days of trial, respectively. Finally, in Model 8, we use a cross-nested structure, incorporating two main random effects, one for individuals and one for calendar day. In this final model, the random effect due to the day of trial applies to all individuals who are at risk of being summoned on that day.
Log-normal accelerated failure time models for the time to summons

Note: Standard errors between parentheses. *p < .05, **p < .01, ***p < .001 (two-tailed test).
The coefficients for gender are consistently significant and positive across all four models, indicating that the time until summons was delayed for women compared to men. Most of the remaining variables display a negative and statistically significant results.Footnote 6 The coefficients for “Day of accusation,” “Number of accusations received,” “Number of accused kin,” and “Host of congregation(s)” suggest that individuals with more incriminating circumstances, as well as those reported later, were summoned sooner after being accused.
This aligns with earlier results from proportional hazards models, which showed that women had a lower hazard of being summoned than men at earlier waiting times. However, this effect was time-dependent, as women’s hazard gradually approached that of men over time. All four accelerated failure time models support this finding that, as men’s hazard declined after an initial peak, women’s hazard gradually increased. This is illustrated in Figure 9, which displays the hazard and survival functions estimated in Model 8 for average men and women (i.e., individuals with all covariates set to observed mean values).
Log-normal hazard and survival functions for women and men as estimated in Model 8. Note the shift of the hazard function for women toward later times, corresponding to the higher $\mu $
parameter for women.
$\mu $
parameter for women.

In terms of time ratios, women’s estimated time until summons is delayed by a factor of 2.4, meaning that the expected waiting time for women was approximately 140 percent longer than for men. Similar to the Cox proportional hazards models, Model 7, which includes random effects for the day of trial, demonstrates a greater (and significant) improvement over a model with fixed effects only relative to Model 6. As a result, including both individual and day-of-trial random effects in Model 8 does not lead to any significant improvement over Model 7.
Overall, all findings (proportional hazards and accelerated failure time alike) agree that women were generally at lower risk of being summoned; however, this risk increased over time, while the risk for men decreased after an initial spike. This suggests a clear preference and heightened urgency in interrogating men over women. This trend persists even after accounting for the timing of discovery, the number of accusations, the number of family members accused of heresy, and potential unobserved factors across individuals and days. Together, these results provide compelling evidence of gender bias in the inquisitor’s investigative work.
Discussion
Our findings indicate that Inquisitor Albert of Castellario demonstrated a clear tendency to investigate men more thoroughly and prioritize their testimonies, even when comparable incriminating evidence existed for both genders. Yet, this raises a key question: what drove this disparity in the treatment given to men and women? Several factors may have contributed, including a possible change in venue, legal provisions, or a decline in the role of women within the Waldensian movement.
Vise (Reference Vise2018) found that in Bologna, around 1,300 men and women were interrogated in different venues, possibly influenced by contemporary conventions around confession, which bore similarities to inquisitorial depositions. Moore (Reference Moore2019) also noted that in Bologna during this period, inquisitors questioned men in the Dominican convent offices, while female witnesses were dealt with in the church or their homes. Similar practices were documented in civil trials in fourteenth-century Orvieto (Lansing Reference Lansing1997; Reference Lansing1998), Florence, and elsewhere (Feci et al. Reference Feci, Klapisch-Zuber, Lett and Rothstein2016; Laufenberg Reference Laufenberg2000). Lansing (Reference Lansing1997) suggests that such practices had doctrinal roots in religious beliefs about original sin, spread locally by mendicant friars. While we cannot completely rule out this possibility, we found no mention of venue differences in our records, suggesting that most questioning likely occurred in the castle of Giaveno (Merlo Reference Merlo1977: 128–29). Furthermore, given Giaveno’s small size, it seems unlikely that venue differences alone could have caused a significant time gap.
Another possible reason is that inquisitors might have minimized the importance of female suspects or primarily used their testimonies to confirm information already gathered from men. However, while civil legal provisions often restricted women’s access to certain governmental areas, they did not curtail their legal rights and obligations (Lansing Reference Lansing1997). Women were permitted to exercise legal rights, serve as witnesses, and initiate criminal proceedings in civil inquisitorial procedures, where their testimonies carried full weight (Blanshei Reference Blanshei2018; Laufenberg Reference Laufenberg2000; Vitiello Reference Vitiello2016). In our case, men and women received identical sets of questions, and their depositions were recorded with equal diligence, making it unlikely that women’s testimonies were meant to complement male testimonies any more than the testimonies generally complemented each other. Moreover, the inquisitor relied on information from women at the outset of the trial, a practice consistent with other inquisitorial proceedings (Biller Reference Biller, Benedetti and Cameron2022). Our analysis also showed that men and women provided similar numbers of names, suggesting no indication of the inquisitor sidestepping women due to comparatively lower information returns.
A third possible explanation is a decline in the role of women within the Waldensians. By the time of the Giaveno trial, it seems that women had largely lost their once-prominent role as wandering preachers. Any position they retained in the pastoral hierarchy was similar to that of nuns (Biller Reference Biller2001). This decline mirrors the process described by Abels and Harrison (Reference Abels and Harrison1979) regarding Cathar perfectae, who gradually became fewer until they nearly disappeared by the fourteenth century due to persecution. This context might have influenced Albert’s decisions. However, a close look at the testimonies reveals that some women still held prominent roles in the movement, such as Marguerita Borsseta, reported by 12 suspects as their initiator into heresy (no man was reported by more than four individuals as their initiator into heresy).
While Albert of Castellario’s procedural choices likely had no single cause, they were probably informed by the prevailing attitudes and mentalities of the time, which tended to reinforce gender asymmetries in legal and religious contexts (cf. Shahar Reference Shahar2001). Within the tight timeframe typically allotted to inquisitorial trials, a Dominican inquisitor might be expected to prioritize individuals holding a dominant social status. What appears certain, however, is that Albert managed the trial’s timeline in a way that prioritized the interrogation of men with greater urgency, even when women seemed equally implicated.
Conclusion
Historiography on medieval heretical movements has long examined both the appeal these movements held for women and the roles that women occupied within them (Abels and Harrison Reference Abels and Harrison1979; Arnold Reference Arnold2013; Green Reference Green, Erickson and Schweizer2017; Koch Reference Koch1962; McSheffrey Reference McSheffrey1995; Shahar Reference Shahar2001). Recently, the focus has expanded to explore how the Church’s persecution of these groups – and the inquisitors’ methods – have shaped modern historical interpretations (Biller Reference Biller, Minnis and Voaden2010, Reference Biller, Benedetti and Cameron2022; Vise Reference Vise2018). In light of existing discussions, this article focused on the impact of inquisitor Albert of Castellario’s investigation into the Waldensian community in Giaveno during the winter of 1335, an inquiry that led to the involvement of over 250 individuals in just over a month.
Our study contributes to the literature by developing a framework that draws on the concepts of census production (Emigh et al. Reference Emigh, Riley, Ahmed, de Leon, Martin, Misra and Janoski2020), tie appropriation (Headworth Reference Headworth2019), and detective discretion (Corsianos Reference Corsianos2003; Ericson Reference Ericson1981; Galligan Reference Galligan1990). Viewing the inquisitorial trial as an information-gathering exercise contingent upon the inquisitor’s discretion in deciding which leads to pursue, we used quantitative tools – including social network analysis (Borgatti et al. Reference Borgatti, Everett, Johnson and Agneessens2022) and survival methods (Mills Reference Mills2011; Singer and Willett Reference Singer and Willett2003) – to examine the importance attributed to informants’ gender and whether the inquisitor exhibited differing investigative attitudes toward men and women.
Our analyses yielded several findings. First, an examination of accusations reported by the 110 testifiers revealed no significant differences in the number of individuals that each gender reported, with both men and women being more likely to report men. While gender segregation may have characterized heretical networks (Biller Reference Biller, Minnis and Voaden2010), it did not prevent substantial cross-gender reporting. Second, men’s accusations appear to have had a greater impact on the trial overall, as indicated by the number of individuals reached in their absence. Yet this difference in influence seems amplified by the inquisitor’s actions, such as a heightened scrutiny of certain men. Finally, survival analyses of the summonses showed that men were cited sooner and more promptly after being accused, even when ample numbers of suspects of both genders were available throughout the trial and controlling for aggravating circumstances. Together, these results point to a gender bias stemmed not from procedural factors (like venue logistics or legal restrictions, as previous studies have suggested), but rather from medieval social hierarchies that shaped the inquisitor’s operational priorities – systematically favoring male suspects in both timing and investigative attention.
Our study presents itself as an initial foray and, given that it focuses on a single case study, its findings should be interpreted cautiously. However, it is noteworthy that our results challenge the prevailing narrative in sociology and history, which identifies scapegoating – particularly of women and other vulnerable groups – as a central factor in religious persecution (Erikson Reference Erikson2005; Jensen Reference Jensen2007; Roper Reference Roper2004). This narrative seems largely based on analyses of later persecutions, especially the witch trials of the early modern period (Leeson and Russ Reference Leeson and Russ2018). One could argue that, in that context, persecuting vulnerable groups played a more instrumental role in symbolically restoring social order and demonstrating authority than it had done in the High and Late Middle Ages. Future research could examine whether gendered persecution patterns evolved across different historical periods, particularly in relation to macro-level transformations like state formation, elite power struggles, or the transition from feudalism to capitalism (Federici Reference Federici2004).
Another line of inquiry our study opens concerns the potential for institutional changes within religious heterodox movements as an adaptation to sustained – and potentially gender-biased – persecution (Moore Reference Moore2012). For instance, in the Waldensian movement, Biller (Reference Biller2001, Reference Biller, Minnis and Voaden2010) has observed that women increasingly undertook the specialized task of preserving the history of the movement within their local communities. While such a gendered “division of labor” within these movements is often attributed to endogenous development or scriptural fundamentalism (McSheffrey Reference McSheffrey1995), some of these adaptations may respond to external pressures (Abels and Harrison Reference Abels and Harrison1979: 233–40), particularly gendered patterns of persecution. A productive avenue for future research could be to explore whether religious groups that have faced more gendered persecution in the past develop distinct, specialized roles for men and women over time as an adaptive strategy.
Moreover, the framework and methods presented here should not be viewed as limited to gender alone. For instance, a contentious question surrounding the Cathar movement pertains to whether its persecution was politically motivated or driven by power dynamics rather than purely religious motivations (Reference PeggPegg 2001; Rehr Reference Rehr2019). Provided that information on social status or professions is available, our framework can readily be applied to examine whether inquisitors like Bernard de Caux and Jean de Saint-Pierre exhibited biased attitudes toward nobility and other powerful individuals during their investigations in thirteenth-century Languedoc.
As with any study, ours has its limitations. In terms of data, this case study lacks information on multiple dimensions that may have influenced the inquisitorial process. For example, records provide minimal details on subjects’ occupations or possible patronage ties, and they seldom offer clues about individuals’ ages beyond relative chronology in specific cases. The fama (reputation) of the witnesses – their perceived trustworthiness or importance in the inquisitor’s view – is also unrecorded. It is important to emphasize, however, that while these factors may have played a decisive role in the civil criminal inquisition (Laufenberg Reference Laufenberg2000), they may not have been as significant in anti-heretical inquisitions, where inquisitors ideally sought information by whatever means available.
In addition, external influences may have affected the inquisitor’s approach. The abbot, who served as lord of Giaveno, and the castellan, both closely collaborated with the inquisitor, potentially shaping aspects of the trial process. Moreover, Albert of Castellario’s aides may have impacted his decision-making, but little is known about these assistants’ roles or their involvement in his inquiries (cf. Moore Reference Moore2019). Finally, while it is unlikely that subjects without explicitly dated summonses were treated differently from those with exact dates, these dates were inferred for two-thirds of the individuals involved, which introduces another layer of uncertainty.
Regarding methodology, both social network analysis and survival analysis introduce certain limitations. Our network analyses, for instance, are based on the network reconstructed from testimonies in the inquisitorial process, which is shaped by the procedure itself. As a result, the network we analyze likely does not fully represent the heretical community in Giaveno or its true structural characteristics, as it may exclude connections unreported or undiscovered during interrogations. Survival analysis, on the other hand, requires a clear entry point into the risk set – for this study, the first mention of an individual to the inquisitor. However, this entry point led to the exclusion of 11 out of 90 cases (12.2 percent) where individuals were summoned before or on the same day as their initial mention. Despite these limitations, the observed effects remain robust, implying that additional, unaccounted-for factors are unlikely to alter our findings.
Inquisitors operated within a complex web of constraints stemming from legal norms (Blanshei Reference Blanshei2018; Laufenberg Reference Laufenberg2000; Vitiello Reference Vitiello2016), more or less established practices (Lansing Reference Lansing1997; Moore Reference Moore2019; Vise Reference Vise2018;), and the dynamics of their interactions with the individuals they scrutinized (Estévez et al. Reference Estévez, Salihović and Sgourev2024; Given Reference Given1997), not to mention the explicit or unstated goals of the organization they represented (Rehr Reference Rehr2019). Despite all this, previous studies have not adequately emphasized that they were men of their time, embodying (perhaps, even excessively) the underlying societal attitudes toward gender roles (cf. Shahar Reference Shahar2001). Such attitudes, in interaction with the actions of the persecuted communities, might have led to unintended outcomes in both the short and long run, ranging from incomplete or partial coverage of the heretical groups they aimed to eradicate to the gradual reshaping of such movements (Abels and Harrison Reference Abels and Harrison1979), potentially resulting in shifts in the roles and visibility women had within them.
Data availability statement
The data and code required to reproduce the analyses in this study are publicly available at https://github.com/joseluisesna/Heretic_women_in_Giaveno_1335.
Funding
The authors acknowledge support from the European Research Council (ERC) under the European Union’s Horizon 2020 research and innovation program (grant agreement no. 101000442, project “Networks of Dissent: Computational Modelling of Dissident and Inquisitorial Cultures in Medieval Europe”). José Luis Estévez was also supported by the Research Council of Finland (AKA) (grant numbers 360022 and 364382).












 Open access

