


Introduction
The concept of social enterprise encompasses ‘a variety of legal forms and statuses, ranging from existing legal forms (e.g., associations, foundations, cooperatives), to new legal forms exclusively designed for social enterprises’ (European Parliament, 2021, p. 1). Nonprofits engaging in economic activities can be considered a type of social enterprise (Defourny et al., Reference Defourny, Nyssens and Brolis2021; Diaz et al., Reference Diaz, Marcuello and Nogales2020). In some contexts, such as the USA, the emergence of social enterprises was associated with revenue diversification in response to cuts in public funding (Kerlin, Reference Kerlin2009). In the European context, Suykens et al., (Reference Suykens, George, De Rynck and Verschuere2021, p. 1460) highlight that revenue diversification suggests that ‘external stakeholders increasingly perceive social enterprises—and thus, commercial activity—as a norm for nonprofit organizing’. Additionally, Brown (Reference Brown2018, p. 976) explains that this evolution toward the social enterprise model evidenced by the generation of commercial income is the result of ‘the interaction between sociopolitical developments and organizational change’.
Traditionally, in the Mediterranean context, nonprofits have relied on public grants, with donations being a stable source of funding (Third Sector Impact, 2020). However, Mediterranean nonprofits have bet on commercial income as a way to answer changes in the organizational culture in these entities over the last few years. These changes have been driven by pressure from the European Union (EU), which has introduced new regulations for social enterprises. Nevertheless, no prior studies have analyzed the role of the different dimensions of the social enterprise model, as defined by the EU, in the context of Mediterranean nonprofits. In particular, we explore the hypothesis that decreasing public funding in nonprofits may have motivated the adoption of the social enterprise model, resulting in an evolution toward revenue diversification through commercialization. Moreover, we detect a gap in the literature that specifically connects the economic, social and governance dimensions of social enterprises with revenue generation, contextual factors and organizational characteristics. By examining the three dimensions behind this model, we seek to understand the factors driving this evolution.
Consequently, our aim is to uncover the social enterprise behaviors of nonprofits that have evolved toward income commercialization. To do so, we analyzed a sample of 170 Spanish nonprofits over the period 2008–2018. The study makes both empirical and theoretical contributions to the existing literature. Empirically, we demonstrate that revenue diversification, particularly through commercial income, is associated with certain dimensions of the social enterprise model as defined by the EU. Theoretically, we link the economic, social and governance dimensions of the social enterprise model with organizational theories to explain this evolution. Finally, we show that the adoption of certain aspects of the social enterprise model is influenced by both institutional and organizational factors.
This paper proceeds as follows: “Literature review and hypotheses” section provides a literature review and establishes the hypotheses. “Methodology” section describes the sample, variables, and methodology. “Results” and “Discussion” sections present and discuss results. Finally, “Contributions, limitations, and future research agenda” section highlights contributions, limitations, and future research.
Literature Review and Hypotheses
Social Enterprise Concept in the EU Context
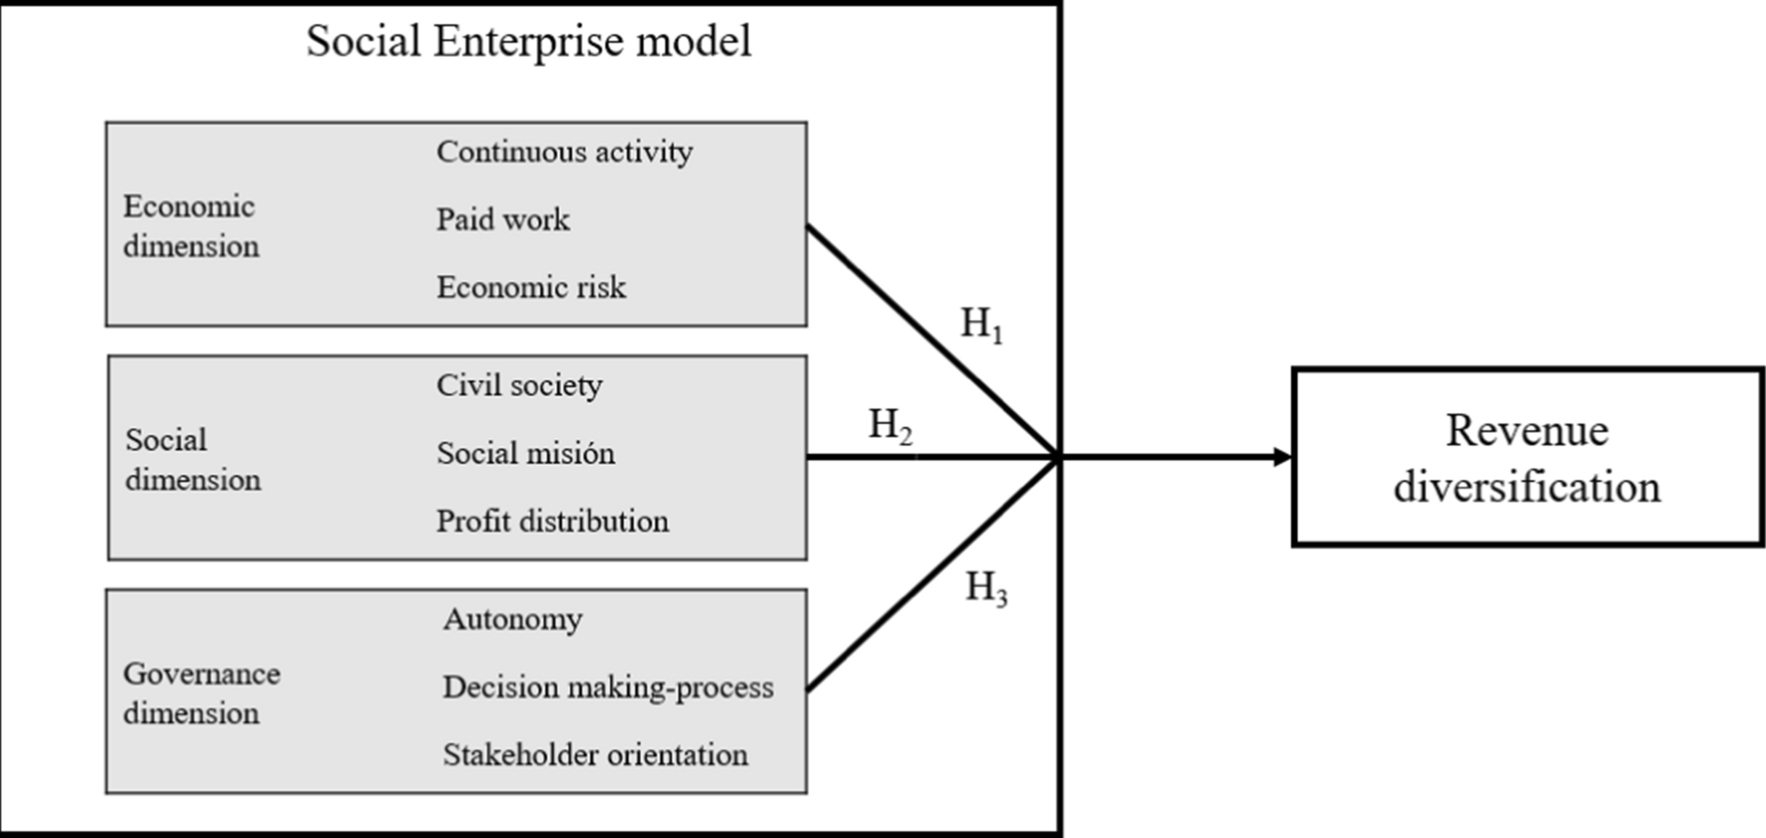
There is a lack of universal or regional consensus on the definition of social enterprise among academia and institutions, despite its importance (Defourny et al., Reference Defourny, Nyssens and Brolis2021). According to Kerlin (Reference Kerlin2006, Reference Kerlin2012), this disagreement is due to cultural traditions, social values, and legal frameworks, leading to differing American and European understandings of the concept of social enterprise. Specifically, in the EU, the EMES network has proposed defining a social enterprise through three dimensions: economic, social, and governance (European Commission, 2020).
A recognized type of social enterprise in this context is a nonprofit that engages in commercial activities to financially support its social mission (Defourny et al., Reference Defourny, Nyssens and Brolis2021; Diaz et al., Reference Diaz, Marcuello and Nogales2020; Fitzgerald & Shepherd, Reference Fitzgerald and Shepherd2018; Ko & Liu, Reference Ko and Liu2021). These organizations, referred to as entrepreneurial nonprofits, are characterized by their proactive social innovation and willingness to assume the risks associated with economic activities (Helm & Anderson, Reference Helm and Anderson2010). These nonprofits are based on the social and economic dimensions, and are managed through inclusive governance (Nyssens, Reference Nyssens and Kerlin2009). Fitzgerald and Shepherd (Reference Fitzgerald and Shepherd2018) associate the development of these dimensions to various institutional logics, which are the overarching principles that guide an organization (Greenwood et al., Reference Greenwood, Oliver, Lawrence and Meyer2017). However, the tensions between these logics can pose challenges for entrepreneurial nonprofits, such as choosing between collaborative or competitive tactics and balancing social and economic values. To overcome these challenges, inclusive governance that prioritizes high levels of autonomy and stakeholder participation in decision-making processes is essential (European Commission, ).
In summary, entrepreneurial nonprofits result from the reorientation of traditional nonprofits toward the market. They maintain their social objectives while utilizing diverse financial resources, and they are able to integrate economic and social logics in their decision-making processes.
Revenue Diversification as a Result of the Adoption of the Social Enterprise Model
Traditionally, nonprofits have relied on a mix of income sources to develop their social activities (von Schnurbein & Frizt, Reference von Schnurbein and Fritz2017). Revenue diversification involves developing multiple revenue streams to reduce dependence on any one source of funding (Lu et al., Reference Lu, Lin and Wang2019). A diversified income structure generates some desirable effects for nonprofits. According to modern portfolio theory, a diversified income structure increases stability and reduces financial risk (Grasse et al., Reference Grasse, Whaley and Ihrke2016; Kingma, Reference Kingma1993; Qu, Reference Qu2016). Diversification also decreases the possible dependency on a specific funder, which is in line with resource dependence theory (Berret & Holliday, Reference Berrett and Holliday2018). If a nonprofit relies on diverse revenue sources, it will be able to gain self-sufficiency, autonomy, and independence (Carroll & Stater, Reference Carroll and Stater2009). From the institutional theory perspective, Tucker (Reference Tucker2010, p. 22) considers that coercive, mimetic and normative isomorphisms explain revenue diversification.Footnote 1 Additionally, from the resource-view perspective, a diversified income structure increases legitimacy and recognition in the community (Bielefeld, Reference Bielefeld1992) and promotes social entrepreneurship (Fitzgerald & Shepherd, Reference Fitzgerald and Shepherd2018; Ko & Liu, Reference Ko and Liu2021). However, diversification can affect organizational efficiency, increase administrative and fundraising costs and lead to tensions among stakeholders (Chikoto & Neely, Reference Chikoto and Neely2014; Guan et al., Reference Guan, Tian and Deng2021; Young, Reference Young2007). Consequently, both organizational and institutional factors influence the level of revenue diversification (Kerlin & Pollak, Reference Kerlin and Pollak2011; Suykens et al., Reference Suykens, De Rynck and Verschuere2019a, Reference Suykens, George, De Rynck and Verschuere2021).
Revenue diversification is particularly important in the context of decreasing public funding, which has led to many nonprofits seeking alternative sources of revenue. Brown (Reference Brown2018) links the evolution of some nonprofits toward revenue diversification to complex sociological and institutional challenges in the USA over the last century. This evolution was especially relevant during the economic crisis in the 1970s, which led to cutbacks in government funding in this context (Kerlin & Gagnaire, Reference Kerlin, Gagnaire and Kerlin2009, p. 95). A similar situation occurred in the European context following the sovereign debt crisis that began after the 2008 global financial crisis (Wilsker & Young, Reference Wilsker and Young2010, p. 194). This situation was critical in some Mediterranean countries inside the EU, where nonprofits traditionally relied more on public funds than their American counterparts did (von Schnurbein & Hengevoss, Reference von Schunrbein and Hengevoss2020). Consequently, the economic situation together with institutional and normative changes that have taken place in the EU may have motivated the evolution toward diversification in EU-member Mediterranean countries. This process of diversification implies a change in the mix of revenues used by the nonprofit. In this sense, in the Canadian context, Gras and Mendoza-Abarca (Reference Gras and Mendoza-Abarca2014, p. 395) consider that ‘philanthropic donations are one of the most unstable sources of income for nonprofits, and government grants, though fairly stable source, can be withdrawn suddenly due to budgetary considerations’. Facing this situation, nonprofits have then diversified their income structure through commercialization. Hung & Berret (Reference Hung and Berrett2022) define commercialization as earned income derived from selling goods and providing services, which includes dues, assessments and income from special events. According to Mikolajczak (Reference Mikołajczak2018, p. 765) ‘one of the ways to diversify a nonprofit organization’s revenues is to obtain them from a commercial sale of good and services in return for payment’. Similarly, Álvarez-González et al., (Reference Álvarez-González, García-Rodríguez, Rey-García and Sanzo-Perez2017, p. 116), in the South-European context, point out ‘the development of commercial activities as a core or supplementary source of funding (…) to ensure nonprofit survival and mission accomplishment’. Commercialization can provide additional resources for nonprofits to maintain their structure, and introduce flexibility into their work (Gopakumar, Reference Gopakumar2022; Lu et al., Reference Lu, Guan and Dong2022; Monzón et al., Reference Monzon, Antuñano, Chaves and Soler2022; Yan et al., Reference Yan, Mmbaga and Gras2022).
Revenue diversification via commercialization involves changes in the social and governance dimensions of nonprofit organizations. In this specific context, in relation to the social dimension, commercialization cannot mean that the nonprofit organization starts requiring a payment for the same services (Art. 26 Law 50/2002). On the contrary, the nonprofit organization must provide additional services, which will imply some changes in the social mission and programs (Suykens et al., Reference Suykens, George, De Rynck and Verschuere2021). Additionally, the provision of new programs will imply changes in the governance system, which are related to the emergence of new stakeholders (Zhu et al., Reference Zhu, Ye and Liu2018). Both changes are associated with a process of revenue diversification via commercial income. This process of revenue diversification would be the result of the adoption of the social enterprise model.Footnote 2 This adoption is a response to decreasing public funding, allowing nonprofits to engage in commercial activities that generate revenue while furthering their social mission.
Hypotheses
The social enterprise model was already present before the 2008 global financial crisis (European Commission, 2011). Previous studies have analyzed the relationship between revenue diversification and each dimension of the social enterprise model in isolation. For instance, in relation to the economic dimension, Eikenberry and Kluver (Reference Eikenberry and Kluver2004), Gainer and Padanyi (Reference Gainer and Padanyi2002, Reference Gainer and Padanyi2005), Mahmoud and Yusif (Reference Mahmoud and Yusif2012), Maier et al. (Reference Maier, Meyer and Steinbereithner2016) and López-Arceiz et al. (Reference López-Arceiz, Bellostas and Rivera2017) have studied revenue diversification as a part of the commercialization process of nonprofits. These authors conclude that revenue diversification is positively related to the economic dimension, although it can generate tensions associated with the level of risk, the social mission, and the internal organization (Chad et al., Reference Chad, Kyriazis and Motion2013, Reference Chad, Kyriazis and Motion2014; Suykens et al., Reference Suykens, De Rynck and Verschuere2019b). However, the analysis of a dimension in isolation provides only a partial perspective that does not address the social enterprise model as defined in some specific contexts, as is the case in Mediterranean countries in the EU. Moreover, in this context, diversification process via commercialization is related to changes in terms of social and governance dimensions as we explained in the previous section. Therefore, when examining the interaction with revenue diversification, it is necessary to consider the social and governance dimensions.
The social dimension encompasses the integration of civil society, the establishment of a clear social mission, and limited profit distribution. There are some differences between the explicit social aim and the integration of civil society in social enterprises and traditional nonprofits. For example, in some Mediterranean regions, a nonprofit can be established to serve solely one person, according to the founder's wishes (Art. 3 Law 10/1996—Spain-). In this case, the expansion of the provided services from just one person to a group of people represents a move toward the social enterprise model in the social dimension of the nonprofit. Mitchell (Reference Mitchell2014) and Clifford and Mohan (Reference Clifford and Mohan2016) find that the participation of civil society can also enhance a diversified income structure by involving different economic and social actors. Furthermore, certain social missions and programs can lead to an increase in revenue diversification (Young, Reference Young2007), especially through commercial revenues (Suykens et al., Reference Suykens, George, De Rynck and Verschuere2021). Limiting profit distribution demonstrates the alignment of the social program with the mission, and promotes organizational autonomy and independence in funding sources (Beaton & Dowin, Reference Beaton and Dowin2021; Khieng & Dahles, Reference Khieng and Dahles2015; Spiess-Knafl & Jansen, Reference Spiess-Knafl and Jansen2014).
Additionally, Zhu et al. (Reference Zhu, Ye and Liu2018), von Schnurbein and Fritz (Reference von Schnurbein and Fritz2017), and Lu (Reference Lu2015) relate a diversified income structure to a governance system based on stakeholder participation. Again, there are some differences between traditional nonprofits and social enterprises in this dimension, especially in Mediterranean countries. For instance, the board of trustees must be democratic in their operations, but not necessarily in its composition, which can limit stakeholder participation (Art. 14.1 Law 50/2002- Spain -, Art. 26 Law 24/2012—Portugal—and Part V Civil Code—Italy). Some traditional nonprofits may go beyond the minimum requirement set by law, but this is not mandatory. In contrast, the social enterprise model adopted by the EU emphasizes stakeholder communication, democratic governance, shared consensus, and commitment to the organization's purpose as key elements in the governance of social enterprises. Indeed, the governance dimension embodies the dual institutional logics behind the social enterprise model (Fitzgerald & Shepherd, Reference Fitzgerald and Shepherd2018). However, there is a lack of studies that adopt an approach based on both the social enterprise model dimensions proposed by the EU and a focus on Mediterranean countries, where social enterprises have shown a unique pattern. Therefore, we propose the following hypotheses:
H1
Revenue diversification in Mediterranean nonprofits is positively related to the economic dimension of the European social enterprise model.
H2
Revenue diversification in Mediterranean nonprofits is positively related to the social dimension of the European social enterprise model.
H3
Revenue diversification in Mediterranean nonprofits is positively related to the governance dimension of the European social enterprise model.
Figure 1 illustrates the theoretical model presenting revenue diversification through commercialization as a result of the adoption of the three dimensions of the social enterprise model in response to decreased public funding.
Working hypotheses
Methodology
Sample
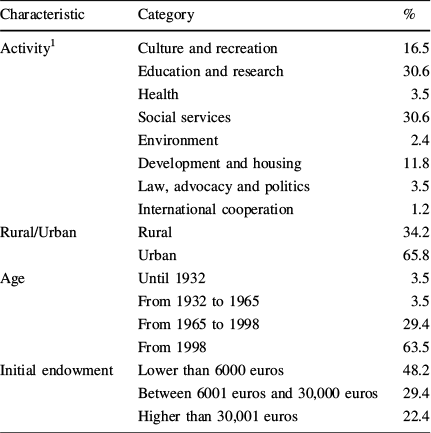
We analyze 387 active nonprofits located in a Mediterranean EU country.Footnote 3 Specifically, the nonprofits are located in Aragón, a medium-sized (47,669 km2) northeast region of Spain. We accessed financial statements on record with the regional government’s Department of Justice during the period 2008–2018. They can be considered social enterprises, as entrepreneurial nonprofits, according to EU concept (European Commission, 2020). Moreover, in the spring of 2019, we emailed a questionnaire to the managers of the nonprofits to assess the implementation of the social enterprise model. We set the deadline for receiving replies to three months. We received 170 valid surveys. Table 1 summarizes the characteristics of the participants.
Sample characteristics
Characteristic |
Category |
% |
|---|---|---|
Activity1 |
Culture and recreation |
16.5 |
Education and research |
30.6 |
|
Health |
3.5 |
|
Social services |
30.6 |
|
Environment |
2.4 |
|
Development and housing |
11.8 |
|
Law, advocacy and politics |
3.5 |
|
International cooperation |
1.2 |
|
Rural/Urban |
Rural |
34.2 |
Urban |
65.8 |
|
Age |
Until 1932 |
3.5 |
From 1932 to 1965 |
3.5 |
|
From 1965 to 1998 |
29.4 |
|
From 1998 |
63.5 |
|
Initial endowment |
Lower than 6000 euros |
48.2 |
Between 6001 euros and 30,000 euros |
29.4 |
|
Higher than 30,001 euros |
22.4 |
1Based on Salamon and Anheier (Reference Salamon and Anheier1997)
The most common activities were social services and education/research (30.6%), concentrated in the main cities (65.8%). A majority of the sample nonprofits were recently created (63.5%) with initial endowments of less than €6000 (48.2%).
Main Variables
Income Structure
We considered four sources: (a) private donations, (b) government funding, (c) commercial income and (d) income from investments (Ecer et al., Reference Ecer, Magro and Sarpça2017; Froelich, Reference Froelich1999; Lee, Reference Lee2021; von Schnurbein & Fritz, Reference von Schnurbein and Fritz2017). According to Frumkin and Keating (Reference Frumkin and Keating2011), Chikoto and Neely, (Reference Chikoto and Neely2014) and (Qu, Reference Qu2016), we use three diversification indices—Herfindahl–Hirschman normalized index (HHNI), entropy index, diversification ratio—(1–3),
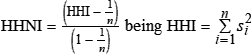
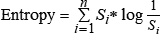

where S i represents the weight of the i-th income source over the total income sources (i = 1 private donations, 2 public funding, 3 commercial income, 4 income from investments). The HHNI and C2 indices indicate a concentrated structure when their values are one, and the entropy index indicates a concentrated structure when its value is zero.
A second strategy to study income structure is based on modern portfolio theory (Kingma, Reference Kingma1993), where the level of risk is the weighted sum of the variance and covariance of its individual revenue streams (4, 5),
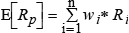
Expression (5) measures the volatility of income sources with respect to the level of diversification observed in the financial structure. High volatility indicates diversification in income sources.
Social Enterprise Model
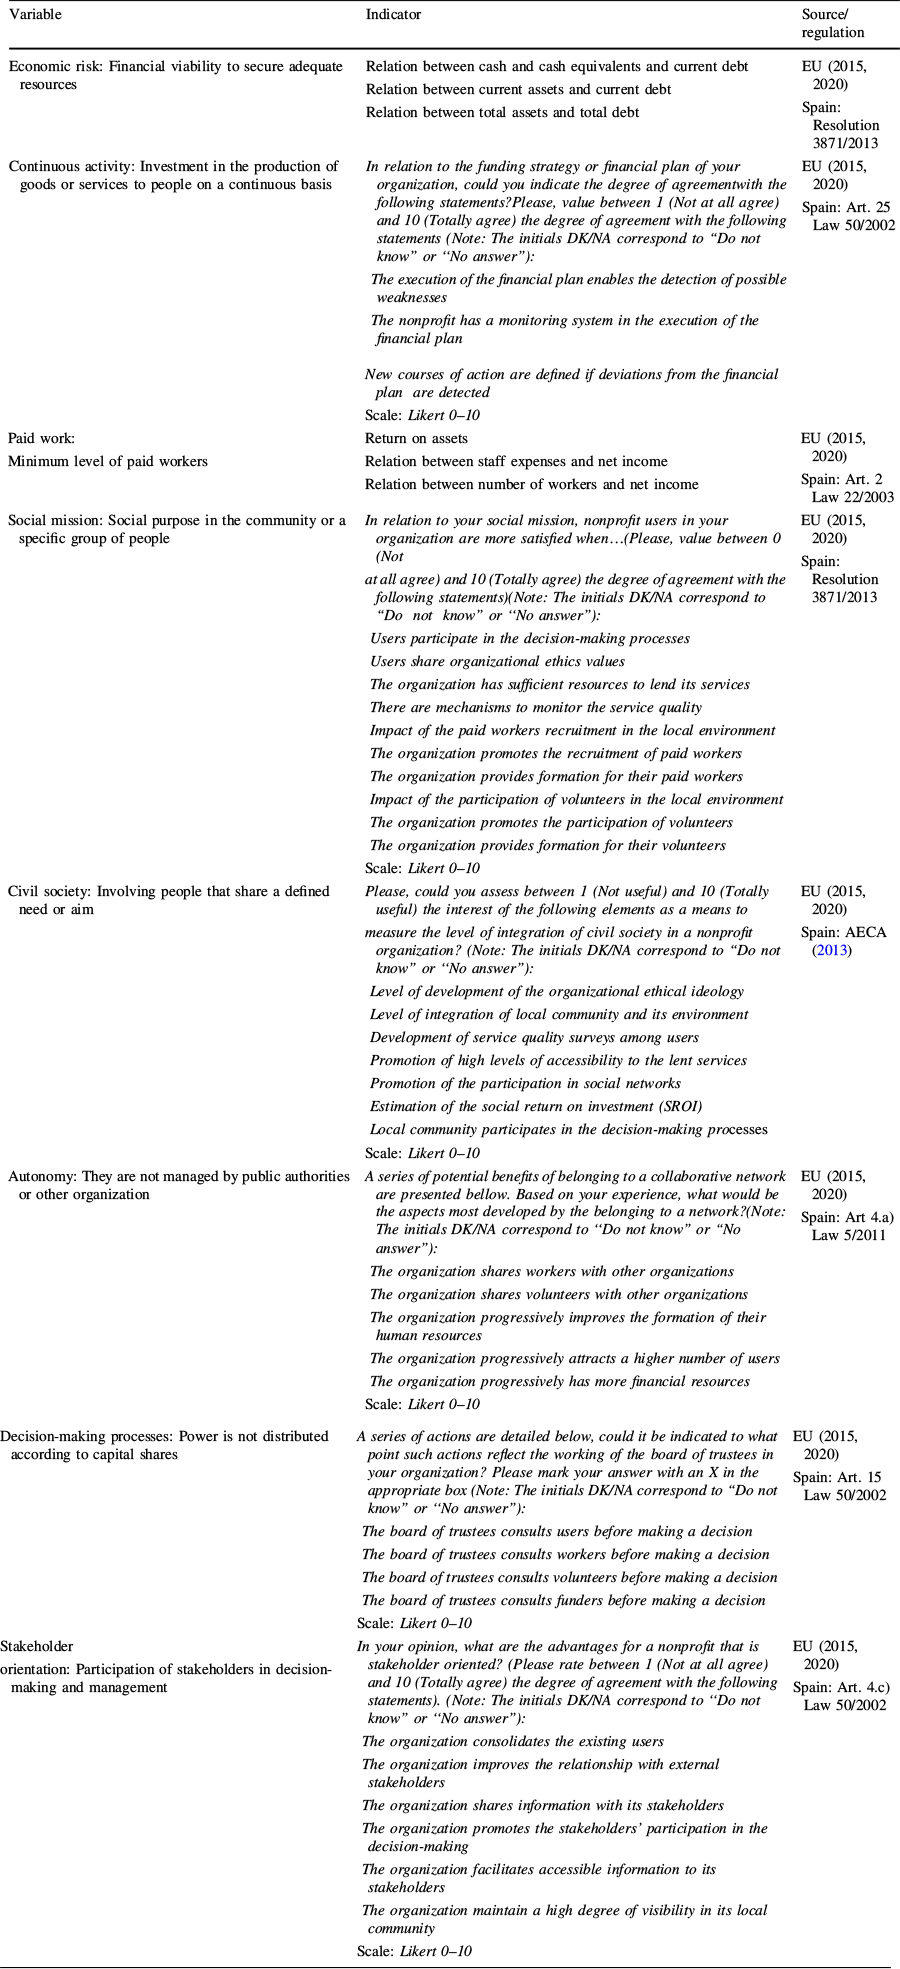
We used both a questionnaire and the financial statements of the sample nonprofits to identify the main characteristics of the social enterprise model. The economic dimension assumes engagement in continuous economic activities (European Commission, 2015, 2020). The EMES approach (Borzaga & Defourny, Reference Borzaga and Defourny2001) bases this dimension on three aspects: economic risk (ED1), continuity in the activity (ED2), and level of paid work (ED3).
The second dimension is the social aspect. The European Commission (2015, 2020), using the EMES approach, highlights the following: (a) development of the social mission (SD1) and (b) participation of civil societyFootnote 4 (SD2). The third aspect, which is associated with the limitations in relation to profit distribution, is implicit in the nonprofit legal form.
The final dimension we considered is governance, defined by the European Commission (2015, 2020) as ‘the specific governance structures to safeguard their social missions’. Using the EMES proposal, the European Commission (2015, 2020) considers three aspects: (a) autonomy (MD1), (b) decision-making processes (MD2), and (c) stakeholder orientation (MD3).
Appendix 1 provides more details about the variables, indicators, sources, and measurement scales used.
Control Variables
We included variables related to the promoter type, user type, activity, and purpose of the nonprofit. Fischer et al. (Reference Fischer, Wilsker and Young2011), Powell and Sandholtz (Reference Powell and Sandholtz2012), and Pache and Santos (Reference Pache and Santos2013) indicate that the type of promoter influences the creation of social enterprises. We differentiated four categories: private sector, public sector, third-sector, and mixture. The type of user and activity can also influence revenue diversification (Defourny & Nyssens, Reference Defourny and Nyssens2008). In this study, we considered four types of users (children, adolescents, adults, and elderly people) and five types of activities (culture and recreation, education and research, health and social services, environment and development, and others). Finally, the operational and strategic purposes reflect organizational culture and ethical values (Aschari-Lincoln & Jäger, Reference Aschari-Lincoln and Jäger2016). We evaluated ten possible categories: disadvantaged people, user satisfaction, service quality, market competition, community development, ethical values, networking, worker satisfaction, volunteer satisfaction, and political influence.
Statistical Techniques
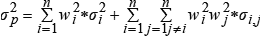
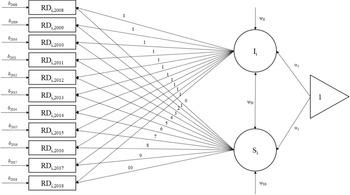
We began with a descriptive analysis. After examining the covariance matrix, we conducted a confirmatory factor analysis to examine the dimensional structure of the theoretical constructs and obtain the factor scores. Additionally, we specified a latent growth model in which we estimated the starting point (intercept) in 2008 and the evolution (slope) of the income structure during the sample period (2008–2018). Figure 2 illustrates the specifications of the model in a path diagram.
Path diagram
RD i,t represents the i revenue diversification indicator in period t, δ t represents the measurement error, I i and S i are the intercept and slope, respectively, while ψ and α represent the covariance matrix and means. Finally, we obtained the factor scores for the latent growth variables, intercept (I i), and slope (S i).
After this analysis, we estimated the structural model, which relates the latent variable representing the evolution (slope) of the income structure, the factor scores estimated in the confirmatory factor analysis, and the control variables (6):

where
 represents the evolution of the income structure, defined as the slope of diversification indices.
 and
and
 represent the dimensions of the social enterprise model. Finally,
 , and
, and
 represent the parameters of the structural model.
To test differences between nonprofits, we performed a discriminant analysis method (Tabachnick & Fidell, Reference Tabachnick and Fidell2013). The social enterprise dimensions extracted from the confirmatory factor analysis were used as characteristics/variables, and a categorical variable was defined as whether the nonprofit was diversified (Si) above or below the median value for the full sample. This specification showed whether the interactions with the social enterprise dimensions were stronger based on the level of revenue diversification. The sample size, absence of multivariate normality, formative indicators, and dependence between the observations determined the statistical techniques used (López-Arceiz et al., Reference López-Arceiz, Bellostas and Rivera2017).
Controlling for Biases
We adopted ex ante and ex post measures to prevent and reduce potential respondent biases. Further details on these measures can be found in the supplementary material accompanying this publication.
Results
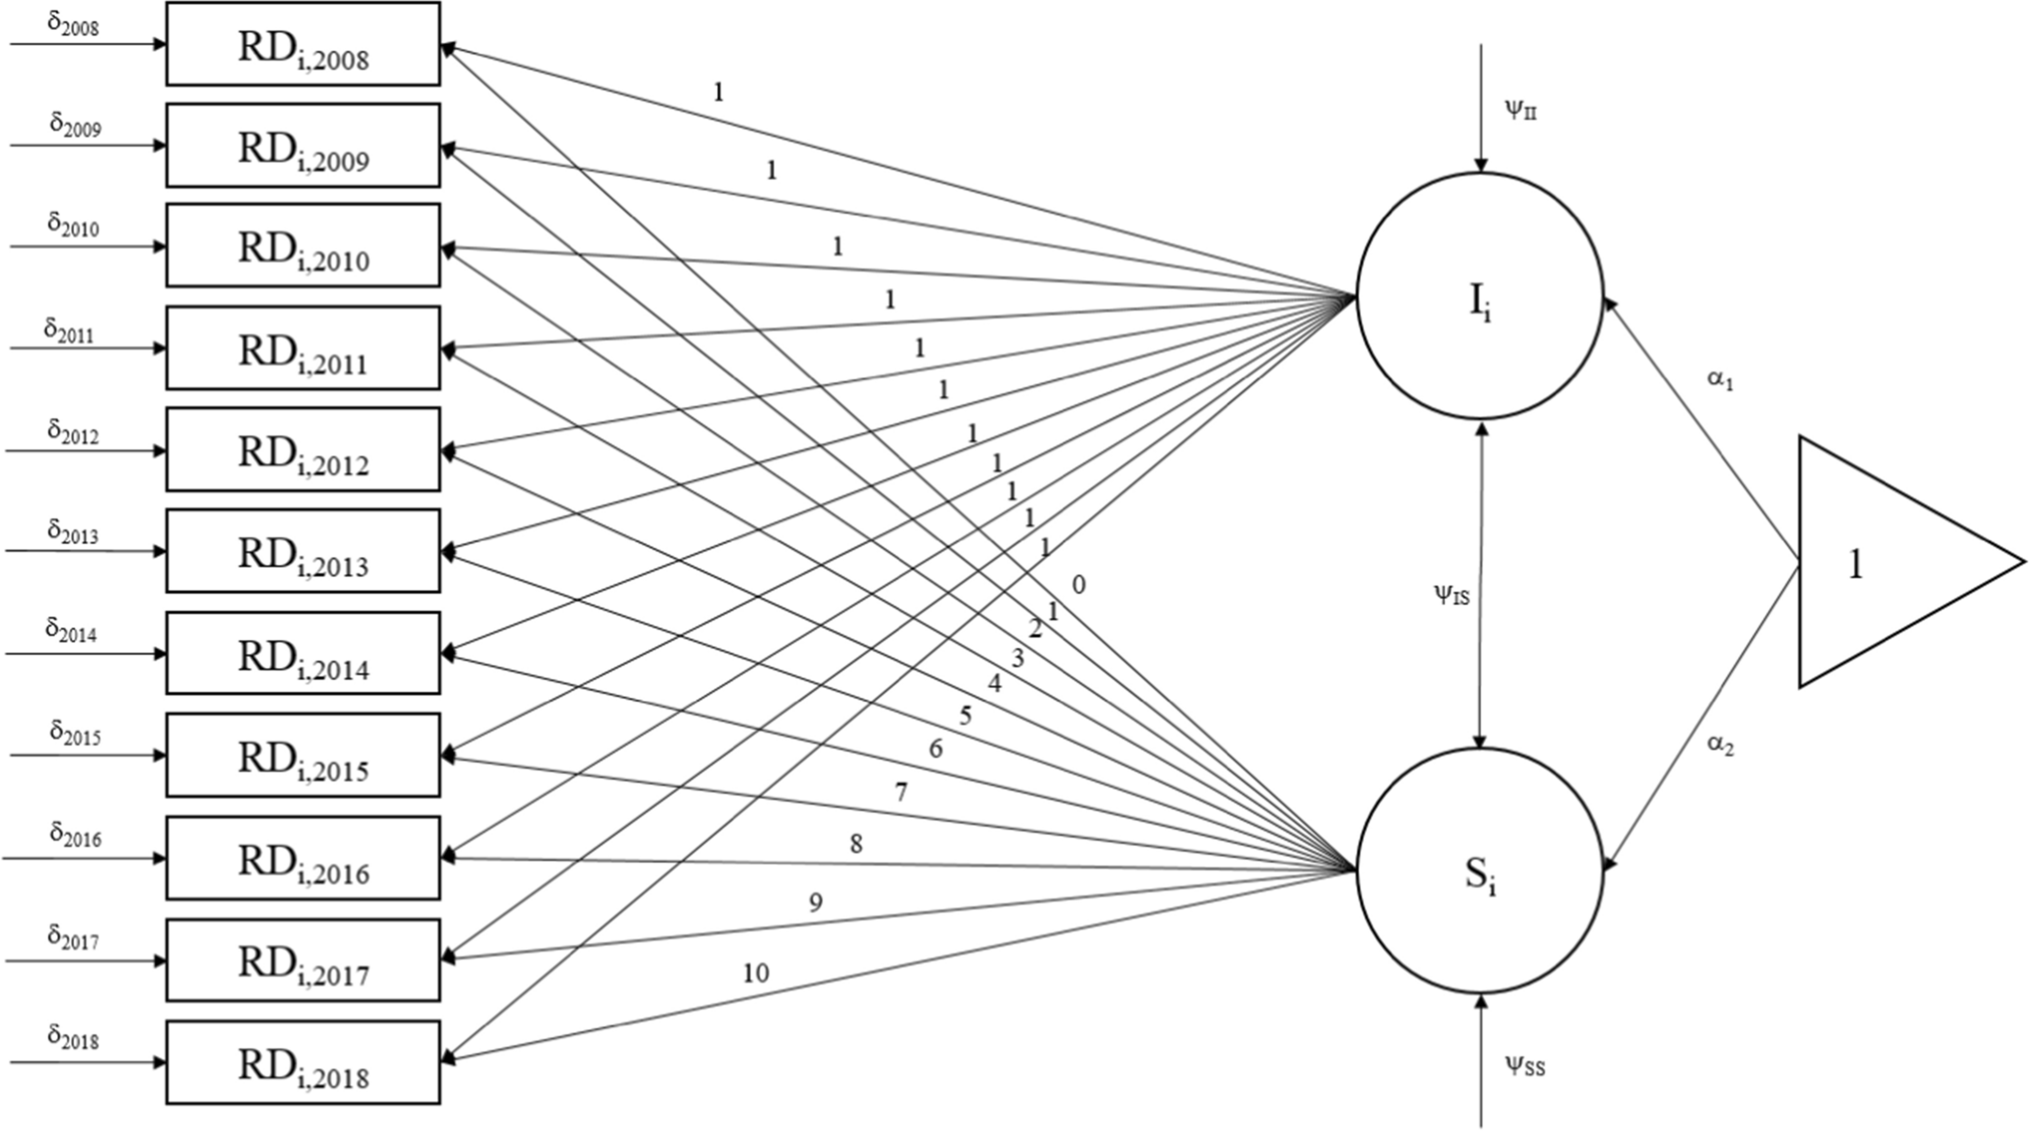
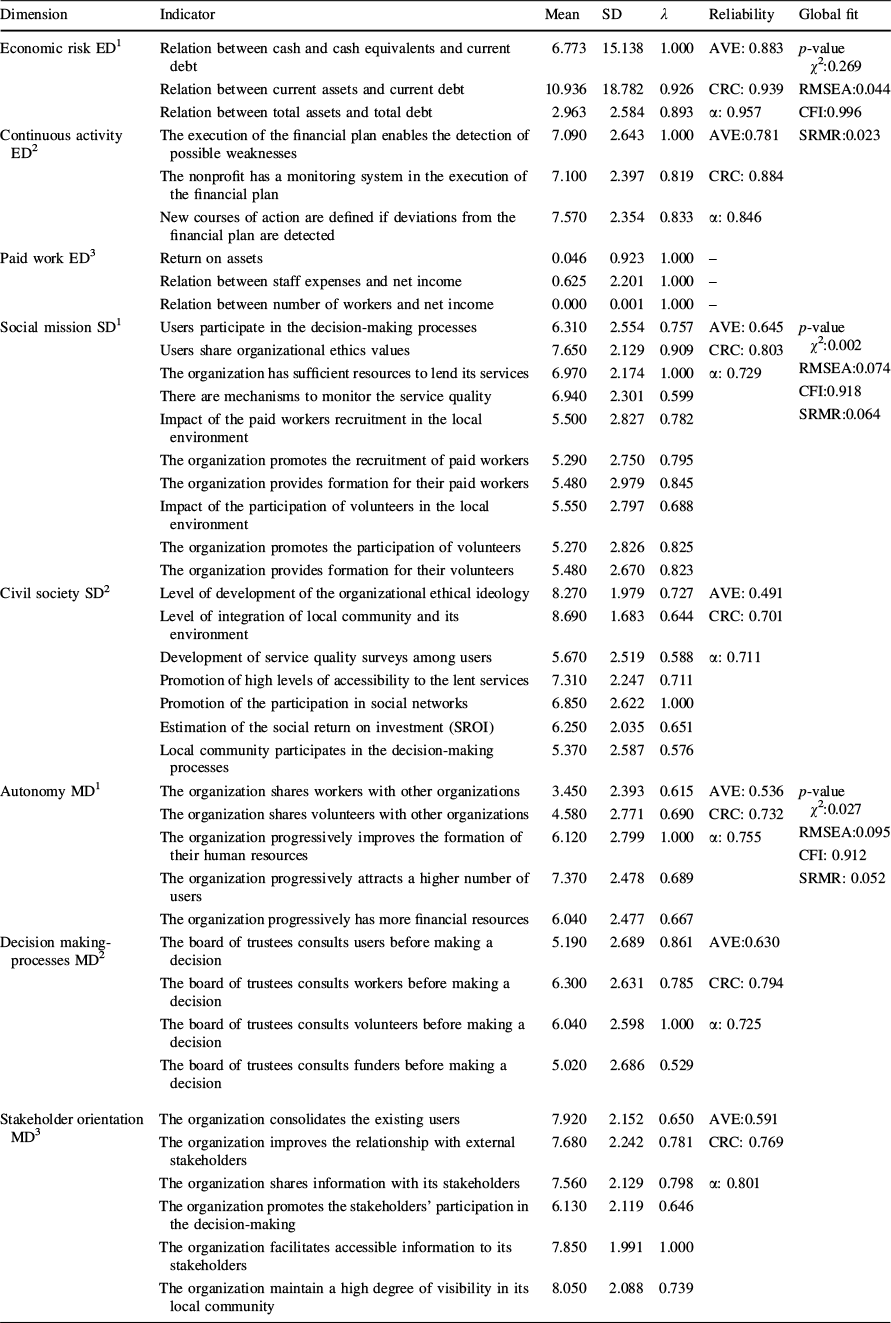
Table 2 displays the descriptive statistics of the sample entities. We observe that they maintained positive levels of liquidity, solvency and economic return. They developed continuous activity through their financial plans. The indicators for the social dimension had a mean higher than five. The governance dimension also revealed high levels of autonomy, with a focus on being stakeholder oriented and implementing participatory decision-making processes.
Descriptive statistics and measurement model
Dimension |
Indicator |
Mean |
SD |
λ |
Reliability |
Global fit |
|---|---|---|---|---|---|---|
Economic risk ED1 |
Relation between cash and cash equivalents and current debt |
6.773 |
15.138 |
1.000 |
AVE: 0.883 |
p-value χ 2:0.269 RMSEA:0.044 CFI:0.996 SRMR:0.023 |
Relation between current assets and current debt |
10.936 |
18.782 |
0.926 |
CRC: 0.939 |
||
Relation between total assets and total debt |
2.963 |
2.584 |
0.893 |
α: 0.957 |
||
Continuous activity ED2 |
The execution of the financial plan enables the detection of possible weaknesses |
7.090 |
2.643 |
1.000 |
AVE:0.781 |
|
The nonprofit has a monitoring system in the execution of the financial plan |
7.100 |
2.397 |
0.819 |
CRC: 0.884 |
||
New courses of action are defined if deviations from the financial plan are detected |
7.570 |
2.354 |
0.833 |
α: 0.846 |
||
Paid work ED3 |
Return on assets |
0.046 |
0.923 |
1.000 |
– |
|
Relation between staff expenses and net income |
0.625 |
2.201 |
1.000 |
– |
||
Relation between number of workers and net income |
0.000 |
0.001 |
1.000 |
– |
||
Social mission SD1 |
Users participate in the decision-making processes |
6.310 |
2.554 |
0.757 |
AVE: 0.645 |
p-value χ 2:0.002 RMSEA:0.074 CFI:0.918 SRMR:0.064 |
Users share organizational ethics values |
7.650 |
2.129 |
0.909 |
CRC: 0.803 |
||
The organization has sufficient resources to lend its services |
6.970 |
2.174 |
1.000 |
α: 0.729 |
||
There are mechanisms to monitor the service quality |
6.940 |
2.301 |
0.599 |
|||
Impact of the paid workers recruitment in the local environment |
5.500 |
2.827 |
0.782 |
|||
The organization promotes the recruitment of paid workers |
5.290 |
2.750 |
0.795 |
|||
The organization provides formation for their paid workers |
5.480 |
2.979 |
0.845 |
|||
Impact of the participation of volunteers in the local environment |
5.550 |
2.797 |
0.688 |
|||
The organization promotes the participation of volunteers |
5.270 |
2.826 |
0.825 |
|||
The organization provides formation for their volunteers |
5.480 |
2.670 |
0.823 |
|||
Civil society SD2 |
Level of development of the organizational ethical ideology |
8.270 |
1.979 |
0.727 |
AVE: 0.491 |
|
Level of integration of local community and its environment |
8.690 |
1.683 |
0.644 |
CRC: 0.701 |
||
Development of service quality surveys among users |
5.670 |
2.519 |
0.588 |
α: 0.711 |
||
Promotion of high levels of accessibility to the lent services |
7.310 |
2.247 |
0.711 |
|||
Promotion of the participation in social networks |
6.850 |
2.622 |
1.000 |
|||
Estimation of the social return on investment (SROI) |
6.250 |
2.035 |
0.651 |
|||
Local community participates in the decision-making processes |
5.370 |
2.587 |
0.576 |
|||
Autonomy MD1 |
The organization shares workers with other organizations |
3.450 |
2.393 |
0.615 |
AVE: 0.536 |
p-value χ 2:0.027 RMSEA:0.095 CFI: 0.912 SRMR: 0.052 |
The organization shares volunteers with other organizations |
4.580 |
2.771 |
0.690 |
CRC: 0.732 |
||
The organization progressively improves the formation of their human resources |
6.120 |
2.799 |
1.000 |
α: 0.755 |
||
The organization progressively attracts a higher number of users |
7.370 |
2.478 |
0.689 |
|||
The organization progressively has more financial resources |
6.040 |
2.477 |
0.667 |
|||
Decision making-processes MD2 |
The board of trustees consults users before making a decision |
5.190 |
2.689 |
0.861 |
AVE:0.630 |
|
The board of trustees consults workers before making a decision |
6.300 |
2.631 |
0.785 |
CRC: 0.794 |
||
The board of trustees consults volunteers before making a decision |
6.040 |
2.598 |
1.000 |
α: 0.725 |
||
The board of trustees consults funders before making a decision |
5.020 |
2.686 |
0.529 |
|||
Stakeholder orientation MD3 |
The organization consolidates the existing users |
7.920 |
2.152 |
0.650 |
AVE:0.591 |
|
The organization improves the relationship with external stakeholders |
7.680 |
2.242 |
0.781 |
CRC: 0.769 |
||
The organization shares information with its stakeholders |
7.560 |
2.129 |
0.798 |
α: 0.801 |
||
The organization promotes the stakeholders’ participation in the decision-making |
6.130 |
2.119 |
0.646 |
|||
The organization facilitates accessible information to its stakeholders |
7.850 |
1.991 |
1.000 |
|||
The organization maintain a high degree of visibility in its local community |
8.050 |
2.088 |
0.739 |
Table 2 also shows the results of the estimated measurement model. The fit indices indicate a reasonable goodness-of-fit. The discriminant validity was demonstrated by the low correlations between the estimated latent variables (mean correlation:0.300). Table 3 presents the results of the latent growth models.
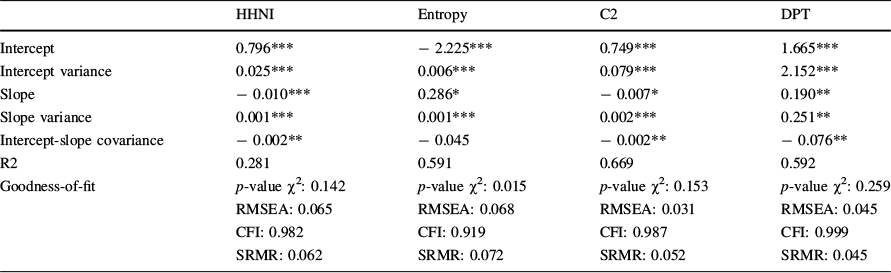
Latent growth model: evolution of revenue diversification
HHNI |
Entropy |
C2 |
DPT |
|
|---|---|---|---|---|
Intercept |
0.796*** |
− 2.225*** |
0.749*** |
1.665*** |
Intercept variance |
0.025*** |
0.006*** |
0.079*** |
2.152*** |
Slope |
− 0.010*** |
0.286* |
− 0.007* |
0.190** |
Slope variance |
0.001*** |
0.001*** |
0.002*** |
0.251** |
Intercept-slope covariance |
− 0.002** |
− 0.045 |
− 0.002** |
− 0.076** |
R2 |
0.281 |
0.591 |
0.669 |
0.592 |
Goodness-of-fit |
p-value χ2: 0.142 RMSEA: 0.065 CFI: 0.982 SRMR: 0.062 |
p-value χ2: 0.015 RMSEA: 0.068 CFI: 0.919 SRMR: 0.072 |
p-value χ2: 0.153 RMSEA: 0.031 CFI: 0.987 SRMR: 0.052 |
p-value χ2: 0.259 RMSEA: 0.045 CFI: 0.999 SRMR: 0.045 |
***p-value < 0.010; ** p-value < 0.050; *p-value < 0.100
The estimated models demonstrated reasonable fit for both the global and individual fit indicators. The results showed low levels of revenue diversification in 2008. However, the slope, representing the evolution of income structure from 2008 to 2018, indicates a trend toward diversification (p-value < 0.100). Specifically, the indicators in the [0–1] interval showed a negative slope, while those not enclosed showed a positive slope. This suggests that the entities evolved toward greater revenue diversification, although we cannot confirm that the adoption of the social enterprise model was the cause of this evolution. To further examine the income structure of these nonprofits, Fig. 3 breaks it down into private donations, government funding, commercial income, and income from investments.
Evolution of the income structure of Spanish nonprofits. Correlation test: Corr(Commercial income, HHNI) = − 0.901, p value = 0.000; Corr(Commercial income,C2) = − 0.990, p value = 0.000; Corr(Commercial income, Entropy) = 0.691, p value = 0.019; Corr(Commercial income, DPT) = − 0.864, p value = 0.001
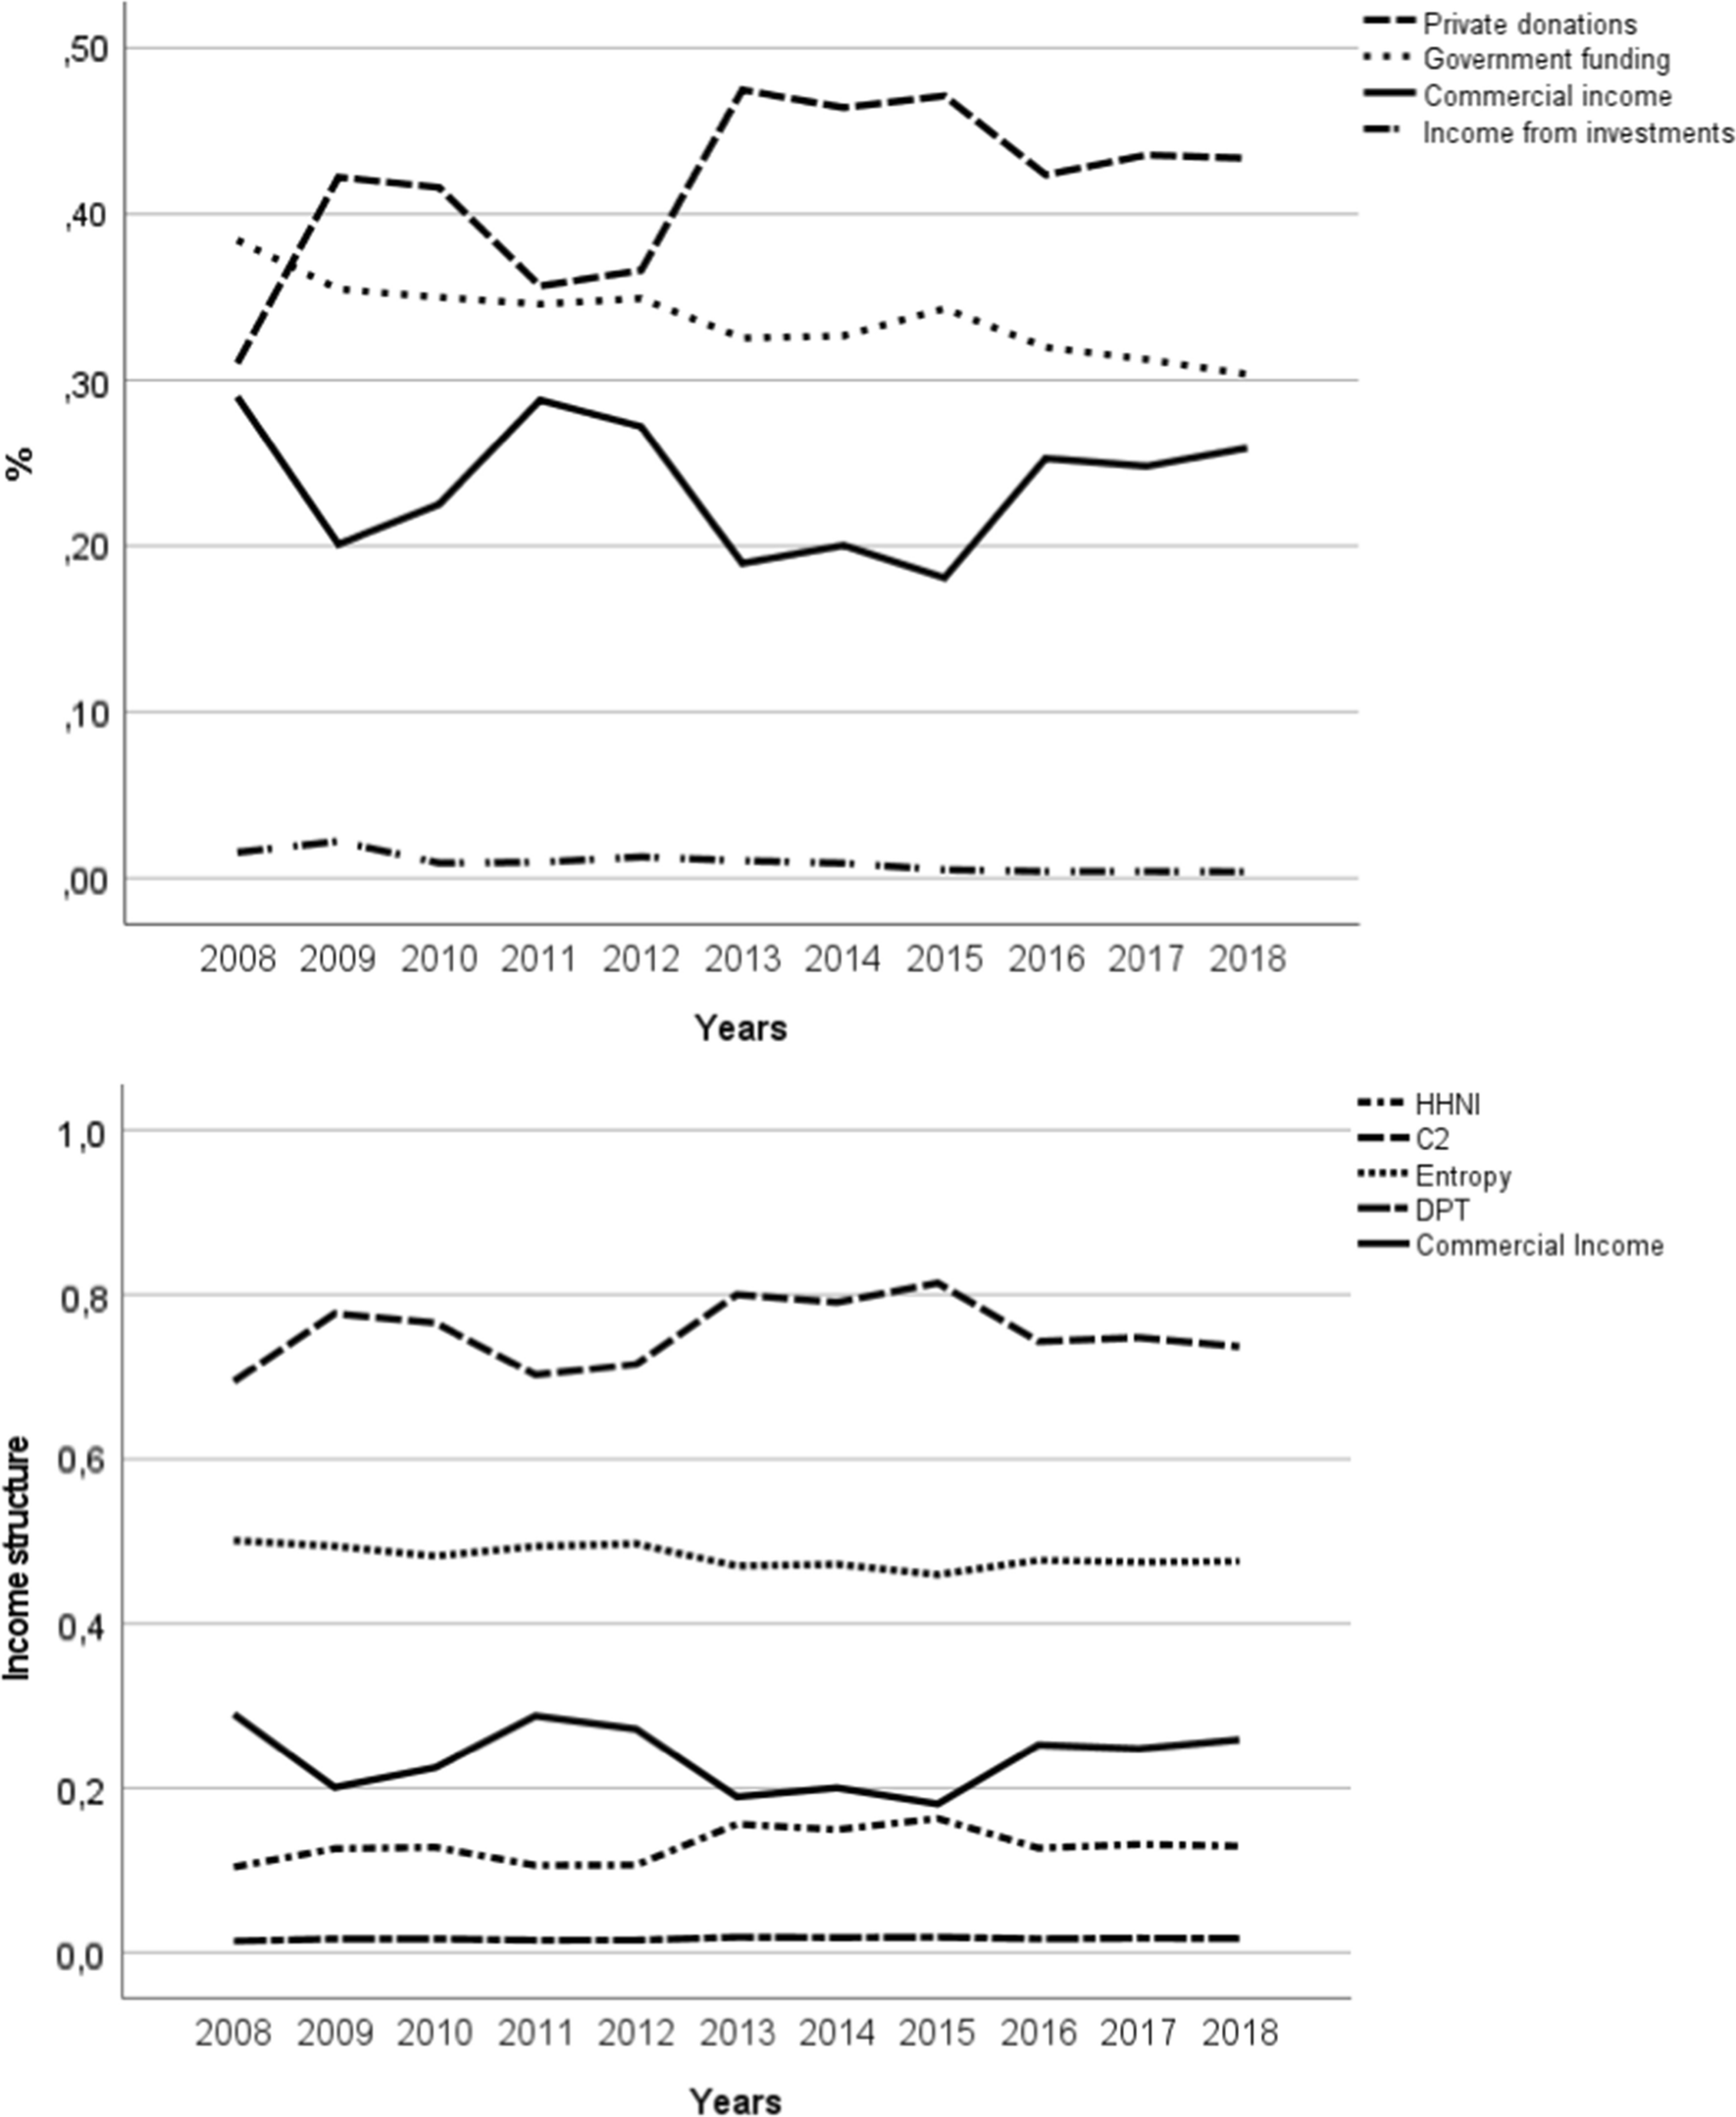
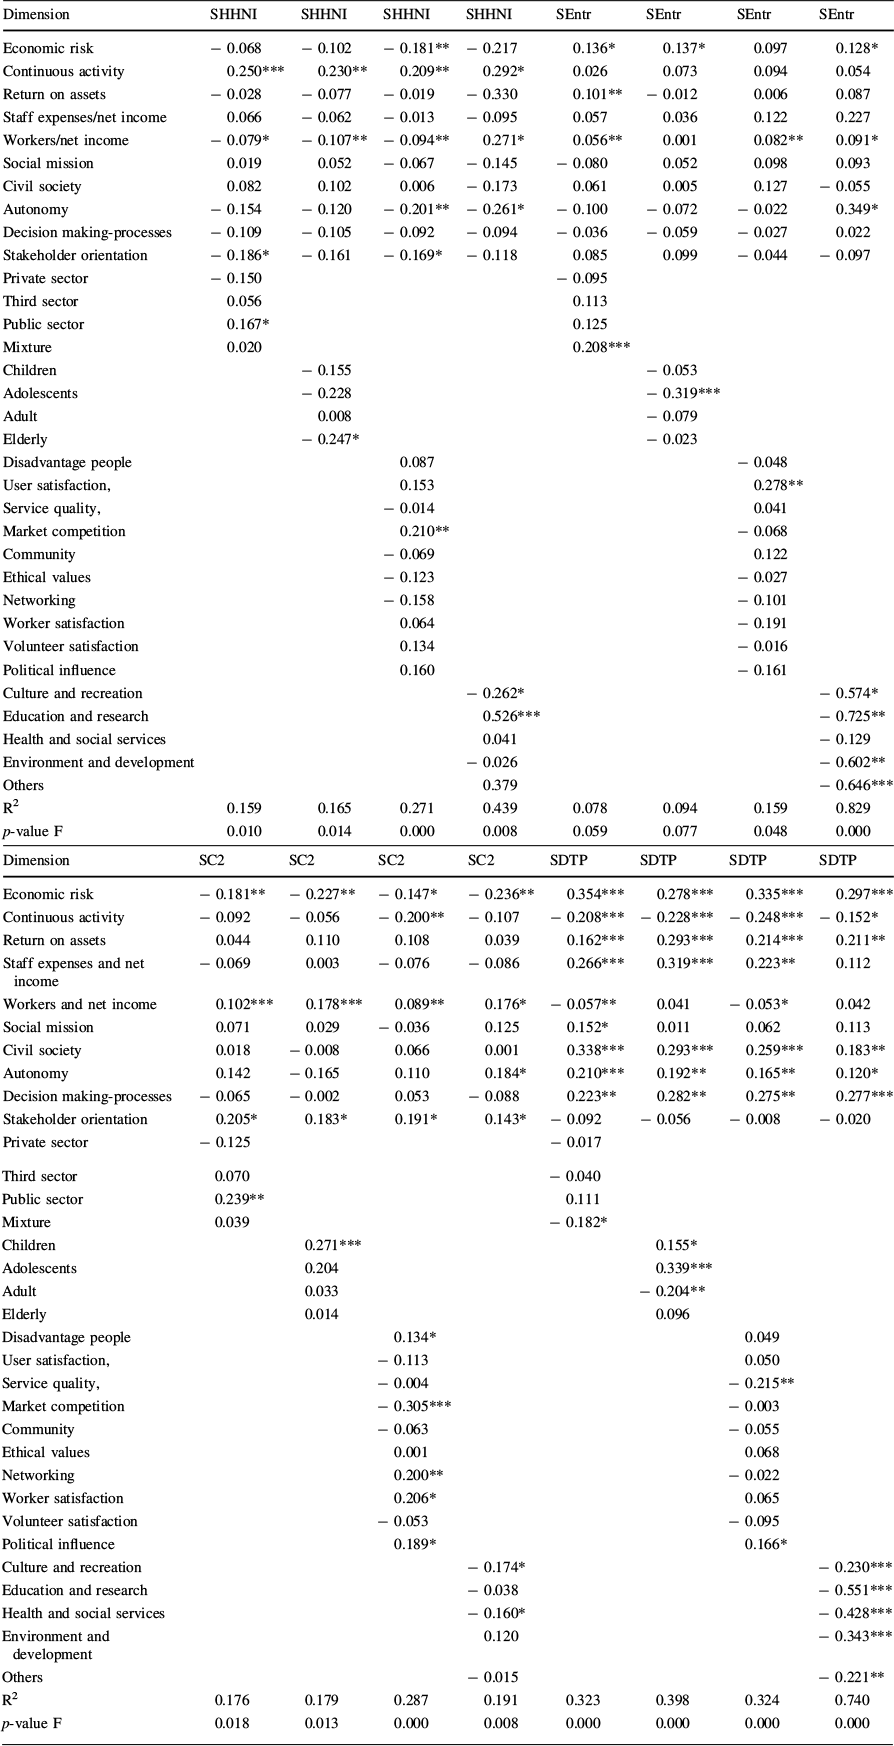
We observe trend of decreasing dependence on government funding over the past decade, with nonprofits compensating for this reduction through increased donations and commercial income. This evolution toward commercial income also contributed to a decrease in revenue concentration, especially during unstable economic periods. Table 4 presents the results of the structural model, which takes into account both the social enterprise dimensions and the evolution of the income structure, as well as the parameters of the control variables.
Structural model

Dimension |
SHHNI |
SHHNI |
SHHNI |
SHHNI |
SEntr |
SEntr |
SEntr |
SEntr |
|---|---|---|---|---|---|---|---|---|
Economic risk |
− 0.068 |
− 0.102 |
− 0.181** |
− 0.217 |
0.136* |
0.137* |
0.097 |
0.128* |
Continuous activity |
0.250*** |
0.230** |
0.209** |
0.292* |
0.026 |
0.073 |
0.094 |
0.054 |
Return on assets |
− 0.028 |
− 0.077 |
− 0.019 |
− 0.330 |
0.101** |
− 0.012 |
0.006 |
0.087 |
Staff expenses/net income |
0.066 |
− 0.062 |
− 0.013 |
− 0.095 |
0.057 |
0.036 |
0.122 |
0.227 |
Workers/net income |
− 0.079* |
− 0.107** |
− 0.094** |
0.271* |
0.056** |
0.001 |
0.082** |
0.091* |
Social mission |
0.019 |
0.052 |
− 0.067 |
− 0.145 |
− 0.080 |
0.052 |
0.098 |
0.093 |
Civil society |
0.082 |
0.102 |
0.006 |
− 0.173 |
0.061 |
0.005 |
0.127 |
− 0.055 |
Autonomy |
− 0.154 |
− 0.120 |
− 0.201** |
− 0.261* |
− 0.100 |
− 0.072 |
− 0.022 |
0.349* |
Decision making-processes |
− 0.109 |
− 0.105 |
− 0.092 |
− 0.094 |
− 0.036 |
− 0.059 |
− 0.027 |
0.022 |
Stakeholder orientation |
− 0.186* |
− 0.161 |
− 0.169* |
− 0.118 |
0.085 |
0.099 |
− 0.044 |
− 0.097 |
Private sector |
− 0.150 |
− 0.095 |
||||||
Third sector |
0.056 |
0.113 |
||||||
Public sector |
0.167* |
0.125 |
||||||
Mixture |
0.020 |
0.208*** |
||||||
Children |
− 0.155 |
− 0.053 |
||||||
Adolescents |
− 0.228 |
− 0.319*** |
||||||
Adult |
0.008 |
− 0.079 |
||||||
Elderly |
− 0.247* |
− 0.023 |
||||||
Disadvantage people |
0.087 |
− 0.048 |
||||||
User satisfaction, |
0.153 |
0.278** |
||||||
Service quality, |
− 0.014 |
0.041 |
||||||
Market competition |
0.210** |
− 0.068 |
||||||
Community |
− 0.069 |
0.122 |
||||||
Ethical values |
− 0.123 |
− 0.027 |
||||||
Networking |
− 0.158 |
− 0.101 |
||||||
Worker satisfaction |
0.064 |
− 0.191 |
||||||
Volunteer satisfaction |
0.134 |
− 0.016 |
||||||
Political influence |
0.160 |
− 0.161 |
||||||
Culture and recreation |
− 0.262* |
− 0.574* |
||||||
Education and research |
0.526*** |
− 0.725** |
||||||
Health and social services |
0.041 |
− 0.129 |
||||||
Environment and development |
− 0.026 |
− 0.602** |
||||||
Others |
0.379 |
− 0.646*** |
||||||
R2 |
0.159 |
0.165 |
0.271 |
0.439 |
0.078 |
0.094 |
0.159 |
0.829 |
p-value F |
0.010 |
0.014 |
0.000 |
0.008 |
0.059 |
0.077 |
0.048 |
0.000 |
Dimension |
SC2 |
SC2 |
SC2 |
SC2 |
SDTP |
SDTP |
SDTP |
SDTP |
|---|---|---|---|---|---|---|---|---|
Economic risk |
− 0.181** |
− 0.227** |
− 0.147* |
− 0.236** |
0.354*** |
0.278*** |
0.335*** |
0.297*** |
Continuous activity |
− 0.092 |
− 0.056 |
− 0.200** |
− 0.107 |
− 0.208*** |
− 0.228*** |
− 0.248*** |
− 0.152* |
Return on assets |
0.044 |
0.110 |
0.108 |
0.039 |
0.162*** |
0.293*** |
0.214*** |
0.211** |
Staff expenses and net income |
− 0.069 |
0.003 |
− 0.076 |
− 0.086 |
0.266*** |
0.319*** |
0.223** |
0.112 |
Workers and net income |
0.102*** |
0.178*** |
0.089** |
0.176* |
− 0.057** |
0.041 |
− 0.053* |
0.042 |
Social mission |
0.071 |
0.029 |
− 0.036 |
0.125 |
0.152* |
0.011 |
0.062 |
0.113 |
Civil society |
0.018 |
− 0.008 |
0.066 |
0.001 |
0.338*** |
0.293*** |
0.259*** |
0.183** |
Autonomy |
0.142 |
− 0.165 |
0.110 |
0.184* |
0.210*** |
0.192** |
0.165** |
0.120* |
Decision making-processes |
− 0.065 |
− 0.002 |
0.053 |
− 0.088 |
0.223** |
0.282** |
0.275** |
0.277*** |
Stakeholder orientation |
0.205* |
0.183* |
0.191* |
0.143* |
− 0.092 |
− 0.056 |
− 0.008 |
− 0.020 |
Private sector |
− 0.125 |
− 0.017 |
||||||
Third sector |
0.070 |
− 0.040 |
||||||
Public sector |
0.239** |
0.111 |
||||||
Mixture |
0.039 |
− 0.182* |
||||||
Children |
0.271*** |
0.155* |
||||||
Adolescents |
0.204 |
0.339*** |
||||||
Adult |
0.033 |
− 0.204** |
||||||
Elderly |
0.014 |
0.096 |
||||||
Disadvantage people |
0.134* |
0.049 |
||||||
User satisfaction, |
− 0.113 |
0.050 |
||||||
Service quality, |
− 0.004 |
− 0.215** |
||||||
Market competition |
− 0.305*** |
− 0.003 |
||||||
Community |
− 0.063 |
− 0.055 |
||||||
Ethical values |
0.001 |
0.068 |
||||||
Networking |
0.200** |
− 0.022 |
||||||
Worker satisfaction |
0.206* |
0.065 |
||||||
Volunteer satisfaction |
− 0.053 |
− 0.095 |
||||||
Political influence |
0.189* |
0.166* |
||||||
Culture and recreation |
− 0.174* |
− 0.230*** |
||||||
Education and research |
− 0.038 |
− 0.551*** |
||||||
Health and social services |
− 0.160* |
− 0.428*** |
||||||
Environment and development |
0.120 |
− 0.343*** |
||||||
Others |
− 0.015 |
− 0.221** |
||||||
R2 |
0.176 |
0.179 |
0.287 |
0.191 |
0.323 |
0.398 |
0.324 |
0.740 |
p-value F |
0.018 |
0.013 |
0.000 |
0.008 |
0.000 |
0.000 |
0.000 |
0.000 |
***p-value < 0.010; ** p-value < 0.050; *p-value < 0.100
The results of the basic model suggest that there is no direct relationship between revenue diversification and the adoption of the social enterprise model, despite the observed evolution in recent years. The only significant indicators were economic risk and paid work. Moreover, when considering the level of volatility, the dimensions of the social enterprise model had a significant impact, but the parameters had opposing signs, making it challenging to determine a clear direction. These findings evidence that while the nonprofits have moved toward a more diversified income structure, this shift may not necessarily be related to the adoption of the social enterprise model. Although the characteristics of the social enterprise model are shared by all social enterprises, this conclusion cannot be generalized to all nonprofits. Some Spanish nonprofits have incorporated aspects of the social enterprise model into their operations as part of a hybridization process, but not all of them have done so. The control variables did not have a significant effect on the evolution, but some influence was noticeable for specific types of promoters, users, and purposes.
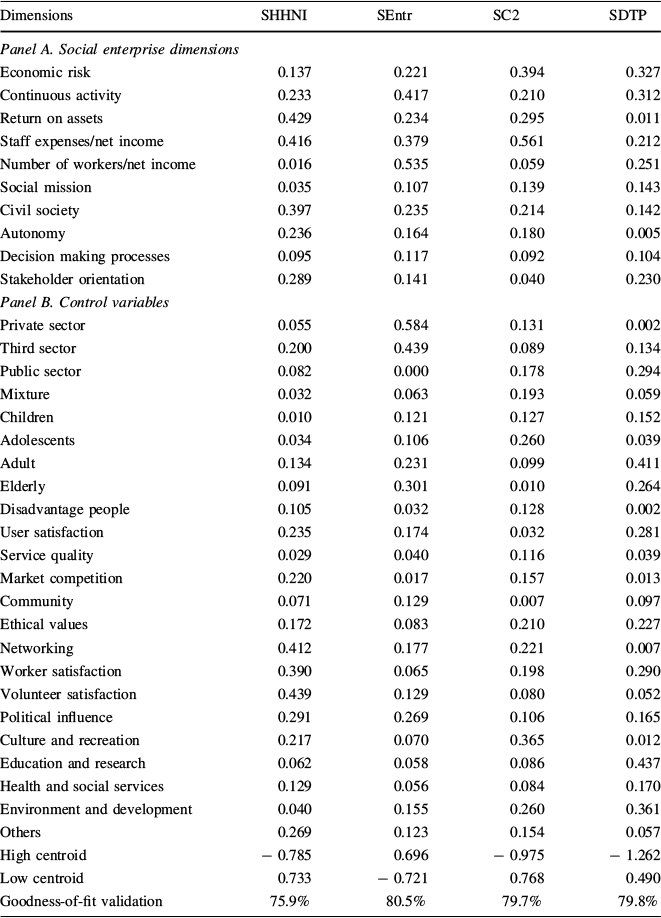
Finally, Table 5 presents the structure matrix for the discriminant analysis, which distinguishes between nonprofits that have different levels of revenue diversification over time (Panel A: Social enterprise dimensions; Panel B: Control variables).
Discriminant analysis: structure matrix

Dimensions |
SHHNI |
SEntr |
SC2 |
SDTP |
|---|---|---|---|---|
Panel A. Social enterprise dimensions |
||||
Economic risk |
0.137 |
0.221 |
0.394 |
0.327 |
Continuous activity |
0.233 |
0.417 |
0.210 |
0.312 |
Return on assets |
0.429 |
0.234 |
0.295 |
0.011 |
Staff expenses/net income |
0.416 |
0.379 |
0.561 |
0.212 |
Number of workers/net income |
0.016 |
0.535 |
0.059 |
0.251 |
Social mission |
0.035 |
0.107 |
0.139 |
0.143 |
Civil society |
0.397 |
0.235 |
0.214 |
0.142 |
Autonomy |
0.236 |
0.164 |
0.180 |
0.005 |
Decision making processes |
0.095 |
0.117 |
0.092 |
0.104 |
Stakeholder orientation |
0.289 |
0.141 |
0.040 |
0.230 |
Panel B. Control variables |
||||
Private sector |
0.055 |
0.584 |
0.131 |
0.002 |
Third sector |
0.200 |
0.439 |
0.089 |
0.134 |
Public sector |
0.082 |
0.000 |
0.178 |
0.294 |
Mixture |
0.032 |
0.063 |
0.193 |
0.059 |
Children |
0.010 |
0.121 |
0.127 |
0.152 |
Adolescents |
0.034 |
0.106 |
0.260 |
0.039 |
Adult |
0.134 |
0.231 |
0.099 |
0.411 |
Elderly |
0.091 |
0.301 |
0.010 |
0.264 |
Disadvantage people |
0.105 |
0.032 |
0.128 |
0.002 |
User satisfaction |
0.235 |
0.174 |
0.032 |
0.281 |
Service quality |
0.029 |
0.040 |
0.116 |
0.039 |
Market competition |
0.220 |
0.017 |
0.157 |
0.013 |
Community |
0.071 |
0.129 |
0.007 |
0.097 |
Ethical values |
0.172 |
0.083 |
0.210 |
0.227 |
Networking |
0.412 |
0.177 |
0.221 |
0.007 |
Worker satisfaction |
0.390 |
0.065 |
0.198 |
0.290 |
Volunteer satisfaction |
0.439 |
0.129 |
0.080 |
0.052 |
Political influence |
0.291 |
0.269 |
0.106 |
0.165 |
Culture and recreation |
0.217 |
0.070 |
0.365 |
0.012 |
Education and research |
0.062 |
0.058 |
0.086 |
0.437 |
Health and social services |
0.129 |
0.056 |
0.084 |
0.170 |
Environment and development |
0.040 |
0.155 |
0.260 |
0.361 |
Others |
0.269 |
0.123 |
0.154 |
0.057 |
High centroid |
− 0.785 |
0.696 |
− 0.975 |
− 1.262 |
Low centroid |
0.733 |
− 0.721 |
0.768 |
0.490 |
Goodness-of-fit validation |
75.9% |
80.5% |
79.7% |
79.8% |
The results reveal that the nonprofits that implemented high levels of diversification since 2008 using commercial income show development in some of the dimensions of the social enterprise model. The indicators related to the economic dimension (paid work, continuous activity, and economic risks) are associated with revenue diversification. Similarly, these organizations intensified their social missions, promoting the integration of stakeholders and the democratization of decision-making processes. We cannot confirm that these nonprofits adopted the social enterprise model, but we observe a clear evolution toward some of its characteristics. Nevertheless, this analysis is not homogenous as it is influenced by the type of promoter, activity, user, and purpose of the nonprofit.
Discussion
Kerlin (Reference Kerlin2009) concluded that the withdrawal of state support in the 1980s and 1990s was experienced to different degrees in the USA, Western and East-Central Europe, and South America. At that time, governments in Western Europe implemented reforms related to decentralization, privatization, and a reduction in public social services amidst high unemployment rates. Nyssens (Reference Nyssens and Kerlin2009) highlights that these reforms led to the development of active labor policies and the emergence of social enterprises. The recent economic crisis in EU Mediterranean countries increased social needs and led to austerity measures implemented by the government, including cuts in funding, particularly for nonprofits. However, while our findings show changes in nonprofits’ income structure, we do not evidence a reduction in the number of nonprofits. These changes are similar to the evolution in the USA as a result of the austerity policies implemented in the 1980s. As noted by Kerlin (Reference Kerlin2009, p. 185), Eikenberry and Kluver (Reference Eikenberry and Kluver2004), Salamon (Reference Salamon1993), and Salamon and Anheier (Reference Salamon and Anheier1997), ‘nonprofits seized upon the idea of commercial revenue generation as a way to replace the loss of government funds’. According to Kerlin (Reference Kerlin2006), this process of diversification would be the origin of the adoption of a social enterprise model.
Our results indicate that nonprofits in EU-member Mediterranean countries diversified their income structures through commercial revenue in response to the recent economic crisis, but this diversification was not necessarily the origin of social enterprises in the region. Guan et al. (Reference Guan, Tian and Deng2021) suggest that nonprofits adopt the social enterprise model by employing commercialization as a strategy to improve their financial stability and sustainability. However, our results do not support this idea and suggest that revenue diversification is not linked to the adoption of all the characteristics of social enterprise according to the EU's definition. We found that private donations are utilized more frequently than commercial revenue, resulting in stronger community engagement, especially during economic downturns. Nevertheless, commercial income is also key in the revenue diversification process in the Mediterranean context. Our findings support the trend of revenue diversification reported by Önder and Ayhan (Reference Önder and Ayhan2020) and Abínzano et al. (Reference Abínzano, López-Arceiz and Zabaleta2022) in similar contexts. However, neither of these studies analyze the relationship between revenue diversification and the social enterprise model or the role of commercialization in this process. Our study goes further by examining the role of commercialization in the Mediterranean context and its association with the adoption of social enterprise characteristics. Our results are consistent with those of Child (Reference Child2010), who found no evidence of a sector-wide shift toward earned income in the US context. We also find that the implementation and impact of the social enterprise model on income structure is dependent on organizational characteristics, contradicting the conclusions of Bassi and Vicenti (Reference Bassi and Vincenti2015) and López-Arceiz et al. (Reference López-Arceiz, Bellostas and Rivera2017). In contrast, we agree with Szymanska and Jegers (Reference Szymańska and Jegers2014) and Chandra and Kerlin (Reference Chandra and Kerlin2021), who suggest that the legal form, activity, and context influence the implementation of the social enterprise model in nonprofits.
Therefore, nonprofit organizations have increasingly adopted the social enterprise model in response to decreasing public funding. This adoption alone may not fully explain the evolution toward revenue diversification through commercialization in EU Mediterranean countries. Nevertheless, our findings suggest that nonprofits with higher levels of revenue diversification exhibit more characteristics of the social enterprise model as defined in this context, which can enhance stability, legitimacy, and recognition in the community (Grasse et al., Reference Grasse, Whaley and Ihrke2016; Kingma, Reference Kingma1993; Qu, Reference Qu2016).
Contributions, Limitations, and Future Research Agenda
Our results indicate that the studied nonprofits have evolved toward revenue diversification over the last decade. This evolution is linked to nonprofit commercialization and the adoption of certain characteristics of the social enterprise model in the EU, such as taking on economic risks, intensifying their social missions, integrating stakeholders, and democratizing decision-making processes. We then conclude that only the adoption of some characteristics associated with the social and governance dimensions of the social enterprise model results in an evolution toward revenue diversification through commercialization. Nevertheless, not all nonprofits evolved in this direction; the adoption of the social enterprise model was contingent on the institutional environment and the organizational characteristics.
This result contributes to the literature in different ways. Firstly, we highlight that revenue diversification offers benefits to nonprofits facing cuts in public funding. It can come from both private donations and commercial income, and it is related to certain characteristics of the EU's definition of the social enterprise model. Specifically, commercial income is associated with taking on higher levels of economic risk, while private donations are associated with stakeholder integration and democratized decision-making processes. Secondly, we also emphasize that revenue diversification during a crisis is not always synonymous with all elements of the social enterprise model as defined by the EU. This conclusion highlights the need for researchers to examine the institutional and organizational factors that may influence its adoption. Thirdly, our study underscores the need for a multi-theoretical framework that considers both internal and external factors driving revenue diversification toward hybrid models. Finally, from the practitioner’s viewpoint, our results demonstrate the various options available for diversifying nonprofit revenues through the social enterprise model. For example, if a nonprofit prioritizes economic risk-taking (economic dimension), it is more likely to generate commercial income, while prioritizing stakeholder participation (governance dimension) may result in increased private donations. Policymakers may consider detailing the different types of social enterprises and providing regulations that cater to different entities that fit this concept. Social enterprises can originate from both the for-profit and nonprofit sectors, which implies that they can have different organizational cultures, purposes, and characteristics. Consequently, the income structure will be designed in different ways and conditioned by the origin of the social enterprise.
This study has some limitations. The sample is limited to nonprofits located in one Mediterranean region, Aragon. Future studies should expand the scope to nonprofits in other regions. We focus only on nonprofits as a type of social enterprise, and further research should explore other types of entities. Additionally, while the dimensions were measured through a combination of questionnaires and financial statements, it is important to gather data from other sources. Moreover, we examine diversification indices, but we do not examine the specifics of the nonprofit's income structure. It would also be valuable to decompose public funding and private donations to gain a more complete understanding of the evolution of different revenue sources for nonprofits. We highlight the need for a clearer definition of the social enterprise concept and the development of standard indicators to measure its dimensions. Lastly, a comprehensive theory of the social enterprise is currently lacking and future research should aim to provide a comprehensive explanation for the adoption of this model.
Acknowledgements
We thank ECOCIRCULAR and CREVALOR research groups for their suggestions in the elaboration of this manuscript.
Funding
Open Access funding provided thanks to the CRUE-CSIC agreement with Springer Nature. This study was funded by the Ministry of Science, Innovation and Universities (PID2019-107822RB-I00/PID2020-113338RB-I00).
Data Availability
Access financial statements and activity reports at https://www.aragon.es/tramitador/-/tramite/solicitud-certificados-copias-fundaciones. The survey and Mplus commands from https://doi.org/10.5281/zenodo.5887852.
Declarations
Conflict of interest
The authors declare that they have no conflict of interest.
Appendix 1: Main variables
Variable |
Indicator |
Source/regulation |
|---|---|---|
Economic risk: Financial viability to secure adequate resources |
Relation between cash and cash equivalents and current debt |
EU (2015, 2020) Spain: Resolution 3871/2013 |
Relation between current assets and current debt |
||
Relation between total assets and total debt |
||
Continuous activity: Investment in the production of goods or services to people on a continuous basis |
In relation to the funding strategy or financial plan of your organization, could you indicate the degree of agreementwith the following statements?Please, value between 1 (Not at all agree) and 10 (Totally agree) the degree of agreement with the following statements (Note: The initials DK/NA correspond to "Do not know" or "No answer"): The execution of the financial plan enables the detection of possible weaknesses The nonprofit has a monitoring system in the execution of the financial plan New courses of action are defined if deviations from the financial plan are detected |
EU (2015, 2020) Spain: Art. 25 Law 50/2002 |
Scale: Likert 0–10 |
||
Paid work: Minimum level of paid workers |
Return on assets |
EU (2015, 2020) Spain: Art. 2 Law 22/2003 |
Relation between staff expenses and net income |
||
Relation between number of workers and net income |
||
Social mission: Social purpose in the community or a specific group of people |
In relation to your social mission, nonprofit users in your organization are more satisfied when…(Please, value between 0 (Not at all agree) and 10 (Totally agree) the degree of agreement with the following statements)(Note: The initials DK/NA correspond to "Do not know" or "No answer"): Users participate in the decision-making processes Users share organizational ethics values The organization has sufficient resources to lend its services There are mechanisms to monitor the service quality Impact of the paid workers recruitment in the local environment The organization promotes the recruitment of paid workers The organization provides formation for their paid workers Impact of the participation of volunteers in the local environment The organization promotes the participation of volunteers The organization provides formation for their volunteers Scale: Likert 0–10 |
EU (2015, 2020) Spain: Resolution 3871/2013 |
Civil society: Involving people that share a defined need or aim |
Please, could you assess between 1 (Not useful) and 10 (Totally useful) the interest of the following elements as a means to measure the level of integration of civil society in a nonprofit organization? (Note: The initials DK/NA correspond to "Do not know" or "No answer"): Level of development of the organizational ethical ideology Level of integration of local community and its environment Development of service quality surveys among users Promotion of high levels of accessibility to the lent services Promotion of the participation in social networks Estimation of the social return on investment (SROI) Local community participates in the decision-making processes |
EU (2015, 2020) Spain: AECA (2013) |
Scale: Likert 0–10 |
||
Autonomy: They are not managed by public authorities or other organization |
A series of potential benefits of belonging to a collaborative network are presented bellow. Based on your experience, what would be the aspects most developed by the belonging to a network?(Note: The initials DK/NA correspond to "Do not know" or "No answer"): The organization shares workers with other organizations The organization shares volunteers with other organizations The organization progressively improves the formation of their human resources The organization progressively attracts a higher number of users The organization progressively has more financial resources |
EU (2015, 2020) Spain: Art 4.a) Law 5/2011 |
Scale: Likert 0–10 |
||
Decision-making processes: Power is not distributed according to capital shares |
A series of actions are detailed below, could it be indicated to what point such actions reflect the working of the board of trustees in your organization? Please mark your answer with an X in the appropriate box (Note: The initials DK/NA correspond to "Do not know" or "No answer"): The board of trustees consults users before making a decision The board of trustees consults workers before making a decision The board of trustees consults volunteers before making a decision The board of trustees consults funders before making a decision Scale: Likert 0–10 |
EU (2015, 2020) Spain: Art. 15 Law 50/2002 |
Stakeholder orientation: Participation of stakeholders in decision-making and management |
In your opinion, what are the advantages for a nonprofit that is stakeholder oriented? (Please rate between 1 (Not at all agree) and 10 (Totally agree) the degree of agreement with the following statements). (Note: The initials DK/NA correspond to "Do not know" or "No answer"): The organization consolidates the existing users The organization improves the relationship with external stakeholders The organization shares information with its stakeholders The organization promotes the stakeholders’ participation in the decision-making The organization facilitates accessible information to its stakeholders The organization maintain a high degree of visibility in its local community |
EU (2015, 2020) Spain: Art. 4.c) Law 50/2002 |
Scale: Likert 0–10 |


 Open access