

The hippocampus has interested investigators into schizophrenia for many decades. Experimental and human studies have shown its undoubted importance for memory function, which is selectively impaired in people with schizophrenia (Reference Gruzelier, Seymour and WilsonGruzelier et al, 1988; Reference Saykin, Gur and GurSaykin et al, 1991; Reference Gur, Cowell and TuretskyGur et al, 1998). Furthermore, some structural imaging studies of living patients, as well as post-mortem studies, report reductions in hippocampal size in schizophrenia (Reference Bogerts, Meertz and Schonfeldt-BauschBogerts et al, 1985; Reference Falkai and BogertsFalkai & Bogerts, 1986; Reference Jeste and LohrJeste & Lohr, 1989; Reference Nelson, Saykin and FlashmanNelson et al, 1998) – although not all studies confirm this, perhaps because the numbers of individuals studied were sometimes too low to detect the quite subtle reductions described (Reference Altshuler, Casanova and GoldbergAltshuler et al, 1990; Reference Bruton, Crow and FrithBruton et al, 1990; Heckers et al, Reference Heckers, Heinsen and Heinsen1990, Reference Heckers, Heinsen and Geiger1991). The meta-analysis of in vivo magnetic resonance imaging (MRI) studies by Nelson et al (Reference Nelson, Saykin and Flashman1998) indicated a reduction in hippocampal size of approximately 4%.
Reduction in size of a brain structure may reflect a reduced size of the constituent glial cells and neurons and their processes as well as (or as an alternative to) a reduced number of neurons. Thus, it is important to document estimates of cell size as well as cell number in brain structures that are of interest in schizophrenia. Here we present our findings with respect to pyramidal cell volume, estimated stereologically, in the hippocampus on both sides of brains taken from 13 people with schizophrenia and 16 controls.
METHOD
The brains studied in this investigation were a subset of 29 samples from a collection that has been described elsewhere (Reference Highley, McDonald and WalkerHighley et al, 1999; Reference McDonald, Highley and WalkerMcDonald et al, 2000; Reference Walker, Highley and EsiriWalker et al, 2002). In brief, brains were collected post mortem from patients with schizophrenia and a control group, and fixed by suspension in 10% formalin solution. The case notes of the patients and controls were assessed by a psychiatrist (T.J.C. or Dr Stephen J. Cooper from Queen's University, Belfast) to ensure that they either fulfilled DSM–IV criteria for schizophrenia or schizoaffective disorder (American Psychiatric Association, 1994), or were free of psychopathological disorder. The next of kin gave consent for use of brain tissue for research. All brains were examined by a neuropathologist (B.M.), masked to diagnosis and gender, who confirmed them as being free from significant neuropathological changes. In particular, there was no evidence of cerebrovascular disease, Alzheimer's disease or Parkinson's disease. All measures were made (by M.A.W.) masked to diagnosis and gender. The demographic details of the brain donors in this study are given in Table 1.
Preparation and donor characteristics of the brain samples used in this study
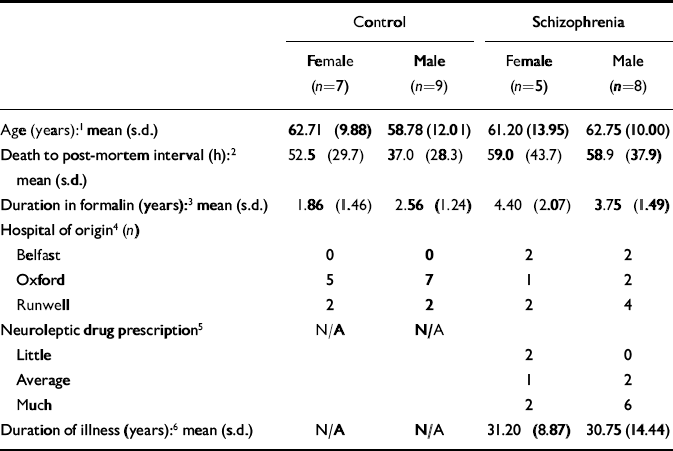
| Control | Schizophrenia | |||
|---|---|---|---|---|
| Female (n=7) | Male (n=9) | Female (n=5) | Male (n=8) | |
| Age (years):1 mean (s.d.) | 62.71 (9.88) | 58.78 (12.01) | 61.20 (13.95) | 62.75 (10.00) |
| Death to post-mortem interval (h):2 | 52.5 (29.7) | 37.0 (28.3) | 59.0 (43.7) | 58.9 (37.9) |
| mean (s.d.) | ||||
| Duration in formalin (years):3 mean (s.d.) | 1.86 (1.46) | 2.56 (1.24) | 4.40 (2.07) | 3.75 (1.49) |
| Hospital of origin4 (n) | ||||
| Belfast | 0 | 0 | 2 | 2 |
| Oxford | 5 | 7 | 1 | 2 |
| Runwell | 2 | 2 | 2 | 4 |
| Neuroleptic drug prescription5 | N/A | N/A | ||
| Little | 2 | 0 | ||
| Average | 1 | 2 | ||
| Much | 2 | 6 | ||
| Duration of illness (years):6 mean (s.d.) | N/A | N/A | 31.20 (8.87) | 30.75 (14.44) |
The temporal lobes were dissected away from the rest of the brain, and sliced into 5 mm coronal slices throughout their entire length, such that the entirety of the hippocampus was available for histological examination. Each slice was embedded in paraffin wax, and a 25 μm section was cut from its anterior face, mounted on a coated slide, stained with cresyl violet and luxol fast blue, and coverslipped. The outlines of four cytoarchitecturally defined hippocampal subfields were delineated in the manner described by West & Gundersen (Reference West and Gundersen1990):
-
(a) the hilus (CA4)
-
(b) an amalgamation of the CA2 and CA3 subfields (hereafter CA2/3)
-
(c) the CA1 subfield
-
(d) the subiculum.
The volume density (V v ) of these subfields was measured on both sides of the brain, using stereological point-counting techniques (Reference Howard and ReedHoward & Reed, 1998). Volume density in this study refers to the proportion of each hippocampal subfield that is occupied by pyramidal neuronal cell bodies.
The prepared slides were examined using a 660 objective and an Olympus BX50 microscope mounted with a JVC TK-C1380 colour video camera and stage motor, which in turn were controlled and viewed on a computer running the Olympus Cast-Grid 2.0 stereology sampling software. On each slide, each subfield was examined at specific points positioned in a raster search pattern array which covered the entirety of the subfield (Fig. 1). The search pattern was 0.5×0.5 mm2 for the hilus and CA2/3 subfields, 1×1mm2 for the CA1 subfield, and 0.75×0.75 mm2 for the subiculum. Each subfield appeared on an average of 6.7 slides per case (range 3–15; in a few cases the hippocampus was cut obliquely, which meant it appeared in few sections, although this did not alter the intensity of the sampling). Neuron density (N v ) was counted in a mean 57 dissectors and volume density (V v ) was assessed with a mean 88 frames per case; a mean of 89 neurons were counted for N v , and a mean of 135 points were counted for V v estimation per case. At each such point a plane within the section was brought into focus, and an array of 36 random test points thrown over the microscope image. The number of test points that fell over pyramidal cell bodies was counted, and the mean number of point counts (P̄[notdef]) per image calculated. Pyramidal cells were identified on the basis of their position, orientation shape, presence of an apical dendrite and prominent, single nucleolus. The volume density was calculated for each subfield by V v = P̄/36.
Hippocampal region CA2/3 with superimposed raster sampling pattern.

In a previous study, the neuron density (number of cells per unit volume, N v ) within each hippocampal subfield had been estimated (Reference Walker, Highley and EsiriWalker et al, 2002; further details available from the author upon request). Using these data, the mean pyramidal cell body volume (V N ) was calculated using the formula V N = Vv /Nv .
Statistical methods
The cell volume for each subfield was assessed by repeated-measures analysis of covariance (ANCOVA), with diagnosis and gender as between-subject factors and side as a within-subject factor, using SAS version 6.12 for Macintosh. As there was a significant difference between the brains from the control and schizophrenia groups in the duration spent in formalin prior to histological preparation, this variable was entered as a covariate in the ANCOVA model. The main effect of diagnosis, gender, and interactions of these with side, gender, and gender and side together were tested for. Given the number of effects tested for each measure, α was set at 0.01. Thus, for an effect to be significant, it had to generate a value for P of 0.01 or below.
RESULTS
Quality of measures
The observed coefficient of error (OCE) for the individual estimates of subfield volume, cell density and cell number were calculated for 10 cases in the manner described by Gundersen & Jensen (Reference Gundersen and Jensen1987) and West & Gundersen (Reference West and Gundersen1990). This coefficient is a measure of the variability of measures of a specific structure across different slices; possible values are 0 to 1. It is increased by irregularly shaped structures and by inaccurate and unreliable measurement. For the measures of V N , the mean OCE values were all ≥0.121. For the measures of V v , mean OCE values were all ≥0.061. For N v , the mean values of OCE were all ≥0.1001. The values of OCE can be used to estimate the percentage of observed relative variance, (s.d./x̄[notdef])2, of each measure which is accounted for by true inter-individual variance, as opposed to the stereological volume estimate (Reference West and GundersenWest & Gundersen, 1990; Reference WestWest, 1999). Ideally, this should be greater than 50%. This was true for all measures of V N (all 580.2%). The conclusion to be drawn is that the measures are of adequate reliability and accuracy.
Effects of diagnosis, gender and side
A bar chart of mean cell volume is given in Fig. 2. The mean cell volumes (standard deviations in parentheses) for the subfields were as follows:
Pyramidal cell volumes for hippocampal subregions (bars show means and standard error of the mean). Cases have been subdivided according to gender and disease category.
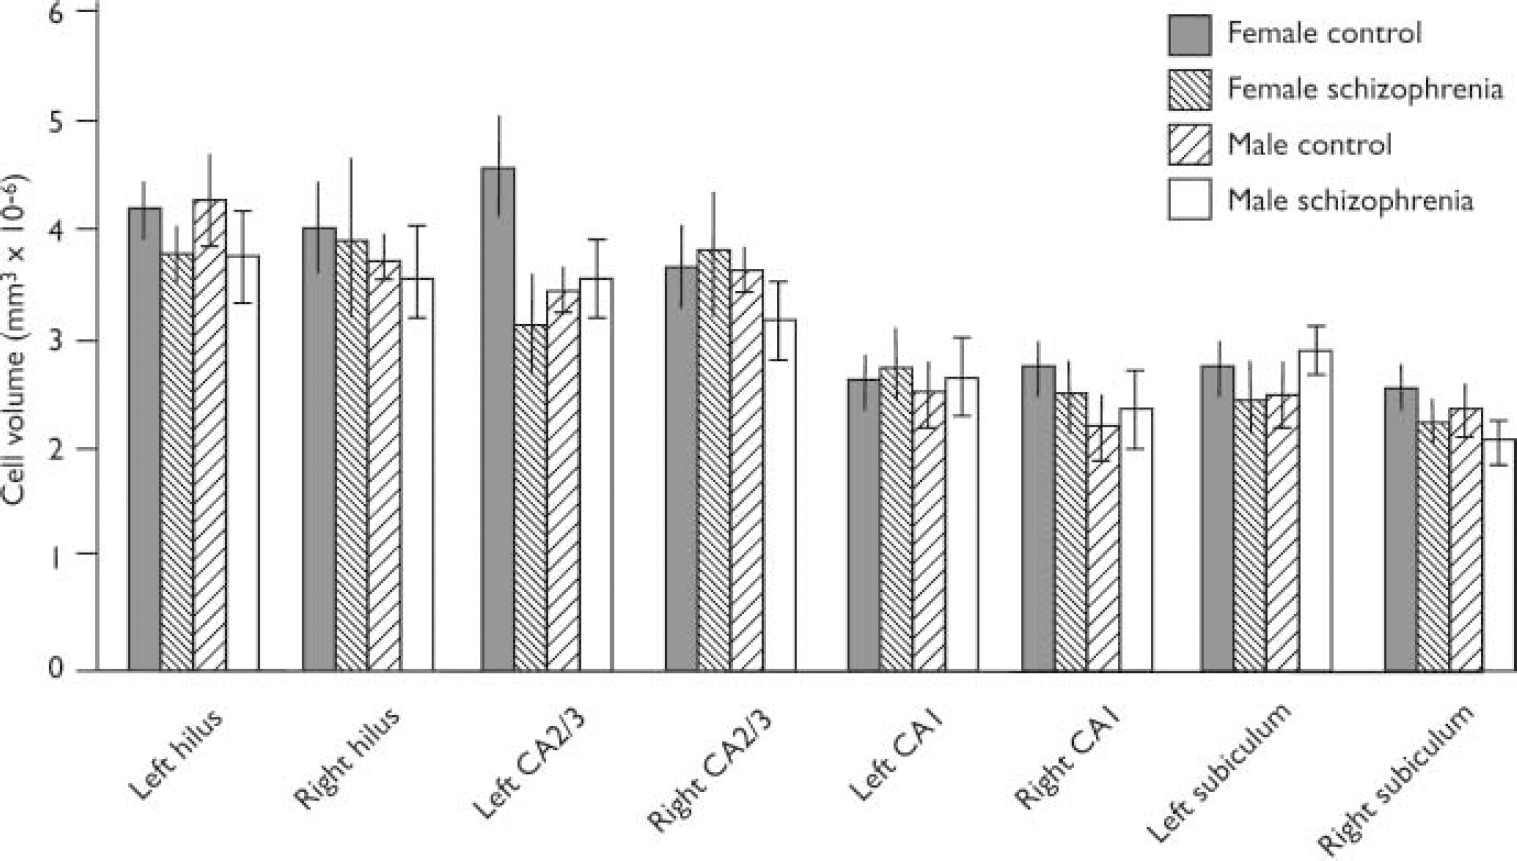
-
(a) hilus: 4.0861076 (0.8461076) for controls and 3.8261076 (1.236 1076)mm3 for patients;
-
(b) CA2/3: 3.8861076 (1.0961076)mm3 for controls and 3.4561076 (1.056 1076)mm3 for patients;
-
(c) CA1: 2.5461076 (0.5961076)mm3 for controls and 2.6061076 (0.676 1076)mm3 for patients;
-
(d) subiculum: 2.5261076 (0.576 1076)mm3 for controls and 2.256 1076 (0.4661076)mm3 for patients.
There was no significant effect for diagnosis, gender or side for any subfield. Thus, for the hilus, all F (1,24) ≤ 1.22, P ≥ 0.2021; for the CA2/3 subfield, all F (1,24) ≤ 3.25, P ≥ 0.0842; for the CA1 subfield, all F (1,23) ≤ 1.35, P ≥ 0.2574; for the subiculum, all F (1,23) ≤ 2.19, P ≥ 0.1522.
DISCUSSION
The main finding in this study is an absence of size change in hippocampal pyramidal neurons in schizophrenia. There have been five earlier studies of this parameter of which we are aware (Reference Christison, Casanova and WeinbergerChristison et al, 1989; Reference West and GundersenWest & Gundersen, 1990; Benes et al, Reference Benes, Sorensen and Bird1991, Reference Benes, Kwok and Vincent1998; Reference Arnold, Franz and GurArnold et al, 1995; Reference Zaidel, Esiri and HarrisonZaidel et al, 1997; Reference WestWest, 1999); two of them found no change, and three found a decrease in size in schizophrenia. All had comparable numbers of cases of schizophrenia to the number in the present study. Control case numbers were similar to our study in four studies but were larger in one other negative study. All studies used the Nissl stain. Only one previous study in addition to ours looked at both sides of the brain, and only our study sampled the hippocampus throughout its full extent.
We addressed the potential of regional specificity of changes in schizophrenia by dividing the hippocampus into four subfields. We did not further divide our hippocampal subfields into anterior and posterior halves. It is thus possible that changes in one half (anterior or posterior) of a subfield might have been masked or ‘diluted’ by variance in the other half. In a meta-analysis of hippocampal volumes in schizophrenia assessed by MRI it was found that inclusion of the amygdala, abutting on the anterior hippocampus, in the region of interest significantly increased the size of the reduction in volume seen in schizophrenia. The recommendation was made that in future research relative alterations in anterior and posterior hippocampus in schizophrenia should be assessed separately (Reference Nelson, Saykin and FlashmanNelson et al, 1998). It is also possible that our study might have failed to detect a ‘true’ reduction in cell size in some hippocampal subfields because of the small sample size (type II error).
Decreases in neuronal size have been reported for other regions of the brain in schizophrenia – the dorsolateral prefrontal cortex, anterior cingulate cortex, cerebellar Purkinje cells, substantia nigra and locus caeruleus – but not in the motor cortex or calcarine cortex (reviewed by Reference HarrisonHarrison, 1999). Further studies will be needed before the primacy of these changes in the disease can be judged.
Clinical Implications and Limitations
CLINICAL IMPLICATIONS
-
▪ Memory impairments in schizophrenia cannot be attributed to alterations in size of hippocampal neurons.
-
▪ Reduction in size of the hippocampus in schizophrenia is not explained by reduced hippocampal neuron size.
LIMITATIONS
-
▪ The sample sizes are relatively small.
-
▪ There is the possibility of a type II error (failure to detect a true difference between the brains of people with and without schizophrenia).
-
▪ The hippocampus was analysed as a whole, so changes in a part, such as the anterior half, might have been missed.
Acknowledgements
This work was funded by grants from the UK Medical Research Council and the. Wellcome Trust. We thank Drs S. J. Cooper and B. Herron for assistance with. clinical assessment and post-mortem brain removal respectively for some of the. cases included in this study.


eLetters
No eLetters have been published for this article.