





1 Introduction
Item response theory (IRT) models, also known as latent trait (analysis) models, have been widely used in measurement testing for several decades. They originated from analyzing dichotomous items (Lord, Reference Lord1953; Rasch, Reference Rasch1961), soon extended to modeling polychotomous items (Darrell Bock, Reference Darrell Bock1972; Samejima, Reference Samejima1970). The applications of IRT models became diverse from education and psychology to political science, clinical and health studies, marketing, and so on. One of the most famous IRT models is the Rasch model (Rasch, Reference Rasch1961), belonging to one-parameter IRT models, which is typically specified as
 $$ \begin{align} \mathrm{Pr}(X_{i,l}=1 \mid \theta_i,d_l) = & \mathrm{F} (\theta_i-d_l), \end{align} $$
where the subscript $(i,l)$
is used to index i-th person and l-th item,
$(i,l)$
is used to index i-th person and l-th item, $X_{i,l}$
then represents the correctness of the answer (
$X_{i,l}$
then represents the correctness of the answer ( $1$
if correct,
$1$
if correct, $0$
otherwise),
$0$
otherwise), $\theta _i$
is one’s ability,
$\theta _i$
is one’s ability, $d_{l}$
denotes the item difficulty, and
$d_{l}$
denotes the item difficulty, and $\mathrm {F}(x)$
is a cumulative distribution function (cdf) for continuous random variables and
$\mathrm {F}(x)$
is a cumulative distribution function (cdf) for continuous random variables and $\mathrm {F}^{-1}(\cdot )$
is called the link function. For the Rasch model, the link function is chosen to be logistic. Often, IRT models are based on the local independence assumption, which means, conditionally on
$\mathrm {F}^{-1}(\cdot )$
is called the link function. For the Rasch model, the link function is chosen to be logistic. Often, IRT models are based on the local independence assumption, which means, conditionally on $\theta _i$
,
$\theta _i$
, $d_l$
, (as in (1.1)), the item response variables
$d_l$
, (as in (1.1)), the item response variables $X_{i,l}$
’s are independent.
$X_{i,l}$
’s are independent.
1.1 EdSphere testbed
Our study is motivated by the EdSphere dataset provided by High Road Learning Company. EdSphere is a personalized literacy learning platform that continuously collects data about student performance and strategic behaviors each time when he/she reads an article. The data were generated during each session when a student read an article selected from a large bank of articles. A session begins like this: a student selects from a generated list of articles having text complexities in a range targeted to his/her current ability estimate. The text complexity is measured in other platforms (cf. Swartz et al. (Reference Swartz, Hanlon, Childress and Stenner2016) and Stenner (Reference Stenner2022) for more details). Once the article is chosen, the computer, following a prescribed protocol, randomly selects a sample of the eligible words to be “clozed,” that is, to be removed and replaced by blanks, and presents the article to the student with these words clozed. When a blank is encountered while reading the article, the student clicks it and then the true removed word along with three incorrect options called foils are presented. As with the target word, the foils are selected randomly according to a prescribed protocol. The student has to select a word to fill in the blank from the four choices before he/she can move to the next question and an immediate feedback is provided in the form of the correct answer. The dichotomous items produced by this procedure are called “Auto-Generated-Cloze” items, which are randomized items. This type of item implies that even if two students select the same article to read, the sets of target words and foils will be different. As a consequence, it is not feasible to obtain data-based estimates of item parameters.
The EdSphere dataset consists of 16,949 students who registered over five years in the EdSphere learning platform at a school district in Mississippi. The students were in different grades and could enter and leave the program at different times between 2007 and 2011. They can take tests on different days and have different time lapses between tests, which indicates the responses observed are longitudinal at individually-varying and irregularly-spaced time points. Thus, a dynamic structure to modeling changes of latent traits is needed. In addition, as mentioned in Wang et al. (Reference Wang, Berger and Burdick2013), in the environment of EdSphere, the factors, such as test random effects (e.g., an overall comprehension of the article) and daily random effects (such as the person’s emotional status and other factors), might undermine the local independence assumption of classic IRT models.
To summarize, the EdSphere dataset has several distinctive features that often do not appear in a classic paper-and-pencil test, i.e., randomized items, longitudinal observations, and local dependence, making the use of classic IRT models face great challenges.
1.2 Recent developments of IRT models
To address these challenges in the advent of the modern computerized (adaptive) testing, there have been many developments of IRT models in the literature. For the generalization of IRT models to longitudinal data, some researchers used parametric function of time to model the changes of latent traits (Albers et al., Reference Albers, Does, Imbos and Janssen1989; Johnson & Raudenbush, Reference Johnson and Raudenbush2006; Verhagen & Fox, Reference Verhagen and Fox2013) and Wang & Nydick (Reference Wang and Nydick2020) unified various longitudinal IRT models in terms of expressions using the function of time. Recently, Liu & Wang (Reference Liu and Wang2020) further developed a flexible nonparametric function of the time to model the latent trajectory. On the other hand, some researchers applied a Markov chain model to describe the time dependence of latent traits (Martin & Quinn, Reference Martin and Quinn2002; Park, Reference Park2011). To take account of local dependence issues, there have been parallel developments for the procedures of detecting it (Chen & Thissen, Reference Chen and Thissen1997; Christensen et al., Reference Christensen, Makransky and Horton2017; Liu & Maydeu-Olivares, Reference Liu and Maydeu-Olivares2013; Yen, Reference Yen1984) and ways of modeling it (Bradlow et al., Reference Bradlow, Wainer and Wang1999; Cai, Reference Cai2010; Jannarone, Reference Jannarone1986; Olsbjerg & Christensen, Reference Olsbjerg and Christensen2015). To deal with randomized items, often introduce random effects for item parameters (De Boeck, Reference De Boeck2008; Sinharay et al., Reference Sinharay, Johnson and Williamson2003).
However, the current literature that focuses on three challenges simultaneously is very limited. Wang et al. (Reference Wang, Berger and Burdick2013) developed a new class of state space models, called dynamic item response (DIR) models, to address the three challenges within one unified framework. In this regard, their work is pioneering but they ignored the usage of the response time information, which is often easily obtained during computerized tests. When response accuracy and response time are both available in a test, Thissen (Reference Thissen and Weiss1983) argued that the separate analysis of them might yield misleading inferences. Their points are further guarded by other researchers (Ferrando & Lorenzo-Seva, Reference Ferrando and Lorenzo-Seva2007; Ranger & Kuhn, Reference Ranger and Kuhn2012; Van der Linden et al., Reference Van der Linden, Klein Entink and Fox2010; Wang et al., Reference Wang, Weiss and Su2019), who showed that using response times as auxiliary information has improved the estimation of certain parameters in IRT models. In this article, we have considered the response times with the joint analysis of the response accuracy in a computerized (adaptive) testing. From our simulation and real data analysis, we also demonstrate that there are improvements in terms of accuracy and bias for the estimates of ability in the longitudinal study. This is a pretty important point because the algorithm for running a computerized (adaptive) testing is often focused on matching the difficulty of the test material with the current ability of an examinee. Hence, with more accurate estimates of one’s ability, the practitioners and educators can obtain better designs in the computerized (adaptive) testing. In addition, teachers can better assign the learning materials for students to study according to their respective capacities.
1.3 Recent developments for modeling response times in educational testing
To model the response time of an item, one way is to treat it as a causal factor for the accuracy of that item (Roskam, Reference Roskam1997; Wang & Hanson, Reference Wang and Hanson2005). Another idea is to regard the response accuracy as a causal factor for the response time (Gaviria, Reference Gaviria2005). However, both ideas have been criticized since the response time and accuracy of a test may not be directly related. Instead, the third way is to jointly model response times and item responses in a hierarchical fashion.
There are two popular classes of joint modeling. One popular choice is Thissen’s (Reference Thissen and Weiss1983) model, i.e., taking the natural logarithm of response times and modeling as
 $$ \begin{align} \log R_{i,l} & = \mu-\nu_i + \tau_{l}+\beta L(\theta_i-d_l)+\zeta_{i,l}, \end{align} $$
where $R_{i,l}$
indicates the time used for answering the lth question by the ith person,
$R_{i,l}$
indicates the time used for answering the lth question by the ith person, $\nu _i$
is the speediness parameter, which takes account of the time that a person spends for infinitely easy set of problems,
$\nu _i$
is the speediness parameter, which takes account of the time that a person spends for infinitely easy set of problems, $\tau _{l}$
is the slowness intensity of a question, which dictates the time taken due to the nature of the problem,
$\tau _{l}$
is the slowness intensity of a question, which dictates the time taken due to the nature of the problem, $\mu $
is the overall mean,
$\mu $
is the overall mean, $\zeta _{i,l}$
is the residual,
$\zeta _{i,l}$
is the residual, $\beta $
is a slope, and
$\beta $
is a slope, and $L(x)$
denotes a linear function mapping how the distance of ability and item difficulty connects with response times.
$L(x)$
denotes a linear function mapping how the distance of ability and item difficulty connects with response times.
For Equation (1.2), there are two popular choices for $L(x)$
, one is a monotone mapping (Gaviria, Reference Gaviria2005; Thissen, Reference Thissen and Weiss1983), reflecting the idea that the larger the distance between one’s ability and item difficulty is, the more time one spends to finish a question; the other one is an inverted U-shaped mapping, originating from the findings (Wang, Reference Wang2006; Wang & Zhang, Reference Wang and Zhang2006) that examinees generally spend more time on items that match their ability levels, while spend less time on items either too easy or too hard. Besides, there are several papers using the inverted U-shape for regressing response times in the analysis of personality and psychology tests (Ferrando & Lorenzo-Seva, Reference Ferrando and Lorenzo-Seva2007; Molenaar et al., Reference Molenaar, Rózsa and Kõ2021; Ranger & Kuhn, Reference Ranger and Kuhn2012). Intuitively, the negative
$L(x)$
, one is a monotone mapping (Gaviria, Reference Gaviria2005; Thissen, Reference Thissen and Weiss1983), reflecting the idea that the larger the distance between one’s ability and item difficulty is, the more time one spends to finish a question; the other one is an inverted U-shaped mapping, originating from the findings (Wang, Reference Wang2006; Wang & Zhang, Reference Wang and Zhang2006) that examinees generally spend more time on items that match their ability levels, while spend less time on items either too easy or too hard. Besides, there are several papers using the inverted U-shape for regressing response times in the analysis of personality and psychology tests (Ferrando & Lorenzo-Seva, Reference Ferrando and Lorenzo-Seva2007; Molenaar et al., Reference Molenaar, Rózsa and Kõ2021; Ranger & Kuhn, Reference Ranger and Kuhn2012). Intuitively, the negative $\beta $
in front of
$\beta $
in front of $L(x)$
for either monotone or inverted U-shaped mapping makes more sense in reality.
$L(x)$
for either monotone or inverted U-shaped mapping makes more sense in reality.
Another popular choice of joint models utilizes a hierarchical framework to conjointly model response times and accuracy but without specifying any explicit relationship between them (Klein Entink, Reference Klein Entink2009; Loeys et al., Reference Loeys, Rosseel and Baten2011; Van der Linden, Reference Van der Linden2007). Instead, they assigned joint multivariate normal priors to link different parameters in the joint models. Recently, this type of joint model has been extended to conjointly modeling with omission behavior (Ulitzsch et al., Reference Ulitzsch, von Davier and Pohl2020) or paper-and-pencil tests (Liu et al., Reference Liu, Wang, Hancock and Chen2022); to consider varying speed across dimensions of ability in the model (Zhan et al., Reference Zhan, Jiao, Man, Wang and He2021); to incorporate a covariance structure to explain the local dependency between speed and accuracy (Meng et al., Reference Meng, Tao and Chang2015); and to adopt a hidden Markov structure to separate between-subjects ability and speed variables from the within-subjects states variables (Molenaar et al., Reference Molenaar, Oberski, Vermunt and De Boeck2016).
However, all existing joint models are centered on a one-time exam for test takers without considering the time frequency feature of computerized testing. In this article, we aim to fill in this gap. Motivated by EdSphere datasets, we propose a joint model of response times with response accuracy for testing data collected at irregular and individual varying time points. Of course, our proposed joint model can easily be modified for use in the analysis of longitudinal data with a simpler structure than we discuss here.
Furthermore, we have proposed two empirical methods to test which linkage function $L(x)$
in the joint models is more helpful in providing additional information to estimate ability. First, we propose Lindley’s method (Lindley, Reference Lindley1965) to check whether the regression slope
$L(x)$
in the joint models is more helpful in providing additional information to estimate ability. First, we propose Lindley’s method (Lindley, Reference Lindley1965) to check whether the regression slope $\beta $
in front of
$\beta $
in front of $L(x)$
is significant or not. Second, we develop a model selection method, called the partial DIC criterion, to compare different
$L(x)$
is significant or not. Second, we develop a model selection method, called the partial DIC criterion, to compare different $L(x)$
’s in the joint model for modeling the relationships between the response time and the ability–difficulty distance.
$L(x)$
’s in the joint model for modeling the relationships between the response time and the ability–difficulty distance.
1.4 Preview
In Section 2, we put forward a new class of joint models for IRT models with response times, called DIR and response time models (DIR-RT models). Because of the complexity of the model considered, Bayesian inference and Markov chain Monte Carlo (MCMC) computational techniques will be presented in Section 3. In Section 4, we validate the proposed Bayesian inference procedure via some simulations and compare the performance of DIR-RT models with respect to DIR models. We illustrate the application of DIR-RT models to EdSphere testbed datasets in Section 5, where we further provide an empirical justification of goodness of fit among DIR-RT models with different choices of $L(x)$
in order to examine the better linkage to jointly model response times with IRT parameters. In Section 6, we point out some significant psychological implications from the analysis of the EdSphere dataset and discuss future research directions.
$L(x)$
in order to examine the better linkage to jointly model response times with IRT parameters. In Section 6, we point out some significant psychological implications from the analysis of the EdSphere dataset and discuss future research directions.
2 Joint models of dynamic item responses and response times
Clearly, modeling (1.1) and (1.2) jointly can maximize the information on inferring one’s ability $\theta _i$
and the item difficulty
$\theta _i$
and the item difficulty $d_l$
. Thus, we propose a two-level joint model. The first level has two sub-models to concurrently model the observations of response time and response accuracy with certain shared parameters, and the second level introduces a dynamic model to capture changes of latent traits over time. Although our investigation begins with an extension of the one-parameter IRT, it would be straightforward to generalize our proposed models to a two-parameter or three-parameter IRT model.
$d_l$
. Thus, we propose a two-level joint model. The first level has two sub-models to concurrently model the observations of response time and response accuracy with certain shared parameters, and the second level introduces a dynamic model to capture changes of latent traits over time. Although our investigation begins with an extension of the one-parameter IRT, it would be straightforward to generalize our proposed models to a two-parameter or three-parameter IRT model.
2.1 First level: The observation equations in DIR-RT models
Equations (1.1) and (1.2) are based on a one-time exam for each test taker. To consider a much complex data structure in the computerized test (as in the EdSphere testbed), we first expand the labels of notations. Let $X_{i,t,s,l}$
be the item response to indicate the correctness for the answer of the lth item in the sth test on the tth day given by the ith person, where
$X_{i,t,s,l}$
be the item response to indicate the correctness for the answer of the lth item in the sth test on the tth day given by the ith person, where $i=1,\ldots ,n$
(number of subjects);
$i=1,\ldots ,n$
(number of subjects); $t=1,\ldots ,T_i$
(number of test dates);
$t=1,\ldots ,T_i$
(number of test dates); $s=1,\ldots ,S_{i,t}$
(number of tests in a day); and
$s=1,\ldots ,S_{i,t}$
(number of tests in a day); and $l=1,\ldots ,K_{i,t,s}$
(number of items in a test). Likewise, denote the difficulty of the lth item as
$l=1,\ldots ,K_{i,t,s}$
(number of items in a test). Likewise, denote the difficulty of the lth item as $d_{i,t,s,l}$
. It is ideal to record the time for each examinee spending on a single item, however, in practice, more often the time spent on the entire exam is merely stored for each individual (a case for reading comprehension tests in EdSphere datasets). Thus, in our proposed models, the response time is defined at the test level, i.e.,
$d_{i,t,s,l}$
. It is ideal to record the time for each examinee spending on a single item, however, in practice, more often the time spent on the entire exam is merely stored for each individual (a case for reading comprehension tests in EdSphere datasets). Thus, in our proposed models, the response time is defined at the test level, i.e., $R_{i,t,s}$
, implying the time spent on the sth test for the ith individual on the tth day; whereas, our models can be easily revised to cope with the response time stored for each item whenever such data are available.
$R_{i,t,s}$
, implying the time spent on the sth test for the ith individual on the tth day; whereas, our models can be easily revised to cope with the response time stored for each item whenever such data are available.
The label extension illustrates two major features of computerized (adaptive) testing: 1) there are few replications of items among different time, tests, and test takers and 2) the observations are recorded at individually-varying and irregularly-spaced time points. In our study, only $X_{i,t,s,l}$
’s and
$X_{i,t,s,l}$
’s and $R_{i,t,s}$
’s are observed. Usually, the response time is naturally bounded away from zero, and a logarithmic transformation of
$R_{i,t,s}$
’s are observed. Usually, the response time is naturally bounded away from zero, and a logarithmic transformation of $R_{i,t,s}$
is taken to remove its skewness (Fox & Marianti, Reference Fox and Marianti2016; Liu et al., Reference Liu, Wang, Hancock and Chen2022; Van der Linden et al., Reference Van der Linden, Klein Entink and Fox2010).
$R_{i,t,s}$
is taken to remove its skewness (Fox & Marianti, Reference Fox and Marianti2016; Liu et al., Reference Liu, Wang, Hancock and Chen2022; Van der Linden et al., Reference Van der Linden, Klein Entink and Fox2010).
2.1.1 The observation equations of item responses
Often in a design of computerized tests, item difficulty, i.e., $d_{i,t,s,l}$
, is a randomized parameter, assumed to be randomly selected from a bank of items with a certain ensemble mean. Thus, we model
$d_{i,t,s,l}$
, is a randomized parameter, assumed to be randomly selected from a bank of items with a certain ensemble mean. Thus, we model $d_{i,t,s,l}=a_{i,t,s}+\epsilon _{i,t,s,l}$
as a measurement error model with
$d_{i,t,s,l}=a_{i,t,s}+\epsilon _{i,t,s,l}$
as a measurement error model with $a_{i,t,s}$
being an ensemble mean difficulty of items in the sth test, and
$a_{i,t,s}$
being an ensemble mean difficulty of items in the sth test, and $\epsilon _{i,t,s,l}\sim \mathcal {N}(0,\sigma ^2)$
with
$\epsilon _{i,t,s,l}\sim \mathcal {N}(0,\sigma ^2)$
with $\sigma ^2$
known according to the test design. Here,
$\sigma ^2$
known according to the test design. Here, $\mathcal {N} (\cdot , \cdot )$
denotes a normal distribution. Similarly, as Wang et al. (Reference Wang, Berger and Burdick2013) did, we extend classic one-parameter IRT models as
$\mathcal {N} (\cdot , \cdot )$
denotes a normal distribution. Similarly, as Wang et al. (Reference Wang, Berger and Burdick2013) did, we extend classic one-parameter IRT models as
 $$ \begin{align} &\mathrm{Pr}(X_{i,t,s,l}=1\mid \theta_{i,t}, \varphi_{i,t}, \eta_{i,t,s}, a_{i,t,s}) =\mathrm{F}(\theta_{i,t}-a_{i,t,s}+\varphi_{i,t}+\eta_{i,t,s}+\epsilon_{i,t,s,l}), \end{align} $$
where $\theta _{i,t}$
represents the ith person’s ability on day t, with the assumption that one’s ability is constant over a given day;
$\theta _{i,t}$
represents the ith person’s ability on day t, with the assumption that one’s ability is constant over a given day; $\varphi _{i,t}$
and
$\varphi _{i,t}$
and $\eta _{i,t,s}$
take account of daily and test random effects, respectively, to explain the possible local dependence of item responses. Further, assume
$\eta _{i,t,s}$
take account of daily and test random effects, respectively, to explain the possible local dependence of item responses. Further, assume $\varphi _{i,t}\sim \mathcal {N}(0,\delta _{i}^{-1})$
with its precision unknown and different for each person. To make
$\varphi _{i,t}\sim \mathcal {N}(0,\delta _{i}^{-1})$
with its precision unknown and different for each person. To make $\eta _{i,t,s}$
well separate from
$\eta _{i,t,s}$
well separate from $\varphi _{i,t}$
in inference, we denote
$\varphi _{i,t}$
in inference, we denote ${\eta }_{i,t}=(\eta _{i,t,1},\ldots ,\eta _{i,t,S_{i,t}})'$
as the vector of test random effects on day t for the individual i and let
${\eta }_{i,t}=(\eta _{i,t,1},\ldots ,\eta _{i,t,S_{i,t}})'$
as the vector of test random effects on day t for the individual i and let $\mathbf {I}_{S_{i,t}}$
be an
$\mathbf {I}_{S_{i,t}}$
be an $S_{i,t}\times S_{i,t}$
identity matrix, then assume
$S_{i,t}\times S_{i,t}$
identity matrix, then assume ${\eta }_{i,t} \sim \mathcal {N}_{S_{i,t}}(0,\tau _i^{-1}\mathbf { I}_{S_{i,t}} \mid \sum _{s=1}^{S_{i,t}}\eta _{i,t,s}=0)$
. The reason for letting
${\eta }_{i,t} \sim \mathcal {N}_{S_{i,t}}(0,\tau _i^{-1}\mathbf { I}_{S_{i,t}} \mid \sum _{s=1}^{S_{i,t}}\eta _{i,t,s}=0)$
. The reason for letting $\eta _{i,t}$
be a singular multivariate normal (by setting the sum of test random effects to be zero on a day t) is to remove any possibility of unidentifiability issues between daily and test random effects. Notice that we use precision parameters instead of variance parameters for normal distributions as it is more convenient to draw precision parameters in the MCMC. Here, we choose
$\eta _{i,t}$
be a singular multivariate normal (by setting the sum of test random effects to be zero on a day t) is to remove any possibility of unidentifiability issues between daily and test random effects. Notice that we use precision parameters instead of variance parameters for normal distributions as it is more convenient to draw precision parameters in the MCMC. Here, we choose $\mathrm {F}(x)$
to be a logistic link in the analysis as per the convention in the EdSphere platform.
$\mathrm {F}(x)$
to be a logistic link in the analysis as per the convention in the EdSphere platform.
2.1.2 The observation equations of response times
When working on a task, a subject has the choice to work faster or slower. However, when we work faster, we often incline to make more unnoticeable mistakes. On the other hand, when one’s ability is not comparable to the test taken, it always takes a longer time for him/her to finish the test. Thus, we model the response time as below:
 $$ \begin{align} &\text{log} (R_{i,t,s})=\mu_{i}- \nu_{i,t}+\beta L(\theta_{i,t}-a_{i,t,s})+\zeta_{i,t,s}. \end{align} $$
Equation (2.2) is an extension of Thissen’s model (Thissen, Reference Thissen and Weiss1983) and its variations (Ferrando & Lorenzo-Seva, Reference Ferrando and Lorenzo-Seva2007; Ranger & Kuhn, Reference Ranger and Kuhn2012). In Equation (2.2), $\mu _{i}$
reflects the average response time for the ith respondent in general.
$\mu _{i}$
reflects the average response time for the ith respondent in general. $\nu _{i,t}$
implies the variation for the speed of the respondent i on the tth day, with the negative sign indicating that the slower the speed is, the more time one needs to spend on the exam. We further assume that the speed for an examinee will not change much during one day, thus the index of the speed only varies according to individuals and days and
$\nu _{i,t}$
implies the variation for the speed of the respondent i on the tth day, with the negative sign indicating that the slower the speed is, the more time one needs to spend on the exam. We further assume that the speed for an examinee will not change much during one day, thus the index of the speed only varies according to individuals and days and $\nu _{i,t}\sim \mathcal {N}(0, \kappa _i^{-1})$
, which has an individual-specific precision parameter
$\nu _{i,t}\sim \mathcal {N}(0, \kappa _i^{-1})$
, which has an individual-specific precision parameter $\kappa _i$
and zero mean (to ensure identifiability in the presence of
$\kappa _i$
and zero mean (to ensure identifiability in the presence of $\mu _i$
). In the third term,
$\mu _i$
). In the third term,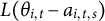 $L(\theta _{i,t}-a_{i,t,s})$
is mapping how the distance of
$L(\theta _{i,t}-a_{i,t,s})$
is mapping how the distance of $\theta _{i,t}-a_{i,t,s}$
in relationship to the response time; and
$\theta _{i,t}-a_{i,t,s}$
in relationship to the response time; and $\beta $
is a regression coefficient to adjust this relationship. Further, we assume the residual term
$\beta $
is a regression coefficient to adjust this relationship. Further, we assume the residual term $\zeta _{i,t,s},\sim \mathcal {N}(0,\varrho ^{-1})$
with
$\zeta _{i,t,s},\sim \mathcal {N}(0,\varrho ^{-1})$
with $\varrho $
as a common precision parameter to borrow the strength of the information across different tests and individuals. Although
$\varrho $
as a common precision parameter to borrow the strength of the information across different tests and individuals. Although $\varrho $
varying across individuals may be an alternative, such an assumption might cause unidentifiability issue with precision parameter
$\varrho $
varying across individuals may be an alternative, such an assumption might cause unidentifiability issue with precision parameter $\kappa _i$
when we encounter the situation that an examinee only takes one test per day.
$\kappa _i$
when we encounter the situation that an examinee only takes one test per day.
For $L(\cdot )$
, there are two popular choices in the literature. One is
$L(\cdot )$
, there are two popular choices in the literature. One is $L(\cdot )= \cdot $
, the monotone relationship and the other is
$L(\cdot )= \cdot $
, the monotone relationship and the other is $L(\cdot )=|\cdot |$
, the inverted U-shaped relationship. These two relationships represent two different psychological behaviors of test takers during an exam as discussed in Section 1.2. As far as we know, there is no formal statistical comparison of these two relationships in real examples of educational tests. We aim to fill in this gap by developing statistical technique for such comparison and applying to EdSphere datasets.
$L(\cdot )=|\cdot |$
, the inverted U-shaped relationship. These two relationships represent two different psychological behaviors of test takers during an exam as discussed in Section 1.2. As far as we know, there is no formal statistical comparison of these two relationships in real examples of educational tests. We aim to fill in this gap by developing statistical technique for such comparison and applying to EdSphere datasets.
2.2 Second level: System equations in the DIR-RT models
Following the idea of Wang et al. (Reference Wang, Berger and Burdick2013), we combine both parametric growth models and Markov chain models to capture one’s ability growth over time, that is,
 $$ \begin{align} &\theta_{i,t}=\theta_{i,t-1}+c_i(1-\rho\theta_{i,t-1})\Delta_{i,t}^{+}+w_{i,t}. \end{align} $$
The first term in Equation (2.3) denotes the ability at the previous time point, $\theta _{i,t-1}$
. The second term represents a parametric growth model with
$\theta _{i,t-1}$
. The second term represents a parametric growth model with $c_i$
as the average growth rate of the ith person’s ability over time;
$c_i$
as the average growth rate of the ith person’s ability over time; $\Delta _{i, t}^{+}=\min \{\Delta _{i,t}, T_{\max }\}$
is the time lapse between two test dates for the ith individual (i.e.,
$\Delta _{i, t}^{+}=\min \{\Delta _{i,t}, T_{\max }\}$
is the time lapse between two test dates for the ith individual (i.e., $\Delta _{i, t}$
) but truncated by a pre-specified maximum time interval
$\Delta _{i, t}$
) but truncated by a pre-specified maximum time interval $T_{\max }$
(
$T_{\max }$
( $T_{\max }=14$
is used in the application, reflecting typical holiday time for students in school);
$T_{\max }=14$
is used in the application, reflecting typical holiday time for students in school); $\rho $
is the parameter to control the rate of one’s growth, which reduces the growth rate when the ability becomes mature. Note that
$\rho $
is the parameter to control the rate of one’s growth, which reduces the growth rate when the ability becomes mature. Note that $\rho $
is known from empirical experiments in EdSphere datasets (Swartz et al., Reference Swartz, Hanlon, Childress and Stenner2016; Wang et al., Reference Wang, Berger and Burdick2013). In principle,
$\rho $
is known from empirical experiments in EdSphere datasets (Swartz et al., Reference Swartz, Hanlon, Childress and Stenner2016; Wang et al., Reference Wang, Berger and Burdick2013). In principle, $\rho $
should be individual-specific, but it is distinguishable from
$\rho $
should be individual-specific, but it is distinguishable from $c_i$
only when one’s ability level is reaching maturation; our investigation of ability growth in the EdSphere data focuses on early age students, so only the
$c_i$
only when one’s ability level is reaching maturation; our investigation of ability growth in the EdSphere data focuses on early age students, so only the $c_i$
are made individual-specific. Lastly,
$c_i$
are made individual-specific. Lastly, $w_{i,t}\sim \mathcal {N}(0,\phi ^{-1}\Delta _{i, t})$
represents the uncertainty that cannot be explained by the first two terms in Equation (2.3), where
$w_{i,t}\sim \mathcal {N}(0,\phi ^{-1}\Delta _{i, t})$
represents the uncertainty that cannot be explained by the first two terms in Equation (2.3), where $\phi $
is a common unknown parameter to help borrow information and avoid substantial risks of confounding in the likelihood between
$\phi $
is a common unknown parameter to help borrow information and avoid substantial risks of confounding in the likelihood between $\delta _i$
’s and
$\delta _i$
’s and $\phi ^{-1}\Delta _{i,t}$
when the time lapses between tests are equally spaced for a student. The variance of
$\phi ^{-1}\Delta _{i,t}$
when the time lapses between tests are equally spaced for a student. The variance of $w_{i,t}$
presumes that one’s ability changes become more uncertain, if he/she is absent for a long period. Moreover, we can write Equation (2.3) as a first-order Markov process (see Step 2 of Appendix A.1), which is beneficial for conducting MCMC later.
$w_{i,t}$
presumes that one’s ability changes become more uncertain, if he/she is absent for a long period. Moreover, we can write Equation (2.3) as a first-order Markov process (see Step 2 of Appendix A.1), which is beneficial for conducting MCMC later.
2.3 A summary of DIR-RT models
To summarize, the proposed one-parameter DIR-RT model has two levels:
 $$ \begin{align*} \textit{2nd level:} ~~~& \ \theta_{i,t}=\theta_{i,t-1}+c_i(1-\rho\theta_{i,t-1})\Delta_{i,t}^{+}+w_{i,t}, \\ &\hspace{-32pt} \textit{1st level:} ~~~ \mathrm{Pr}(X_{i,t,s,l}=1\mid \theta_{i,t}, \varphi_{i,t}, \eta_{i,t,s}, a_{i,t,s}, \epsilon_{i,t,s,l}) \\ &~~~~~~~~~~~~~~~~~~~=\frac{\exp(\theta_{i,t}-a_{i,t,s}+\varphi_{i,t}+\eta_{i,t,s}+\epsilon_{i,t,s,l})}{1+\exp(\theta_{i,t}-a_{i,t,s}+\varphi_{i,t}+\eta_{i,t,s}+\epsilon_{i,t,s,l})}, \\ & \ \log(R_{i,t,s})=\mu_{i}-\nu_{i,t}+\beta L(\theta_{i,t}-a_{i,t,s})+\zeta_{i,t,s}, \end{align*} $$
where $R_{i,t,s}$
and
$R_{i,t,s}$
and $X_{i,t,s,l}$
are observed;
$X_{i,t,s,l}$
are observed; $a_{i,t,s}$
’s,
$a_{i,t,s}$
’s, $\rho $
,
$\rho $
, $\Delta _{i,t}^{+}$
’s, and
$\Delta _{i,t}^{+}$
’s, and $\Delta _{i,t}$
’s are known and
$\Delta _{i,t}$
’s are known and $\epsilon _{i,t,s,l}\sim \mathcal {N}(0,\sigma ^2)$
with known
$\epsilon _{i,t,s,l}\sim \mathcal {N}(0,\sigma ^2)$
with known $\sigma ^2$
. Also, we have the assumptions
$\sigma ^2$
. Also, we have the assumptions $\varphi _{i,t}\sim \mathcal {N}(0,\delta _{i}^{-1})$
,
$\varphi _{i,t}\sim \mathcal {N}(0,\delta _{i}^{-1})$
, ${\eta }_{i,t} \sim \mathcal {N}_{S_{i,t}}(0,\tau _i^{-1}\mathbf {I}_{S_{i,t}} \mid \sum _{s=1}^{S_{i,t}}\eta _{i,t,s}=0)$
,
${\eta }_{i,t} \sim \mathcal {N}_{S_{i,t}}(0,\tau _i^{-1}\mathbf {I}_{S_{i,t}} \mid \sum _{s=1}^{S_{i,t}}\eta _{i,t,s}=0)$
, $w_{i,t}\sim \mathcal {N}(0, \phi ^{-1}\Delta _{i,t})$
,
$w_{i,t}\sim \mathcal {N}(0, \phi ^{-1}\Delta _{i,t})$
, $\zeta _{i,t,s}\sim \mathcal {N} (0,\varrho ^{-1}),$
and
$\zeta _{i,t,s}\sim \mathcal {N} (0,\varrho ^{-1}),$
and $\nu _{i,t}\sim \mathcal {N} (0, \kappa _i^{-1})$
. Here,
$\nu _{i,t}\sim \mathcal {N} (0, \kappa _i^{-1})$
. Here,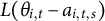 $ L(\theta _{i,t}-a_{i,t,s})$
can either monotone relationship
$ L(\theta _{i,t}-a_{i,t,s})$
can either monotone relationship $(\theta _{i,t}-a_{i,t,s})$
or inverted U-shaped relationship
$(\theta _{i,t}-a_{i,t,s})$
or inverted U-shaped relationship $|\theta _{i,t}-a_{i,t,s}|$
.
$|\theta _{i,t}-a_{i,t,s}|$
.
3 Statistical inference
In order to estimate the uncertainties of unknowns in such a complex model structure, we employ Bayesian inference and MCMC computation in this section.
3.1 Prior distributions for the unknown parameters
Prior choice is crucial in any Bayesian analysis. In the absence of expert’s knowledge or historical information, objective priors are used for the unknown parameters to avoid the large impacts of priors on the inference but to have some good frequentist properties (Berger, Reference Berger2006). Whenever scientific knowledge is available, we instead want to incorporate the information into the prior specifications.
Following these rules, a natural choice for the prior of one’s initial latent ability is $ \theta _{i,0}\sim \mathcal {N}(\mu _{G_{j_i}}, V_{G_{j_i}}), $
where
$ \theta _{i,0}\sim \mathcal {N}(\mu _{G_{j_i}}, V_{G_{j_i}}), $
where $\mu _{G_{j_i}}$
and
$\mu _{G_{j_i}}$
and $V_{G_{j_i}}$
are the mean and the variance of the subpopulation (j) to which an individual i belongs. Since
$V_{G_{j_i}}$
are the mean and the variance of the subpopulation (j) to which an individual i belongs. Since $c_i$
’s in Equation (2.3) are the average growth rates (or the average learning rate in an educational context), it is often assumed to be positive, thus we specify
$c_i$
’s in Equation (2.3) are the average growth rates (or the average learning rate in an educational context), it is often assumed to be positive, thus we specify $c_i$
as
$c_i$
as $ \pi (c_i)\propto {\mathcal {I}}(c_i\geq 0), \ \text {for all} \ i, $
where
$ \pi (c_i)\propto {\mathcal {I}}(c_i\geq 0), \ \text {for all} \ i, $
where ${\mathcal {I}}(\cdot )$
is an indicator function. The speed
${\mathcal {I}}(\cdot )$
is an indicator function. The speed $\kappa _i$
’s and the random error
$\kappa _i$
’s and the random error $\varrho $
are the precision parameters in the log-normal model for response times, we follow the suggestion of Sun et al. (Reference Sun, Tsutakawa and He2001), using
$\varrho $
are the precision parameters in the log-normal model for response times, we follow the suggestion of Sun et al. (Reference Sun, Tsutakawa and He2001), using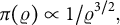 $ \pi (\varrho )\propto 1/\varrho ^{3/2}, $
for
$ \pi (\varrho )\propto 1/\varrho ^{3/2}, $
for $\varrho $
and for all i,
$\varrho $
and for all i,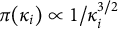 $\pi (\kappa _i)\propto 1/\kappa _i^{3/2}$
for
$\pi (\kappa _i)\propto 1/\kappa _i^{3/2}$
for $\kappa _i$
. In addition, for the prior choice of scale parameters
$\kappa _i$
. In addition, for the prior choice of scale parameters $\delta _i$
’s,
$\delta _i$
’s, $\tau _i$
’s, and
$\tau _i$
’s, and $\phi $
, we follow the discussion of Wang et al. (Reference Wang, Berger and Burdick2013) and use
$\phi $
, we follow the discussion of Wang et al. (Reference Wang, Berger and Burdick2013) and use $ \pi (\phi ) \propto 1/\phi ^{3/2}, \ \pi (\delta _i)\propto 1/\delta _i^{3/2}, \ \text {and} \ \pi (\tau _i)\propto 1/\tau _i^{3/2} \ \text {for all}\ i. $
A natural objective prior for
$ \pi (\phi ) \propto 1/\phi ^{3/2}, \ \pi (\delta _i)\propto 1/\delta _i^{3/2}, \ \text {and} \ \pi (\tau _i)\propto 1/\tau _i^{3/2} \ \text {for all}\ i. $
A natural objective prior for $\mu _i$
, the average response time of each individual, is a constant prior,
$\mu _i$
, the average response time of each individual, is a constant prior, $ \pi (\mu _i)\propto 1, \ \text {for all}\ i. $
Similarly, assume the prior of
$ \pi (\mu _i)\propto 1, \ \text {for all}\ i. $
Similarly, assume the prior of $\beta $
is
$\beta $
is $ \pi (\beta ) \propto 1. $
Intuitively, the regression coefficient
$ \pi (\beta ) \propto 1. $
Intuitively, the regression coefficient $\beta $
in Equation (2.2) with a negative sign makes more sense though, we prefer to let the data determine the value and the sign of
$\beta $
in Equation (2.2) with a negative sign makes more sense though, we prefer to let the data determine the value and the sign of $\beta $
.
$\beta $
.
3.2 Posterior distribution and data augmentation scheme
Equation (2.1) introduces a logit link for modeling the dichotomous item responses $X_{i,t,s,l}$
, and according to Andrews & Mallows (Reference Andrews and Mallows1974), the density of a standard logistic distribution can be represented as a scale mixture of normals (Andrews & Mallows, Reference Andrews and Mallows1974; Wang et al., Reference Wang, Berger and Burdick2013). Then, applying the data augmentation idea, we can introduce a latent variable
$X_{i,t,s,l}$
, and according to Andrews & Mallows (Reference Andrews and Mallows1974), the density of a standard logistic distribution can be represented as a scale mixture of normals (Andrews & Mallows, Reference Andrews and Mallows1974; Wang et al., Reference Wang, Berger and Burdick2013). Then, applying the data augmentation idea, we can introduce a latent variable $Y_{i,t,s,l}$
for each response variable
$Y_{i,t,s,l}$
for each response variable $X_{i,t,s,l}$
. Notice that in the data augmentation,
$X_{i,t,s,l}$
. Notice that in the data augmentation, $Y_{i,t,s,l}$
follows a normal distribution with mean
$Y_{i,t,s,l}$
follows a normal distribution with mean $\theta _{i,t}-a_{i,t,s}+\varphi _{i,t}+\eta _{i,t,s}+\epsilon _{i,t,s,l}$
and variance
$\theta _{i,t}-a_{i,t,s}+\varphi _{i,t}+\eta _{i,t,s}+\epsilon _{i,t,s,l}$
and variance $4\gamma _{i,t,s,l}^2$
, where
$4\gamma _{i,t,s,l}^2$
, where $\gamma _{i,t,s,l}$
is a scale parameter assumed to have a Kolmogorov–Smirnov (K-S) distribution (i.e.,
$\gamma _{i,t,s,l}$
is a scale parameter assumed to have a Kolmogorov–Smirnov (K-S) distribution (i.e., $\pi (\gamma )=8\sum _{\alpha =1}^{\infty }(-1)^{(\alpha +1)}\alpha ^2\gamma \exp (-2\alpha ^2\gamma ^2)$
,
$\pi (\gamma )=8\sum _{\alpha =1}^{\infty }(-1)^{(\alpha +1)}\alpha ^2\gamma \exp (-2\alpha ^2\gamma ^2)$
, $\gamma \geq 0$
. Here, we use the fact that the K-S mixture of normals will be the logistic distribution and we can verify that
$\gamma \geq 0$
. Here, we use the fact that the K-S mixture of normals will be the logistic distribution and we can verify that $ \mathrm { Pr}(X_{i,t,s,l}=1\mid \theta _{i,t}, a_{i,t,s}, \varphi _{i,t},\eta _{i,t,s},\epsilon _{i,t,s,l})=\mathrm {Pr}(Y_{i,t,s,l}>0 \mid \theta _{i,t}, a_{i,t,s}, \varphi _{i,t},\eta _{i,t,s},\epsilon _{i,t,s,l})$
. Though introducing more unknowns
$ \mathrm { Pr}(X_{i,t,s,l}=1\mid \theta _{i,t}, a_{i,t,s}, \varphi _{i,t},\eta _{i,t,s},\epsilon _{i,t,s,l})=\mathrm {Pr}(Y_{i,t,s,l}>0 \mid \theta _{i,t}, a_{i,t,s}, \varphi _{i,t},\eta _{i,t,s},\epsilon _{i,t,s,l})$
. Though introducing more unknowns $Y_{i,t,s,l}$
’s, it facilitates the MCMC computation. Then, we can rewrite the one-parameter DIR-RT models (2.1)–(2.3) as
$Y_{i,t,s,l}$
’s, it facilitates the MCMC computation. Then, we can rewrite the one-parameter DIR-RT models (2.1)–(2.3) as
 $$ \begin{align*} \theta_{i,t}&=\theta_{i,t-1}+c_i(1-\rho\theta_{i,t-1})\Delta_{i,t}^{+}+w_{i,t}, \\ \log (R_{i,t,s})&=\mu_{i}- \nu_{i,t}+\beta L(\theta_{i,t}-a_{i,t,s})+\zeta_{i,t,s},\\ Y_{i,t,s,l}&=\theta_{i,t}-a_{i,t,s}+\varphi_{i,t}+\eta_{i,t,s}+\xi_{i,t,s,l}, \end{align*} $$
where $\xi _{i,t,s,l}\sim \mathcal {N}(0, \psi _{i,t,s,l}^{-1})$
with
$\xi _{i,t,s,l}\sim \mathcal {N}(0, \psi _{i,t,s,l}^{-1})$
with $\psi _{i,t,s,l}^{-1}=4\gamma _{i,t,s,l}^2+\sigma ^2$
and
$\psi _{i,t,s,l}^{-1}=4\gamma _{i,t,s,l}^2+\sigma ^2$
and $\gamma _{i,t,s,l} \sim \text {K-S distribution}$
,
$\gamma _{i,t,s,l} \sim \text {K-S distribution}$
, $w_{i,t}\sim \mathcal {N}(0,\phi ^{-1}\Delta _{i, t})$
,
$w_{i,t}\sim \mathcal {N}(0,\phi ^{-1}\Delta _{i, t})$
, $\varphi _{i,t}\sim \mathcal {N}(0,\delta _i^{-1})$
,
$\varphi _{i,t}\sim \mathcal {N}(0,\delta _i^{-1})$
, ${\eta }_{i,t} \sim \mathcal {N}_{S_{i,t}}(0,\tau _i^{-1}\mathbf {I}_{S_{i,t}} \mid \sum _{s=1}^{S_{i,t}}\eta _{i,t,s}=0)$
,
${\eta }_{i,t} \sim \mathcal {N}_{S_{i,t}}(0,\tau _i^{-1}\mathbf {I}_{S_{i,t}} \mid \sum _{s=1}^{S_{i,t}}\eta _{i,t,s}=0)$
, $\nu _{i,t}\sim \mathcal {N}(0,\kappa _{i}^{-1})$
, and
$\nu _{i,t}\sim \mathcal {N}(0,\kappa _{i}^{-1})$
, and $\zeta _{i,t,s}\sim \mathcal {N}(0, \varrho ^{-1})$
.
$\zeta _{i,t,s}\sim \mathcal {N}(0, \varrho ^{-1})$
.
Further, we define $\theta =(\theta _1,\ldots , \theta _n)'$
with
$\theta =(\theta _1,\ldots , \theta _n)'$
with $\theta _i=(\theta _{i,0},\theta _{i,1},\ldots ,\theta _{i,T_i})'$
,
$\theta _i=(\theta _{i,0},\theta _{i,1},\ldots ,\theta _{i,T_i})'$
, $c=(c_1,\ldots , c_n)'$
,
$c=(c_1,\ldots , c_n)'$
, $\tau =(\tau _1,\ldots ,\tau _n)'$
,
$\tau =(\tau _1,\ldots ,\tau _n)'$
, $\delta =(\delta _1, \ldots , \delta _n)'$
,
$\delta =(\delta _1, \ldots , \delta _n)'$
, $\mu =(\mu _1, \ldots , \mu _n)'$
, and
$\mu =(\mu _1, \ldots , \mu _n)'$
, and $\kappa =(\kappa _1, \ldots , \kappa _n)'$
. For
$\kappa =(\kappa _1, \ldots , \kappa _n)'$
. For $l=1,\ldots ,K_{i,t,s}$
,
$l=1,\ldots ,K_{i,t,s}$
, $s=1,\ldots , S_{i,t}$
,
$s=1,\ldots , S_{i,t}$
, $t=1,\ldots , T_i$
, and
$t=1,\ldots , T_i$
, and $i=1,\ldots , n$
, we have
$i=1,\ldots , n$
, we have $Y=\{Y_{i,t,s,l}\}$
,
$Y=\{Y_{i,t,s,l}\}$
, $\gamma =\{\gamma _{i,t,s,l}\},$
and
$\gamma =\{\gamma _{i,t,s,l}\},$
and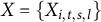 $X=\{X_{i,t,s,l}\}$
;
$X=\{X_{i,t,s,l}\}$
; $\varphi =\{\varphi _{i,t}\}$
and
$\varphi =\{\varphi _{i,t}\}$
and $\nu =\{\nu _{i,t}\}$
;
$\nu =\{\nu _{i,t}\}$
; $\log R= \{\log R_{i,t,s}\}, \eta =\{\eta _{i,t,s}\}$
and particularly, we use
$\log R= \{\log R_{i,t,s}\}, \eta =\{\eta _{i,t,s}\}$
and particularly, we use $\eta _{i,t}^*=(\eta _{i,t,1},\ldots ,\eta _{i,t, S_{i,t}-1})'$
. Then, given the data
$\eta _{i,t}^*=(\eta _{i,t,1},\ldots ,\eta _{i,t, S_{i,t}-1})'$
. Then, given the data $(X, \log R)$
, the joint posterior of
$(X, \log R)$
, the joint posterior of $(\theta , Y, c, \tau , \eta ,\varphi ,\delta , \phi , \beta , \nu , \kappa , \mu , \varrho , \gamma )$
for the proposed DIR-RT models is
$(\theta , Y, c, \tau , \eta ,\varphi ,\delta , \phi , \beta , \nu , \kappa , \mu , \varrho , \gamma )$
for the proposed DIR-RT models is
 $$ \begin{align*} &\pi( \theta, Y, c, \tau, \eta, \varphi, \delta, \phi,\beta, \nu, \kappa, \mu, \varrho, \gamma \mid X, \log R) \\ \propto & \left\{\prod_{i=1}^n\prod_{t=1}^{T_i}\prod_{s=1}^{S_{i,t}}\prod_{l=1}^{K_{i,t,s}} \pi(\gamma_{i,t,s,l})\right\} \left\{\prod_{i=1}^n \pi(\theta_{i,0})\pi(c_i)\pi(\delta_i)\pi(\tau_i)\pi(\kappa_i)\pi(\mu_i)\right\} \pi(\beta)\pi(\phi)\pi(\varrho) \end{align*} $$
 $$ \begin{align} \times &\left\{\prod_{i=1}^n\prod_{t=1}^{T_i}\prod_{s=1}^{S_{i,t}}\prod_{l=1}^{K_{i,t,s}} \left[{\mathcal{I}}(Y_{i,t,s,l}>0){\mathcal{I}}(X_{i,t,s,l} =1){\mathcal{I}}(Y_{i,t,s,l}\leq0){\mathcal{I}}(X_{i,t,s,l}=0)\right]\right. \nonumber \\ \times & \left.\sqrt{\frac{\psi_{i,t,s,l}}{2\pi}}\exp\left(-\frac{\psi_{i,t,s,l}(Y_{i,t,s,l}-\theta_{i,t}+a_{i,t,s}-\varphi_{i,t}-\eta_{i,t,s})^2}{2}\right){\mathcal{I}}\left(\eta_{i,t,S_{i,t}}=-\sum_{s=1}^{S_{i,t}-1}\eta_{i,t,s}\right)\right\} \nonumber \\ \times & \left\{\prod_{i=1}^n \prod_{t=1}^{T_i}\sqrt{\frac{\delta_i}{2\pi}}\exp\left(-\frac{\delta_i\varphi_{i,t}^2}{2}\right)\right\}\left\{\prod_{i=1}^n\prod_{t=1}^{T_i}\left(\frac{\tau_i}{2\pi}\right)^{(S_{i,t}-1)/2}\exp\left(-\frac{\tau_i\eta_{i,t}^{*'}\Sigma_{i,t}^{-1}\eta_{i,t}^*}{2}\right)\right\}\nonumber \\ \times& \left\{\prod_{i=1}^n \prod_{t=1}^{T_i}\sqrt{\frac{\phi}{2\pi\Delta_{i,t}}}\exp\left(-\frac{\phi[\theta_{i,t}-\theta_{i,t-1}-c_i(1-\rho\theta_{i,t-1})\Delta_{i,t}^+]^2 }{2\Delta_{i,t}}\right)\right\}\nonumber \\ \times & \prod_{i=1}^n \prod_{t=1}^{T_i} \prod_{s=1}^{S_{i,t}}\sqrt{\frac{\varrho}{2\pi}}\exp\left(-\frac{\varrho(\log(R_{i,t,s})-\mu_i+\nu_{i,t}-\beta L(\theta_{i,t}-a_{i,t,s}))^2}{2}\right)\nonumber \\ \times & \prod_{i=1}^n \prod_{t=1}^{T_i}\sqrt{\frac{\kappa_i}{2\pi}}\exp\left(-\frac{\kappa_i\nu_{i,t}^2}{2}\right), \end{align} $$
where $\Sigma _{i,t}^{-1}=\mathbf {1}_{S_{i,t}-1}\mathbf {1}_{S_{i,t}-1}'+\mathbf {I}_{S_{i,t}-1}, $
with
$\Sigma _{i,t}^{-1}=\mathbf {1}_{S_{i,t}-1}\mathbf {1}_{S_{i,t}-1}'+\mathbf {I}_{S_{i,t}-1}, $
with $\mathbf {1}_{S_{i,t}-1}$
being a
$\mathbf {1}_{S_{i,t}-1}$
being a $(S_{i,t}-1)$
-dimensional unit vector. Note that
$(S_{i,t}-1)$
-dimensional unit vector. Note that $\pi (\theta _{i,0})$
,
$\pi (\theta _{i,0})$
, $\pi (c_i)$
,
$\pi (c_i)$
, $\pi (\delta _i)$
,
$\pi (\delta _i)$
, $\pi (\tau _i)$
,
$\pi (\tau _i)$
, $\pi (\kappa _i)$
,
$\pi (\kappa _i)$
, $\pi (\mu _i)$
,
$\pi (\mu _i)$
, $\pi (\beta )$
,
$\pi (\beta )$
, $\pi (\phi )$
, and
$\pi (\phi )$
, and $\pi (\varrho )$
are the priors specified in Section 3.1 and
$\pi (\varrho )$
are the priors specified in Section 3.1 and $\pi (\gamma _{i,t,s,l})$
is the K-S density. To verify the posterior propriety of DIR-RT models under the objective priors, we can follow the similar steps as Wang et al. (Reference Wang, Berger and Burdick2013) did in the DIR models. The major difference in the proof is that DIR-RT models contain an additional part, which is to conjointly model with response times. Since the logarithm of response times is modeled as a normal linear mixed regression model, then the well-established facts for the posterior propriety of normal linear mixed models in Bayesian literature (cf. Sun et al., Reference Sun, Tsutakawa and He2001) can be coupled with results from Appendix C in Wang et al. (Reference Wang, Berger and Burdick2013) to show the posterior propriety of DIR-RT models.
$\pi (\gamma _{i,t,s,l})$
is the K-S density. To verify the posterior propriety of DIR-RT models under the objective priors, we can follow the similar steps as Wang et al. (Reference Wang, Berger and Burdick2013) did in the DIR models. The major difference in the proof is that DIR-RT models contain an additional part, which is to conjointly model with response times. Since the logarithm of response times is modeled as a normal linear mixed regression model, then the well-established facts for the posterior propriety of normal linear mixed models in Bayesian literature (cf. Sun et al., Reference Sun, Tsutakawa and He2001) can be coupled with results from Appendix C in Wang et al. (Reference Wang, Berger and Burdick2013) to show the posterior propriety of DIR-RT models.
3.3 MCMC computation of DIR-RT models
The computation is carried out by the MCMC scheme, where we sample the posterior (3.1) via block Gibbs sampling schemes. The difficulty of the sampling scheme arises in sampling the posterior distribution of latent ability $\theta _i=(\theta _{i,0}, \ldots , \theta _{i,T_i})'$
for each individual i, for
$\theta _i=(\theta _{i,0}, \ldots , \theta _{i,T_i})'$
for each individual i, for $i=1, \ldots , n$
, where coordinates of
$i=1, \ldots , n$
, where coordinates of $\theta _i$
are typically high dimensional and strongly correlated. When
$\theta _i$
are typically high dimensional and strongly correlated. When $L(x)=x$
, using the data augmentation idea, the proposed model is transformed so that
$L(x)=x$
, using the data augmentation idea, the proposed model is transformed so that $\theta _i$
(the vector) could be block sampled (see Step 2 of Appendix A.1)—within a single Gibbs sampling step conditional on the other parameters (excluding
$\theta _i$
(the vector) could be block sampled (see Step 2 of Appendix A.1)—within a single Gibbs sampling step conditional on the other parameters (excluding $\theta _{i,t}$
’s)—by the highly efficient forward filtering and backward sampling algorithm (West & Harrison, Reference West and Harrison1997). However, if
$\theta _{i,t}$
’s)—by the highly efficient forward filtering and backward sampling algorithm (West & Harrison, Reference West and Harrison1997). However, if $L(x)=|x|$
, the computation becomes more challenging as
$L(x)=|x|$
, the computation becomes more challenging as $\theta _i$
cannot be drawn as a block. Instead, we utilize the fact that the full conditional distribution of each component of
$\theta _i$
cannot be drawn as a block. Instead, we utilize the fact that the full conditional distribution of each component of $\theta _i$
, i.e.,
$\theta _i$
, i.e., $\theta _{i, t}$
, follows a mixture of truncated Gaussians, then
$\theta _{i, t}$
, follows a mixture of truncated Gaussians, then $\theta _{i,t}$
’s are drawn one at a time (cf. Step 2 of Appendix A.1).
$\theta _{i,t}$
’s are drawn one at a time (cf. Step 2 of Appendix A.1).
The details of MCMC steps are given in Appendix A.1. The Gibbs sampling starts at Step 1 in Appendix A.1, with initial values $\theta ^{(0)}=\vec {0}$
,
$\theta ^{(0)}=\vec {0}$
, $c^{(0)}=\vec {0}$
,
$c^{(0)}=\vec {0}$
, $\phi ^{(0)}=1$
,
$\phi ^{(0)}=1$
, $\varphi ^{(0)}=\vec {0}$
,
$\varphi ^{(0)}=\vec {0}$
, $\eta ^{(0)}=\vec {0}$
,
$\eta ^{(0)}=\vec {0}$
, $\delta ^{(0)}=\vec {1}$
,
$\delta ^{(0)}=\vec {1}$
, $\tau ^{(0)}=\vec {1}$
,
$\tau ^{(0)}=\vec {1}$
, $\gamma ^{(0)}=\vec {1}$
,
$\gamma ^{(0)}=\vec {1}$
, $\mu ^{(0)}=\vec {1}$
,
$\mu ^{(0)}=\vec {1}$
, $\nu ^{(0)}=\vec {0}$
, and
$\nu ^{(0)}=\vec {0}$
, and $\beta ^{(0)}=0$
in the applications and simulations, then loops through Step 15 in Appendix A.1, until the MCMC has converged. The convergence is evaluated informally by looking at trace plots.
$\beta ^{(0)}=0$
in the applications and simulations, then loops through Step 15 in Appendix A.1, until the MCMC has converged. The convergence is evaluated informally by looking at trace plots.
The statistical inferences are made straightforward from the MCMC samples. For example, an estimate and $95\%$
credible interval (CI) for the latent trajectory of one’s ability
$95\%$
credible interval (CI) for the latent trajectory of one’s ability $\theta _{i,t}$
can be plotted from the median,
$\theta _{i,t}$
can be plotted from the median, $2.5\%$
, and
$2.5\%$
, and $97.5\%$
empirical quantiles of the corresponding MCMC realizations. In examples, ability will be graphed as a function of t, so that the dynamic changes of an examinee are apparent.
$97.5\%$
empirical quantiles of the corresponding MCMC realizations. In examples, ability will be graphed as a function of t, so that the dynamic changes of an examinee are apparent.
4 Simulation study
To validate the inference procedure and compare the benefits of jointly modeling response times with item responses, we conduct some simulations. Due to space limitations and motivated by the analysis of empirical data in Section 5, we only illustrate the results when $L(x)$
follows an inverted U-shape linkage in the joint model. Similar conclusions are yielded when we proceed with monotone linkage, thus we omit the details here.
$L(x)$
follows an inverted U-shape linkage in the joint model. Similar conclusions are yielded when we proceed with monotone linkage, thus we omit the details here.
4.1 DIR-RT models simulation
Following the simulation study of DIR models in Wang et al. (Reference Wang, Berger and Burdick2013), we consider multiple individuals taking a series of tests scheduled at individually-varying and irregularly-spaced time points. Assume there are 10 individuals, each of them taking four tests on 50 different test dates, where each test contains 10 items. This specification means $K_{i,t,s}=10$
, for
$K_{i,t,s}=10$
, for $s=1, \ldots , S_{i,t}$
,
$s=1, \ldots , S_{i,t}$
, $t= 1,\ldots , T_i$
,
$t= 1,\ldots , T_i$
, $i=1, \ldots , n$
with
$i=1, \ldots , n$
with $S_{i,t}=4$
,
$S_{i,t}=4$
, $T_i =50,$
and
$T_i =50,$
and $n=10$
. The time lapse between two consecutive test dates
$n=10$
. The time lapse between two consecutive test dates $\Delta _{i,t} = t+10 $
if
$\Delta _{i,t} = t+10 $
if $t \le T_i / 2 $
and
$t \le T_i / 2 $
and $ \Delta _{i,t} = t-10 $
otherwise, creating an irregularly spaced gap between two test dates.
$ \Delta _{i,t} = t-10 $
otherwise, creating an irregularly spaced gap between two test dates.
To compare the results of DIR-RT models with DIR models, we assign same values of the parameters, $\phi $
,
$\phi $
, $\delta _i$
,
$\delta _i$
, $\tau _i, c_i$
as used in Wang et al. (Reference Wang, Berger and Burdick2013), where
$\tau _i, c_i$
as used in Wang et al. (Reference Wang, Berger and Burdick2013), where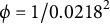 $\phi =1/0.0218^2$
, leading to standard deviation of
$\phi =1/0.0218^2$
, leading to standard deviation of $w_{i,t}$
in Equation (2.3) being
$w_{i,t}$
in Equation (2.3) being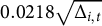 $0.0218\sqrt {\Delta _{i,t}}$
and the values of
$0.0218\sqrt {\Delta _{i,t}}$
and the values of $\delta _i$
,
$\delta _i$
, $\tau _i$
, and
$\tau _i$
, and $c_i$
are specified in Table 1. For the modeling part of response times, the parameter values of
$c_i$
are specified in Table 1. For the modeling part of response times, the parameter values of $\kappa _i$
and
$\kappa _i$
and $\mu _i$
are listed in Table 1,
$\mu _i$
are listed in Table 1, $\beta =-0.17$
and
$\beta =-0.17$
and $\varrho =1.25$
. The parameters of DIR-RT models are chosen in such a way that they mimic the magnitude of EdSphere datasets.
$\varrho =1.25$
. The parameters of DIR-RT models are chosen in such a way that they mimic the magnitude of EdSphere datasets.
Values of unknowns used in the simulation

We consider the inverted U-shape linkage, i.e., $L(x)=|x|$
. Then, we simulate random effects and latent variables in DIR-RT models using the assigned parameter values above. Once we generated the values of
$L(x)=|x|$
. Then, we simulate random effects and latent variables in DIR-RT models using the assigned parameter values above. Once we generated the values of $\theta _{i,t}$
using Equation (2.3), we set the test difficulties,
$\theta _{i,t}$
using Equation (2.3), we set the test difficulties, $a_{i,t,s}$
’s in Equation (2.1) to be
$a_{i,t,s}$
’s in Equation (2.1) to be $\theta _{i,t}+\zeta ^*$
, where
$\theta _{i,t}+\zeta ^*$
, where $\zeta ^*$
is a random variable with uniform distribution on
$\zeta ^*$
is a random variable with uniform distribution on $(-0.1 , 0.1)$
. Next, the values of
$(-0.1 , 0.1)$
. Next, the values of $\epsilon _{i,t,s,l}$
are drawn from
$\epsilon _{i,t,s,l}$
are drawn from $\mathcal {N}(0,\sigma ^2)$
with
$\mathcal {N}(0,\sigma ^2)$
with $\sigma =0.7333$
and we choose
$\sigma =0.7333$
and we choose $\rho =0.1180$
. Notice that the values of
$\rho =0.1180$
. Notice that the values of $\sigma $
and
$\sigma $
and $\rho $
are the same values as used in the EdSphere platform. Finally, the dichotomous data of item responses and continuous data of response times generated from the joint model are our observations, and we use the Bayesian machinery from Section 3 to estimate the model parameters of DIR-RT models. To analyze the simulation data, we utilize the priors for unknowns as specified in Section 3.1 except for
$\rho $
are the same values as used in the EdSphere platform. Finally, the dichotomous data of item responses and continuous data of response times generated from the joint model are our observations, and we use the Bayesian machinery from Section 3 to estimate the model parameters of DIR-RT models. To analyze the simulation data, we utilize the priors for unknowns as specified in Section 3.1 except for $\beta $
, where we use
$\beta $
, where we use $\pi (\beta )\propto \mathbf {1}(\beta <0)$
to make the MCMC computation converge faster.
$\pi (\beta )\propto \mathbf {1}(\beta <0)$
to make the MCMC computation converge faster.
The unknown parameters are estimated through the posterior median calculated from their corresponding MCMC samples. Each MCMC was run for 50,000 iterations with a 25,000 burn-in period. In nested or hierarchical models involving many precision parameters ( $\delta _i$
’s,
$\delta _i$
’s, $\tau _i$
’s,
$\tau _i$
’s, $\psi _{i,t,s,l}$
’s,
$\psi _{i,t,s,l}$
’s, $\phi ,$
and others), a large number of burn-in iterations is often required to stabilize MCMC mixing. To run the MCMC with 50,000 iterations, it takes about 15 hours and 22 minutes by using a 3.40-GHz processor with 16-GB RAM. The MCMC convergence is assessed through a graphical examination of trace plots and through Geweke’s Diagnostics test statistics (Geweke, Reference Geweke1991). The absolute values of all parameters’ Geweke’s test statistics (in both simulation and application) are below 2, suggesting our MCMC chain has been converged. Please refer to Sections 1and 3 of the Supplementary Material for more details and additional information of auto-correlation of MCMC samples and the effective samples size are also provided there. Figures 1a–d give posterior median estimates (red squares) along with 95% CIs (red bars) of
$\phi ,$
and others), a large number of burn-in iterations is often required to stabilize MCMC mixing. To run the MCMC with 50,000 iterations, it takes about 15 hours and 22 minutes by using a 3.40-GHz processor with 16-GB RAM. The MCMC convergence is assessed through a graphical examination of trace plots and through Geweke’s Diagnostics test statistics (Geweke, Reference Geweke1991). The absolute values of all parameters’ Geweke’s test statistics (in both simulation and application) are below 2, suggesting our MCMC chain has been converged. Please refer to Sections 1and 3 of the Supplementary Material for more details and additional information of auto-correlation of MCMC samples and the effective samples size are also provided there. Figures 1a–d give posterior median estimates (red squares) along with 95% CIs (red bars) of $c_i$
’s,
$c_i$
’s, $\tau _i^{-1/2}$
’s,
$\tau _i^{-1/2}$
’s, $\delta _i^{-1/2}$
’s,
$\delta _i^{-1/2}$
’s, $\kappa _i^{-1/2}$
’s, and
$\kappa _i^{-1/2}$
’s, and $\mu _i$
’s, respectively, and illustrate their true values (black dot). Clearly seen from Figure 1, the true values of parameters are contained within their corresponding
$\mu _i$
’s, respectively, and illustrate their true values (black dot). Clearly seen from Figure 1, the true values of parameters are contained within their corresponding $95\%$
CIs. For the posterior median estimates of parameters
$95\%$
CIs. For the posterior median estimates of parameters $\phi ^{-1/2}$
,
$\phi ^{-1/2}$
, $\varrho ^{-1/2}$
, and
$\varrho ^{-1/2}$
, and $\beta $
are
$\beta $
are $0.0190$
,
$0.0190$
, $0.9075$
, and
$0.9075$
, and $-0.1815$
, respectively, with their corresponding 95% CIs being
$-0.1815$
, respectively, with their corresponding 95% CIs being $[0.0159, 0.0229]$
,
$[0.0159, 0.0229]$
, $[0.8753, 0.9427]$
, and
$[0.8753, 0.9427]$
, and $[-0.7028, -0.0071]$
, all of which contain their truth.
$[-0.7028, -0.0071]$
, all of which contain their truth.
Posterior summary of $c_i$
’s,
$c_i$
’s, $\tau _i^{-1/2}$
,
$\tau _i^{-1/2}$
, $\delta _i^{-1/2}$
’s,
$\delta _i^{-1/2}$
’s, $\kappa _i^{-1/2}$
’s, and
$\kappa _i^{-1/2}$
’s, and $\mu _i$
’s.
$\mu _i$
’s.
Note: The black dots represent truth, red squares are posterior median estimates, and red bars indicate $95\%$
CIs.
$95\%$
CIs.

Next, we discuss our primary interest of estimating latent ability trajectories. Figures 2a–d illustrate four types of growth curves in our simulation, where (a) represents an individual with steady growth; (b) indicates an individual with increasing growth but nearly flat region at the end; (c) shows an individual with interrupted growth (with true ability drops in certain period); and (d) displays monotonic growth with decreasing growth rate in the middle. In Figure 2, the true ability curves (black dots) have been plotted along with our posterior median estimates of ability (blue circles) and their corresponding $95\%$
credible band (CB) (starred lines). Notice that in each subfigure, a very small proportion of true values (less than
$95\%$
credible band (CB) (starred lines). Notice that in each subfigure, a very small proportion of true values (less than $5\%$
) are outside of
$5\%$
) are outside of $95\%$
CBs.
$95\%$
CBs.
The latent trajectory of one’s ability growth, where black dots, blue circles, and starred lines represent true ability, the posterior median estimates, and the 95% CBs, respectively.

To better assess how well the Bayesian model actually captures the truth, we can calculate the frequency of true values falling in the corresponding CIs of MCMC runs over different random trials, i.e., the frequentist coverage probability (CP) (Wang et al., Reference Wang, Berger and Burdick2013). Thus, to evaluate CPs, we conduct the simulation with the same set-up values of parameters specified earlier but generate datasets with 100 different random seeds. The CPs for $\varrho $
,
$\varrho $
, $\beta $
, and
$\beta $
, and $\phi $
are
$\phi $
are $96\%$
,
$96\%$
, $97\%,$
and
$97\%,$
and $87\%$
, respectively, and the average CPs over all individuals for
$87\%$
, respectively, and the average CPs over all individuals for $\kappa _i$
’s,
$\kappa _i$
’s, $c_i$
’s,
$c_i$
’s, $\tau _i$
’s,
$\tau _i$
’s, $\delta _i$
’s, and
$\delta _i$
’s, and $\mu _i$
’s are 95.4%, 92.1%, 95.4%, 93.8%, and 95%, respectively (refer to the CPs of these individual parameters in additional Table S.6 in the Supplementary Material). In addition, the average CPs for one’s ability over the study period, i.e., for
$\mu _i$
’s are 95.4%, 92.1%, 95.4%, 93.8%, and 95%, respectively (refer to the CPs of these individual parameters in additional Table S.6 in the Supplementary Material). In addition, the average CPs for one’s ability over the study period, i.e., for $\theta _1, \ldots , \theta _{10}$
, are 94.88%, 94.90%, 95.08%, 95.62%, 95.40%, 95.54%, 95.50%, 96.22%, 95.78%, and 95.22%, respectively. Thus, while the inferential method is Bayesian, it seems to yield sets that have good frequentist coverage.
$\theta _1, \ldots , \theta _{10}$
, are 94.88%, 94.90%, 95.08%, 95.62%, 95.40%, 95.54%, 95.50%, 96.22%, 95.78%, and 95.22%, respectively. Thus, while the inferential method is Bayesian, it seems to yield sets that have good frequentist coverage.
4.2 Benefits of joint modeling response times with item responses
To the best of our knowledge, the two-level DIR-RT model is the first attempt to jointly model response times and accuracy in the analysis of longitudinal data for latent traits. We are, thus, interested in knowing the benefits of introducing response times as an extra source of information. An interesting investigation is to compare the estimates of one’s ability trajectory relative to the truth with and without using response times.
Figure 3 displays the growth curve of two selected individuals, where the statistical inference is based on the simulated example in Section 4.1. For other individuals, results are similar and thus, their plots are omitted due to space limitations. In Figures 3a,b, $95\%$
CIs of DIR models (dashed red lines) encompass 95% CIs of DIR-RT models (starred blue lines), both
$95\%$
CIs of DIR models (dashed red lines) encompass 95% CIs of DIR-RT models (starred blue lines), both $95\%$
CIs contain the true values (black dots). The average length of the 95% CB of ability estimates for DIR-RT models is much shorter than that of DIR models (
$95\%$
CIs contain the true values (black dots). The average length of the 95% CB of ability estimates for DIR-RT models is much shorter than that of DIR models ( $0.6454$
versus
$0.6454$
versus $1.0370$
for the 2nd individual; and
$1.0370$
for the 2nd individual; and $0.6772$
versus
$0.6772$
versus $1.1401$
for the 6th individual, respectively). In addition, in Figure 3, both graphs of DIR-RT for ability estimates (blue circles) adhere more closely to true ability (black dots) in relative to DIR ability estimates (red dots). The average mean-squared distance between the truth and the posterior median ability estimates over time for DIR-RT models are
$1.1401$
for the 6th individual, respectively). In addition, in Figure 3, both graphs of DIR-RT for ability estimates (blue circles) adhere more closely to true ability (black dots) in relative to DIR ability estimates (red dots). The average mean-squared distance between the truth and the posterior median ability estimates over time for DIR-RT models are $0.0240$
for
$0.0240$
for $\theta _2$
and
$\theta _2$
and $0.0187$
for
$0.0187$
for $\theta _6$
, in comparison to that of DIR models are
$\theta _6$
, in comparison to that of DIR models are $0.0711$
for
$0.0711$
for $\theta _2$
, and
$\theta _2$
, and $0.0653$
for
$0.0653$
for $\theta _6$
, both of which are at least three times larger than DIR-RT models. To conclude, the results of DIR-RT models illustrate that we can largely improve the precision and remarkably reduce the bias of the estimates of one’s ability by incorporating response times.
$\theta _6$
, both of which are at least three times larger than DIR-RT models. To conclude, the results of DIR-RT models illustrate that we can largely improve the precision and remarkably reduce the bias of the estimates of one’s ability by incorporating response times.
The comparison of ability estimates between DIR-RT and DIR models, where black dots, blue circles, and red dots represent true ability, DIR-RT ability estimates, and DIR ability estimates, respectively; starred lines (blue) and dashed lines (red) represent 95% CBs for DIR-RT and DIR models, respectively.

5 EdSphere testbed application
For illustration purposes, we randomly select a sample of $25$
individuals from the EdSphere testbed, where different characteristics for each student are shown in Table 2.Due to space limitations, we only show the details of the first three selected individuals. The primary focus of this application is to study the following goals: 1) to assess the appropriateness of the local independence assumption for this type of data; 2) to understand the growth in ability of students by retrospectively producing the estimated growth trajectory for each student; and 3) to investigate which linkage between response times and the distance of ability–difficulty is more suitable to model the behaviors and psychology for students in the exam via empirical justifications.
$25$
individuals from the EdSphere testbed, where different characteristics for each student are shown in Table 2.Due to space limitations, we only show the details of the first three selected individuals. The primary focus of this application is to study the following goals: 1) to assess the appropriateness of the local independence assumption for this type of data; 2) to understand the growth in ability of students by retrospectively producing the estimated growth trajectory for each student; and 3) to investigate which linkage between response times and the distance of ability–difficulty is more suitable to model the behaviors and psychology for students in the exam via empirical justifications.
Characteristics of the first three students randomly sampled from the EdSphere data

5.1 DIR-RT models with inverted U-shape vs. monotone linkage
To the best of our knowledge, there has not been any empirical work to check the goodness of fit of the two linkages (i.e., monotone or inverted U-shape) for which one indeed fits the data better in conjointly modeling response times and item responses, especially when the testing data are collected at irregular and individual varying time points for a series of computerized (adaptive) testing. The lack of this research motivates us to propose some statistical measures that can be used to conduct an empirical study of EdSphere datasets to identify a better linkage and in this study, we still use the prior assigned for unknowns in Section 3.1.
Figure 4 illustrates the ability trajectories using monotone (left) and inverted U-shape (right) linkages side by side, where red dots present the posterior median trajectory of ability estimation, red dashed lines correspond to their CBs and black plus points are the “raw score,” which is a rough estimate of one’s ability obtained by solving the equation that the expectation of expected score for a person’s ability is equivalent to the observed score (Stenner, Reference Stenner2022; Swartz et al., Reference Swartz, Hanlon, Childress and Stenner2016). As a side for reference, we also include the EdSphere estimates (blue dots), the estimates employed in the design of the EdSphere learning platform, in Figure 4, which can be viewed as a preliminary version of DIR models without considering local dependence. However, EdSphere estimates use the data only available to that date. Thus, EdSphere estimates (blue dots) are much varying than ours in Figure 4.
The posterior summary of ability growth for the 10th individual in two linkages, where red circles, black plus, and blue dots are posterior median estimates of the ability, raw score, and EdSphere estimates, respectively, and red dashed lines are 95% CBs of our estimates.

In comparison of (a) and (b) in Figure 4, the estimates of ability growth are comparatively more robust (in an underlying increasing trend) for the inverted U-shape than that for a monotone linkage. This phenomenon is shown, for example, in the estimation of ability trajectory in Figure 4, during the period of 350–500 days and 700–800 days, where the ability trajectory estimated by an inverted U-shape linkage in the joint model is more reluctant to change its increasing trend unless there is strong information from the data (noting raw scores (black plus) in Figure 4 can be regarded as the raw data since they have the same scale as $\theta _{i,t}$
). In the following, we have proposed two statistical methods to rigorously compare the two linkages in fitting the joint model.
$\theta _{i,t}$
). In the following, we have proposed two statistical methods to rigorously compare the two linkages in fitting the joint model.
5.1.1 Comparison of two linkages using Lindley’s method
The regression slope $\beta $
plays a key role in controlling the influence of the ability–difficulty distance function
$\beta $
plays a key role in controlling the influence of the ability–difficulty distance function $L(\cdot )$
to the response time. When
$L(\cdot )$
to the response time. When $\beta =0$
, it implies the distance between ability and difficulty does not affect the time an individual spends on a test and the corresponding linkage function
$\beta =0$
, it implies the distance between ability and difficulty does not affect the time an individual spends on a test and the corresponding linkage function $L(\cdot )$
can be ignored. Thus, we are interested in testing
$L(\cdot )$
can be ignored. Thus, we are interested in testing $H_0: \beta =0$
versus
$H_0: \beta =0$
versus $H_1:\beta \neq 0$
. Lindley’s method (see Lindley Reference Lindley1965, Section 5.6), advocated by authors including Zellner (Reference Zellner1971), is an ad hoc way to test this hypothesis. According to Lindley’s method, we reject the hypothesis of
$H_1:\beta \neq 0$
. Lindley’s method (see Lindley Reference Lindley1965, Section 5.6), advocated by authors including Zellner (Reference Zellner1971), is an ad hoc way to test this hypothesis. According to Lindley’s method, we reject the hypothesis of $\beta =0$
at the
$\beta =0$
at the $\alpha $
level of significance if the
$\alpha $
level of significance if the $100(1-\alpha )\%$
highest posterior density interval does not include
$100(1-\alpha )\%$
highest posterior density interval does not include $0$
. The posterior density of
$0$
. The posterior density of $\beta $
is in bell shapes (clearly seen from histograms in Figure 5). Thus,
$\beta $
is in bell shapes (clearly seen from histograms in Figure 5). Thus, $100(1-\alpha )\%$
highest posterior density interval of
$100(1-\alpha )\%$
highest posterior density interval of $\beta $
is the same as its
$\beta $
is the same as its $100(1-\alpha )\%$
CI, but the latter one is much easier to obtain from the MCMC samples. From the table in Figure 5, it suggests
$100(1-\alpha )\%$
CI, but the latter one is much easier to obtain from the MCMC samples. From the table in Figure 5, it suggests $\beta =0$
cannot be rejected at
$\beta =0$
cannot be rejected at $\alpha =1\%$
for monotone linkage since
$\alpha =1\%$
for monotone linkage since $99\%$
CI of
$99\%$
CI of $\beta $
under monotone linkage includes
$\beta $
under monotone linkage includes $0$
, while
$0$
, while $\beta =0$
is rejected at both
$\beta =0$
is rejected at both $\alpha =1\%$
and
$\alpha =1\%$
and $\alpha =5\%$
for inverted U-shape. This indicates that the monotone linkage has a weaker correlation with response times than the inverted U-shape linkage for EdSphere datasets.
$\alpha =5\%$
for inverted U-shape. This indicates that the monotone linkage has a weaker correlation with response times than the inverted U-shape linkage for EdSphere datasets.
Posterior histogram (left) and posterior summary (right) for $\beta $
under monotone linkage and inverted U-shape, where “PM” in the table is short for “posterior median.”
$\beta $
under monotone linkage and inverted U-shape, where “PM” in the table is short for “posterior median.”

5.1.2 Comparison of two linkages using deviance information criterion (DIC)
The hypothesis of $\beta =0$
can also be viewed as a Bayesian model selection question and then, we can employ DIC, one of the most popular model selection criteria in the Bayesian literature, for the comparison. Let
$\beta =0$
can also be viewed as a Bayesian model selection question and then, we can employ DIC, one of the most popular model selection criteria in the Bayesian literature, for the comparison. Let $\boldsymbol {y}$
denote the data and
$\boldsymbol {y}$
denote the data and $\boldsymbol {\Theta }$
indicate parameters in the model. Define
$\boldsymbol {\Theta }$
indicate parameters in the model. Define ${\pi (\boldsymbol {\Theta }\mid {\boldsymbol {y}})}$
as the posterior distribution of
${\pi (\boldsymbol {\Theta }\mid {\boldsymbol {y}})}$
as the posterior distribution of $\boldsymbol {\Theta }$
and
$\boldsymbol {\Theta }$
and $\overline {\boldsymbol {\Theta }} = \mathrm {E}_{\pi (\boldsymbol {\Theta }\mid \mathbf {y})} [\boldsymbol {\Theta } \mid \boldsymbol {y}]$
represents the posterior mean of
$\overline {\boldsymbol {\Theta }} = \mathrm {E}_{\pi (\boldsymbol {\Theta }\mid \mathbf {y})} [\boldsymbol {\Theta } \mid \boldsymbol {y}]$
represents the posterior mean of $\boldsymbol {\Theta }$
. Then,
$\boldsymbol {\Theta }$
. Then, $\mathrm {Dev}(\Theta )=-2\log f({\boldsymbol {y}} \mid \boldsymbol {\Theta })$
is the deviance function for the likelihood
$\mathrm {Dev}(\Theta )=-2\log f({\boldsymbol {y}} \mid \boldsymbol {\Theta })$
is the deviance function for the likelihood $f({\boldsymbol {y}} \mid \boldsymbol {\Theta })$
. Following Spiegelhalter et al. (Reference Spiegelhalter, Best, Carlin and Van Der Linde2002), we have
$f({\boldsymbol {y}} \mid \boldsymbol {\Theta })$
. Following Spiegelhalter et al. (Reference Spiegelhalter, Best, Carlin and Van Der Linde2002), we have
 $$ \begin{align} & \mathrm{DIC}=\mathrm{Dev}(\overline{\boldsymbol{\Theta}})+2p_{D}, \end{align} $$
where $p_D=\mathrm {E}_{\pi (\boldsymbol {\Theta }\mid {\boldsymbol {y}})}[\mathrm {Dev}(\boldsymbol {\Theta }) \mid {\boldsymbol {y}}]-\mathrm {Dev} [\bar {\boldsymbol {\Theta }}]$
represents the effective number of model parameters. DIC is a measure to trade off between model adequacy (
$p_D=\mathrm {E}_{\pi (\boldsymbol {\Theta }\mid {\boldsymbol {y}})}[\mathrm {Dev}(\boldsymbol {\Theta }) \mid {\boldsymbol {y}}]-\mathrm {Dev} [\bar {\boldsymbol {\Theta }}]$
represents the effective number of model parameters. DIC is a measure to trade off between model adequacy ( $\mathrm {Dev}(\bar {\boldsymbol {\Theta }})$
part) and model complexity (
$\mathrm {Dev}(\bar {\boldsymbol {\Theta }})$
part) and model complexity ( $p_D$
part), and thus the DIC can be used to compare the linkage choices in DIR-RT models. The smaller the DIC value is, the better the model does fit the data.
$p_D$
part), and thus the DIC can be used to compare the linkage choices in DIR-RT models. The smaller the DIC value is, the better the model does fit the data.
There are many variants of DIC, such as conditional DIC and integrated DIC. Nevertheless, recent studies have cautioned against the use of the conditional DIC, whose computation is based on the likelihood conditioning on the latent variables and is sensitive to transformations of latent variables and distributions (Millar, Reference Millar2009). Zhang et al. (Reference Zhang, Tao, Wang and Shi2019) also found that the conditional DIC often selects a model that is more complex than the true model. Instead, the integrated DIC by marginalizing out latent variables in the likelihood often performs better. Without doubt, the more the latent variables can be integrated out, the more efficiency of DIC can be achieved. Several papers showed the integrated DIC often had much smaller Monte Carlo errors compared to the conditional DICs (Celeux et al., Reference Celeux, Forbes, Robert and Titterington2006; Chan & Grant, Reference Chan and Grant2016; Merkle et al., Reference Merkle, Furr and Rabe-Hesketh2019). But usually, the analytical expressions for the integrated likelihood are hard to obtain and rather often, one resorts back to numerical integration, which is typically time-consuming.
In the proposed DIR-RT models, when $L(\cdot )$
is a monotone linkage, DIR-RT models can be written as a framework of dynamic linear models (see Step 2 of Appendix A.2) by introducing K-S random variables (
$L(\cdot )$
is a monotone linkage, DIR-RT models can be written as a framework of dynamic linear models (see Step 2 of Appendix A.2) by introducing K-S random variables ( $\gamma _{i,t,s,l}$
’s) in the data augmentation step. Then, following an analogy of Chan & Grant (Reference Chan and Grant2016) for derivations of dynamic linear models, we can show that the integrated likelihood of DIR-RT models under monotone linkage can be approximated by taking one-dimensional Monte Carlo integration over
$\gamma _{i,t,s,l}$
’s) in the data augmentation step. Then, following an analogy of Chan & Grant (Reference Chan and Grant2016) for derivations of dynamic linear models, we can show that the integrated likelihood of DIR-RT models under monotone linkage can be approximated by taking one-dimensional Monte Carlo integration over $\gamma _{i,t,s,l}$
’s drawn from the K-S prior distribution. However, when
$\gamma _{i,t,s,l}$
’s drawn from the K-S prior distribution. However, when $L(\cdot )$
is an inverted U-shape linkage, the simplification of the integrated likelihood of DIR-RT models becomes much harder since given
$L(\cdot )$
is an inverted U-shape linkage, the simplification of the integrated likelihood of DIR-RT models becomes much harder since given $\gamma _{i,t,s,l}$
’s, the DIR-RT models cannot be written as dynamic linear models. Thus, to evaluate the integrated likelihood under an inverted U-shape becomes much more computationally intensive.
$\gamma _{i,t,s,l}$
’s, the DIR-RT models cannot be written as dynamic linear models. Thus, to evaluate the integrated likelihood under an inverted U-shape becomes much more computationally intensive.
However, conditioning on ability $\theta _{i,t}$
’s, the modeling of response times part and item response part in DIR-RT models are independent. Thus, no matter what the linkage is chosen, Equations (2.1) and (2.3) of the DIR-RT models are the same under different linkages. Then, motivated by the partial DIC idea of Yao et al. (Reference Yao, Kim, Chen, Ibrahim, Shah and Lin2015) in meta-analysis, an alternative to integrated DIC for our joint DIR-RT models is to consider the integrated DIC based on the part of response times only. Based on this partial DIC derived (see details in Appendix B), the inverted U-shape linkage turns out to fit the EdSphere data better, where the partial DIC for the inverted U-shape is 5661.4 in comparison to that of the monotone linkage, which is 5775.3.
$\theta _{i,t}$
’s, the modeling of response times part and item response part in DIR-RT models are independent. Thus, no matter what the linkage is chosen, Equations (2.1) and (2.3) of the DIR-RT models are the same under different linkages. Then, motivated by the partial DIC idea of Yao et al. (Reference Yao, Kim, Chen, Ibrahim, Shah and Lin2015) in meta-analysis, an alternative to integrated DIC for our joint DIR-RT models is to consider the integrated DIC based on the part of response times only. Based on this partial DIC derived (see details in Appendix B), the inverted U-shape linkage turns out to fit the EdSphere data better, where the partial DIC for the inverted U-shape is 5661.4 in comparison to that of the monotone linkage, which is 5775.3.
5.2 Retrospective estimation of ability growth under inverted U-shaped linkage
Both Lindley’s method and partial DIC criterion support the choice of an inverted U-shape linkage for the analysis of EdSphere data using DIR-RT models. Therefore, to investigate the first two goals mentioned in the beginning of Section 5, we are going to use an inverted U-shape throughout the rest of the article. After we run MCMC for the EdSphere datasets using the inverted U-shape, we have conducted a posterior predictive check (Gelman et al., Reference Gelman, Meng and Stern1996) using a mean test statistic for the response time and its p-value is $0.4978$
, which shows the inverted U-shape indeed fit the response time well.
$0.4978$
, which shows the inverted U-shape indeed fit the response time well.
Figure 6 presents a retrospective analysis of the reading ability for 3rd, 12th, 18th, and 23rd individuals (using all data recorded for each individual during the study period). In Figure 6, the red circles are the posterior median estimates of one’s ability, the red dashed lines correspond to the 2.5% and 97.5% quantiles of the posterior distributions of the abilities, and the black plus points are raw scores. Similar to Wang et al. (Reference Wang, Berger and Burdick2013), we find all these growth trajectories have an overall increasing trend but such kind of growth can be interrupted. In particular, when there is a large time gap between subsequent tests, the ability appears to drop for some individuals, which is clearly seen from Figure 6. A natural explanation might be that during vacations, students do not read and could actually lose ability or they become less familiar with computerized tests after a long break.
The posterior summary of the ability growth for $\theta _3$
,
$\theta _3$
, $\theta _{12}$
,
$\theta _{12}$
, $\theta _{18,}$
and
$\theta _{18,}$
and $\theta _{23}$
, where red circles, black plus, and blue dots are posterior median estimates of the ability, raw score, and EdSphere estimates, respectively, and red dashed lines represent 95% CBs of our estimates.
$\theta _{23}$
, where red circles, black plus, and blue dots are posterior median estimates of the ability, raw score, and EdSphere estimates, respectively, and red dashed lines represent 95% CBs of our estimates.

In Figure 7, we summarize the posterior median (red square) and 95% CI (red bars at two ends) of the average growth rates $c_i$
’s, the standard deviations of test random effects
$c_i$
’s, the standard deviations of test random effects $\tau _i^{-1/2}$
’s, the standard deviations of the daily random effects
$\tau _i^{-1/2}$
’s, the standard deviations of the daily random effects $\delta _i^{-1/2}$
’s, the standard deviations of speediness,
$\delta _i^{-1/2}$
’s, the standard deviations of speediness, $\kappa _i^{-1/2}$
’s, and the average response time for each individual,
$\kappa _i^{-1/2}$
’s, and the average response time for each individual, $\mu _i$
, for
$\mu _i$
, for $i = 1, \ldots , 25$
. Moreover, the estimated posterior median of
$i = 1, \ldots , 25$
. Moreover, the estimated posterior median of $\phi ^{-1/2}$
is 0.0708 and its 95% CI is
$\phi ^{-1/2}$
is 0.0708 and its 95% CI is $[0.0608, 0.0831]$
and the result of
$[0.0608, 0.0831]$
and the result of $\beta $
is summarized in the table of Figure 5.
$\beta $
is summarized in the table of Figure 5.
The posterior summary of c, $\tau _i^{-1/2}$
’s,
$\tau _i^{-1/2}$
’s, $\delta _i^{-1/2}$
’s,
$\delta _i^{-1/2}$
’s, $\kappa _i^{-1/2}$
’s, and
$\kappa _i^{-1/2}$
’s, and $\mu _i$
’s.
$\mu _i$
’s.

Figures 7b,c show that the standard deviations of test and daily random effects (i.e., $\eta _{i,t,s}$
’s and
$\eta _{i,t,s}$
’s and $\varphi _{i,t}$
’s) are almost all quite large with 95% CIs that are well separated from zero except 22nd and 23rd individuals. Recall that these random effects were included in the model to account for a possible lack of the local independence; the evidence is thus strong that the local independence is, indeed, not tenable for this data and that both types of random effects are presented for most individuals. Similarly, Figure 7d illustrates that speediness of individuals is different on the daily basis except that of the 22nd individual (whose speed is almost steady during the studying period). Moreover, there are clearly some patterns in the variation of speediness across individuals; as for some of them, the difference of their speediness on a daily basis is more crucial than that of the others. The differentiation of the average response time in Figure 7e suggests that some individuals incline to take a longer time to finish a test than others no matter what the difficulty level of the test is. As well, it is not surprising the average growth rates are quite different among individuals, as shown in Figure 7a.
$\varphi _{i,t}$
’s) are almost all quite large with 95% CIs that are well separated from zero except 22nd and 23rd individuals. Recall that these random effects were included in the model to account for a possible lack of the local independence; the evidence is thus strong that the local independence is, indeed, not tenable for this data and that both types of random effects are presented for most individuals. Similarly, Figure 7d illustrates that speediness of individuals is different on the daily basis except that of the 22nd individual (whose speed is almost steady during the studying period). Moreover, there are clearly some patterns in the variation of speediness across individuals; as for some of them, the difference of their speediness on a daily basis is more crucial than that of the others. The differentiation of the average response time in Figure 7e suggests that some individuals incline to take a longer time to finish a test than others no matter what the difficulty level of the test is. As well, it is not surprising the average growth rates are quite different among individuals, as shown in Figure 7a.
6 Conclusions and discussion of future work
Our proposed DIR-RT models can jointly model the observations of response times and item responses through sharing ability parameters and can accommodate the complex longitudinal data observed at individually-varying and irregularly-spaced time points. Of course, by simplifying the indices of DIR-RT models, they can also be applied to longitudinal data with a simpler structure, such as when the observations of each participant are equally spaced and examinees are given the same repeated tests over the study period. Thus, according to the structure of the longitudinal data, the practitioners can flexibly employ DIR-RT models at their discretion.
From our simulation study, we have noticed that the incorporation of response time into the item response model in the analysis of longitudinal data has both significantly improved the precision and reduced the bias for the ability estimation. As is known, the enhancement of ability accuracy is vital in the design of computerized (adaptive) testing. For example, the tests provided in the EdSphere learning platform are tailored to the current ability estimation of examinees. With more accurate estimates of ability (in the sense of less bias and higher precision), the assigned tests in the EdSphere platform will better match the students’ ability and further, it enables teachers to better assist students based on their respective capacities.
Using the proposed DIR-RT models to analyze EdSphere datasets, it further supports the findings in Wang et al. (Reference Wang, Berger and Burdick2013). For example, the evidence of violation of the local independence assumption is generally strong in DIR-RT models, and the use of test and daily random effects to model the local dependence seems to be necessary and successful; and the retrospective analysis of ability estimation is useful in understanding population behavior, such as the frequently observed drops in ability after a long vocation in testing.
More importantly, our analysis is the first empirical study in testing to evaluate the choice of linkage function to describe the relationship between the ability–difficulty and response time in a joint model for longitudinal data. The empirical result favors the inverted U-shape linkage, which is quite significant and meaningful, since it supports that in a series of computerized (adaptive) tests, students intend to spend more time on tests that match their ability levels and to spend less time on those either too easy or too hard. Our discovery using the EdSphere dataset is consistent with the theoretical findings of Wang (Reference Wang2006). Further, the partial DIC criterion is a new model assessment method, which makes the comparison feasible to different linkage functions in the analysis of complex longitudinal data for the proposed DIR-RT model.
Many extensions of current DIR-RT models are possible, such as aforementioned extensions to two-parameter and three-parameter DIR-RT models or including a dynamic structure on the speediness parameter which can conjointly model with one’s latent ability. Additionally, investigating any undesired or unplanned dependencies in the response time data—beyond the substantively meaningful latent factors, especially those with dynamic structures—represents another interesting research direction with significant practical implications. Moreover, Figure 7 clearly illustrates some patterns among individuals for the average growth rate $c_i$
’s, the variation of speediness
$c_i$
’s, the variation of speediness $\kappa _i$
’s, and the average response time
$\kappa _i$
’s, and the average response time $\mu _i$
’s. In the next step, we can use either model-based or distance-based clustering methods to analyze the psychological behaviors of students reflected in the patterns shown in Figure 7. Since the MCMC computation of DIR-RT models is time-consuming, we limit our application to a small sample of EdSphere datasets. We plan to develop parallel computing schemes to improve the computation efficiency and then, we can conveniently apply our approach to the entire dataset.
$\mu _i$
’s. In the next step, we can use either model-based or distance-based clustering methods to analyze the psychological behaviors of students reflected in the patterns shown in Figure 7. Since the MCMC computation of DIR-RT models is time-consuming, we limit our application to a small sample of EdSphere datasets. We plan to develop parallel computing schemes to improve the computation efficiency and then, we can conveniently apply our approach to the entire dataset.
Supplementary material
The supplementary material for this article can be found at https://doi.org/10.1017/psy.2025.10019.
Funding statement
Dr. Wang’s research was fully supported by the National Science Foundation CAREER Award No. 1848451.
Competing interests
The authors declare no competing interests exist.
A Appendix: Posterior sampling schemes
A.1
We proceed with the MCMC steps by the Gibbs sampler, where we first derive the full conditional posteriors of each unknown parameter.
Step 1: Sampling Y: Truncated normal distribution sampling
Given $\theta $
,
$\theta $
, $\varphi $
,
$\varphi $
, $\eta $
,
$\eta $
, $\gamma $
, and X, the latent variables
$\gamma $
, and X, the latent variables $\{Y_{i,t,s,l}\}$
are sampled from
$\{Y_{i,t,s,l}\}$
are sampled from
 $$ \begin{align*} &Y_{i,t,s,l} \sim \mathcal{N_+}(\theta_{i,t}-a_{i,t,s}+\varphi_{i,t}+\eta_{i,t,s},\psi_{i,t,s,l}^{-1}) \quad \text{if} \quad X_{i,t,s,l}=1, \\ &Y_{i,t,s,l} \sim \mathcal{N_-}(\theta_{i,t}-a_{i,t,s}+\varphi_{i,t}+\eta_{i,t,s},\psi_{i,t,s,l}^{-1}) \quad \text{if} \quad X_{i,t,s,l}=0 \,, \end{align*} $$
where $\mathcal {N}_{+}(\cdot , \cdot )$
means the normal distribution truncated at the left by zero, while
$\mathcal {N}_{+}(\cdot , \cdot )$
means the normal distribution truncated at the left by zero, while $\mathcal {N}_{-}(\cdot , \cdot )$
is the normal distribution truncated at the right by zero.
$\mathcal {N}_{-}(\cdot , \cdot )$
is the normal distribution truncated at the right by zero.
Step 2: Sampling $\theta $
: Depending on the Choice of
$\theta $
: Depending on the Choice of $L(\cdot )$
Step 2.1: $L(\cdot )=\cdot $
, Forward Filtering and Backward Sampling (FFBS).
$L(\cdot )=\cdot $
, Forward Filtering and Backward Sampling (FFBS).
Define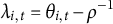 $\lambda _{i, t}=\theta _{i,t}-\rho ^{-1}$
,
$\lambda _{i, t}=\theta _{i,t}-\rho ^{-1}$
, $g_{i,t}=1-c_i\rho \Delta _{i, t}^{+}$
,
$g_{i,t}=1-c_i\rho \Delta _{i, t}^{+}$
, $Z_{i,t,s,l}=Y_{i,t,s,l}+a_{i,t,s}-\varphi _{i,t}-\eta _{i,t,s}-\rho ^{-1}$
, and
$Z_{i,t,s,l}=Y_{i,t,s,l}+a_{i,t,s}-\varphi _{i,t}-\eta _{i,t,s}-\rho ^{-1}$
, and $H_{i,t,s}=\log (R_{i,t,s})-\mu _i+\nu _{i,t} +\beta (a_{i,t,s}-\rho ^{-1})$
, then the (conditional) one-parameter DIR-RT model will fit the framework of dynamic linear model (West & Harrison, Reference West and Harrison1997), i.e.,
$H_{i,t,s}=\log (R_{i,t,s})-\mu _i+\nu _{i,t} +\beta (a_{i,t,s}-\rho ^{-1})$
, then the (conditional) one-parameter DIR-RT model will fit the framework of dynamic linear model (West & Harrison, Reference West and Harrison1997), i.e.,
 $$ \begin{align} \text{System Equation:} ~~&\lambda_{i,t}=g_{i,t}\lambda_{i,t-1}+w_{i,t}, \end{align} $$
 $$ \begin{align} \text{Observation Equation:} ~~& Z_{i,t,s,l}=\lambda_{i,t}+\xi_{i,t,s,l}, \end{align} $$
 $$ \begin{align} & H_{i,t,s}=\beta\lambda_{i,t}+\zeta_{i,t,s}, \end{align} $$
where $w_{i, t} \sim \mathcal {N}(0,\phi ^{-1}\Delta _{i, t})$
,
$w_{i, t} \sim \mathcal {N}(0,\phi ^{-1}\Delta _{i, t})$
, $\xi _{i,t,s,l}\sim \mathcal {N}(0, 4\gamma _{i,t,s,l}^2+\sigma ^2),$
and
$\xi _{i,t,s,l}\sim \mathcal {N}(0, 4\gamma _{i,t,s,l}^2+\sigma ^2),$
and $\zeta _{i, t, s}\sim \mathcal {N}(0,\varrho ^{-1})$
. Denote information available on the tth day as
$\zeta _{i, t, s}\sim \mathcal {N}(0,\varrho ^{-1})$
. Denote information available on the tth day as
 $$\begin{align*}\mathcal{F}_{i,t}=\left\{g_{i,e}, \phi, \beta, \psi_{i,e,1,1}, \ldots, \psi_{i,e,S_{i,e}}, K_{i,e, S_{i,e}},\varrho, H_{i,e,1}, \ldots, H_{i,e,S_{i,e}}, Z_{i,e,1,1}, \ldots, Z_{i,e,S_{i,e}, K_{i,e,S_{i,e}}}\right\}_{e=1}^t. \end{align*}$$
The FFBS algorithm can be implemented to block update each $\lambda _{i}=(\lambda _{i,0},\ldots , \lambda _{i, T_i})' $
:
$\lambda _{i}=(\lambda _{i,0},\ldots , \lambda _{i, T_i})' $
:
-
1. (Forward Filtering) For $t \geq 1$
, it is not hard to show that
$[\lambda _{i,t} \mid \mathcal {F}_{i,t}] \sim \mathcal {N} (\mu _{i,t}, V_{i,t} ),$
with
$\mu _{i,t} = V_{i,t} ( R_{i,t}^{-1}d_{i,t}+\sum _{s=1}^{S_{i,t}}\sum _{l=1}^{K_{i,t,s}}Z_{i,t,s,l}\psi _{i,t,s,l}+\varrho \beta \sum _{s=1}^{S_{i,t}} H_{i,t,s} ) $
and
$V_{i,t}= \left ( R_{i,t}^{-1}+\sum _{s=1}^{S_{i,t}}\sum _{l=1}^{K_{i,t,s}}\psi _{i,t,s,l}+\varrho \beta ^2 S_{i,t} \right )^{-1}$
. Notice that when
$t=0$
,
$\lambda _{i,0}$
follows
$\mathcal {N} (\mu _{i,0}, V_{i,0})$
with
$\mu _{i,0}=\mu _{G_j}-\rho ^{-1}$
and
$V_{i,0}=V_{G_j}$
.
$t \geq 1$
, it is not hard to show that
$[\lambda _{i,t} \mid \mathcal {F}_{i,t}] \sim \mathcal {N} (\mu _{i,t}, V_{i,t} ),$
with
$\mu _{i,t} = V_{i,t} ( R_{i,t}^{-1}d_{i,t}+\sum _{s=1}^{S_{i,t}}\sum _{l=1}^{K_{i,t,s}}Z_{i,t,s,l}\psi _{i,t,s,l}+\varrho \beta \sum _{s=1}^{S_{i,t}} H_{i,t,s} ) $
and
$V_{i,t}= \left ( R_{i,t}^{-1}+\sum _{s=1}^{S_{i,t}}\sum _{l=1}^{K_{i,t,s}}\psi _{i,t,s,l}+\varrho \beta ^2 S_{i,t} \right )^{-1}$
. Notice that when
$t=0$
,
$\lambda _{i,0}$
follows
$\mathcal {N} (\mu _{i,0}, V_{i,0})$
with
$\mu _{i,0}=\mu _{G_j}-\rho ^{-1}$
and
$V_{i,0}=V_{G_j}$
. -
2. (Backward Sampling) Save all quantities of
$\mu _{i,t}$
and
$V_{i,t}$
. Then, draw
$\lambda _{i,T_i}$
from
$\mathcal {N} (\mu _{i,T_i}, V_{i,T_i})$
. When
$t= (T_i-1)$
to 0, with some algebra, we can see
$\lambda _{i,t}$
will be drawn from
$ [ \lambda _{i, t} \mid \lambda _{i,t+1} , \mathcal {F}_{i,t}] \sim \mathcal {N} (h_{i,t}, m_{i,t}), $
where
$h_{i,t}= m_{i,t}(V_{it,}^{-1}\mu _{i,t}+\phi g_{i,t+1}\Delta _{i,t+1}^{-1}\lambda _{i, t+1} $
) and
$m_{i,t}=(\phi g_{i,t+1}^2\Delta _{i,t+1}^{-1}+V_{i,t}^{-1})^{-1}$
.






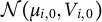
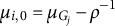








Thus, for $t=0,\ldots ,T_i$
, set
$t=0,\ldots ,T_i$
, set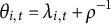 $\theta _{i,t}=\lambda _{i,t}+\rho ^{-1}$
and
$\theta _{i,t}=\lambda _{i,t}+\rho ^{-1}$
and $\theta _{i}$
is sampled as a whole by noticing the identity
$\theta _{i}$
is sampled as a whole by noticing the identity $ \mathrm {Pr}(\theta _i \mid \mathcal {F}_{i,T_i})=\mathrm {Pr}(\theta _{i,T_i} \mid \mathcal {F}_{i,T_i})\mathrm {Pr}(\theta _{i,{T_i-1}} \mid \theta _{i,T_i},\mathcal {F}_{i,T-1})\ldots \mathrm {Pr}(\theta _{i,0} \mid \theta _{i,1},\mathcal {F}_{i,0}). $
Step 2.2: $L(\cdot )=|\cdot |$
, Conditional mixture of truncated normal distribution
$L(\cdot )=|\cdot |$
, Conditional mixture of truncated normal distribution
Consider $\phi $
, c, Y,
$\phi $
, c, Y, $\varphi $
,
$\varphi $
, $\eta $
,
$\eta $
, $\gamma $
,
$\gamma $
, $\mu $
,
$\mu $
, $\nu $
,
$\nu $
, $\varrho ,$
and
$\varrho ,$
and $\beta $
are given. Similarly, the (conditional) one-parameter DIR-RT model fits the framework of state-space models as shown in Equation (A.1), Equation (A.2) and with Equation (A.3) becomes
$\beta $
are given. Similarly, the (conditional) one-parameter DIR-RT model fits the framework of state-space models as shown in Equation (A.1), Equation (A.2) and with Equation (A.3) becomes
 $$ \begin{align*} H_{i,t,s}^* & =\beta|\lambda_{i,t}-q_{i,t,s}|+\zeta_{i,t,s}, \end{align*} $$
where $q_{i,t,s}=a_{i,t,s}-\rho ^{-1}$
and
$q_{i,t,s}=a_{i,t,s}-\rho ^{-1}$
and $H_{i,t,s}^*=\log (R_{i,t,s})-\mu _i+\nu _{i,t}$
. Then, a Gibbs algorithm to sample
$H_{i,t,s}^*=\log (R_{i,t,s})-\mu _i+\nu _{i,t}$
. Then, a Gibbs algorithm to sample $\lambda _{i,0}, \ldots , \lambda _{i,T_i}$
is designed below.
$\lambda _{i,0}, \ldots , \lambda _{i,T_i}$
is designed below.
Let M denote the number of MCMC iterations. After some mathematical derivations, for $t=1, \ldots , T_i-1$
,
$t=1, \ldots , T_i-1$
, $\lambda _{i,t}^{(M)}$
is drawn from a mixture of truncated normal distribution, i.e.,
$\lambda _{i,t}^{(M)}$
is drawn from a mixture of truncated normal distribution, i.e.,
 $$\begin{align*}\lambda_{i,t}^{(M)}\sim \mathrm{Pr} (\lambda_{i,t} \mid \lambda_{i,t-1}^{(M)}, \lambda_{i,t+1}^{(M-1)}, \mathcal{F}_{i,T_i}), \end{align*}$$
where $ \mathrm {Pr}(\lambda _{i,t} \mid \lambda _{i,t-1}^{(M)}, \lambda _{i,t}^{(M-1)}, \mathcal {F}_{i,T_i})= \sum _{s=0}^{S_{i,t}} p_{i,t,s} \mathcal {N}_{(q_{i,t,s}, q_{i,t,s+1}]} (d_{i,t,s}, R_{i,t}) $
with
$ \mathrm {Pr}(\lambda _{i,t} \mid \lambda _{i,t-1}^{(M)}, \lambda _{i,t}^{(M-1)}, \mathcal {F}_{i,T_i})= \sum _{s=0}^{S_{i,t}} p_{i,t,s} \mathcal {N}_{(q_{i,t,s}, q_{i,t,s+1}]} (d_{i,t,s}, R_{i,t}) $
with $q_{i,t,0}=-\infty $
,
$q_{i,t,0}=-\infty $
, $q_{i,t, S_{i,t}+1}=\infty $
,
$q_{i,t, S_{i,t}+1}=\infty $
, $p_{i,t,s}$
defined as
$p_{i,t,s}$
defined as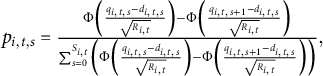 $ p_{i,t,s}=\frac {\Phi \left (\frac {q_{i,t,s}-d_{i,t,s}}{\sqrt {R_{i,t}}}\right )-\Phi \left (\frac {q_{i,t,s+1}-d_{i,t,s}}{\sqrt {R_{i,t}}}\right )}{\sum _{s=0}^{S_{i,t}}\left (\Phi \left (\frac {q_{i,t,s}-d_{i,t,s}}{\sqrt {R_{i,t}}}\right )-\Phi \left (\frac {q_{i,t,s+1}-d_{i,t,s}}{\sqrt {R_{i,t}}}\right )\right )}, $
and
$ p_{i,t,s}=\frac {\Phi \left (\frac {q_{i,t,s}-d_{i,t,s}}{\sqrt {R_{i,t}}}\right )-\Phi \left (\frac {q_{i,t,s+1}-d_{i,t,s}}{\sqrt {R_{i,t}}}\right )}{\sum _{s=0}^{S_{i,t}}\left (\Phi \left (\frac {q_{i,t,s}-d_{i,t,s}}{\sqrt {R_{i,t}}}\right )-\Phi \left (\frac {q_{i,t,s+1}-d_{i,t,s}}{\sqrt {R_{i,t}}}\right )\right )}, $
and $m_{i,t}=\phi \Delta _{i,t}^{-1} g_{i,t} \lambda _{i,t-1}^{(M)}+\phi \Delta _{i,t+1}^{-1}g_{i,t+1}\lambda _{i,t+1}^{(M-1)}+\sum _{s=1}^{S_{i,t}}\sum _{l=1}^{K_{i,t,s}}\psi _{i,t,s,l}Z_{i,t,s,l}+\varrho \sum _{s=1}^{S_{i,t}}\beta ^2q_{i,t,s}$
,
$m_{i,t}=\phi \Delta _{i,t}^{-1} g_{i,t} \lambda _{i,t-1}^{(M)}+\phi \Delta _{i,t+1}^{-1}g_{i,t+1}\lambda _{i,t+1}^{(M-1)}+\sum _{s=1}^{S_{i,t}}\sum _{l=1}^{K_{i,t,s}}\psi _{i,t,s,l}Z_{i,t,s,l}+\varrho \sum _{s=1}^{S_{i,t}}\beta ^2q_{i,t,s}$
, $d_{i,t,s}=R_{i,t}\left (m_{i,t}+\varrho \beta \left (\sum _{j=0}^{s}H_{i,t,j}^*-\sum _{j=s}^{S_{i,t}}H_{i,t,j}^*\right )\right ),\ s=0, \ldots , S_{i,t}, \ H_{i,t,0}=0$
, and
$d_{i,t,s}=R_{i,t}\left (m_{i,t}+\varrho \beta \left (\sum _{j=0}^{s}H_{i,t,j}^*-\sum _{j=s}^{S_{i,t}}H_{i,t,j}^*\right )\right ),\ s=0, \ldots , S_{i,t}, \ H_{i,t,0}=0$
, and $R_{i,t}=\big (\phi \Delta _{i,t}^{-1}+\phi \Delta _{i,t+1}^{-1} g_{i,t+1}^2 +\sum _{s=1}^{S_{i,t}}\sum _{l=1}^{K_{i,t,s}}\psi _{i,t,s,l}+\varrho \beta ^2 S_{i,t}\big )^{-1}$
. The formula is almost the same for sampling
$R_{i,t}=\big (\phi \Delta _{i,t}^{-1}+\phi \Delta _{i,t+1}^{-1} g_{i,t+1}^2 +\sum _{s=1}^{S_{i,t}}\sum _{l=1}^{K_{i,t,s}}\psi _{i,t,s,l}+\varrho \beta ^2 S_{i,t}\big )^{-1}$
. The formula is almost the same for sampling $\lambda _{i,T_i}$
with only deleting the terms involving the index of
$\lambda _{i,T_i}$
with only deleting the terms involving the index of $t+1$
in
$t+1$
in $m_{i,t}$
and
$m_{i,t}$
and $R_{i,t}$
and similarly, we delete the terms involving the index of
$R_{i,t}$
and similarly, we delete the terms involving the index of $t-1$
in
$t-1$
in $m_{i,t}$
and
$m_{i,t}$
and $R_{i,t}$
for
$R_{i,t}$
for $\lambda _{i,0}$
. At the end, set
$\lambda _{i,0}$
. At the end, set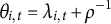 $\theta _{i, t}=\lambda _{i,t}+\rho ^{-1}$
, for
$\theta _{i, t}=\lambda _{i,t}+\rho ^{-1}$
, for $t=1, \ldots , T_i$
.
$t=1, \ldots , T_i$
.
Step 3: Sampling c: Truncated normal distribution sampling
When $\theta $
and
$\theta $
and $\phi $
are given, the full conditional distribution of
$\phi $
are given, the full conditional distribution of $c_i$
is a truncated normal distribution
$c_i$
is a truncated normal distribution
 $$ \begin{align*} c_i\sim & \mathcal{N}_{+}\left(\frac{\sum_{t=1}^{T_i}(1-\rho\theta_{i, t-1})(\theta_{i,t}-\theta_{i, t-1})\Delta_{i,t}^+ \Delta_{i,t}^{-1}}{\sum_{t=1}^{T_i} (\Delta_{i, t}^+(1-\rho\theta_{i, t-1}))^2\Delta_{i, t}^{-1}}, \frac{1}{\phi \sum_{t=1}^{T_i}(\Delta_{i, t}^+ (1-\rho\theta_{i, t-1}))^2\Delta_{i, t}^{-1}}\right). \end{align*} $$
Step 4: Sampling $\eta $
: Multivariate normal distribution sampling
$\eta $
: Multivariate normal distribution sampling
Provided $\theta $
,
$\theta $
, $\varphi $
,
$\varphi $
, $\tau $
,
$\tau $
, $Y,$
and
$Y,$
and $\gamma $
are given, if
$\gamma $
are given, if $S_{i,t}=1$
,
$S_{i,t}=1$
, $\eta _{i,t,S_{i,t}}=0$
, while if
$\eta _{i,t,S_{i,t}}=0$
, while if $S_{it}>1$
, then
$S_{it}>1$
, then
 $$ \begin{align*} & \eta_{i,t}^* \sim \mathcal{N}_{S_{i,t}-1} \left((A_{i,t}^T \Sigma_{\psi_{i,t}}^{-1} A_{i,t}+\tau_i\Sigma_{i,t}^{-1})^{-1}A_{i,t}^T \Sigma_{\psi_{i,t}}^{-1} Y_{i,t}^{*}, (A_{i,t}^T \Sigma_{\psi_{i,t}}^{-1} A_{i,t}+\tau_i\Sigma_{i,t}^{-1})^{-1} \right) \,, \end{align*} $$
is the multivariate normal distribution, where $Y_{i,t}^*=(Y_{i,t,1}^*, \ldots , Y_{i,t, S_{i,t}}^*)'$
with
$Y_{i,t}^*=(Y_{i,t,1}^*, \ldots , Y_{i,t, S_{i,t}}^*)'$
with $Y_{i,t,s}^*= (Y_{i,t,s,1}-h_{i,t,s}, \ldots $
,
$Y_{i,t,s}^*= (Y_{i,t,s,1}-h_{i,t,s}, \ldots $
, $Y_{i,t,s,K_{i,t,s}}-h_{i,t,s})$
and
$Y_{i,t,s,K_{i,t,s}}-h_{i,t,s})$
and $h_{i,t,s}=\theta _{i,t}-a_{i,t,s}+\varphi _{i,t}$
,
$h_{i,t,s}=\theta _{i,t}-a_{i,t,s}+\varphi _{i,t}$
, $\Sigma _{\psi _{i,t}}^{-1}=\mathrm {diag}((\psi _{i,t,1,1},\ldots , \psi _{i,t,S_{i,t}, K_{i,t,S_{i,t}}})')$
,
$\Sigma _{\psi _{i,t}}^{-1}=\mathrm {diag}((\psi _{i,t,1,1},\ldots , \psi _{i,t,S_{i,t}, K_{i,t,S_{i,t}}})')$
,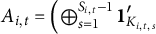 $ A_{i,t}=\left ( \bigoplus _{s=1}^{S_{i,t}-1} \mathbf {1}_{K_{i,t,s}}'\right .$
,
$ A_{i,t}=\left ( \bigoplus _{s=1}^{S_{i,t}-1} \mathbf {1}_{K_{i,t,s}}'\right .$
,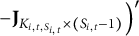 $\left .-\mathbf {J}_{K_{i,t,S_{i,t}}\times (S_{i,t}-1)} \right )'$
,
$\left .-\mathbf {J}_{K_{i,t,S_{i,t}}\times (S_{i,t}-1)} \right )'$
, $\bigoplus $
is a direct sum and
$\bigoplus $
is a direct sum and $\mathrm {diag}$
implies a diagonal matrix. Set
$\mathrm {diag}$
implies a diagonal matrix. Set $\eta _{i,t,S_{i,t}}=-\sum _{s=1}^{S_{i,t}-1}\eta _{i,t,s}$
.
$\eta _{i,t,S_{i,t}}=-\sum _{s=1}^{S_{i,t}-1}\eta _{i,t,s}$
.
Step 5: Sampling $\tau $
: Gamma distribution sampling
$\tau $
: Gamma distribution sampling
Let $\mathcal {G}a(a, b)$
denote the gamma distribution with shape parameter a and rate parameter b. Given
$\mathcal {G}a(a, b)$
denote the gamma distribution with shape parameter a and rate parameter b. Given $\eta $
, the full conditional distribution of
$\eta $
, the full conditional distribution of $\tau _{i}$
is the gamma distribution
$\tau _{i}$
is the gamma distribution
 $$ \begin{align*} & \tau_i \sim \mathcal{G}a \left(\frac{\sum_{t=1}^{T_i}S_{i,t}-(T_i+1)}{2},\frac{\sum_{t=1}^{T_i}{\eta_{i,t}^*}'\Sigma_{i,t}^{-1}\eta_{i,t}^*}{2}\right) \,. \end{align*} $$
Step 6: Sampling $\varphi $
: Normal distribution sampling
$\varphi $
: Normal distribution sampling
Given $\theta $
,
$\theta $
, $\eta $
,
$\eta $
, $Y,$
and
$Y,$
and $\gamma $
, the full conditional distribution of
$\gamma $
, the full conditional distribution of $\varphi _{i,t}$
is the normal distribution
$\varphi _{i,t}$
is the normal distribution
 $$ \begin{align*} & \varphi_{i, t} \sim \mathcal{N} \left(\frac{\sum_{s=1}^{S_{i,t}}\sum_{l=1}^{K_{i,t,s}}\psi_{i,t,s,l}(Y_{i,t,s,l}-\theta_{i,t}+ a_{i,t,s}-\eta_{i,t,s})}{\sum_{s=1}^{S_{i,t}}\sum_{l=1}^{K_{i,t,s}}\psi_{i,t,s,l}+\delta_i},\frac{1}{\sum_{s=1}^{S_{i,t}}\sum_{l=1}^{K_{its}}\psi_{i,t,s,l}+\delta_i}\right). \end{align*} $$
Step 7: Sampling $\delta $
: Gamma distribution sampling
$\delta $
: Gamma distribution sampling
When $\varphi $
is given, the full conditional distribution of
$\varphi $
is given, the full conditional distribution of $\delta _{i}$
is the gamma distribution
$\delta _{i}$
is the gamma distribution
 $$ \begin{align*} & \delta_i \sim \mathcal{G}a \left(\frac{T_i-1}{2},\frac{\sum_{t=1}^{T_i}\varphi_{i,t}^2}{2}\right) \,. \end{align*} $$
Step 8: Sampling $\phi $
: Gamma distribution sampling
$\phi $
: Gamma distribution sampling
When $\theta , c$
are given, the full conditional distribution of
$\theta , c$
are given, the full conditional distribution of $\phi $
is the gamma distribution
$\phi $
is the gamma distribution
 $$ \begin{align*} & \phi \sim \mathcal{G}a \left(\frac{\sum_{i=1}^n T_i-1}{2},\frac{\sum_{i=1}^n\sum_{t=1}^{T_i} \Delta_{i,t}^{-1}(\theta_{i,t}-\theta_{i, t-1}-c_i(1-\rho\theta_{i, t-1})\Delta_{i,t}^{+})^2}{2}\right) \,. \end{align*} $$
Step 9: Sampling $\gamma $
: Metropolis–Hastings (MH) sampling
$\gamma $
: Metropolis–Hastings (MH) sampling
Given Y, $\theta $
,
$\theta $
, $\varphi ,$
and
$\varphi ,$
and $\eta $
, the full conditional distribution of
$\eta $
, the full conditional distribution of $\gamma _{i,t,s,l}$
is not in a closed form. Thus, we resort to an MH scheme to sample this distribution. A suitable proposal for sample
$\gamma _{i,t,s,l}$
is not in a closed form. Thus, we resort to an MH scheme to sample this distribution. A suitable proposal for sample $\gamma $
is K-S distribution itself. We first sample
$\gamma $
is K-S distribution itself. We first sample $\gamma $
from the K-S distribution and then let
$\gamma $
from the K-S distribution and then let
 $$ \begin{align*} \gamma_{i,t,s,l}^{(M)} = & \left\{\begin{array}{ll} \gamma^{*}, &\text{with probability} \quad \mathrm{min}(1,LR)\\ \gamma^{(M-1)}_{i,t,s,l}, &\text{otherwise} \quad \end{array}\right. \end{align*} $$
where, given Y, $\theta $
,
$\theta $
, $\varphi ,$
and
$\varphi ,$
and $\eta $
,
$\eta $
,
 $$ \begin{align*} LR&=\sqrt{\frac{\sigma^2+4(\gamma^{(M-1)}_{i,t,s,l})^2}{\sigma^2+4(\gamma^*)^2}}\exp\left\{-\frac{(Y_{i,t,s,l}-\theta_{i,t}+a_{i,t,s}-\varphi_{i,t}-\eta_{i,t,s})^2}{2}\right.\\ &\quad \times\left.\left(\frac{1}{\sigma^2+4(\gamma^*)^2}-\frac{1} {\sigma^2+4(\gamma^{(M-1)}_{i,t,s,l})^2}\right)\right\} \,. \end{align*} $$
Step 10: Sampling $\mu $
: Normal distribution
$\mu $
: Normal distribution
Given $\varrho $
,
$\varrho $
, $\nu $
,
$\nu $
, $\theta $
,
$\theta $
, $\beta $
, the full conditional distribution of
$\beta $
, the full conditional distribution of $\mu _i$
is the normal distribution:
$\mu _i$
is the normal distribution:
 $$\begin{align*}\mu_i\sim \mathcal{N} \left(\frac{\sum_{t=1}^{T_i}\sum_{s=1}^{S_{i,t}} \left[\log (R_{i,t,s})+\nu_{i,t}-\beta L(\theta_{i,t}-a_{i,t,s})\right]}{ \sum_{t=1}^{T_i}{S_{i,t}}}, \frac{1}{{\varrho \sum_{t=1}^{T_i}{S_{i,t}}}}\right). \end{align*}$$
Step 11: Sampling $\nu $
: Normal distribution
$\nu $
: Normal distribution
Given $\varrho $
,
$\varrho $
, $\mu $
,
$\mu $
, $\theta $
,
$\theta $
, $\beta $
, the full conditional distribution of
$\beta $
, the full conditional distribution of $\nu _{i,t}$
is the normal distribution:
$\nu _{i,t}$
is the normal distribution:
 $$\begin{align*}\nu_{i,t} \sim \mathcal{N} \left(\frac{\sum_{s=1}^{S_{i,t}} -\varrho \left[\log (R_{i,t,s})-\mu_{i}-\beta L(\theta_{i,t}-a_{i,t,s})\right]}{\varrho S_{i,t}+\kappa_i}, \frac{1}{\varrho S_{i,t}+\kappa_i}\right). \end{align*}$$
Step 12: Sampling $\varrho $
: Gamma distribution
$\varrho $
: Gamma distribution
Given $\mu $
,
$\mu $
, $\nu $
,
$\nu $
, $\theta $
,
$\theta $
, $\beta $
, the full conditional distribution of
$\beta $
, the full conditional distribution of $\varrho $
is the gamma distribution:
$\varrho $
is the gamma distribution:
 $$\begin{align*}\varrho \sim \mathcal{G}a \left( \frac{\sum_{i=1}^n \sum_{t=1}^{T_i} S_{i,t}-1}{2}, \frac{\sum_{i=1}^n \sum_{t=1}^{T_i}\sum_{s=1}^{S_{i,t}}\left[\log (R_{i,t,s})-\mu_{i}+\nu_{i,t}-\beta L(\theta_{i,t}-a_{i,t,s})\right]^2}{2}\right). \end{align*}$$
Step 13: Sampling $\kappa $
: Gamma distribution
$\kappa $
: Gamma distribution
Given $\nu $
, the full conditional distribution of
$\nu $
, the full conditional distribution of $\kappa _i$
is the gamma distribution:
$\kappa _i$
is the gamma distribution:
 $$\begin{align*}\kappa_{i} \sim \mathcal{G}a \left(\frac{T_i-1}{2}, \frac{\sum_{t=1}^{T_i}\nu_{i,t}^2}{2}\right). \end{align*}$$
Step 15: Sampling $\beta $
: Normal distribution
$\beta $
: Normal distribution
Given $\varrho $
,
$\varrho $
, $\nu $
,
$\nu $
, $\mu $
, and
$\mu $
, and $\theta $
the full conditional distribution of
$\theta $
the full conditional distribution of $\beta $
is
$\beta $
is
 $$ \begin{align*} & \beta\sim \mathcal{N} \left(\frac{\sum_{i=1}^n\sum_{t=1}^{T_i}\sum_{s=1}^{S_{i, t}} L(\theta_{i, t}-a_{i,t,s})\left[\log (R_{i,t,s})-\mu_{i}+\nu_{i,t}\right]}{\sum_{i=1}^n \sum_{t=1}^{T_i}\sum_{s=1}^{S_{i,t}} (\theta_{i,t}-a_{i,t,s})^2}, \frac{1}{\varrho \sum_{i=1}^n \sum_{t=1}^{T_i}\sum_{s=1}^{S_{i,t}} (\theta_{i,t}-a_{i,t,s})^2}\right). \end{align*} $$
If we have the prior for $\beta $
being positive, then
$\beta $
being positive, then $\beta $
is drawn from the same normal distribution above but just truncated by zero on the left.
$\beta $
is drawn from the same normal distribution above but just truncated by zero on the left.
B Appendix: Formula to compute partial DIC in DIR-RT models
In this section, we derive the formula of partial DIC discussed in Section 5.1. Let $\boldsymbol {\Theta } = vec(\varrho ,\kappa ,\beta , \mu )$
define the vectorized parameters and
$\boldsymbol {\Theta } = vec(\varrho ,\kappa ,\beta , \mu )$
define the vectorized parameters and $R_{i, t}^\star = (\log R_{i,t,1} \ldots , \log R_{i,t, S_{i,t}})' $
and
$R_{i, t}^\star = (\log R_{i,t,1} \ldots , \log R_{i,t, S_{i,t}})' $
and $\mu _{i,t} = (\mu _i + \beta L(\theta _{i, t}-a_{i, t, 1}), \ldots , \mu _i + \beta L(\theta _{i, t}-a_{i, t, S_{i,t}}))'$
. Then, for any
$\mu _{i,t} = (\mu _i + \beta L(\theta _{i, t}-a_{i, t, 1}), \ldots , \mu _i + \beta L(\theta _{i, t}-a_{i, t, S_{i,t}}))'$
. Then, for any $i=1, \ldots , n$
and
$i=1, \ldots , n$
and $t=1, \ldots , T_i$
, we have
$t=1, \ldots , T_i$
, we have $ R_{i,t}^\star \stackrel {ind} \sim \mathcal {N}_{S_{i,t}}(\mu _{i,t}, \Omega _{i,t}), $
where
$ R_{i,t}^\star \stackrel {ind} \sim \mathcal {N}_{S_{i,t}}(\mu _{i,t}, \Omega _{i,t}), $
where $ind$
indicates independent and
$ind$
indicates independent and $\Omega _{i,t}=\kappa _i^{-1}\mathbf {1}_{S_{i,t}}\mathbf {1}_{S_{i,t}}'+\varrho ^{-1}\mathbf {I}_{S_{i,t}}$
. The partial likelihood of DIR-RT models based only on response times is
$\Omega _{i,t}=\kappa _i^{-1}\mathbf {1}_{S_{i,t}}\mathbf {1}_{S_{i,t}}'+\varrho ^{-1}\mathbf {I}_{S_{i,t}}$
. The partial likelihood of DIR-RT models based only on response times is $ \mathcal {L}(\boldsymbol {\Theta } \mid R^\star , \theta , L(\cdot )) = \prod _{i=1}^n \prod _{t=1}^{T_i} f(R_{i,t}^\star \mid \boldsymbol {\Theta }, \theta , L(\cdot )) $
, where
$ \mathcal {L}(\boldsymbol {\Theta } \mid R^\star , \theta , L(\cdot )) = \prod _{i=1}^n \prod _{t=1}^{T_i} f(R_{i,t}^\star \mid \boldsymbol {\Theta }, \theta , L(\cdot )) $
, where $f(R_{i,t}^\star \mid \boldsymbol {\Theta }, \theta , L(\cdot ))$
follows a multivariate normal probability density and
$f(R_{i,t}^\star \mid \boldsymbol {\Theta }, \theta , L(\cdot ))$
follows a multivariate normal probability density and $R^*=\{R_{i,t}^*\}$
. According to (5.1), the partial DIC of the response times part in DIR-RT models is
$R^*=\{R_{i,t}^*\}$
. According to (5.1), the partial DIC of the response times part in DIR-RT models is
 $$ \begin{align} \mathrm{DIC}_{\mathrm{P}} = & 2 \mathrm{E}_{\pi(\boldsymbol{\Theta} \mid R^\star, \theta)} Q(\boldsymbol{\Theta}, R^\star, L(\cdot)) -Q(\bar{\boldsymbol{\Theta}}, R^\star,L(\cdot)), \end{align} $$
with $Q(\boldsymbol {\Theta }, R^\star , L(\cdot ))=-2\log \mathcal {L}(\boldsymbol {\Theta } \mid R^\star , \theta , L(\cdot ))$
,
$Q(\boldsymbol {\Theta }, R^\star , L(\cdot ))=-2\log \mathcal {L}(\boldsymbol {\Theta } \mid R^\star , \theta , L(\cdot ))$
, $\pi (\boldsymbol {\Theta } \mid R^\star , \theta )$
as the posterior distribution of Equation (2.2) given
$\pi (\boldsymbol {\Theta } \mid R^\star , \theta )$
as the posterior distribution of Equation (2.2) given $\theta $
is known and
$\theta $
is known and $\overline {\boldsymbol {\Theta }}$
is the posterior median estimates of
$\overline {\boldsymbol {\Theta }}$
is the posterior median estimates of $\pi (\boldsymbol {\Theta } \mid R^\star , \theta )$
. Using standard results on linear algebra, we have
$\pi (\boldsymbol {\Theta } \mid R^\star , \theta )$
. Using standard results on linear algebra, we have $|\Omega _{i, t}| = \varrho ^{-S_{i,t}}(1+\varrho \frac {S_{i,t}}{k_i})$
,
$|\Omega _{i, t}| = \varrho ^{-S_{i,t}}(1+\varrho \frac {S_{i,t}}{k_i})$
, $\Omega _{i, t}^{-1}= \varrho \mathbf {I}_{S_{i,t}} -\frac {\varrho ^2}{k_i+\varrho S_{i,t}} \mathbf {1}_{S_{i,t}}\mathbf {1}_{S_{i,t}}'$
, and hence,
$\Omega _{i, t}^{-1}= \varrho \mathbf {I}_{S_{i,t}} -\frac {\varrho ^2}{k_i+\varrho S_{i,t}} \mathbf {1}_{S_{i,t}}\mathbf {1}_{S_{i,t}}'$
, and hence,
 $$ \begin{align} -2\log \mathcal{L}(\boldsymbol{\Theta}\mid R^\star, \theta, L(\cdot)) & = \sum_i\sum_t[(R_{i,t}^\star - \mu_{i,t})' \Omega_{i,t}^{-1} (R_{i,t}^\star - \mu_{i,t}) + log|\Omega_{i,t}|+(S_{i,t}log2\pi)] \nonumber\\ & = \varrho \sum_{i,t} (R_{i,t}^\star - \mu_{i,t})'(R_{i,t}^\star - \mu_{i,t})- \varrho^2\sum_{i,t} \frac{[(R_{i,t}^\star - \mu_{i,t})'\mathbf{1}_{S_{i,t}}]^2}{k_i+\varrho S_{i,t}} \nonumber \\ &\quad + \log(\frac{2\pi}{\varrho})\sum_{i,t}S_{i,t}+ \sum_{i,t}\log(\kappa_i+\varrho S_{i,t}) -\sum_{i} T_i \log \kappa_i. \end{align} $$
Given $\theta $
as the posterior median estimates from DIR-RT models, then, employing the expression (B.2) and the MCMC samples drawn from
$\theta $
as the posterior median estimates from DIR-RT models, then, employing the expression (B.2) and the MCMC samples drawn from $\pi (\boldsymbol {\Theta } \mid R^\star , \theta )$
, we can easily calculate
$\pi (\boldsymbol {\Theta } \mid R^\star , \theta )$
, we can easily calculate $ \text {DIC}_{\mathrm {P}}$
in (B.1).
$ \text {DIC}_{\mathrm {P}}$
in (B.1).
To further study on the sensitivity of the estimation of one’s ability $\theta $
in the determination of the linkage, we generate DIR-RT datasets by using the same set-up as shown in Table 1 with
$\theta $
in the determination of the linkage, we generate DIR-RT datasets by using the same set-up as shown in Table 1 with $\varrho =1.25$
and
$\varrho =1.25$
and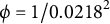 $\phi =1/0.0218^2$
but with different linkage functions. Also, we vary random seeds to generate 10 different datasets under the same settings for two different linkage functions, respectively. We compare the values of
$\phi =1/0.0218^2$
but with different linkage functions. Also, we vary random seeds to generate 10 different datasets under the same settings for two different linkage functions, respectively. We compare the values of $\theta _i$
equal to 1) the posterior median estimates from DIR-RT models; 2) the truth; and 3) zero. We found that the misclassification rates for the
$\theta _i$
equal to 1) the posterior median estimates from DIR-RT models; 2) the truth; and 3) zero. We found that the misclassification rates for the $\mathrm {DIC}_P$
over 1) and 2) are the same for 10 random trials (
$\mathrm {DIC}_P$
over 1) and 2) are the same for 10 random trials ( $<10\%$
), but have much higher misclassification rates when we pick up an extreme wrong values, i.e., zero vector for
$<10\%$
), but have much higher misclassification rates when we pick up an extreme wrong values, i.e., zero vector for $\theta _i$
. Thus, in general, with well-estimated
$\theta _i$
. Thus, in general, with well-estimated $\theta _i$
, the proposed
$\theta _i$
, the proposed $\mathrm {DIC}_P$
should work well if the response time is assumed to be independent of the item response when given one’s ability.
$\mathrm {DIC}_P$
should work well if the response time is assumed to be independent of the item response when given one’s ability.
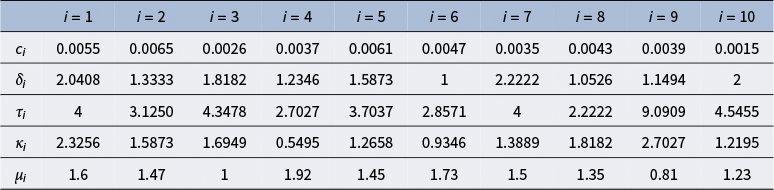
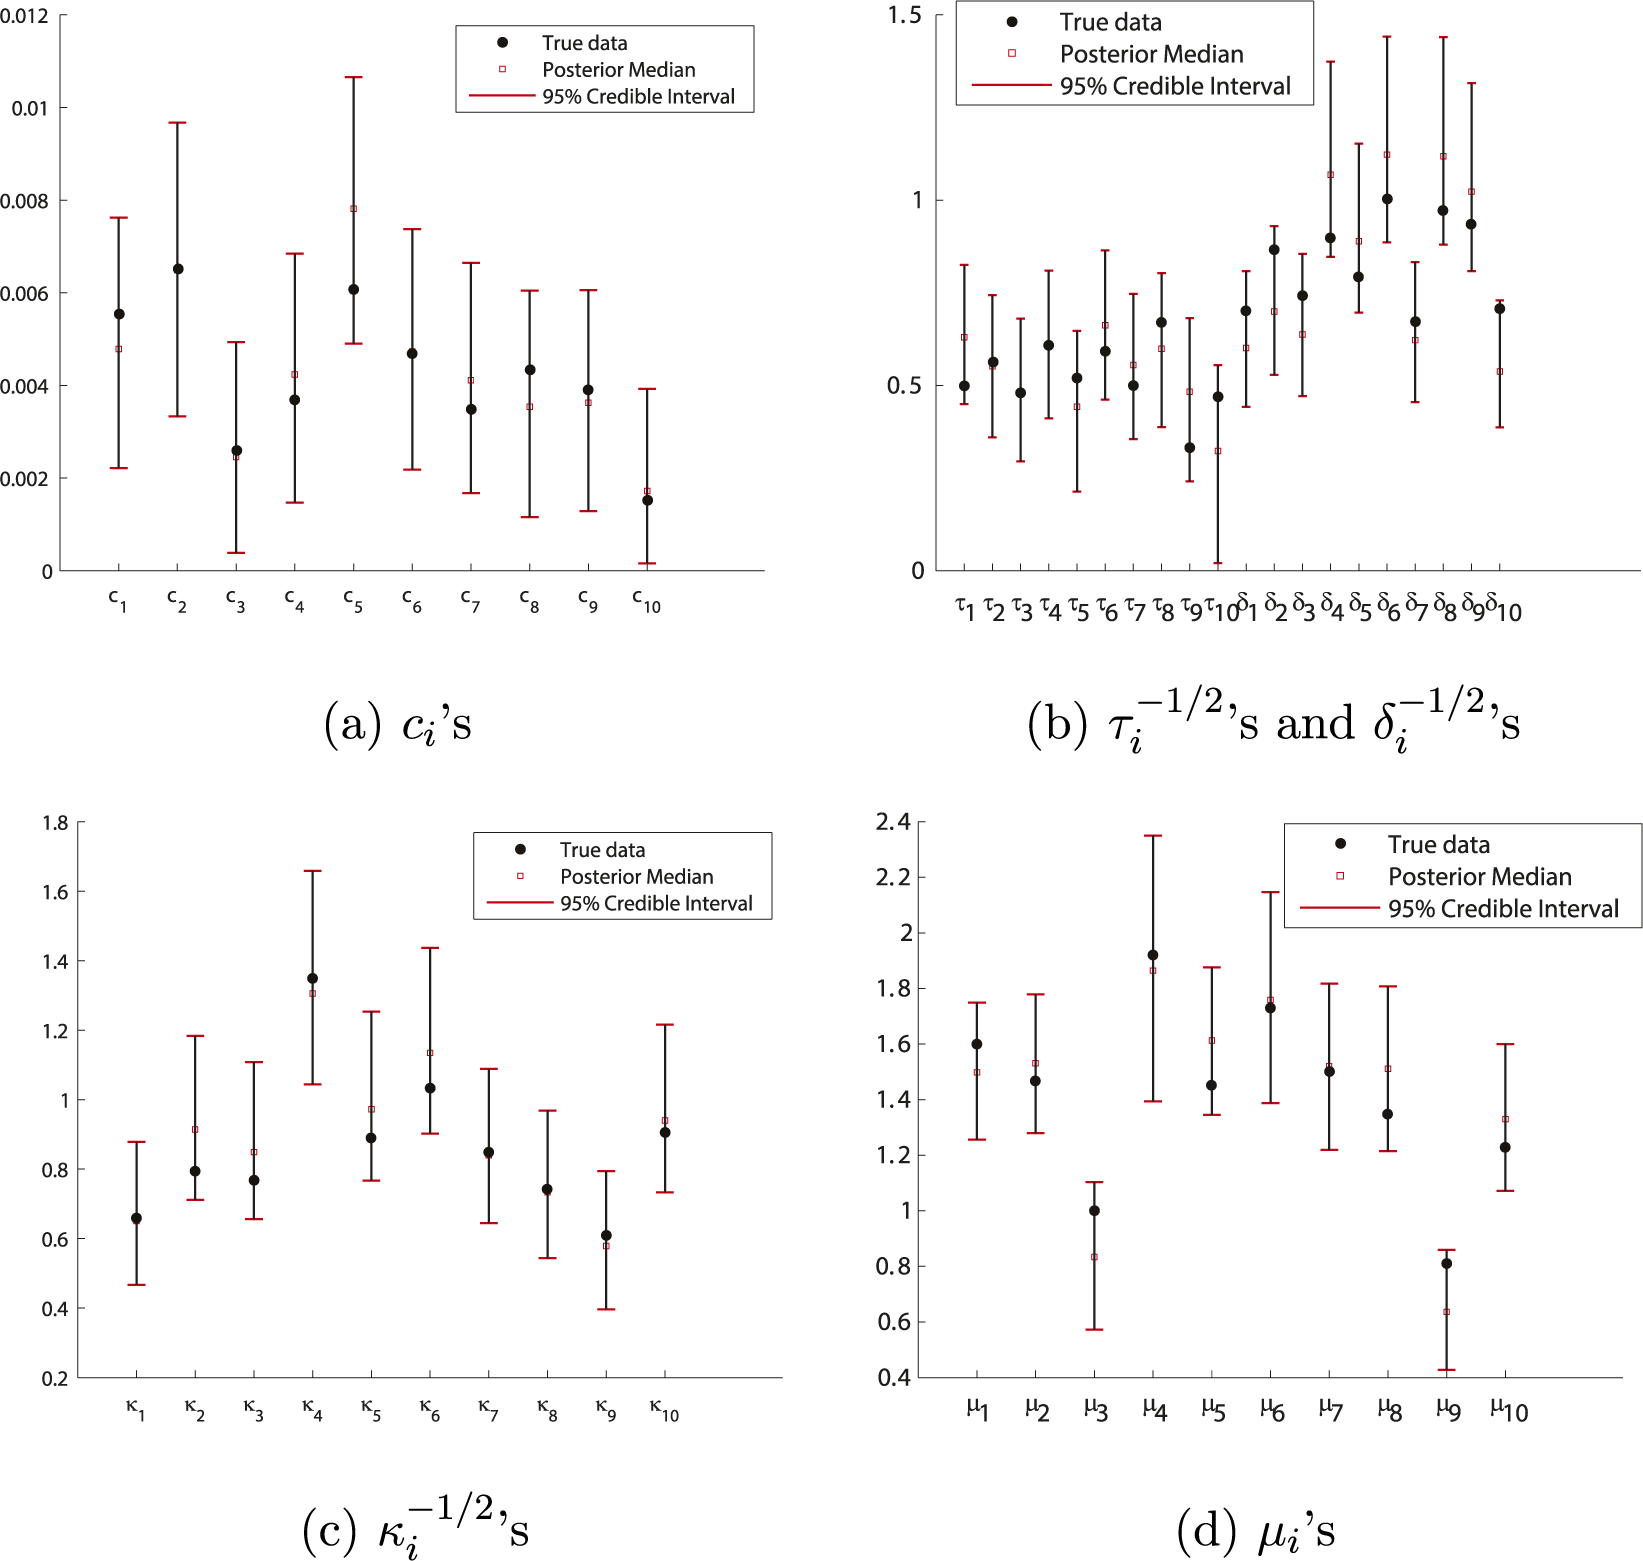


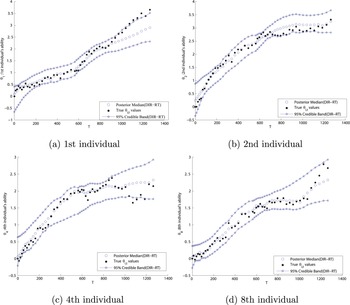
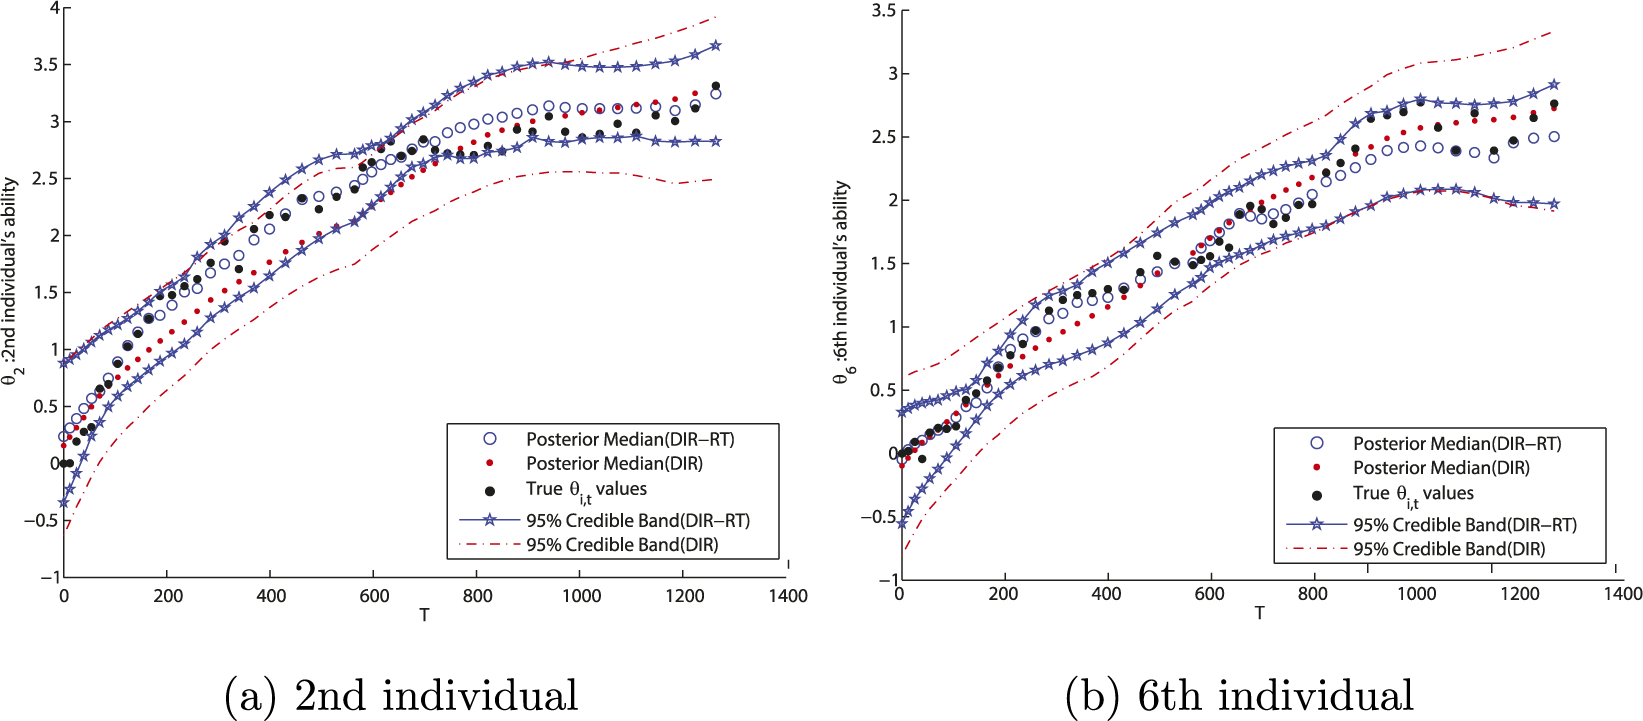

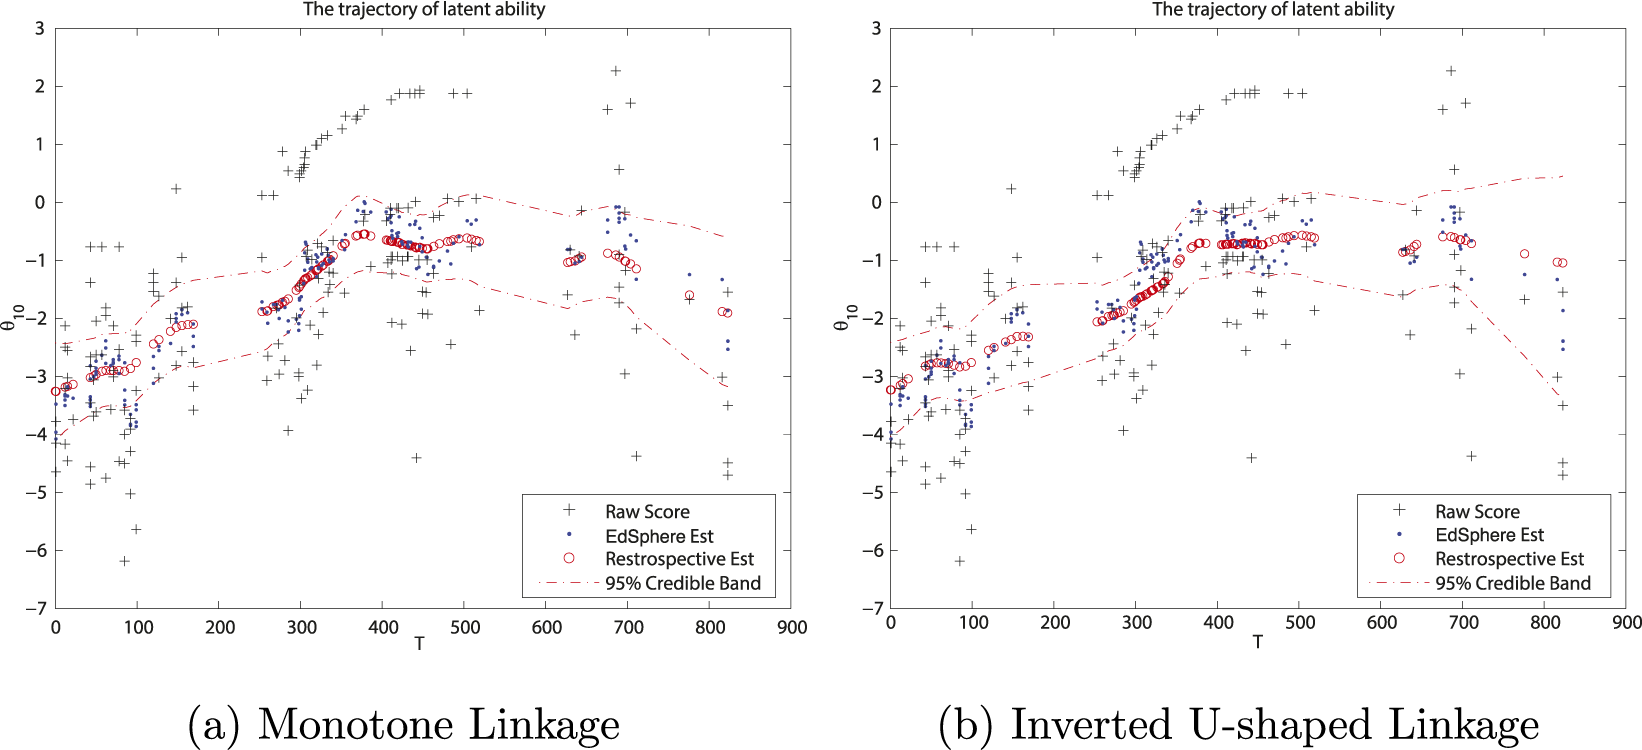
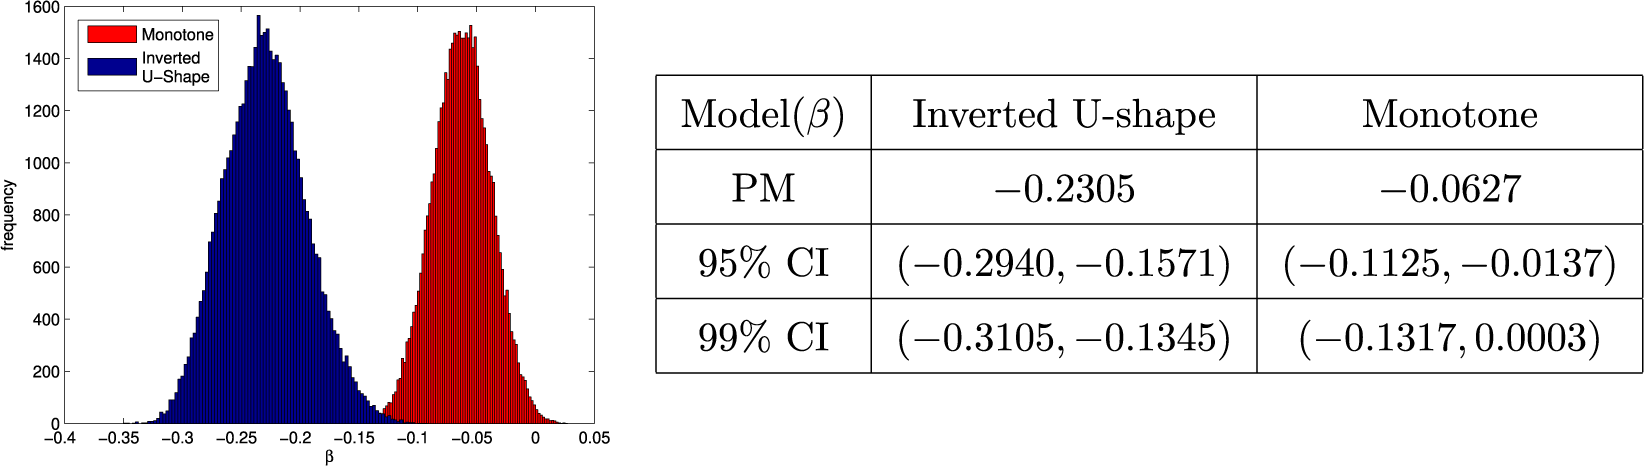

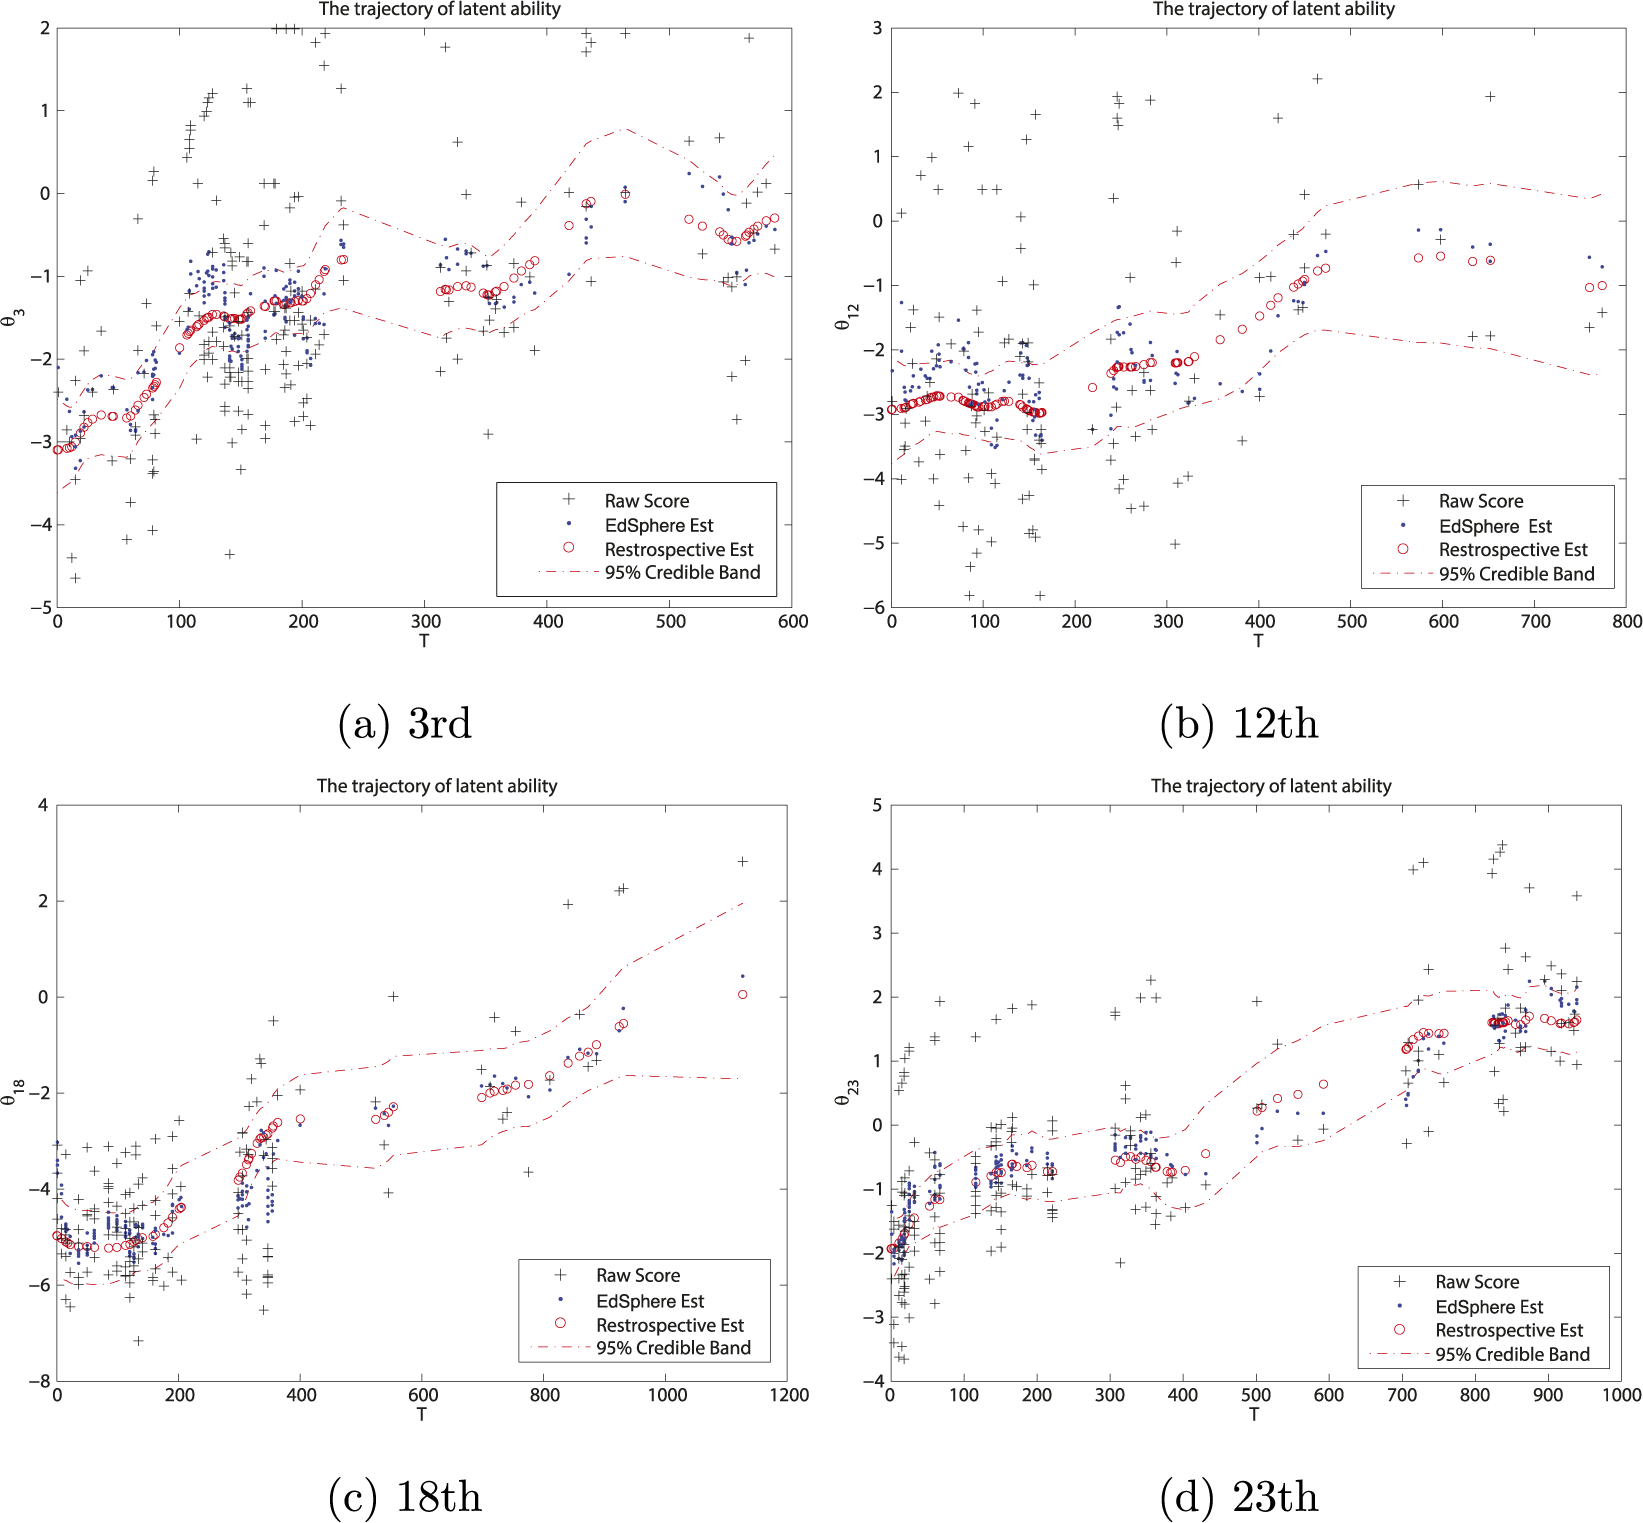


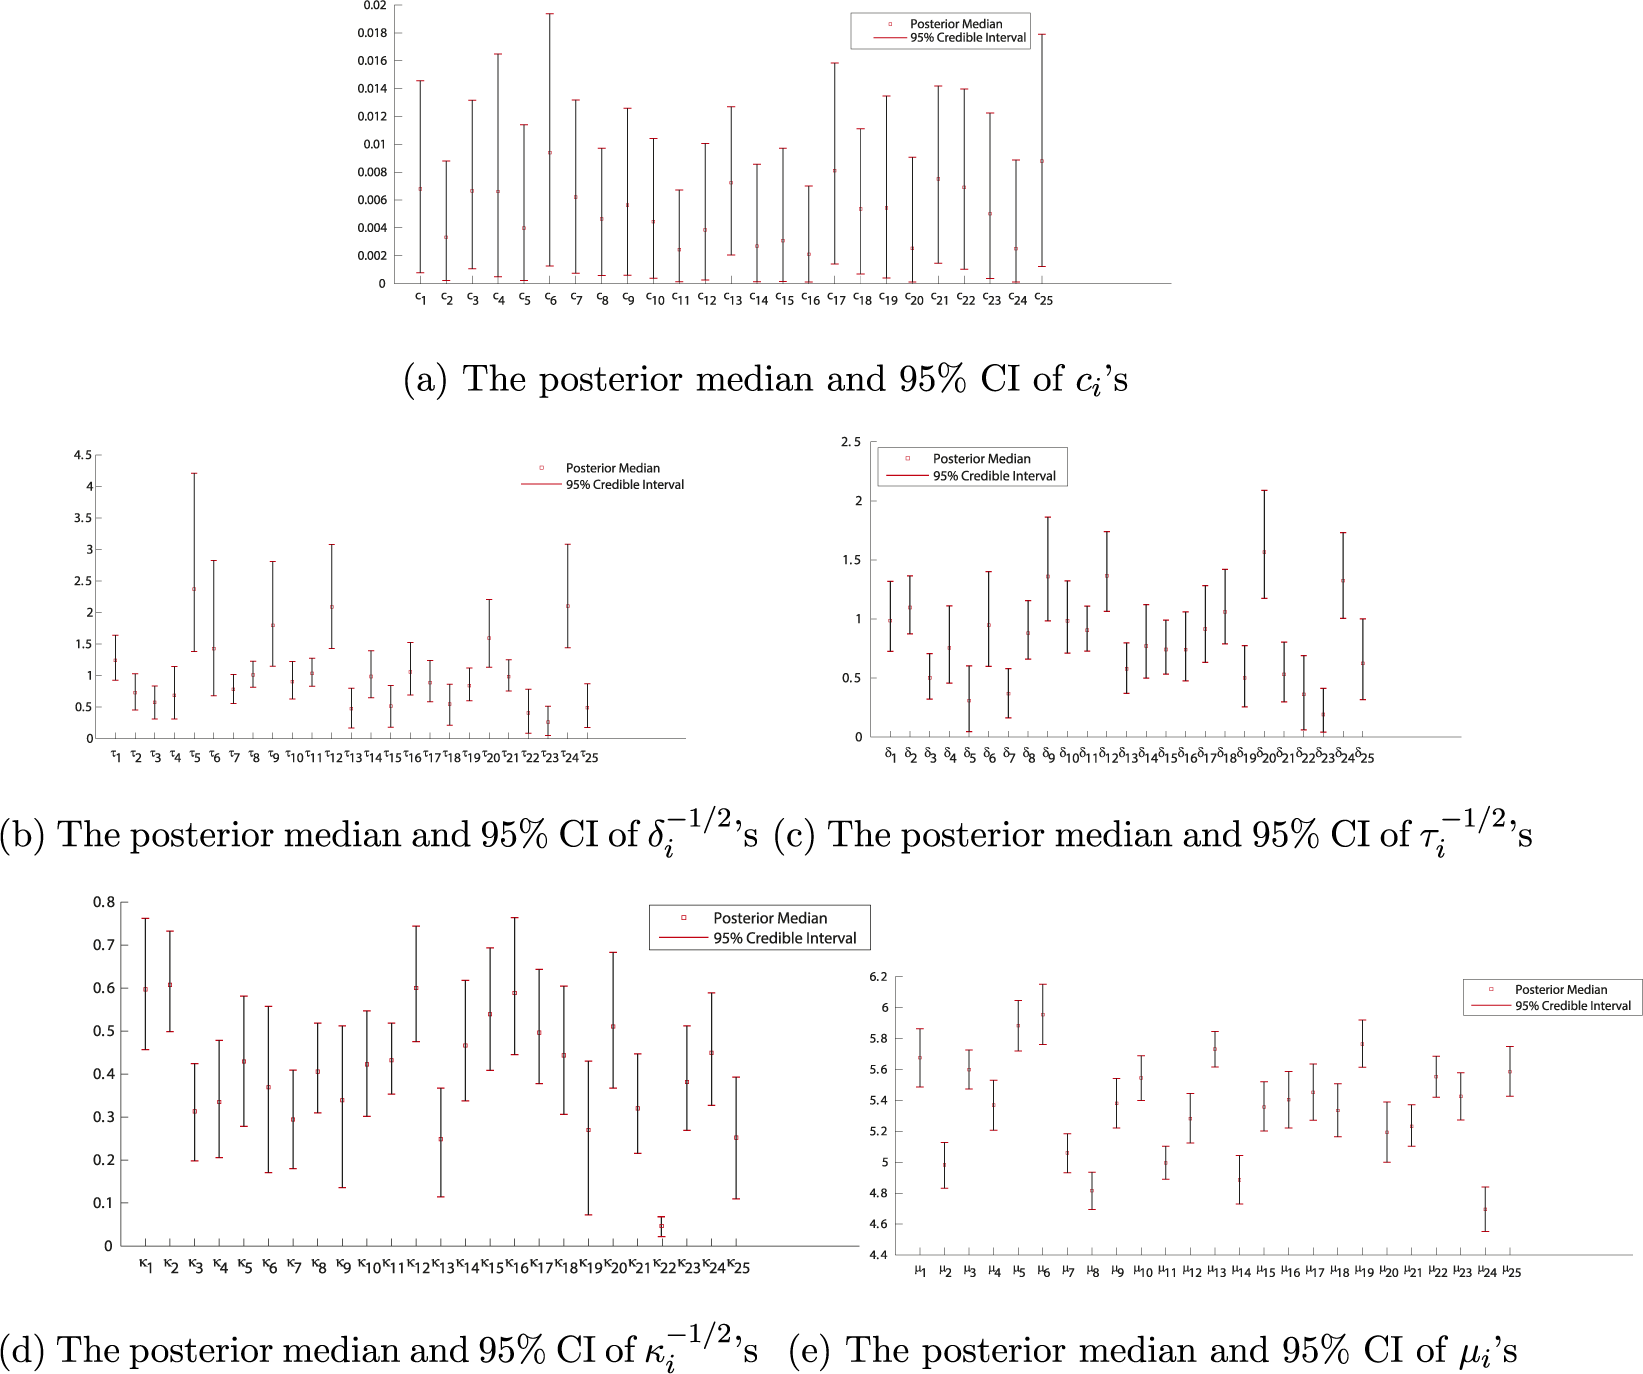


 Open access

