


Assessing the risk of metabolic disorders using dairy herd improvement (DHI) data strikes a practical balance between accuracy and the time/cost involved, making it a feasible approach for ongoing large-scale monitoring of animal health status. This risk assessment also creates an opportunity for planning interventions (Warner et al., Reference Warner, Vasseur, Villettaz Robichaud, Adam, Pellerin, Lefebvre and Lacroix2020). Poor dietary management during the transition period (from gestation to lactation), can leave a lactating cow unable to meet rising energy demands through feed intake. This results in excessive mobilization of adipose reserves to address glucose shortage, leading to increased synthesis of ketone bodies: acetone (ACE, and in milk mACE), acetoacetate, and β-hydroxybutyrate (BHB, and in milk mBHB). This, in turn, can cause clinical (CK) and sub-clinical ketosis (SCK) and has detrimental effects on cow health and performance (Ruoff et al., Reference Ruoff, Borchardt and Heuwieser2017). Early onset of SCK significantly hampers productive, reproductive efficiency, and welfare (EFSA, 2009). Cows developing SCK in the first week of lactation exhibit lower milk yield compared to those affected in the second week (Rodriguez et al., Reference Rodriguez, Shepley, Endres, Cramer and Caixeta2022), with a daily mean difference of −3.7 kg. Therefore, predicting cows at risk of SCK is crucial.
The fat-to-protein (F-to-P) ratio is commonly proposed as a diagnostic test because SCK is known to increase milk fat percentage and decrease protein percentage (Duffield et al., Reference Duffield, Kelton, Leslie, Lissemore and Lumsden1997). This approach has a sensitivity (Se) of about 58% and specificity (Sp) of 69%. Achieving a more precise prediction involves setting an early threshold for milk ketone body concentration. The correlation between blood BHB and F-to-P is low (r = 0.17; Denis-Robichaud et al., Reference Denis-Robichaud, Dubuc, Lefebvre and DesCôteaux2014). Therefore, a more effective approach in detecting early signs of SCK through milk analysis is to use a combined index incorporating mACE and mBHB. de Roos et al. (Reference de Roos, van den Bijgaart, Hørlyk and de Jong2007) recommended threshold values for SCK of ≥ 0.10 mmol/L for mBHB and ≥ 0.15 mmol/L for mACE, and a more pronounced increase in mACE than mBHB has been reported in the week before ketosis diagnosis by Caldeira et al. (Reference Caldeira, Dan, Neuheuser, Stürmlin, Weber, Glauser, Stierli, Schuler, Moll, Wegmann, Bruckmaier and Gross2020). Along these lines, there has been recent consideration of a potential composite index that incorporates both mACE and mBHB (Kowalski et al., Reference Kowalski, Sabatowicz, Barć, Jagusiak, Młocek, Van Saun and Dechow2021, 2023). Fourier-transform infrared spectroscopy (FTIR) calibration for mACE and mBHB may provide a further opportunity to improve accuracy of estimating early SCK risk (Grelet et al., Reference Grelet, Bastin, Gelé, Davière, Johan, Werner, Reding, Fernandez Pierna, Colinet, Dardenne, Gengler, Soyeurt and Dehareng2016; Reference Grelet, Dardenne, Soyeurt, Fernandez, Vanlierde, Stevens, Gengler and Dehareng2021).
This study sought to determine thresholds for mACE and mBHB to predict a decline in milk yield as an early indicator of sub-clinical ketosis (SCK) within the first 15 days in milk (DIM). Subsequently, these thresholds were utilized to detect SCK within the initial 60 DIM,evaluating its prevalence across herds of different sizes (indicative of farm structural dimension) and average milk yield (indicative of herd nutritional management).
Materials and methods
Data source
No animal welfare and use committee approval was required for this study, since the data sets were obtained from official routine animal performance recording (DHI) conducted by the Italian Breeders Association (AIA, Rome, Italy). Three years of official test day (TD) data (2017 n = 3,784,407; 2018 n = 3,744,200; 2019 n = 3,799,352) recorded on 580,688, 587,707 and 582,776 lactations, respectively, for these three years were used. Data included animal ID, herd, daily milk yield (kg/d), parity, DIM, linear score for somatic cell count, fat percentage, protein percentage, lactose percentage, mACE and mBHB. The study focused on observations between 5 and 60 DIM only. TD records with fat < 1.5% or > 9.0% and protein < 1.0% or > 7.0% were purged.
Statistical analysis
Data were handled and analyzed using R (R Core Team, 2020, version 3.6.3, 2020, The R Foundation for Statistical Computing, Vienna, Austria), with the following packages: sqldf v.0.4-11, readr v.2.1.1; lubridate v.1.8.0; rcmdr v.2.7-2, lme4 v.1.1-27.1; vcd v.1.4-8 (https://cran.r-project.org/). Data analysis followed a two-step process on separate animal groups. Initially, we determined mACE and mBHB concentration thresholds linked to a notable decrease in milk yield, indicating SCK risk. Using Tatone et al.’s (Reference Tatone, Duffield, LeBlanc, DeVries and Gordon2017) method, we examined dichotomous variables for mACE and mBHB in a cohort of 241,399 cows within 15 DIM out of 264,220. The variable values, selected to correspond with concentrations leading to a noteworthy reduction in milk yield, ranged from 0.02 to 0.22 mmol/L. The testing encompassed a general mixed linear model as outlined below:
PRODijk = μ + yeari + monthpj + parityk + DIM + LS + FAT + PRO + LAC + dummy + herd + ε
where: PRODijk = milk yield in kg/day; μ = fixed intercept effect; yeari = ith year of sampling, fixed factor (2017, 2018, 2019); monthpj = fixed factor, jth month of delivery (1, .., 12); parityk = fixed factor, kth lactation order (1, 2, 3); DIM = covariate, days of lactation; LS = covariate, Linear Score SCC; FAT = covariate, milk fat content (%); PRO = covariate, milk protein content (%); LAC = covariate, milk lactose content (%); dichotomous variable = RBHB.02,…, RBHB.20; RACE.02,…, RACE.20 (the variable was set to “0” if the value was under the threshold, or “1” if the value was above the threshold); herd = random factor, ε = common random error.
The threshold for SCK for each milk metabolite was established considering the concentration associated to a significant negative effect on milk yield (P < 0.05). The relationships between SCK and milk yield reduction were tested at 15 DIM, selected for its highest reported prevalence of SCK (Duffield et al., Reference Duffield, Sandals, Leslie, Lissemore, McBride, Lumsden, Dick and Bagg1998). Using these thresholds, each day's samples for a specific lactation phase were classified as non-ketolactia (NKL; both metabolites below the threshold) or hyper-ketolactia (PKL; at least one, either mACE or mBHB, above the threshold). The mACE, mBHB and mACE/mBHB thresholds were compared with the established F to P ratio threshold for SCK of ≥ 1.4 (AIA; Tondo, Reference Tondo2014). To assess the differences between parities in F to P, mACE and mBHB, analysis of variance was performed according to the following model:
 \begin{equation*}
{\rm y}_{\rm {ijk}}\,=\,{\mu}\,+\,\text{parity}_{\rm{i}}\,+\,\text{DIM}_{\rm {j}}\,+\,\text{(parity}*\text{DIM)}_{\rm{ij}}\,+\,\text{cow}_{\rm{k}}\,+\,\varepsilon
\end{equation*}
\begin{equation*}
{\rm y}_{\rm {ijk}}\,=\,{\mu}\,+\,\text{parity}_{\rm{i}}\,+\,\text{DIM}_{\rm {j}}\,+\,\text{(parity}*\text{DIM)}_{\rm{ij}}\,+\,\text{cow}_{\rm{k}}\,+\,\varepsilon
\end{equation*}where: yijk = values of F to P, mACE, and mBHB in milk; μ = fixed intercept effect; parityi = fixed factor, ith lactation order (1, 2, 3 or higher); DIMj = covariate, days of lactation; (parity*DIM)ij = interaction between parity and DIM main fixed effects; cowk = random effect of the kth cow; ε = common random error.
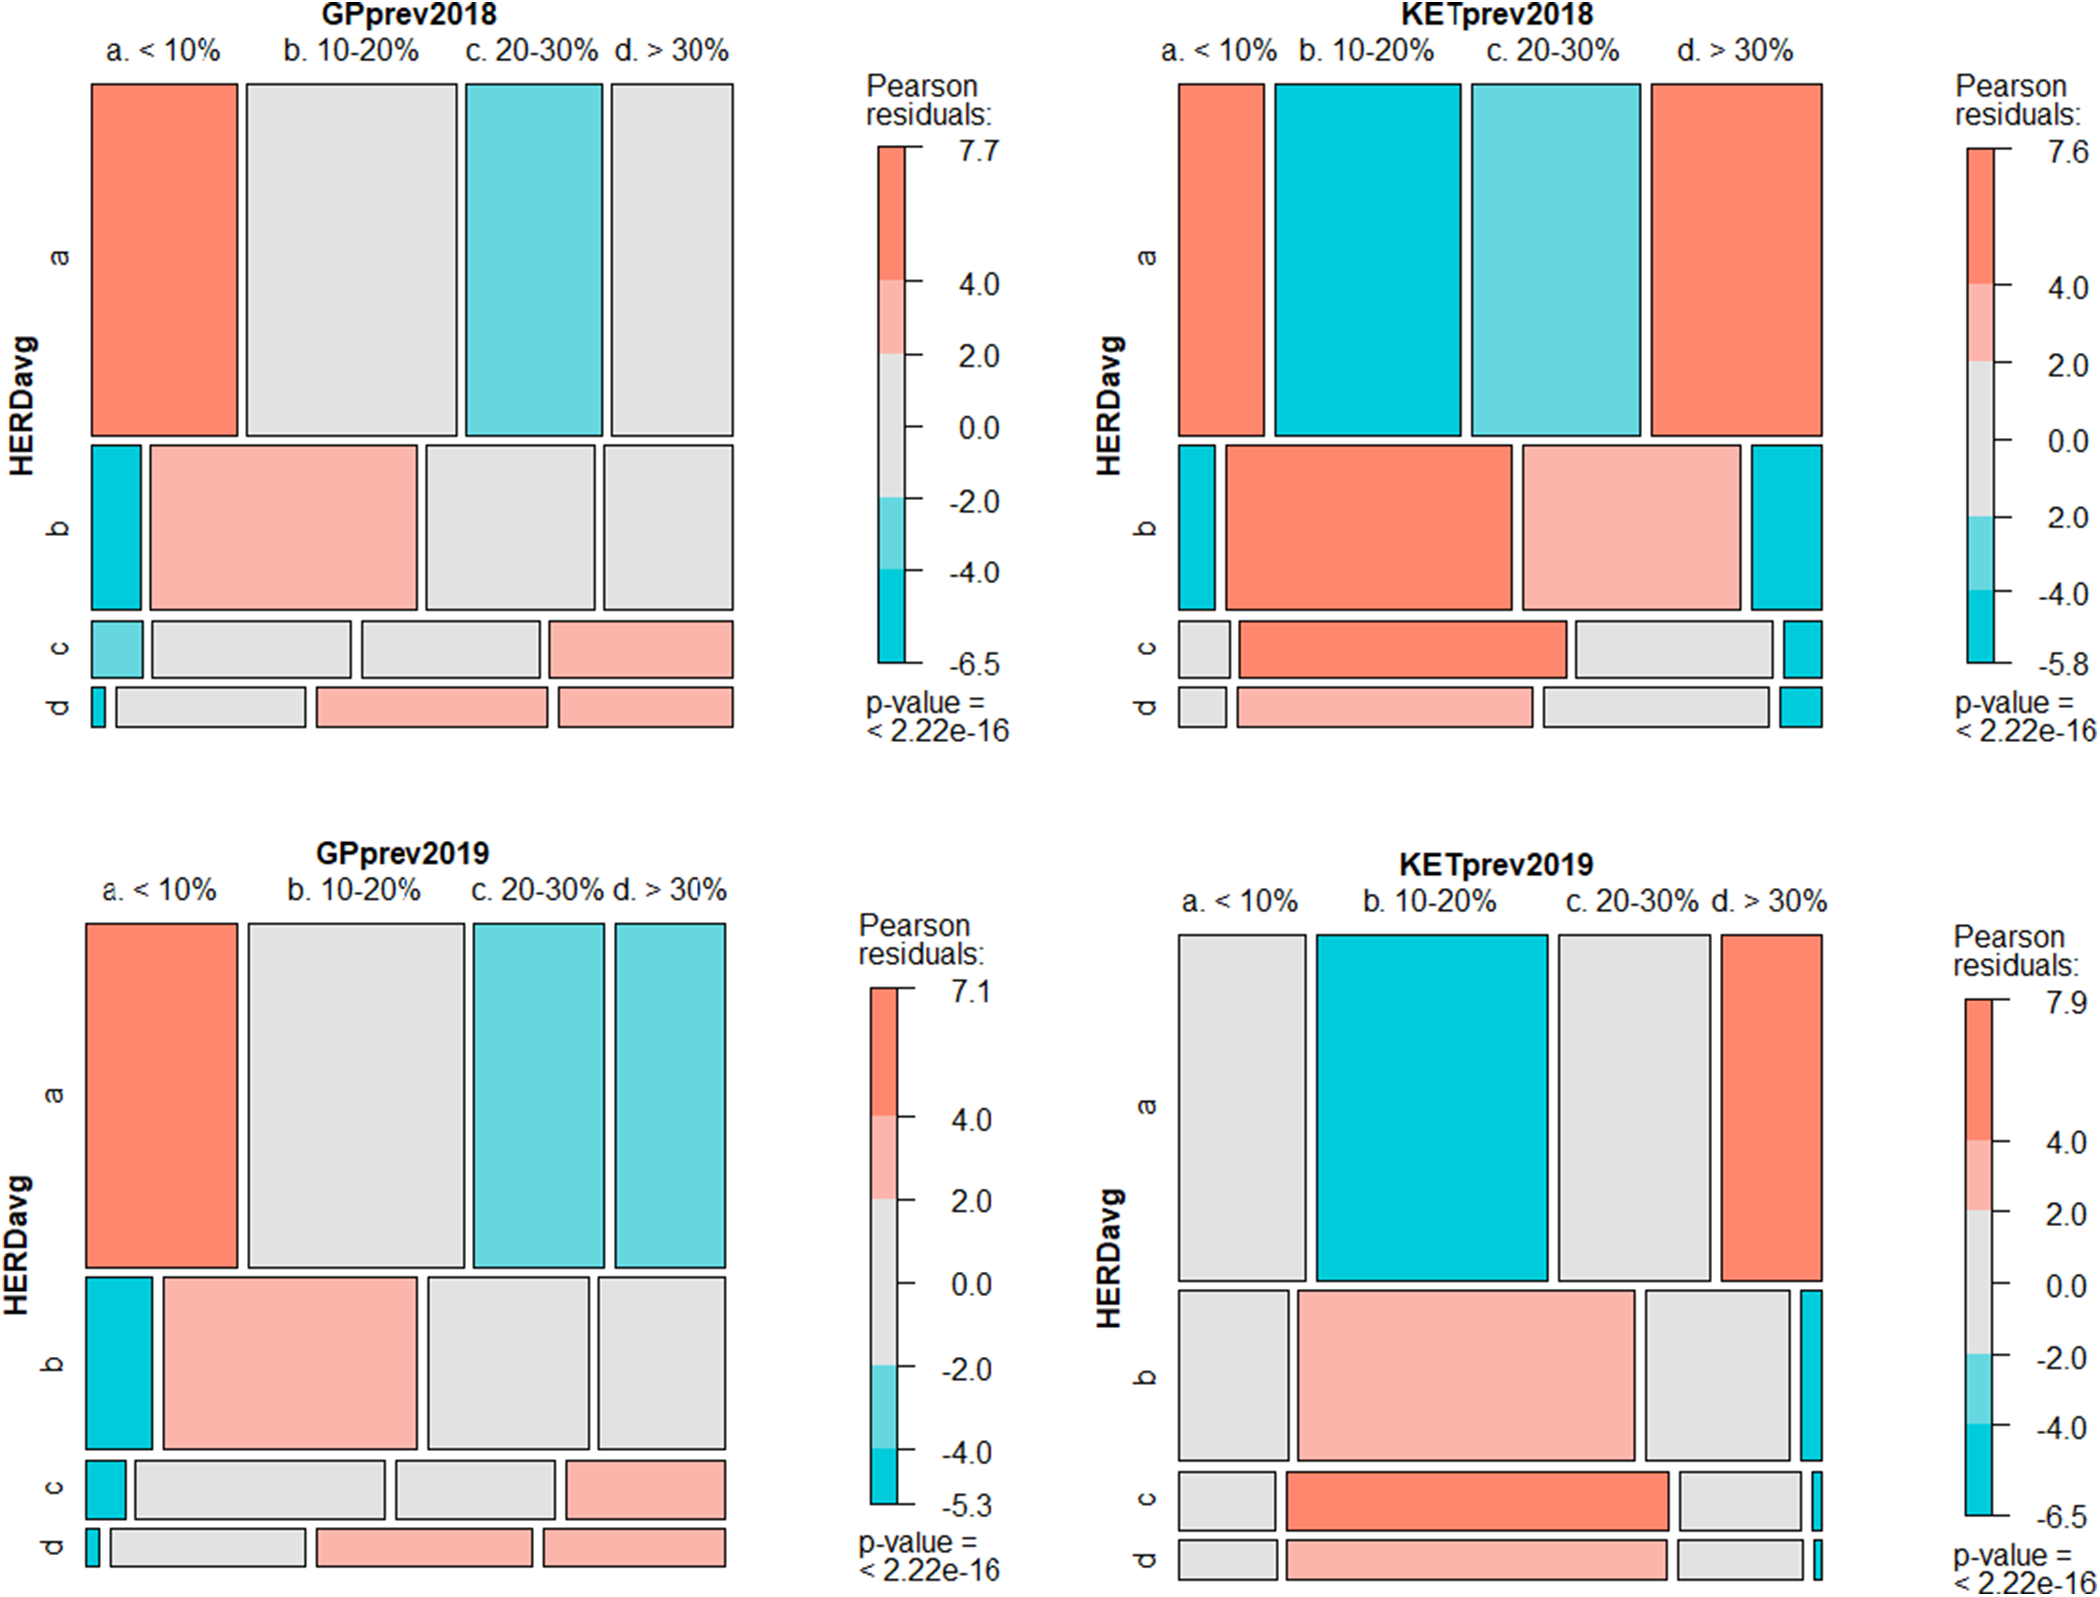
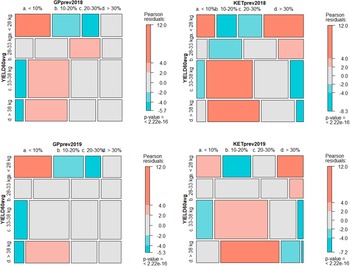
In the second step, we compared the SCK risk distribution across herds using the combined mACE and mBHB thresholds obtained in Step 1 and the F to P ratio ≥ 1.4 in cows within 60 DIM. The cohort included 585,003 and 586,427 test day records for 2018 and 2019, respectively. Herd size was defined in four classes according to the number of lactating cows, as: < 100 (A); 101 to 200 (B); 201 to 300 (C) and > 301 (D). Milk yield level was also defined in four classes, according to the mean 60 DIM daily performance (≤28, > 28 and ≤ 33, > 33 and ≤ 38 and finally > 38 kg/cow/d). Each herd within each year was then classified for the SCK prevalence: < 10.0% (a), 10 to 20% (b), 20 to 30.0% (c) and > 30% (d). Herd size and milk yield classes were matched with SCK prevalence within each year, forming contingency tables. A chi-square test analyzed observed (nij) versus expected (fij) frequencies, testing independence. Quinn and Keough's (Reference Quinn and Keough2002) method estimated the differences (nij - fij), and these were standardized using Pearson standardized residuals:
 \begin{equation*}
(n_{ij}\,-\,f_{ij})/\sqrt(f_{ij}).
\end{equation*}
\begin{equation*}
(n_{ij}\,-\,f_{ij})/\sqrt(f_{ij}).
\end{equation*}Standardized residuals, directly comparable regardless of frequencies, indicated differences in farm frequency distribution for SCK. Mosaic plots (Meyer et al., Reference Meyer, Zeileis and Hornik2006) illustrated these differences, with red cells denoting higher-than-expected and blue cells lower-than-expected herd frequencies.
Results and discussion
Threshold identification
The lowest concentration significantly affecting milk yield in our dataset (more than 11 million TD recorded on more than 580,000 cows) was 0.10 mmol/L for mACE and 0.14 mmol/L for mBHB. Within 15 DIM, the reduction in milk yield at each milking related to mACE ≥ 0.10 mmol L−1 was 0.149 kg and the reduction related to mBHB ≥ 0.14 mmol L−1 was estimated as 0.084 kg/milking At 30 DIM, the threshold for mACE was 0.06 mmol L−1 with an estimated milk yield reduction of 0.626 kg/milking, and for mBHB the threshold was 0.10 mmol L−1, which was associated with a reduction of 0.169 kg/milking. Therefore, the estimated milk yield loss is greater within 30 DIM that in 15 DIM which is presumably associated with the shape of the milk curve. However, SCK detected within the first week of lactation can have a more detrimental effect on the cow physiology and welfare (Rodriguez et al., Reference Rodriguez, Shepley, Endres, Cramer and Caixeta2022).
Our mACE threshold concentration also fell within the range of 0.7-1.4 mmol/l reported by Gustafsson and Emanuelson (Reference Gustafsson and Emanuelson1996). The mBHB threshold we found is similar to the optimal cutoff point that Renaud et al. (Reference Renaud, Kelton and Duffield2019) found in a sample of 316 Canadian Holstein with a sensitivity of 81% and a specificity of 92%. de Roos et al. (Reference de Roos, van den Bijgaart, Hørlyk and de Jong2007) recommended slightly different threshold values of ≥ 0.15 mmol/L for mACE and ≥ 0.10 mmol/L for mBHB. In our study, Pearson's correlation between mACE and mBHB was 0.51 (P < 0.001, Supplementary Figure 1), and between the two metabolites and F-to-P ratio was 0.35 and 0.23 respectively (both P < 0.001). This latter value is considerably lower than the 0.52 reported for primiparous cows (Koeck et al., Reference Koeck, Jamrozik, Schenkel, Moore, Lefebvre, Kelton and Miglior2014). We found a positive association between mACE and mBHB concentrations and a negative association between these metabolites and milk yield (Supplementary Figure 2). A significant decline in milk yield correlated with the concentration of mBHB has been reported previously (Klein et al., Reference Klein, Scheper, May and König2020).
The ANOVA performed on F-to-P, mACE, mBHB and mACE/mBHB ratio resulted in a highly significant effect of parity, DIM and their interaction for all the dependent variables. Least squares mean values and their standard errors are reported in Table 1 for the three parity classes. These results confirm that mBHB level increases according to parity (Van Soest et al., Reference Van Soest, Matson, Santschi, Duffield, Steele, Orsel, Pajor, Penner, Mutsvangwa and DeVries2024), third or higher parity cows having higher values than those in their second lactation. A different patten was seen for mACE as well as for the mACE/mBHB ratio, where primiparous cows exhibited the highest values and second lactation cows the lowest. The weight of parity effect is associated with an increased impact of cow-level factors throughout the productive life of the animal, while herd-level factors are more suitable to describe the general management effect of the farm (Van Soest et al., Reference Van Soest, Matson, Santschi, Duffield, Steele, Orsel, Pajor, Penner, Mutsvangwa and DeVries2024).
Least square means (standard error) for the dependent variables in milk within 60 DIM in 2018 and 2019

a,b,c = values with different superscript differ for P < 0.0001.
The very low number of studies on mACE does not allow us to compare this result with literature values. It is well known that primiparous cows have fewer SCK problems than multiparous. Recently, Van Soest et al. (Reference Van Soest, Matson, Santschi, Duffield, Steele, Orsel, Pajor, Penner, Mutsvangwa and DeVries2024) reported a 54% lower within-herd hyperketolactia (HKL) prevalence in primiparous than in multiparous cows. Kowalski et al. (Reference Kowalski, Sabatowicz, Van Saun, Młocek, Jagusiak, Spanghero and Dechow2023) noted that the lowest proportion of HKL cows was found for second lactation cows, with a lack of linear effect of increasing parity on increasing prevalence of HKL. This lower susceptibility to HKL in second parity cows indirectly agrees with our observations of lower mACE and mBHB in the first 60 DIM in our second lactations.
We are not aware of any possible relationship between the higher mACE level in primiparous (namely very early post-partum) and the results evidenced by Tatone et al. (Reference Tatone, Duffield, LeBlanc, DeVries and Gordon2017) who evidenced a different peaking time in HKL between primiparous (5 DIM) and pluriparous (11-12 DIM). We observed a decline in mBHB, falling below 0.04 mmol/L just after 30 DIM. This differs from data in Koeck et al. (Reference Koeck, Jamrozik, Schenkel, Moore, Lefebvre, Kelton and Miglior2014) who reported mBHB levels that remained above 0.06 mmol/L during the initial 100 DIM. A more in-depth analysis of the differences between primiparous and multiparous cows for the SCK indicators is necessary.
Our results indicate that the candidate indicators of SCK, including F-to-P, mACE, mBHB, and the mACE/mBHB ratio, exhibit distinct patterns during the initial 60 DIM based on cow parity (Figure 1). Values for mACE, mBHB and their ratio consistently exhibited a negative trend in time for all cow parities, whereas the F-to-P distribution for parity 1 and 3 resembled a right-skewed gamma distribution. Interestingly, cows of parity two displayed the lowest levels of mACE, F-to-P and the mACE/mBHB ratio. In contrast, primiparous cows demonstrated a decline in all indicators during the initial 20 DIM. A composite index for SCK classification should incorporate at least one of the milk ketone body values (mACE or mBHB). It is important to highlight that the mACE level is more effective in detecting early-stage SCK, while the mBHB level is better suited for identifying later-stage SCK.
Milk fat to protein ratio, milk acetone, milk BHB, and milk acetone to BHB ratio estimated means of each variable during the first 60 days in milk (DIM) according to the parity (1 = parity 1; 2 = parity 2; 3 = parity 3 or higher). The shaded areas represent the confidence interval at 99%.

Impact of changed criteria for SCK identification on farm classification
We evaluated the prevalence of SCK at farm level utilizing mACE and mBHB data extracted from DHI test day records in extensive populations. The collected information was employed for assessing metabolic health risks during the transition phase. By comparing prevalence determined by revised thresholds for mBHB and mACE in SCK diagnoses, we analyzed variations across herd size and productivity, contrasting these findings with estimates derived from the milk F-to-P ratio. The differences in the residual distribution between the two systems within year indicate a different evaluation of farm distribution, even with small differences between years within method. This preliminary result suggests us to continue in this analysis for the successive years to better understand the consistence in time of these classification methods.
The overall prevalence of SCK in our large dataset was 23.8% by F to P, 7.6% by mBHB and 20.7% by the combined mBHB and mACE threshold in 2017, 24.5, 6.1 and 20.0% in 2018 and 24.3, 5.5 and 16.1, respectively, in 2019. On a sample of 66 herds and 5,884 cows in Italy, Suthar et al. (Reference Suthar, Canelas-Raposo, Deniz and Heuwieser2013) reported a prevalence of 36.6% of SCK between 2 to 15 DIM, defined by plasma concentrations of BHB ≥ 1.2 to 1.4 mmol/L, measured by a handheld meter. In 528 herds across 10 European countries, Italy had the highest incidence of SCK (Suthar et al., Reference Suthar, Canelas-Raposo, Deniz and Heuwieser2013). An average prevalence of SCK of 20% was found in a Canadian Holstein population in 1998 (Duffield et al., Reference Duffield, Sandals, Leslie, Lissemore, McBride, Lumsden, Dick and Bagg1998).
Given the extended impact of high fat mobilization beyond 30 days and the regular DHI data availability for most cows, it is reasonable to extrapolate SCK incidence for both individual cows and herd management during the post-partum transition. Our findings indicate that mACE and mBHB, when used in tandem, display a unique postpartum pattern, with mACE peaking in the first week and mBHB in the second week. The inclusion of both mACE and mBHB provides a more accurate estimate of SCK prevalence at the herd level.
We compared SCK prevalence distributions using the F-to-P ratio with thresholds for mBHB and mACE established in this study for the 60 DIM cohort in 2018 and 2019 (Supplementary Figures 3 and 4). Prevalence was assessed for different farm sizes (Supplementary Figure 3) and 60 DIM milk yield classes (Supplementary). The mACE-mBHB index revealed higher SCK prevalence in larger herds and in those with higher milk yield, in contrast to the F-to-P ratio. Small herds had above 30% SCK prevalence using the F-to-P ratio (Figure 2). When evaluating prevalence in relation to the mean daily milk yield within the initial 60 DIM using the F-to-P ratio (Figure 3), no significant differences were observed.
Mosaic plot visualizing the prevalence distribution of farm classified according to prevalence and herd size (herdavg) with four classes (<100 = a, 101 to 200 = b, 201 to 300 = c, and >300 = d) in the two consecutive years (2018 and 2019) for fat to protein ratio (gpprev2018 and gpprev2019) or for the combined index with milk acetone and milk BHB (ketprev2018 and ketprev2019). color intensity is proportional to Pearson residuals; blu related to the lower than expected frequency and the red elated to higher than expected frequency.
Mosaic plot visualizing the prevalence distribution of farm classified according to prevalence and average yield up to 60 DIM (yield60avg) in the two consecutive years (2018 and 2019) for fat to protein ratio (gpprev2018 and gpprev2019) or for the combined index with milk acetone and milk BHB (ketprev2018 and ketprev2019). color intensity is proportional to Pearson residuals; blu related to the lower than expected frequency and the red elated to higher than expected frequency.

The incidence of SCK is related to negative energy balance management linked to parity (Ospina et al., Reference Ospina, Nydam, Stokol and Overton2010). Here we observe that the prevalence is also influenced by herd size and risk classes. Stengärde et al. (Reference Stengärde, Hultgren, Tråvén, Holtenius and Emanuelson2012) reported a positive correlation between herd size and SCK incidence in Sweden, while in Norway, Vanholder et al. (Reference Vanholder, Papen, Bemers, Vertenten and Berge2015) found the opposite. Smaller farms experienced a higher incidence of SCK, a phenomenon attributed by the authors to a conventional feeding approach employing a single diet. This practice frequently led to overfeeding during the last third of lactation, causing cows to enter the dry period in an over-conditioned state and facing an elevated risk of SCK and CK at the beginning of the subsequent lactation (Vanholder et al., Reference Vanholder, Papen, Bemers, Vertenten and Berge2015).
Dairy farm facilities and management impact metabolic health in early lactation (Couto Serrenho et al., Reference Couto Serrenho, Church, McGee and Duffield2023). Effective management, commonly observed in herds with higher milk yields is associated with lower occurrence of metabolic disorders and reduced SCK at the beginning of lactation. In our study, herds with the lowest daily average 60 DIM yield exhibited a higher-than-expected SCK prevalence, while more productive herds demonstrated a lower-than-expected prevalence (Figure 3). Nevertheless, highly productive dairy cattle are still susceptible to SCK, underscoring the importance of proficient transition phase management to sustain productivity and minimize milk losses. This involves optimal pre-partum nutritional management, preventing excessively high body condition scores and implementing vigilant practices for early problem detection. Classifying Ontario dairy herds based on average 305 DIM performance revealed lower ketosis (defined by mBHB ≥ 0.15 mmol/L) in primiparous cows in high-performance herds, with the opposite observed in pluriparous cows (Tatone et al., Reference Tatone, Duffield, LeBlanc, DeVries and Gordon2017). This implies that herd average milk yield serves as a proxy for the level of herd management.
In conclusion, we found that mACE and mBHB from DHI predicted SCK prevalence differently than the F-to-P ratio. Using these milk metabolites allows for early estimation of SCK risk during DHI sampling, identifying potential issues in the early phase. In the first days after calving (before 14 DIM), mACE can help to improve the detection of SCK problems. The comparison of herd classification for SCK based on the F-to-P ratio and the joint utilization of mACE and mBHB reveals significant disparities. According to the joint utilization of mACE and mBHB, larger herds exhibited lower prevalence values, implying that a large herd size might enable more effective nutritional management, such as grouping cows according to their requirements. Furthermore, the use of mACE and mBHB, rather than the F-to-P ratio, emerges as a more reliable indicator for guiding nutritional strategies to enhance the 60 DIM performance of the herd and mitigate the risk of SCK. Both findings advocate the use of DHI data for impactful advisory actions.
Supplementary material
The supplementary material for this article can be found at https://doi.org/10.1017/S0022029925000366.
Acknowledgements
This study was carried out within the agreement between Associazione Italiana Allevatori (AIA) and Consiglio per la ricerca in agricoltura e l'analisi dell'economia agraria (CREA), Centro di ricerca Zootecnia e Acquacoltura (Roma; August, 6, 2020). The authors thank Nicoletta Rizzi and Diego Vairani for their work in the lab (directed by Andrea Ferla) of Associazione Regionale Allevatori della Lombardia (ARAL), which allows to process and analyze all the milk samples in DHI program in Lombardia. Special thanks to Prof. John Williams for his precious mother-language revision of the paper.


 Open access