


Introduction
More than 60 countries, including the United States, have developed formal strategies to promote their bioeconomies, with the European Union leading efforts to harmonize cross-country bioeconomy measurements (Kardung et al. Reference Kardung, Cingiz, Costenoble, Delahaye, Heijman, Lovric, van Leeuwen, M’Barek, van Meijl, Piotrowski, Ronzon, Sauer, Verhoog, Verkerk, Vrachioli, Wesseler and Zhu2021; Lier et al. Reference Lier, Aarne, Karkkainen, Korhonen, Yli-Viikari and Packalen2018; Ronzon et al. Reference Ronzon, Piotrowski, M’Barek and Carus2017). However, there is no consensus on a precise definition of the bioeconomy, and regions have developed strategies that reflect their own economic priorities, resource bases, technological capacities, and regulatory approaches to biotechnology (Frisvold et al. Reference Frisvold, Moss, Hodgson and Maxon2021; Gallo Reference Gallo2022).
In the United States, recognition of the bioeconomy as a policy-relevant concept has emerged gradually over time. Federal efforts include the 2000 Biomass Research and Development Act, which coordinated DOE (Department of Energy) and the USDA (Department of Agriculture) biomass R&D, the 2002 Farm Bill’s BioPreferred® Program, and a 2010 OMB-OSTP directive identifying the bioeconomy as a key science and technology priority. Coordinated efforts increased with the 2012 U.S. National Bioeconomy Blueprint, which framed biotechnology as the key driver of the U.S. bioeconomy. The BRDBFootnote 1 released additional strategies for biofuels, bioproducts, and biopower in 2016 and 2019, while Daystar et al. (Reference Daystar, Handfield, Golden and McConnell2018, Reference Daystar, Handfield, Pascual-Gonzalez, McConnell and Golden2020 and Golden et al. (Reference Golden, Handfield, Daystar and McConnell2015)) reported to Congress on the economic impacts of the U.S. biobased products industry. In 2020, the National Academies of Sciences, Engineering, and Medicine (NASEM) estimated the U.S. bioeconomy at $959 billion in 2016 dollars, over a trillion in today’s terms. Executive Order 14081 (2022) launched an initiative to advance biotechnology and biomanufacturing and asked BEA to explore bioeconomy satellite accounts, which BEA declined, citing data limitations. Subsequent studies, including Golden et al. (Reference Golden, Handfield, Daystar and Pires2024), produced narrower estimates of the biobased products industry. In 2025, Executive Order 14236 rescinded EO 14081, pausing coordinated national measurement efforts.
Countries have also pursued policies to promote their circular economies (Cramer Reference Cramer2022; Herrador and Van Reference Herrador and Van2024). While there is no consensus on its definition, it is understood that circular systems aim to minimize the consumption of natural resources and maximize the use of waste and byproduct materials (Loiseau et al. Reference Loiseau, Saikku, Antikainen, Droste, Hansjurgens, Pitkanen, Leskinen, Kuikman and Thomsen2016; Venkatesh Reference Venkatesh2021). Compared with the bioeconomy, U.S. circular economy initiatives have shown less interagency coordination and limited economic analysis.
The U.S. Environmental Protection Agency (EPA) has focused on improving recycling systems and reducing plastic pollution. In 2024, the EPA, USDA, and FDA published a National Strategy for Reducing Food Loss and Waste and Recycling Organics with a goal of “building a more circular economy.” The DOE’s Advanced Materials and Manufacturing Technologies Office issued a Call for Information regarding Challenges and Opportunities of Increasing Materials Circularity in 2023, but, to date, has not reported findings from the effort. EPA developed a waste input–output (WIO) model built on the BEA official U.S. input–output (I–O) tables, focused on nine material categories to identify impacts of recycling on jobs, wages, and taxes. In part, because of the complexity of the exercise, results were reported with a 12-year lag.
Despite policy attention, existing estimates of both the bioeconomy and circular economy remain fragmented and difficult to compare across regions or over time. The efforts to estimate the U.S. bioeconomy have covered only selected subsectors and have relied on inconsistent data. Circular economy assessments, by contrast, have used engineering-oriented approaches that track physical byproducts and waste flows, often through extended I–O accounts focused on processes. As a result, there is no widely accepted, replicable approach for measuring the economic contribution of bioeconomy and circular activities across U.S. regions. This gap is particularly relevant for regional analysis, where policy makers and practitioners require consistent metrics to assess the scale and structure of bioeconomy and circular activity within local economies.
In this study, we present a low-cost, replicable framework for estimating the size and economic contribution of the bioeconomy and circular economy, using Southern Arizona as an illustrative case. The approach relies on I–O modeling and publicly available data at the state and county levels, making it readily applicable to other U.S. regions and suitable for consistent comparison across regions and over time. While I–O models and sectoral mapping are well established, existing U.S. estimates of bio-based and circular activity are often ad hoc, difficult to replicate, and not easily comparable across regions or over time. Presenting a replicable framework for estimating the bioeconomy and circular economy is critical for advancing both research and policy.
Conceptual framework and data
The framework presented here is grounded in existing U.S. statistical systems, particularly the North American Industry Classification System (NAICS). NAICS classifies establishments based on their primary activity and provides a consistent basis for linking employment, wages, and output across data sets. We use NAICS definitions to identify bioeconomy and circular economy activities. While ongoing policy efforts aim to improve NAICS and NAPCSFootnote 2 classifications for emerging bio-based activities, this framework provides an overview of how currently available data can be used consistently despite known classification limitations.
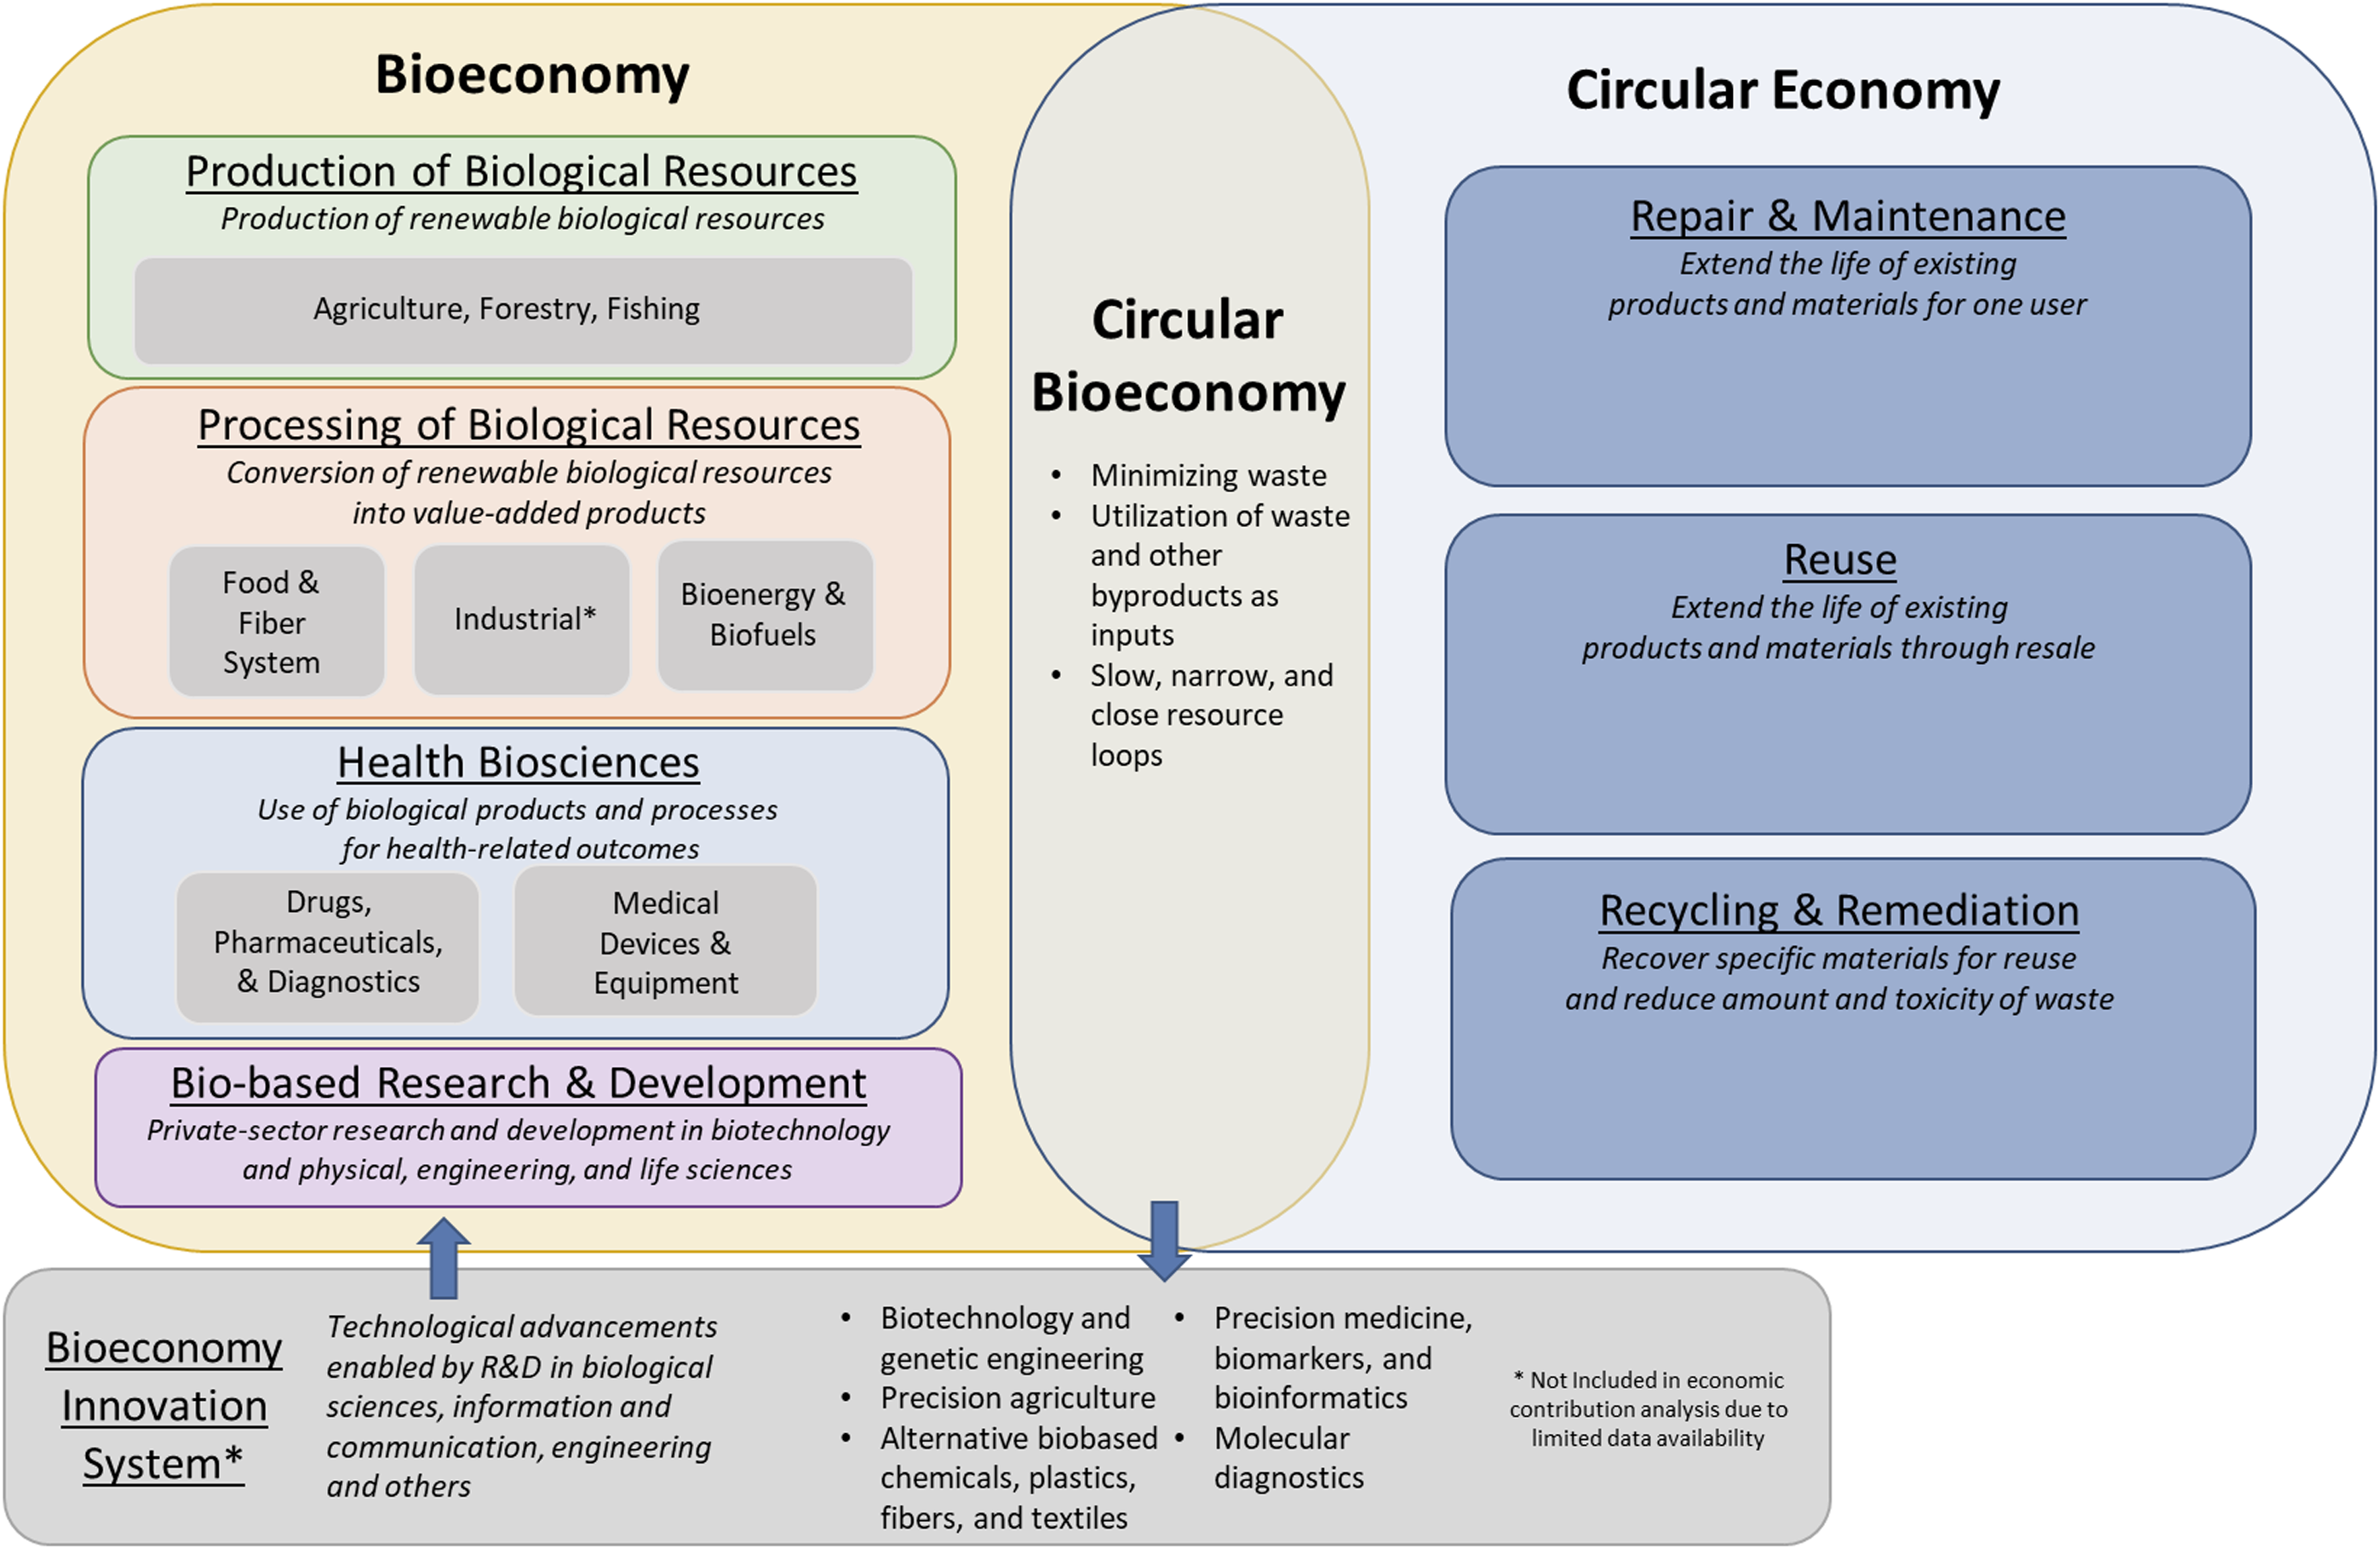
We develop separate measures for the bioeconomy and circular economy. One can think of the bioeconomy, circular economy, and circular bioeconomy as sets in a Venn diagram (Figure 1). There are many activities where there is relatively little overlap, to date. The intersection of the bioeconomy and circular economy – the circular bioeconomy – is small and difficult to measure. However, the union of the bioeconomy and circular economy is both more economically significant and easier to measure. In addition to reporting separate economic measures for the bioeconomy and the circular economy, we also provide combined estimates. Because our analysis is based on economic sectors and establishments rather than on specific processes, the overlap between the two is small, allowing us to treat their economic contributions as additive.
Relationship between the bioeconomy and circular economy. Adapted from Carus and Dammer (Reference Carus and Dammer2018) and Kardung et al. (Reference Kardung, Cingiz, Costenoble, Delahaye, Heijman, Lovric, van Leeuwen, M’Barek, van Meijl, Piotrowski, Ronzon, Sauer, Verhoog, Verkerk, Vrachioli, Wesseler and Zhu2021).
Bioeconomy landscape
A challenge in estimating the size and economic contribution of the bioeconomy is that its economic activities span many sectors and often represent small portions of larger industries. A key step is to determine which sectors are fully within the bioeconomy (e.g., crop production), which are entirely outside (e.g., steel or petroleum production), and which only have a portion of their activities included within the bioeconomy. Examples include bioplastics within the broader plastic industry or soy-based printer ink within the overall ink manufacturing industry.
We classify these activities into four categories: (1) production of biological resources, (2) processing of biological resources, (3) health biosciences, and (4) bio-based private sector research and development (R&D). Our definition is broader than most U.S. approaches that limit inclusion of agriculture to GM or biofuel crops (Carlson Reference Carlson2016; Golden et al. Reference Golden, Handfield, Daystar and McConnell2015) and includes all agriculture, forestry, and fisheries, as well as bio-based portions of chemical manufacturing, bioprocessing, and emerging technologies such as cellular agriculture. We also include biomedical manufacturing and medical device industries, consistent with NASEM (2020), given their reliance on life-science innovation. Scientific R&D is included only for biotechnology and life-science research. Detailed NAICS and IMPLAN sector assignments for this study are provided in Appendix A, Table A1. Comparisons between this study’s assignments and those of previous studies are summarized in Table A2.
Circular economy landscape
Defining the circular economy for I–O modeling poses challenges, since circular activities take place across many more industries and are often embedded within broader industries. Previous research has relied on engineering-based I–O extension approaches (e.g., Gause et al. Reference Gause, Liddell, Dollinger, Steen, Cresko and Nabil2024; Lenzen and Reynolds Reference Lenzen and Reynolds2014; Nakamura and Kondo Reference Nakamura and Kondo2002). These approaches often rely on specialized surveys and engineering relationships and are more difficult to replicate than estimates based on national accounts systems.
We take a different approach, identifying circular industries – industries that, by their very nature, specialize in circularity. This framework captures three major components of circularity: (1) Repair and Maintenance; (2) Reuse and Resale; and (3) Recycling and Remediation. This industry-based approach aligns with conventional economic accounts and enables consistent estimation across regions. The full list of circular industries and their NAICS/IMPLAN codes is provided in Appendix A, Table A3.
Economic contribution analysis
We estimate the regional economic contributions of the bioeconomy and circular economy, capturing direct, indirect, and induced effects on employment, sales, labor income, and value added. We examine Southern Arizona (Cochise, Pima, Santa Cruz, and Yuma counties), using 2019 as a baseline year, the last pre-COVID 19 pandemic period, representing typical economic conditions.
Several adjustments were made to the IMPLAN model. Accounts were adapted to more accurately reflect Arizona sectoral linkages based on data from the U.S. Census of Agriculture and the Department of Commerce, Bureau of Economic Analysis, Regional Economic Accounts. QCEW data were used to identify employment shares of bioeconomy and circular subsectors within mixed IMPLAN sectors, and output for each subsector was estimated using sector average output-to-labor ratios. These new subsectors were then “carved out” of the larger IMPLAN sector, creating a new, separate industry in the I–O table.
Our approach differs from frameworks that explicitly allocate upstream sectors to bioeconomy based on bio-based shares (e.g., Cingiz et al. Reference Cingiz, Gonzalez-Hermoso, Heijman and Wesseler2021, Reference Cingiz, Gonzalez-Hermoso, Heijman and Wesseler2023). Rather than pre-assigning upstream industries, we treat upstream linkages endogenously through indirect effects in the I–O model. These approaches are complementary: share-based allocation is well suited for economy-wide accounting exercises, while the approach used here is designed to support regional contribution analysis using standard industry data.
Finally, note that this analysis focuses on establishing a baseline measure of the current economic footprint of bioeconomy and circular economy activities. Opportunity-cost or counterfactual comparisons (e.g., bio-based versus fossil-based production) are beyond the scope of a contribution analysis and are left for future research.
Mixed sectors in the Economic Contribution Analysis
Appendix A also identifies mixed sectors (Tables A1 and A2), sectors where only a portion of economic activity lies within the bioeconomy or circular economy. To determine which portion of each mixed sector falls within our definitions, we use industry data from the Bureau of Labor Statistics’ (BLS) Quarterly Census of Employment and Wages (QCEW). The QCEW reports the number of employees and wages down to the 6-digit NAICS codes, which can be more disaggregated than IMPLAN sectors, allowing us to identify portions of each industry that are part of the circular economy and bioeconomy.
Results
Southern Arizona had 614 bioeconomy establishments in 2019, dominated by agricultural production (64%), and 16% each in Food and Fiber Manufacturing and Bio-Based R&D. The region also had 946 circular economy establishments, dominated by Repair and Maintenance (75%), followed by Reuse and Resale (22%). The direct value added (gross regional product) of the bioeconomy was $1.7 billion, 2.7% of the region’s entire GRP of $62.2 billion. The direct value added of the circular economy was $584 million, 0.9% of regional GRP (Table 1).
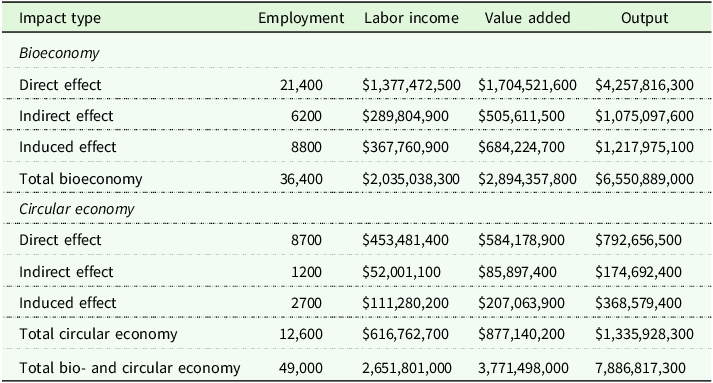
Total economic contribution of bio- and circular economies in Southern Arizona, 2019

Source: Authors’ calculations.
Including multiplier effects, the combined bio and circular economies contributed $7.9 billion in sales to Southern Arizona in 2019, supporting 49,000 jobs, more than $2.6 billion in labor income, and $3.8 billion in Gross Regional Product (Value Added). Within this total, the bioeconomy accounted for over $6.5 billion in sales, supporting 36,400 jobs, more than $2 billion in labor income, and contributing $2.9 billion to regional GRP. The circular economy contributed an additional $1.3 billion in sales, supporting 12,600 jobs, more than $600 million in labor income, and nearly $0.9 billion in GRP.
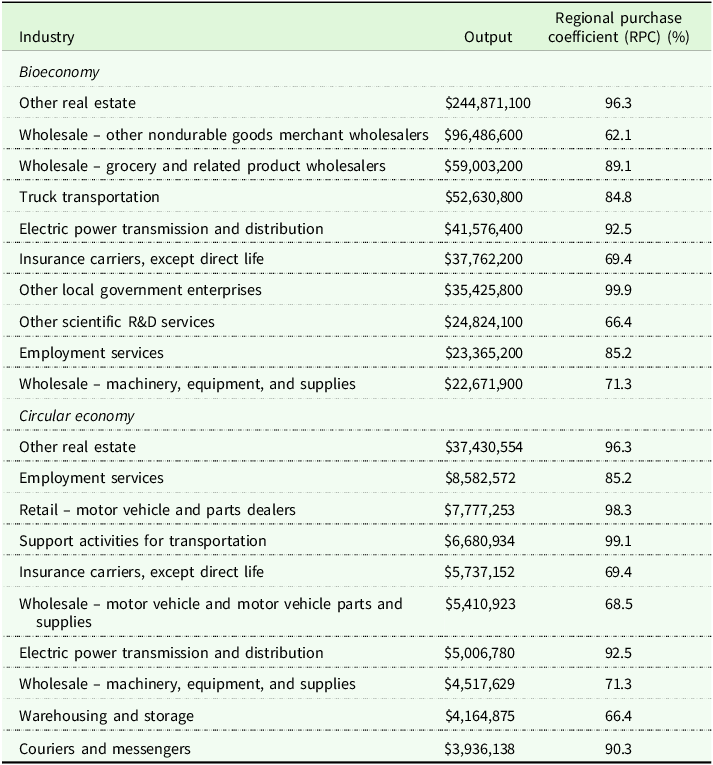
We consider opportunities to further develop the region’s circular bioeconomy by examining indirect effects and regional purchase coefficients (RPCs) in IMPLAN. RPCs represent the share of local demand met by local suppliers. RPCs show where regional demand is being met by suppliers outside Southern Arizona (but not necessarily outside the United States), pointing to opportunities for import substitution and targeted regional economic development (Goetz et al. Reference Goetz, Deller and Harris2007). Table 2 identifies those industries with (a) high sales supplying goods and services to the bio- and circular economies and (b) lower RPCs. This approach can complement case study methods of bio-based production such as guayule-based rubber production (Omotayo, Reference Omotayo2022) and other bio-based products in the Southwest (Bickel et al. Reference Bickel, Duval, Frisvold, Cuello, Didan, Giacomelli, Li and Kacira2023).
Top 10 Industries in Southern Arizona supported by bioeconomy and circular economy indirect effects, 2019

Source: Authors’ calculations.
Industries that both supply significant inputs and have low RPCs, such as wholesaling, insurance, and scientific R&D for the bioeconomy, and warehousing, motor-vehicle-related wholesaling, and business insurance for the circular economy, represent potential targets for local expansion that would keep more economic activity within the region. Note that RPCs are used here as diagnostic tools rather than prescriptive policy recommendations. Identifying leakage helps reveal where local demand is met by suppliers outside the region but does not imply that local production is necessarily feasible or desirable. Evaluating the viability of import substitution requires additional analysis that is beyond the scope of this measurement-focused paper.
Discussion and concluding remarks
Significant progress has been made internationally to formalize bioeconomy measurement and link it to national accounts. Despite increasing policy attention, there is still no uniform or widely accepted approach for measuring either the bioeconomy or the circular economy in the United States. Existing studies of the bioeconomy tend to focus on selected subsectors and rely on inconsistent or one-off data collection, while circular economy assessments often emphasize physical material flows and engineering-based process models rather than economic activity. As a result, evidence of the economic contribution of both systems are difficult to replicate and compare over time and across regions.
This study addresses these limitations by adopting a common, sector-based perspective for measuring both the bioeconomy and the circular economy. For the bioeconomy, the approach identifies activities that rely on biological resources and life-science innovation within standard industry classifications. For the circular economy, it focuses on market-based industries that provide circularity through repair, reuse, resale, recycling, and remediation. Treating both systems within a unified economic accounting framework makes it possible to assess their contributions using consistent metrics.
This contribution presents a practical, sector-based toolkit grounded in standard economic accounts and offers a consistent procedure that is valid for the U.S. context while remaining flexible enough to reflect regional priorities. Because the approach allows researchers to define the bioeconomy and circular economy based on a region’s productive structure, it supports meaningful comparisons across states and over time.
Finally, this framework is low cost and accessible. It relies on publicly available secondary data and standard I–O models. While process-based approaches are valuable, they can limit empirical analysis in regions with fewer resources for primary research. This framework lowers that barrier, making it possible to document bioeconomy and circular economic activity even in regions where such practices are economically significant but under-measured.
Supplementary material
The supplementary material for this article can be found at https://doi.org/10.1017/age.2026.10025.
Data availability statement
Raw data come from publicly available files from
-
• The USDA Census of Agriculture: https://www.nass.usda.gov/AgCensus/.
-
• BLS Quarterly Census of Employment and Wages https://www.bls.gov/cew/data.htm. U.S.
-
• Department of Commerce, Bureau of Economic Analysis, Regional Income Accounts https://www.bea.gov/data/economic-accounts/regional.
Funding statement
None.
Competing interests
None.


 Open access