


1. Introduction
The Transiting Exoplanet Survey Satellite (TESS) mission has provided invaluable data over several years. The continuous data collection and high precision photometry of TESS can detect low-amplitude periodic brightness variations due to stellar pulsations and the mission has illuminated the behaviour of numerous types of variable stars. In this work, we analysed TESS data showing pulsation content typical of ${\unicode{x03B4}}$
Scuti (
${\unicode{x03B4}}$
Scuti ( ${\unicode{x03B4}}$
Sct) and
${\unicode{x03B4}}$
Sct) and ${\unicode{x03B3}}$
Doradus (
${\unicode{x03B3}}$
Doradus ( ${\unicode{x03B3}}$
Dor) pulsators.
${\unicode{x03B3}}$
Dor) pulsators. ${\unicode{x03B4}}$
Sct variables are A-F stars with a mass range of 1.5–2.5 solar masses (M
${\unicode{x03B4}}$
Sct variables are A-F stars with a mass range of 1.5–2.5 solar masses (M $_\odot$
), and an effective temperature (
$_\odot$
), and an effective temperature ( $T_{\mathrm{eff}}$
) range of 6 000 – 9 000 K (Barceló Forteza et al. Reference Barceló Forteza, Moya, Barrado, Solano, Martn-Ruiz, Suárez and Garca Hernández2020). They are situated on the main sequence (MS) and in pre-MS, and post-MS evolutionary stages near the lower boundary of the classical instability strip. They pulsate in low-order pressure (p) modes with periods of several hours and their pulsations are driven by the
$T_{\mathrm{eff}}$
) range of 6 000 – 9 000 K (Barceló Forteza et al. Reference Barceló Forteza, Moya, Barrado, Solano, Martn-Ruiz, Suárez and Garca Hernández2020). They are situated on the main sequence (MS) and in pre-MS, and post-MS evolutionary stages near the lower boundary of the classical instability strip. They pulsate in low-order pressure (p) modes with periods of several hours and their pulsations are driven by the $\kappa$
mechanism, which arises from the second ionisation of helium in their outer layers (Xue et al. Reference Xue, Niu, Xue and Yin2023). In
$\kappa$
mechanism, which arises from the second ionisation of helium in their outer layers (Xue et al. Reference Xue, Niu, Xue and Yin2023). In ${\unicode{x03B4}}$
Sct stars, usually only low-degree modes (i.e. l = 0, 1, and 2) are observable because higher degree modes have significantly reduced amplitudes due to cancellation in disk-integrated light (Dziembowski Reference Dziembowski1977). According to Guzik et al. (Reference Guzik, Baran, Sanjayan, Németh, Hedlund, Jackiewicz and Dauelsberg2023),
${\unicode{x03B4}}$
Sct stars, usually only low-degree modes (i.e. l = 0, 1, and 2) are observable because higher degree modes have significantly reduced amplitudes due to cancellation in disk-integrated light (Dziembowski Reference Dziembowski1977). According to Guzik et al. (Reference Guzik, Baran, Sanjayan, Németh, Hedlund, Jackiewicz and Dauelsberg2023), ${\unicode{x03B4}}$
Sct star oscillation spectra exhibit low-order radial and non-radial pulsations, which are not in the asymptotic regime.
${\unicode{x03B4}}$
Sct star oscillation spectra exhibit low-order radial and non-radial pulsations, which are not in the asymptotic regime. ${\unicode{x03B3}}$
Dor variables are late A-F stars with a mass range of 1.4–2 M
${\unicode{x03B3}}$
Dor variables are late A-F stars with a mass range of 1.4–2 M $_\odot$
, and a temperature range of 6 900–7 500 K (Shutt, Brunsden, & Pollard Reference Shutt, Brunsden and Pollard2021). They are situated near or on the MS inside the classical instability strip (Shutt et al. Reference Shutt, Brunsden and Pollard2021). According to Guzik et al. (Reference Guzik, Kaye, Bradley, Cox and Neuforge2000), pulsations in
$_\odot$
, and a temperature range of 6 900–7 500 K (Shutt, Brunsden, & Pollard Reference Shutt, Brunsden and Pollard2021). They are situated near or on the MS inside the classical instability strip (Shutt et al. Reference Shutt, Brunsden and Pollard2021). According to Guzik et al. (Reference Guzik, Kaye, Bradley, Cox and Neuforge2000), pulsations in ${\unicode{x03B3}}$
Dor stars are driven by convective flux blocking, and these stars pulsate in low-order gravity (g) modes with periods from several hours to a few days.
${\unicode{x03B3}}$
Dor stars are driven by convective flux blocking, and these stars pulsate in low-order gravity (g) modes with periods from several hours to a few days.
Stars that display traits of both ${\unicode{x03B4}}$
Sct and
${\unicode{x03B4}}$
Sct and ${\unicode{x03B3}}$
Dor variables, sharing similar pulsation behaviour, mass range, and temperature range, are commonly referred to as hybrid stars. Zhou (Reference Zhou2024) concluded that inside the
${\unicode{x03B3}}$
Dor variables, sharing similar pulsation behaviour, mass range, and temperature range, are commonly referred to as hybrid stars. Zhou (Reference Zhou2024) concluded that inside the ${\unicode{x03B4}}$
Sct and
${\unicode{x03B4}}$
Sct and ${\unicode{x03B3}}$
Dor instability strip, most of the pulsating variables are probably hybrids that exhibit both p- and g-modes
${\unicode{x03B3}}$
Dor instability strip, most of the pulsating variables are probably hybrids that exhibit both p- and g-modes
The analysis of amplitude spectra of ${\unicode{x03B4}}$
Sct stars offers information needed to refine scaling relations that can provide the physical parameters for these stars. It is well known that there exists a relation between large frequency spacing (
${\unicode{x03B4}}$
Sct stars offers information needed to refine scaling relations that can provide the physical parameters for these stars. It is well known that there exists a relation between large frequency spacing ( ${\unicode{x03B4}}{\unicode{x03BD}}$
) and mean density for solar-like oscillations (Bedding et al. Reference Bedding2020). Patterns in frequency spacings have been found in
${\unicode{x03B4}}{\unicode{x03BD}}$
) and mean density for solar-like oscillations (Bedding et al. Reference Bedding2020). Patterns in frequency spacings have been found in ${\unicode{x03B4}}$
Sct stars that could be associated with
${\unicode{x03B4}}$
Sct stars that could be associated with ${\unicode{x03B4}}{\unicode{x03BD}}$
(Suárez et al. Reference Suárez, Garca Hernández, Moya, Rodrigo, Solano, Garrido and Rodón2014; García Hernández et al. Reference Garca Hernández, Martn-Ruiz and Monteiro2015; Paparó et al. Reference Paparó, Benkõ, Hareter and Guzik2016a,Reference Paparó, Benkõ, Hareter and Guzikb; Bedding et al. Reference Bedding2020). Additionally, Bedding et al. (Reference Bedding2020) identified
${\unicode{x03B4}}{\unicode{x03BD}}$
(Suárez et al. Reference Suárez, Garca Hernández, Moya, Rodrigo, Solano, Garrido and Rodón2014; García Hernández et al. Reference Garca Hernández, Martn-Ruiz and Monteiro2015; Paparó et al. Reference Paparó, Benkõ, Hareter and Guzik2016a,Reference Paparó, Benkõ, Hareter and Guzikb; Bedding et al. Reference Bedding2020). Additionally, Bedding et al. (Reference Bedding2020) identified ${\unicode{x03B4}}{\unicode{x03BD}}$
in a population of high-frequency young
${\unicode{x03B4}}{\unicode{x03BD}}$
in a population of high-frequency young ${\unicode{x03B4}}$
Sct stars and successfully identified low-order radial modes through echelle diagrams. These findings revealed regular frequency patterns similar to solar-like oscillators but at much lower radial orders, solidifying the presence of
${\unicode{x03B4}}$
Sct stars and successfully identified low-order radial modes through echelle diagrams. These findings revealed regular frequency patterns similar to solar-like oscillators but at much lower radial orders, solidifying the presence of ${\unicode{x03B4}}{\unicode{x03BD}}$
in
${\unicode{x03B4}}{\unicode{x03BD}}$
in ${\unicode{x03B4}}$
Sct p-mode oscillations. Furthermore, Murphy et al. (Reference Murphy, Bedding, Gautam, Kerr and Mani2024) identified
${\unicode{x03B4}}$
Sct p-mode oscillations. Furthermore, Murphy et al. (Reference Murphy, Bedding, Gautam, Kerr and Mani2024) identified ${\unicode{x03B4}}{\unicode{x03BD}}$
in 70
${\unicode{x03B4}}{\unicode{x03BD}}$
in 70 ${\unicode{x03B4}}$
Sct stars located within the Zero-Age Main Sequence (ZAMS) of the cluster Cep-Her Complex.
${\unicode{x03B4}}$
Sct stars located within the Zero-Age Main Sequence (ZAMS) of the cluster Cep-Her Complex.
García Hernández et al. (Reference Garca Hernández, Martn-Ruiz and Monteiro2015) approximated a mean-density scaling relation for ${\unicode{x03B4}}$
Sct stars by analysing a sample of eclipsing binary systems containing
${\unicode{x03B4}}$
Sct stars by analysing a sample of eclipsing binary systems containing ${\unicode{x03B4}}$
Sct stars where
${\unicode{x03B4}}$
Sct stars where ${\unicode{x03B4}}{\unicode{x03BD}}$
patterns were detected. This relation was further reinforced by Guzik et al. (Reference Guzik, Baran, Sanjayan, Németh, Hedlund, Jackiewicz and Dauelsberg2023) who used
${\unicode{x03B4}}{\unicode{x03BD}}$
patterns were detected. This relation was further reinforced by Guzik et al. (Reference Guzik, Baran, Sanjayan, Németh, Hedlund, Jackiewicz and Dauelsberg2023) who used ${\unicode{x03B4}}{\unicode{x03BD}}$
to approximate masses and radii for
${\unicode{x03B4}}{\unicode{x03BD}}$
to approximate masses and radii for ${\unicode{x03B4}}$
Sct stars and then compared those results to values calculated using spectroscopy.
${\unicode{x03B4}}$
Sct stars and then compared those results to values calculated using spectroscopy.
Rotationally split modes in ${\unicode{x03B4}}$
Sct stars are still a conundrum. The slow rotation approach, which allows for symmetric and equally split modes, may not be applicable to
${\unicode{x03B4}}$
Sct stars are still a conundrum. The slow rotation approach, which allows for symmetric and equally split modes, may not be applicable to ${\unicode{x03B4}}$
Sct stars since pulsations are more commonly detected in rapid rotator counterparts. Zhou (Reference Zhou2024) employed second-order perturbation theory to analyse slow and moderately rotating
${\unicode{x03B4}}$
Sct stars since pulsations are more commonly detected in rapid rotator counterparts. Zhou (Reference Zhou2024) employed second-order perturbation theory to analyse slow and moderately rotating ${\unicode{x03B4}}$
Sct stars, investigating various sources of asymmetry in rotationally split modes.
${\unicode{x03B4}}$
Sct stars, investigating various sources of asymmetry in rotationally split modes.
The purpose of this study is to analyse both photometric and spectroscopic data for 43 stars to confirm their ${\unicode{x03B4}}$
Sct and/or
${\unicode{x03B4}}$
Sct and/or ${\unicode{x03B3}}$
Dor type. Additionally, through photometric analysis, we aim to extract frequencies to investigate the presence of a large frequency spacing and to identify symmetric rotational multiplets (if any). We derive spectral types for some stars with unknown types, as described in Section 2.
${\unicode{x03B3}}$
Dor type. Additionally, through photometric analysis, we aim to extract frequencies to investigate the presence of a large frequency spacing and to identify symmetric rotational multiplets (if any). We derive spectral types for some stars with unknown types, as described in Section 2.
2. Ground-based spectroscopy
Spectrograms for the target stars were obtained with the 1.9m telescope at the Sutherland site of the South African Astronomical Observatory (SAAO) using the Cassegrain spectrograph (SpUpNIC) with grating 6 to give a spectral range of about 3 600–6 000 Å, at 1.4 Å/pixel or $\sim$
100 Å/mm. We obtained between one and seven spectrograms per star and these were compared with the Digital Spectral Atlas (Gray and Corbally (Reference Gray and Corbally2009); with a convenient version on lineFootnote
a
). We also compared the spectrograms with those of bright A and F stars obtained for spectral type comparison during the EC survey (Stobie et al. Reference Stobie1997) with the same equipment (although the spectrograph has since been refurbished – Crause et al. Reference Crause2019). Very similar spectral types were derived using both procedures and the results are included in Table 1.
$\sim$
100 Å/mm. We obtained between one and seven spectrograms per star and these were compared with the Digital Spectral Atlas (Gray and Corbally (Reference Gray and Corbally2009); with a convenient version on lineFootnote
a
). We also compared the spectrograms with those of bright A and F stars obtained for spectral type comparison during the EC survey (Stobie et al. Reference Stobie1997) with the same equipment (although the spectrograph has since been refurbished – Crause et al. Reference Crause2019). Very similar spectral types were derived using both procedures and the results are included in Table 1.
Basic parameters of stars analysed in this work. Bold sector numbers indicate the ones used in our analysis, and the listed cadence corresponds to those bold face sectors. The # superscripts in the ‘var type’ column denote hybrid candidates. Atmospheric parameters were adopted from Gaia DR3. Spectral types were adopted from the literature, with details given in the star’s individual paragraphs (Section 5), whereas those with asterisk superscripts were derived in this work from spectra taken at SAAO (see Section 2).

3. TESS photometry
TESS operates with four $24^{\circ} \times 24^{\circ}$
CCD cameras arranged to cover a ‘sector’ stretching from the ecliptic pole to near the ecliptic.Footnote
b
Every
$24^{\circ} \times 24^{\circ}$
CCD cameras arranged to cover a ‘sector’ stretching from the ecliptic pole to near the ecliptic.Footnote
b
Every $\sim$
27 d, the sector rotates by about
$\sim$
27 d, the sector rotates by about $28^{\circ}$
so that in a year, one hemisphere is covered by 13 sectors. At the pole, coverage is continuous for a year; near the ecliptic, 13 regions each have
$28^{\circ}$
so that in a year, one hemisphere is covered by 13 sectors. At the pole, coverage is continuous for a year; near the ecliptic, 13 regions each have $\sim$
27 d each. In between, coverage is from 54 to 189 d, depending on ecliptic latitude and sector overlaps. This mission design is applicable to the first three years of the TESS mission but, in Year 4, it started to deviate from this pattern and put sectors across the ecliptic. In the first two years of operation, essentially both hemispheres were covered (for selected objects) with cadences of 30 and 2 min, the latter being referred to as short cadence (SC) mode. Extended operations are repeating this process, including a 20-s ultra-short cadence (USC) mode which is invaluable for rapidly varying stars.
$\sim$
27 d each. In between, coverage is from 54 to 189 d, depending on ecliptic latitude and sector overlaps. This mission design is applicable to the first three years of the TESS mission but, in Year 4, it started to deviate from this pattern and put sectors across the ecliptic. In the first two years of operation, essentially both hemispheres were covered (for selected objects) with cadences of 30 and 2 min, the latter being referred to as short cadence (SC) mode. Extended operations are repeating this process, including a 20-s ultra-short cadence (USC) mode which is invaluable for rapidly varying stars.
The size of an individual pixel of TESS CCD cameras is 21 arcsec square. A single pixel can contain flux from multiple stars, therefore, in cases of dense star fields, a contamination analysis is necessary (Sahoo et al. Reference Sahoo, Baran, Worters, Németh and Kilkenny2023). Incidentally, g-mode pulsations in hot subdwarfs have periods comparable with p-mode pulsations in ${\unicode{x03B4}}$
Sct stars, i.e. tens of minutes up to a few hours. While performing a contamination check of TESS data of hot subdwarf candidates, our analysis revealed that the variability was coming from contaminating stars (see Figure 1 for a visualisation of this issue). All stars included in this work turned out to be contaminators without secured identification. Therefore, we made an effort to properly identify the stars and perform asteroseismic analysis to derive their physical parameters.
${\unicode{x03B4}}$
Sct stars, i.e. tens of minutes up to a few hours. While performing a contamination check of TESS data of hot subdwarf candidates, our analysis revealed that the variability was coming from contaminating stars (see Figure 1 for a visualisation of this issue). All stars included in this work turned out to be contaminators without secured identification. Therefore, we made an effort to properly identify the stars and perform asteroseismic analysis to derive their physical parameters.
We downloaded TESS data from the Barbara A. Mikulski Archive for Space Telescopes (MAST) using the Lightkurve python package (Lightkurve Collaboration et al. 2018). We only considered data collected in 20, 120, 200, and 600 s cadences. For a given star we preferred choosing the shortest cadence available. When possible, we used light curves prepared by the TESS pipeline, otherwise we used pixel tables to define optimal apertures, subtract background and derive light curves. If necessary, light curves were subject to an outlier clipping and long-term artefact detrending. We ensured that our detrending does not affect long-period variability that could be interpreted as g-modes or a binary signature.
Depending on the location on the sky, stars in our sample were observed during one or multiple sectors per TESS cycle. We combined and analysed together all consecutive sector datasets. To avoid significant aliasing, sectors were added only if the gap duration was shorter than the time span of consecutive datasets.
Pan-STARRS image overlaid with a $5\times 5$
pixel TESS image. A
$5\times 5$
pixel TESS image. A ${\unicode{x03B4}}$
Sct candidate (TIC 51026945) is the brightest star in the target mask, while a hot subdwarf (TIC 51026936) star is separated by only about one pixel towards the south-west.
${\unicode{x03B4}}$
Sct candidate (TIC 51026945) is the brightest star in the target mask, while a hot subdwarf (TIC 51026936) star is separated by only about one pixel towards the south-west.

4. Asteroseismic analysis
We used a Fourier technique, including prewhitening, to describe the pulsation content of each star. First, we calculated an amplitude spectrum from time-series data. Next, we identified the largest amplitude frequency and removed it in the time-domain using $A_{{i}} \sin(2\pi f_{{i}} t\,+\,{\unicode{x03D5}}_{{i}}$
), where i denotes individual signal, while A, f and
$A_{{i}} \sin(2\pi f_{{i}} t\,+\,{\unicode{x03D5}}_{{i}}$
), where i denotes individual signal, while A, f and ${\unicode{x03D5}}$
stand for amplitude, frequency and phase, respectively. We repeated these two steps, always fitting all identified frequencies simultaneously, until all significant frequencies (i.e. having amplitudes above a detection threshold) had been identified. In some cases, removal of individual frequencies left residuals in the data, caused by either unstable modes or unresolved frequencies. We left those residuals in the data regardless of their amplitudes.
${\unicode{x03D5}}$
stand for amplitude, frequency and phase, respectively. We repeated these two steps, always fitting all identified frequencies simultaneously, until all significant frequencies (i.e. having amplitudes above a detection threshold) had been identified. In some cases, removal of individual frequencies left residuals in the data, caused by either unstable modes or unresolved frequencies. We left those residuals in the data regardless of their amplitudes.
We used Period04 (Lenz&Breger Reference Lenz and Breger2005) and Pyriod (Bell Reference Bell2021) to perform prewhitening, however both tools have limitations, while the latter was occasionally found not to give a reliable fit, therefore we supported our analyses with custom scripts. We adopted a detection threshold to be 4.5 above the average noise level. This is justified by recent work of Baran & Koen (Reference Baran and Koen2021) and, depending on cadence and data coverage, it represents a very high confidence level, or low false alarm probability. Because our work uses space-based time-series data, it requires a higher threshold than in the case of ground-based data, making the identified frequency less likely to be noise induced. It is a consequence of an increased probability of spurious detections in continuous, long-duration observations.
4.1 Search for rotationally split modes
As pointed out by Ledoux (Reference Ledoux1951), stellar rotation lifts the degeneracy of non-radial pulsation modes, separating azimuthal orders and causing the peaks to split into multiplets in an amplitude spectrum. In the case of slow rotation, this results in symmetric and equally spaced frequency patterns, which can be described using first-order perturbation theory. ${\unicode{x03B4}}$
Sct stars are usually moderate to fast rotators, which can cause their multiplets to appear asymmetric or overlap with unrelated frequencies. Nevertheless, in our search, we focused only on symmetric, equally spaced patterns, assuming the stars are rotating slowly enough for the first-order rotational splitting theory to apply.
${\unicode{x03B4}}$
Sct stars are usually moderate to fast rotators, which can cause their multiplets to appear asymmetric or overlap with unrelated frequencies. Nevertheless, in our search, we focused only on symmetric, equally spaced patterns, assuming the stars are rotating slowly enough for the first-order rotational splitting theory to apply.
To estimate the rotation period of candidate ${\unicode{x03B4}}$
Sct stars, we adopted a simplified method based on the observed frequency splitting between components of suspected rotational multiplets. The splitting between adjacent non-radial modes can be approximated as:
${\unicode{x03B4}}$
Sct stars, we adopted a simplified method based on the observed frequency splitting between components of suspected rotational multiplets. The splitting between adjacent non-radial modes can be approximated as:
 \begin{equation}{{f}_{l,m} = {f}_{l,0} + \Delta {f_m} = {f_{l,0}} + {m}\frac{{1-{C}_{n,l}}}{{P_{\rm rot}}}} \end{equation}
where $C_{n,l}$
is the Ledoux constant and
$C_{n,l}$
is the Ledoux constant and $P_{\mathrm{rot}}$
is the orbital period. By assuming the Ledoux constant to be
$P_{\mathrm{rot}}$
is the orbital period. By assuming the Ledoux constant to be $\approx$
0, which is reasonable for p-modes in
$\approx$
0, which is reasonable for p-modes in ${\unicode{x03B4}}$
Sct stars, we simplify the above relation to:
${\unicode{x03B4}}$
Sct stars, we simplify the above relation to:
 \begin{equation}{P}_{\mathrm{rot}} = \frac{{m}}{\Delta {f_{{m}}}}\end{equation}
While this estimate does not account for effects such as rotational distortion, mode coupling, or inclination angle, it provides a useful first-order approximation of the stellar rotation period and it provides a useful approximation for probing the rotational characteristics of the observed stars.
4.2 Search for equally spaced frequencies
The large frequency spacing ( $\Delta \nu$
) is a well-known diagnostic in asteroseismology, particularly for solar-like oscillators, where it scales with the square root of the mean stellar density (
$\Delta \nu$
) is a well-known diagnostic in asteroseismology, particularly for solar-like oscillators, where it scales with the square root of the mean stellar density ( $\bar{\rho}$
) (Bedding et al. Reference Bedding2020). This relationship arises because
$\bar{\rho}$
) (Bedding et al. Reference Bedding2020). This relationship arises because $\Delta \nu$
traces the sound-crossing time across the star. A similar scaling has been observed in
$\Delta \nu$
traces the sound-crossing time across the star. A similar scaling has been observed in ${\unicode{x03B4}}$
Sct stars, particularly in younger objects near or on the Zero-Age Main Sequence (ZAMS), where mode patterns remain relatively regular due to simpler internal structure. In these stars,
${\unicode{x03B4}}$
Sct stars, particularly in younger objects near or on the Zero-Age Main Sequence (ZAMS), where mode patterns remain relatively regular due to simpler internal structure. In these stars, $\Delta \nu$
can be more easily detected. However, in more evolved
$\Delta \nu$
can be more easily detected. However, in more evolved ${\unicode{x03B4}}$
Sct stars, identifying a consistent
${\unicode{x03B4}}$
Sct stars, identifying a consistent $\Delta \nu$
becomes more challenging because, as stars evolve, their internal structure becomes increasingly complex. Nonradial modes are often ‘bumped’ from regular spacing due to avoided crossings, where p-modes couple with g-modes in the core, disrupting the regular frequency pattern (Bedding et al. Reference Bedding2020).
$\Delta \nu$
becomes more challenging because, as stars evolve, their internal structure becomes increasingly complex. Nonradial modes are often ‘bumped’ from regular spacing due to avoided crossings, where p-modes couple with g-modes in the core, disrupting the regular frequency pattern (Bedding et al. Reference Bedding2020).
The Kolmogorov–Smirnov (K–S) test (Press, Flannery, & Teukolsky Reference Press, Flannery and Teukolsky1986) was applied to determine the significant frequency spacings. For each test frequency spacing, the residuals are tested against a uniform distribution using the K–S test, and the probability value (Q) is computed. The larger the Q value the higher the probability that the test spacing is random, hence it does not appear to represent a spacing between detected modes and consequently the modes are not of the same modal degree. Conversely, any minimum of the Q value indicates that the test frequency spacing is uniformly distributed across the amplitude spectrum and that the modes can be of uniform modal degree.
Lv et al. (Reference Lv, Esamdin, Hasanzadeh, Ghazinejad, Pascual-Granado, Mirouh and Karimov2024) found regular frequency spacings for ${\unicode{x03B4}}$
Sct stars in the range of 2.11–7.33 c/d using TESS and Large Sky Area Multi-Object Fiber Spectroscopic Telescope (LAMOST) data. Breger, Lenz, & Pamyatnykh Breger (Reference Breger, Lenz and Pamyatnykh2008) related the average spacing between radial modes to the frequency of the lowest radial mode. Since the spacing of radial modes changes with a star’s density and structure, it also varies with surface gravity. Given that
${\unicode{x03B4}}$
Sct stars in the range of 2.11–7.33 c/d using TESS and Large Sky Area Multi-Object Fiber Spectroscopic Telescope (LAMOST) data. Breger, Lenz, & Pamyatnykh Breger (Reference Breger, Lenz and Pamyatnykh2008) related the average spacing between radial modes to the frequency of the lowest radial mode. Since the spacing of radial modes changes with a star’s density and structure, it also varies with surface gravity. Given that ${\unicode{x03B4}}$
Sct stars have
${\unicode{x03B4}}$
Sct stars have $\log$
g values in the range of 3.4–4.3 (Rodríguez & Breger 2001), we adopt a broader range of 1.5–7.5 c/d to estimate spacings across the instability strip to ensure stars at different evolutionary stages are not excluded.
$\log$
g values in the range of 3.4–4.3 (Rodríguez & Breger 2001), we adopt a broader range of 1.5–7.5 c/d to estimate spacings across the instability strip to ensure stars at different evolutionary stages are not excluded.
When a star exhibits many pulsation frequencies, lower-amplitude frequencies can sometimes mask any existing frequency spacings that happen only between high-amplitude frequencies. Frequency spacings are identified by considering three key factors: the presence of deep and sometimes wide troughs in the K–S test results, consistency with the expected spacing range, and the presence in frequency-filtered and -unfiltered K–S tests. This filtering approach was primarily applied to stars with rich frequency spectra, while stars with fewer frequencies were analysed using all detected frequencies. For each star, we identified the filtering level that produced the clearest pattern, discarding filtering results that degraded pattern clarity. Additionally, while frequency multiplets can introduce small spacings, their presence may obscure the expected K–S spacings, complicating the interpretation of results. Following the conclusions drawn from FG Vir in Paparó et al. (Reference Paparó2018), ${\unicode{x03B4}}{\unicode{x03BD}}$
may represent a combination of the large spacing and rotational frequency.
${\unicode{x03B4}}{\unicode{x03BD}}$
may represent a combination of the large spacing and rotational frequency.
A relation between $\Delta \nu$
and
$\Delta \nu$
and $\bar{\rho}$
was initially established by Hernández et al. (Reference Garca Hernández, Martn-Ruiz and Monteiro2015) using a sample of eclipsing binaries, and later refined with improved calibration by García Hernández et al. (Reference Garca Hernández2017). In this work, we adopted the latter version for estimating mean stellar densities.
$\bar{\rho}$
was initially established by Hernández et al. (Reference Garca Hernández, Martn-Ruiz and Monteiro2015) using a sample of eclipsing binaries, and later refined with improved calibration by García Hernández et al. (Reference Garca Hernández2017). In this work, we adopted the latter version for estimating mean stellar densities.
 \begin{equation}\frac{\bar{\rho}}{\bar{\rho}_\odot}=1.50^{+0.09}_{-0.10}\left(\frac{\Delta\nu}{\Delta \nu_\odot}\right)^{2.04^{+0.04}_{-0.04}}\end{equation}
When these density estimates are paired with spectroscopic parameters such as $T_{\mathrm{eff}}$
or
$T_{\mathrm{eff}}$
or $\log\,g$
, they provide a powerful means of constraining stellar mass. For
$\log\,g$
, they provide a powerful means of constraining stellar mass. For ${\unicode{x03B4}}$
Scuti stars, the expected mass range lies between approximately 1.5 and 2.5 M
${\unicode{x03B4}}$
Scuti stars, the expected mass range lies between approximately 1.5 and 2.5 M $_{\odot}$
, which serves as a useful benchmark. By deriving masses from candidate frequency spacings, we can evaluate which spacing yields a mass consistent with this expected range. We opted to use the Gaia DR3 values for all the stars to keep the calculations consistent and comparable. The calculation is based on combining classical expressions for surface gravity and density:
$_{\odot}$
, which serves as a useful benchmark. By deriving masses from candidate frequency spacings, we can evaluate which spacing yields a mass consistent with this expected range. We opted to use the Gaia DR3 values for all the stars to keep the calculations consistent and comparable. The calculation is based on combining classical expressions for surface gravity and density:
 \begin{equation}{{g}=\frac{\mathrm{GM}}{{R^{2}}}}\end{equation}
 \begin{equation}{{\rho}=\frac{{3M}}{4\pi {R^{3}}}}\end{equation}
where G is the gravitational constant, M is the mass of the star, and R is the radius of the star. Solving these equations simultaneously to eliminate radius yields a direct expression for stellar mass as a function of gravity and density:
 \begin{align}M=\frac{9g^{3}}{16\pi^{2}G^{3}\rho^{2}}\\[2pt]\nonumber\end{align}
List of frequencies we detected in our targets. Numbers in parentheses denote uncertainties.

To assess the uncertainty in the derived stellar masses, we propagated the errors from the surface gravity and the mean density.
5. Discussion and results
We have found 43 stars showing amplitude spectra typical of ${\unicode{x03B4}}$
Sct and/or
${\unicode{x03B4}}$
Sct and/or ${\unicode{x03B3}}$
Dor pulsators. We considered a star to be a hybrid if at least two frequencies were detected in both the low- and high-frequency regions, which we assume to be separated at frequency of 4 c/d, otherwise we considered the star to be a hybrid candidate only. This frequency is arbitrarily adopted since we are not in possession of theoretical models for our targets and therefore unable to use the frequency of a fundamental radial mode to serve the purpose more reliably; that being said, it may happen that for some stars the p-modes can extend to frequencies lower than 4 c/d and the stars may not necessarily be hybrids. A selection of basic parameters of these stars is listed in Table 1. Below, we describe each star in individual paragraphs providing some historical background and our new results. To increase frequency resolution and lower the noise level in amplitude spectra, our preference was to analyse all TESS datasets combined together. However, to avoid complex window functions in amplitude spectra caused by missing sectors, we analysed separate datasets, combining only those that are either contiguous or the gaps between them are relatively short. The lists of frequencies were used to search for both rotationally split modes and frequency spacings. We approximated the density for all frequency spacings that met the previously listed search criteria; however, we report mass results only for the frequency spacings we consider most likely.
${\unicode{x03B3}}$
Dor pulsators. We considered a star to be a hybrid if at least two frequencies were detected in both the low- and high-frequency regions, which we assume to be separated at frequency of 4 c/d, otherwise we considered the star to be a hybrid candidate only. This frequency is arbitrarily adopted since we are not in possession of theoretical models for our targets and therefore unable to use the frequency of a fundamental radial mode to serve the purpose more reliably; that being said, it may happen that for some stars the p-modes can extend to frequencies lower than 4 c/d and the stars may not necessarily be hybrids. A selection of basic parameters of these stars is listed in Table 1. Below, we describe each star in individual paragraphs providing some historical background and our new results. To increase frequency resolution and lower the noise level in amplitude spectra, our preference was to analyse all TESS datasets combined together. However, to avoid complex window functions in amplitude spectra caused by missing sectors, we analysed separate datasets, combining only those that are either contiguous or the gaps between them are relatively short. The lists of frequencies were used to search for both rotationally split modes and frequency spacings. We approximated the density for all frequency spacings that met the previously listed search criteria; however, we report mass results only for the frequency spacings we consider most likely.
TIC 24261146 was not known to be a variable star prior to the TESS mission. The spectral type of A2 is given in the Henry Draper Catalogue (Cannon & Pickering Reference Cannon and Pickering1918, Reference Cannon and Pickering1993). We report results only for the combined TESS Sector 53–54 data. The Fourier transform is shown in the top panel of Figure 5. We detected 14 significant frequencies, with 13 in the higher-frequency region and one in the lower frequency region. The list of detected frequencies can be found in Table 2. Given the spectral type, along with frequencies detected in the amplitude spectrum, a ${\unicode{x03B4}}$
Sct/
${\unicode{x03B4}}$
Sct/ ${\unicode{x03B3}}$
Dor hybrid candidate is consistent with the observed properties.
${\unicode{x03B3}}$
Dor hybrid candidate is consistent with the observed properties.
TIC 31798072 was classified as a spectroscopic binary by the Gaia Collaboration et al. (Reference Collaboration2023) and was not known to be a variable star prior to the TESS mission. Rodgers, Roberts, & Walker (Reference Rodgers, Roberts and Walker1993) found that the spectral type of the star was A5. We report results only for TESS Sectors 61–64, and 67–68 combined. The amplitude spectrum is shown in the second panel from the top of Figure 5, and we list the frequencies in Table 2. We detected a total of 111 frequencies, including a low frequency, $f_1$
= 1.099553 c/d, and its three harmonics, which are probably a signature of binarity. Given the star’s spectral type, and the detected frequencies, a
$f_1$
= 1.099553 c/d, and its three harmonics, which are probably a signature of binarity. Given the star’s spectral type, and the detected frequencies, a ${\unicode{x03B4}}$
Sct classification for one of the stars in the binary is consistent with the observed properties.
${\unicode{x03B4}}$
Sct classification for one of the stars in the binary is consistent with the observed properties.
To identify potential $\Delta \nu$
, we applied the K–S test following a progressive signal-to-noise (S/N) filtering approach: first considering all detected frequencies, then narrowing to those with S/N
$\Delta \nu$
, we applied the K–S test following a progressive signal-to-noise (S/N) filtering approach: first considering all detected frequencies, then narrowing to those with S/N $\geq$
8.5. The results are shown in Figure 4. One of the most prominent troughs in the K–S test appears at 3.74 c/d, suggesting a possible regular spacing among the pulsation frequencies.
$\geq$
8.5. The results are shown in Figure 4. One of the most prominent troughs in the K–S test appears at 3.74 c/d, suggesting a possible regular spacing among the pulsation frequencies.
Assuming that this spacing represents the large frequency spacing, we applied the $\Delta \nu \propto \sqrt{\bar{\rho}}$
scaling relation to estimate the mean stellar density. This yielded a value of
$\Delta \nu \propto \sqrt{\bar{\rho}}$
scaling relation to estimate the mean stellar density. This yielded a value of $\bar{\rho}=0.2084\,(38)\,$
g cm
$\bar{\rho}=0.2084\,(38)\,$
g cm $^{-3}$
. Using this density value and the Gaia DR3 surface gravity value, we derived a stellar mass of 0.318 (48) M
$^{-3}$
. Using this density value and the Gaia DR3 surface gravity value, we derived a stellar mass of 0.318 (48) M $_\odot$
. This mass value falls well below the expected range of 1.5–2.5 M
$_\odot$
. This mass value falls well below the expected range of 1.5–2.5 M $_\odot$
for
$_\odot$
for ${\unicode{x03B4}}$
Sct stars, indicating that the 3.74 c/d spacing is unlikely to correspond to the large frequency spacing. Alternatively, since the mass depends on surface gravity cubed in Equation (6), an inaccurate Gaia surface gravity estimate could result in a mass determination outside the expected range. Therefore, if
${\unicode{x03B4}}$
Sct stars, indicating that the 3.74 c/d spacing is unlikely to correspond to the large frequency spacing. Alternatively, since the mass depends on surface gravity cubed in Equation (6), an inaccurate Gaia surface gravity estimate could result in a mass determination outside the expected range. Therefore, if $\log(g/text{cm}\,\text{s}^{-2})$
is increased from the Gaia value 3.719 to 3.95, the resulting mass estimate is 1.57 M
$\log(g/text{cm}\,\text{s}^{-2})$
is increased from the Gaia value 3.719 to 3.95, the resulting mass estimate is 1.57 M $_\odot$
, falling within the expected range. Since it is only an arbitrary adjustment, we provide no uncertainty for this mass estimate.
$_\odot$
, falling within the expected range. Since it is only an arbitrary adjustment, we provide no uncertainty for this mass estimate.
TIC 40171580 was identified as a short-timescale variable star by the Gaia Collaboration et al. (Reference Collaboration2023). Although no spectral classification has been reported, the $T_{\mathrm{eff}}$
and
$T_{\mathrm{eff}}$
and $\log\,g$
values from Gaia DR3 seen in Table 2 fall within the expected range for A/F type stars. We report results only for the TESS Sectors 40–41 combined data. An amplitude spectrum is shown in the third panel from the top of Figure 5. We detected nine frequencies and we list them in Table 2. The frequencies and the spectral type make a
$\log\,g$
values from Gaia DR3 seen in Table 2 fall within the expected range for A/F type stars. We report results only for the TESS Sectors 40–41 combined data. An amplitude spectrum is shown in the third panel from the top of Figure 5. We detected nine frequencies and we list them in Table 2. The frequencies and the spectral type make a ${\unicode{x03B4}}$
Sct classification consistent with the observed properties.
${\unicode{x03B4}}$
Sct classification consistent with the observed properties.
TIC 40869093 was identified as an eclipsing binary by Chen et al. (Reference Chen, Wang, Deng, de Grijs, Yang and Tian2020). We report results only for the TESS Sectors 40–41 combined data. An amplitude spectrum is shown in the fourth panel from the top of Figure 5. We detected four frequencies, with three of them being multiples of the lowest frequency, leading us to favour a binary origin for the variability and not pulsations. In this case, the orbital period is 0.2520(10) d and we do not consider the star to be a pulsating variable.
SAAO spectra of the stars analysed in this work. Spectral types derived in this work are given below the TIC designations.

TIC 48434987 was not known to be a variable star before the TESS mission. Houk & Swift (Reference Houk and Swift1999) classified the star as A2IV/V, and based on spectrograms from the SAAO observations, we confirmed the A2 spectral type (top panel of Figure 2). We report results only for the TESS Sector 50–51 combined data. We detected 70 significant frequencies and we show an amplitude spectrum in the third panel from the bottom of Figure 5, and we list the frequencies in Table 2. Given the spectral type, along with the detected frequencies, a ${\unicode{x03B4}}$
Sct classification is consistent with the observed properties.
${\unicode{x03B4}}$
Sct classification is consistent with the observed properties.
To identify potential $\Delta \nu$
, we applied the K–S test following a progressive signal-to-noise (S/N) filtering approach: first considering all detected frequencies, then narrowing to those with S/N
$\Delta \nu$
, we applied the K–S test following a progressive signal-to-noise (S/N) filtering approach: first considering all detected frequencies, then narrowing to those with S/N $\geq$
12. The results are shown in Figure 4. We can see two prominent troughs with a narrow one at 2.3 c/d, and a wider one at 6.6 c/d. We applied the
$\geq$
12. The results are shown in Figure 4. We can see two prominent troughs with a narrow one at 2.3 c/d, and a wider one at 6.6 c/d. We applied the $\Delta\nu\propto\sqrt{\bar{\rho}}$
scaling relation using those two spacing values to estimate the mean stellar density. This yielded a value of 0.0773 (10) and 0.664 (27) g cm
$\Delta\nu\propto\sqrt{\bar{\rho}}$
scaling relation using those two spacing values to estimate the mean stellar density. This yielded a value of 0.0773 (10) and 0.664 (27) g cm $^{-3}$
. Using this density value and the Gaia DR3 surface gravity values, we derived a stellar mass of 8.6 (1.0) and 0.117 (23) M
$^{-3}$
. Using this density value and the Gaia DR3 surface gravity values, we derived a stellar mass of 8.6 (1.0) and 0.117 (23) M $_\odot$
, for the 2.3 and 6.6 c/d spacings, respectively. Both mass estimates are outside the expected range of 1.5–2.5 M
$_\odot$
, for the 2.3 and 6.6 c/d spacings, respectively. Both mass estimates are outside the expected range of 1.5–2.5 M $_\odot$
for
$_\odot$
for ${\unicode{x03B4}}$
Sct stars, indicating that either spacing is unlikely to correspond to the large frequency spacing. Alternatively, if
${\unicode{x03B4}}$
Sct stars, indicating that either spacing is unlikely to correspond to the large frequency spacing. Alternatively, if $\log(g/\text{cm}\,\text{s}^{-2})$
is reduced from the Gaia value 3.91–3.7 or increased to 4.3, the resulting mass estimate is 2.04 or 1.74 M
$\log(g/\text{cm}\,\text{s}^{-2})$
is reduced from the Gaia value 3.91–3.7 or increased to 4.3, the resulting mass estimate is 2.04 or 1.74 M $_\odot$
, respectively, for the 2.3 and 6.6 c/d troughs, falling within the expected range.
$_\odot$
, respectively, for the 2.3 and 6.6 c/d troughs, falling within the expected range.
TIC 51026945 was classified as an A3 star by Rydstrom (Reference Rydstrom1978), and was not known to be a variable star prior to the TESS mission. We report results only for the TESS Sectors 58–59 combined data set. A total of twelve significant frequencies were detected: eight in the high-frequency region and four in the low-frequency region. An amplitude spectrum is shown in the second panel from the bottom of Figure 5. We list the detected frequencies in Table 2. Given the spectral type and the observed frequencies, a ${\unicode{x03B4}}$
Sct/
${\unicode{x03B4}}$
Sct/ ${\unicode{x03B3}}$
Dor hybrid classification is consistent with the observed properties.
${\unicode{x03B3}}$
Dor hybrid classification is consistent with the observed properties.
TIC 62774721 was flagged as a variable star by the Collaboration et al. (Reference Collaboration2023), however no specific type of variability and no spectral classification have been reported. The $T_{\mathrm{eff}}$
and
$T_{\mathrm{eff}}$
and $\log$
g values from Gaia DR3 listed in Table 1 fall within the expected range for A type stars. We report results for the TESS Sector 15 data. We detected 68 significant frequencies, with 67 in the higher-frequency region and one in the lower frequency region. We show an amplitude spectrum in the bottom panel of Figure 5 and list the detected frequencies in Table 2. Given the spectral type and detected frequencies, a
$\log$
g values from Gaia DR3 listed in Table 1 fall within the expected range for A type stars. We report results for the TESS Sector 15 data. We detected 68 significant frequencies, with 67 in the higher-frequency region and one in the lower frequency region. We show an amplitude spectrum in the bottom panel of Figure 5 and list the detected frequencies in Table 2. Given the spectral type and detected frequencies, a ${\unicode{x03B4}}$
Sct/
${\unicode{x03B4}}$
Sct/ ${\unicode{x03B3}}$
Dor hybrid candidate classification is consistent with the observed properties.
${\unicode{x03B3}}$
Dor hybrid candidate classification is consistent with the observed properties.
While searching for rotationally split multiplets, we only found two candidate multiplets. An asymmetric triplet $f_2$
,
$f_2$
, $f_3$
, and
$f_3$
, and $f_4$
with an average frequency splitting of 0.2623(43) c/d, and f
$f_4$
with an average frequency splitting of 0.2623(43) c/d, and f $_6$
and
$_6$
and $f_7$
with a frequency splitting of 0.34405(22) c/d. These splittings correspond to rotation periods of
$f_7$
with a frequency splitting of 0.34405(22) c/d. These splittings correspond to rotation periods of $P_{\mathrm{rot}}$
= 3.813(6) and 2.907(19) d, respectively.
$P_{\mathrm{rot}}$
= 3.813(6) and 2.907(19) d, respectively.
Same as Figure 2 for five different stars. The top two panels show spectra of the same star with differing spectral classifications. (Note, for example, the stronger G band (near 4 300 Å) in the lower panel.

TIC 67741056 was identified as a spectroscopic binary by Gaia Collaboration et al. (Reference Collaboration2023) and classified as an F-type star by Cannon & Pickering (Reference Cannon and Pickering1918, Reference Cannon and Pickering1993). It was not known to be a pulsating star before the TESS mission. We report results for the TESS Sectors 50–51 combined data. We detected 73 significant frequencies, with 70 in the higher-frequency region and three in the lower frequency region. An amplitude spectrum is shown in the top panel of Figure 6, and we list the frequencies in Table 2. Given the spectral type and detected frequencies, a ${\unicode{x03B4}}$
Sct/
${\unicode{x03B4}}$
Sct/ ${\unicode{x03B3}}$
Dor hybrid of the pulsator component in this binary system is consistent with the observed properties.
${\unicode{x03B3}}$
Dor hybrid of the pulsator component in this binary system is consistent with the observed properties.
K–S tests of stars with prominent troughs flagged. These are discussed for individual stars in Section 5.

TIC 92645051 was not known to be variable prior to the TESS mission and was classified as an A0-type by Nesterov et al. (Reference Nesterov, Kuzmin, Ashimbaeva, Volchkov, Röser and Bastian1995) and Cruzalèbes et al. (Reference Cruzalèbes2019). We report results for the TESS Sectors 54–55 combined data. We detected 46 significant frequencies, with 41 in the higher-frequency region and five in the lower frequency region. An amplitude spectrum is shown in the second panel from the top of Figure 6. Given the spectral type and the detected frequencies, a ${\unicode{x03B4}}$
Sct/
${\unicode{x03B4}}$
Sct/ ${\unicode{x03B3}}$
Dor hybrid classification is consistent with the observed properties.
${\unicode{x03B3}}$
Dor hybrid classification is consistent with the observed properties.
TIC 99681245 was not known to be a variable star prior to the TESS mission. We report results for the TESS Sectors 33 and 34 combined data. Although no spectral classification has been reported, the $T_{\mathrm{eff}}$
and
$T_{\mathrm{eff}}$
and $\log\,g$
values from Gaia DR3 seen in Table 1 indicate an A/F spectral classification. A spectrogram from the SAAO campaign indicates an A5 spectral type and is shown in the second panel from the top of Figure 2. We detected 31 significant frequencies. An amplitude spectrum is shown in the third panel from the top of Figure 6, and we list the frequencies in Table 2. Given the spectral type and the detected frequencies, a
$\log\,g$
values from Gaia DR3 seen in Table 1 indicate an A/F spectral classification. A spectrogram from the SAAO campaign indicates an A5 spectral type and is shown in the second panel from the top of Figure 2. We detected 31 significant frequencies. An amplitude spectrum is shown in the third panel from the top of Figure 6, and we list the frequencies in Table 2. Given the spectral type and the detected frequencies, a ${\unicode{x03B4}}$
Sct classification is consistent with the observed properties.
${\unicode{x03B4}}$
Sct classification is consistent with the observed properties.
To identify potential large frequency spacings ( $\Delta \nu$
), we applied the K–S test using all available frequencies within the data set. Filtering was applied with no trends found within those K–S Tests. The results are shown in Figure 4. We can see two prominent troughs with a trough at 2.08 c/d and a wider trough at 2.7 c/d. We considered both observed spacings for the mass derivation.
$\Delta \nu$
), we applied the K–S test using all available frequencies within the data set. Filtering was applied with no trends found within those K–S Tests. The results are shown in Figure 4. We can see two prominent troughs with a trough at 2.08 c/d and a wider trough at 2.7 c/d. We considered both observed spacings for the mass derivation.
We applied the $\Delta\nu\propto\sqrt{\bar{\rho}}$
scaling relation to estimate the mean stellar density. For the trough at 2.08 c/d, this yielded a mean density of
$\Delta\nu\propto\sqrt{\bar{\rho}}$
scaling relation to estimate the mean stellar density. For the trough at 2.08 c/d, this yielded a mean density of $\bar{\rho}$
= 0.06297(33) g cm
$\bar{\rho}$
= 0.06297(33) g cm $^{-3}$
. For the trough at 2.7 c/d, the corresponding value was
$^{-3}$
. For the trough at 2.7 c/d, the corresponding value was $\bar{\rho}$
= 0.107(6) g cm
$\bar{\rho}$
= 0.107(6) g cm $^{-3}$
. Using these derived mean densities and the Gaia DR3 surface gravity values, we estimated stellar masses of 10.5(8) and 3.72(8) M
$^{-3}$
. Using these derived mean densities and the Gaia DR3 surface gravity values, we estimated stellar masses of 10.5(8) and 3.72(8) M $_\odot$
, respectively. These masses are well above the expected range of 1.5–2.5 M
$_\odot$
, respectively. These masses are well above the expected range of 1.5–2.5 M $_\odot$
for
$_\odot$
for ${\unicode{x03B4}}$
Sct stars, indicating that both spacings are unlikely to correspond to the large frequency spacing. Alternatively, if
${\unicode{x03B4}}$
Sct stars, indicating that both spacings are unlikely to correspond to the large frequency spacing. Alternatively, if $\log(g/\text{cm}\,\text{s}^{-2})$
is reduced from the Gaia value 3.882 to 3.6 or 3.8, the resulting mass estimate is 1.54 or 2.11 M
$\log(g/\text{cm}\,\text{s}^{-2})$
is reduced from the Gaia value 3.882 to 3.6 or 3.8, the resulting mass estimate is 1.54 or 2.11 M $_\odot$
, respectively, for the 2.08 and 2.7c/d troughs, falling within the expected range.
$_\odot$
, respectively, for the 2.08 and 2.7c/d troughs, falling within the expected range.
TIC 126209897 was not known to be a variable star prior to the TESS mission. We report results for the TESS Sector 61 data set. We detected nine significant frequencies. An amplitude spectrum is shown in the fourth panel from the top of Figure 6, and we list the frequencies in Table 1. A spectrogram from the SAAO campaign indicates an A8 spectral type and is shown in the third panel from the top of Figure 2. Given the spectral type and the detected frequencies a ${\unicode{x03B4}}$
Sct classification is consistent with the observed properties.
${\unicode{x03B4}}$
Sct classification is consistent with the observed properties.
Close-ups of the amplitude spectra of stars analysed in this work.

TIC 140818897 was flagged as a variable star by the Gaia Collaboration et al. (Reference Collaboration2023 but no specific type of variability has been reported. We give results for the TESS Sector 61 data where we detected five significant frequencies, with three in the higher-frequency region and two in the lower frequency region. An amplitude spectrum is shown in the third panel from the bottom of Figure 6, and we list the frequencies in Table 2. A spectrogram from the SAAO campaign indicates an A0 spectral type and is shown in the third panel from the bottom of Figure 2. Given the spectral type and the detected frequencies, a ${\unicode{x03B4}}$
Sct/
${\unicode{x03B4}}$
Sct/ ${\unicode{x03B3}}$
Dor hybrid classification is consistent with the observed properties.
${\unicode{x03B3}}$
Dor hybrid classification is consistent with the observed properties.
TIC 145812196 was flagged as a variable star by the Gaia Collaboration et al. (Reference Collaboration2023). No specific type of variability was reported and there is no available spectroscopic data for this star within the Gaia catalogue. A spectrogram from the SAAO campaign indicates an A8 spectral type based on the K line and the G band, but as early as A5 based on the metal content. The spectrum is shown in the third panel from the bottom of Figure 2. We report results for the TESS Sector 38 data; we detected 12 significant frequencies, with eight in the higher-frequency region and four in the lower frequency region. An amplitude spectrum is shown in the second panel from the bottom of Figure 6, and we list the frequencies in Table 2. Given the spectral type and the detected frequencies, a ${\unicode{x03B4}}$
Sct/
${\unicode{x03B4}}$
Sct/ ${\unicode{x03B3}}$
Dor hybrid classification is consistent with the observed properties.
${\unicode{x03B3}}$
Dor hybrid classification is consistent with the observed properties.
TIC 155018386 was not known to be a variable star prior to the TESS mission. We report results for the TESS Sectors 44–45 combined data. Although no spectral classification has been reported, the $T_{\mathrm{eff}}$
and
$T_{\mathrm{eff}}$
and $\log\,g$
values from Gaia DR3 seen in Table 1 indicate an A/F spectral type. We detected 12 significant frequencies. The amplitude spectrum is shown in the bottom panel in Figure 6, and we list the frequencies in Table 2. Spectrograms from the SAAO campaign indicate an A5 spectral type and are shown in the bottom panel of Figure 2. Given the spectral type and detected frequencies, a
$\log\,g$
values from Gaia DR3 seen in Table 1 indicate an A/F spectral type. We detected 12 significant frequencies. The amplitude spectrum is shown in the bottom panel in Figure 6, and we list the frequencies in Table 2. Spectrograms from the SAAO campaign indicate an A5 spectral type and are shown in the bottom panel of Figure 2. Given the spectral type and detected frequencies, a ${\unicode{x03B4}}$
Sct classification is consistent with the observed properties.
${\unicode{x03B4}}$
Sct classification is consistent with the observed properties.
TIC 166983732 was flagged as a variable star by the Gaia Collaboration et al. (Reference Collaboration2023) but no specific type of variability was reported. We give results for the TESS Sector 33 data. Although no spectral classification has been reported, the $T_{\mathrm{eff}}$
and
$T_{\mathrm{eff}}$
and $\log\,g$
values from Gaia DR3 seen in Table 1 indicate an A/F spectral classification. We detected 14 significant frequencies which are listed in Table 2. The amplitude spectrum is shown in the top panel of Figure 7. Given the spectral type and detected frequencies, a
$\log\,g$
values from Gaia DR3 seen in Table 1 indicate an A/F spectral classification. We detected 14 significant frequencies which are listed in Table 2. The amplitude spectrum is shown in the top panel of Figure 7. Given the spectral type and detected frequencies, a ${\unicode{x03B4}}$
Sct classification is consistent with the observed properties.
${\unicode{x03B4}}$
Sct classification is consistent with the observed properties.
A frequency spacing of 1.69 c/d was found using the K–S test shown in Figure 4. We applied the $\Delta\nu\propto\sqrt{\bar{\rho}}$
scaling relation to estimate the mean stellar density which gave a value of
$\Delta\nu\propto\sqrt{\bar{\rho}}$
scaling relation to estimate the mean stellar density which gave a value of $\bar{\rho}$
= 0.0412 (6) g cm
$\bar{\rho}$
= 0.0412 (6) g cm $^{-3}$
. Using this density and the Gaia DR3 surface gravity values, we derived a stellar mass of 46.1 (5.2) M
$^{-3}$
. Using this density and the Gaia DR3 surface gravity values, we derived a stellar mass of 46.1 (5.2) M $_\odot$
. This is well above the expected range of 1.5–2.5 M
$_\odot$
. This is well above the expected range of 1.5–2.5 M $_\odot$
for
$_\odot$
for ${\unicode{x03B4}}$
Sct stars, indicating that the 1.69 c/d spacing is unlikely to correspond to the large frequency spacing. Alternatively, if
${\unicode{x03B4}}$
Sct stars, indicating that the 1.69 c/d spacing is unlikely to correspond to the large frequency spacing. Alternatively, if $\log(g/\text{cm}\,\text{s}^{-2})$
is reduced from the Gaia value 3.97 to 3.5, the resulting mass estimate is 1.8 M
$\log(g/\text{cm}\,\text{s}^{-2})$
is reduced from the Gaia value 3.97 to 3.5, the resulting mass estimate is 1.8 M $_\odot$
, falling within the expected range.
$_\odot$
, falling within the expected range.
TIC 166983790 was not known to be a variable star prior to the TESS mission. Although no spectral classification has been reported, the $T_{\mathrm{eff}}$
and
$T_{\mathrm{eff}}$
and $\log\,g$
values from Gaia DR3 seen in Table 1 indicate an A/F spectral classification. We report results for the TESS Sector 33 data from which we detected 14 significant frequencies. The amplitude spectrum is shown in the second panel from the top of Figure 7, and we list the frequencies in Table 2. Given the spectral type and detected frequencies, a
$\log\,g$
values from Gaia DR3 seen in Table 1 indicate an A/F spectral classification. We report results for the TESS Sector 33 data from which we detected 14 significant frequencies. The amplitude spectrum is shown in the second panel from the top of Figure 7, and we list the frequencies in Table 2. Given the spectral type and detected frequencies, a ${\unicode{x03B4}}$
Sct/
${\unicode{x03B4}}$
Sct/ ${\unicode{x03B3}}$
Dor hybrid classification is consistent with the observed properties.
${\unicode{x03B3}}$
Dor hybrid classification is consistent with the observed properties.
Same as in Figure 5 but for another seven stars.

Same as in Figure 5 but for another seven stars.

TIC 184420457 was identified as a short-timescale variable star by the Gaia Collaboration et al. (Reference Collaboration2023) and we report results for the TESS Sectors 54–55 combined data. Although no spectral classification has been reported, the $T_{\mathrm{eff}}$
and
$T_{\mathrm{eff}}$
and $\log\,g$
values from Gaia DR3 seen in Table 1 indicate an A/F spectral classification. We detected 12 significant frequencies. The amplitude spectrum is shown in the third panel from the top of Figure 7, and we list the frequencies in Table 2. Given the spectral type and detected frequencies, a
$\log\,g$
values from Gaia DR3 seen in Table 1 indicate an A/F spectral classification. We detected 12 significant frequencies. The amplitude spectrum is shown in the third panel from the top of Figure 7, and we list the frequencies in Table 2. Given the spectral type and detected frequencies, a ${\unicode{x03B4}}$
Sct classification is consistent with the observed properties.
${\unicode{x03B4}}$
Sct classification is consistent with the observed properties.
TIC 210196124 was not known to be a variable star prior to the TESS mission and we report results for the TESS Sector 55 data. Although no spectral classification has been reported, the $T_{\mathrm{eff}}$
and
$T_{\mathrm{eff}}$
and $\log\,g$
values from Gaia DR3 seen in Table 1 indicate an A/F spectral classification. We detected nine significant frequencies, with eight in the higher-frequency region and one in the lower frequency region. We show an amplitude spectrum in the fourth panel from the top of Figure 7, and we list the frequencies in Table 2. Based on the spectral type and detected frequencies, a
$\log\,g$
values from Gaia DR3 seen in Table 1 indicate an A/F spectral classification. We detected nine significant frequencies, with eight in the higher-frequency region and one in the lower frequency region. We show an amplitude spectrum in the fourth panel from the top of Figure 7, and we list the frequencies in Table 2. Based on the spectral type and detected frequencies, a ${\unicode{x03B4}}$
Sct/
${\unicode{x03B4}}$
Sct/ ${\unicode{x03B3}}$
Dor hybrid candidate classification is consistent with the observed properties.
${\unicode{x03B3}}$
Dor hybrid candidate classification is consistent with the observed properties.
TIC 214116117 was not known to be a variable star prior to the TESS mission. There are no atmospheric parameters available for this star within the Gaia catalogue, and we found no other sources of spectroscopic data. We report results for the TESS Sectors 40–41 combined data. We detected 18 significant frequencies and an amplitude spectrum is shown in the third panel from the bottom of Figure 7. We list the frequencies in Table 2. If the spectral type is confirmed to be late A or early F, a ${\unicode{x03B4}}$
Sct classification is consistent with current photometric data.
${\unicode{x03B4}}$
Sct classification is consistent with current photometric data.
TIC 233683339 was not known to be a variable star prior to the TESS mission. We report results for TESS Sectors 56–60 combined data. Although no spectral classification has been reported, the $T_{\mathrm{eff}}$
and
$T_{\mathrm{eff}}$
and $\log\,g$
values from Gaia DR3 seen in Table 1 indicate an A/F spectral classification. We detected 33 frequencies and the amplitude spectrum is shown in the second panel from the bottom of Figure 7, with the detected frequencies listed in Table 2. Based on the spectral type and detected frequencies, a
$\log\,g$
values from Gaia DR3 seen in Table 1 indicate an A/F spectral classification. We detected 33 frequencies and the amplitude spectrum is shown in the second panel from the bottom of Figure 7, with the detected frequencies listed in Table 2. Based on the spectral type and detected frequencies, a ${\unicode{x03B3}}$
Dor classification is consistent with the observed properties.
${\unicode{x03B3}}$
Dor classification is consistent with the observed properties.
TIC 262753655 was found to be a variable star by the Gaia Collaboration et al. (Reference Collaboration2023) but no specific type of variability was reported. There are no atmospheric parameters available for this star within the Gaia catalogue, and we found no other sources of spectroscopic data. We report results for the TESS Sectors 44–46 combined data in which we detected 90 significant frequencies. An amplitude spectrum is shown in the bottom panel of Figure 7, and we list the frequencies in Table 2. If the spectral type is confirmed to be late A or early F, a ${\unicode{x03B4}}$
Sct/
${\unicode{x03B4}}$
Sct/ ${\unicode{x03B3}}$
Dor hybrid candidate classification is consistent with current photometric data.
${\unicode{x03B3}}$
Dor hybrid candidate classification is consistent with current photometric data.
While searching for rotationally split multiplets, we found a candidate quintuplet, i.e. $f_{10}$
,
$f_{10}$
, $f_{11}$
,
$f_{11}$
, $f_{12}$
, and
$f_{12}$
, and $f_{13}$
, with a missing central component. We derived an average splitting of 0.16903(12) c/d corresponding to a rotation period of
$f_{13}$
, with a missing central component. We derived an average splitting of 0.16903(12) c/d corresponding to a rotation period of $P_{\mathrm{rot}}$
= 5.9160(41) d.
$P_{\mathrm{rot}}$
= 5.9160(41) d.
TIC 263291583 was flagged as a variable star by the Gaia Collaboration et al. (Reference Collaboration2023), however no specific type of variability was reported. We report results for the TESS Sector 33 data. Although no spectral classification has been reported, the $T_{\mathrm{eff}}$
and
$T_{\mathrm{eff}}$
and $\log\,g$
values from Gaia DR3 seen in Table 1 indicate an A/F spectral classification. We detected 14 significant frequencies; an amplitude spectrum is shown in the top panel of Figure 8, and we list the frequencies in Table 2. Given the spectral type and detected frequencies, a
$\log\,g$
values from Gaia DR3 seen in Table 1 indicate an A/F spectral classification. We detected 14 significant frequencies; an amplitude spectrum is shown in the top panel of Figure 8, and we list the frequencies in Table 2. Given the spectral type and detected frequencies, a ${\unicode{x03B4}}$
Sct classification is consistent with the observed properties.
${\unicode{x03B4}}$
Sct classification is consistent with the observed properties.
TIC 264026826 was classified as F0-type by Cruzalèbes et al. (Reference Cruzalèbes2019), while (Mason et al. Reference Mason, Wycoff, Hartkopf, Douglass and Worley2001) listed the star as a double or multiple system. It was not known to be a pulsating star before the TESS mission. We report results for the TESS Sectors 58–60 combined data in which we detected 58 significant frequencies. We show an amplitude spectrum in the second panel from the top of Figure 8, and we list the frequencies in Table 2. Given the spectral type, along with the detected frequencies, a ${\unicode{x03B4}}$
Sct/
${\unicode{x03B4}}$
Sct/ ${\unicode{x03B3}}$
Dor hybrid classification of the pulsator component(s) in this binary system is consistent with the observed properties.
${\unicode{x03B3}}$
Dor hybrid classification of the pulsator component(s) in this binary system is consistent with the observed properties.
Same as in Figure 5 but for another seven stars.

TIC 281539086 was flagged as a variable star by the Gaia Collaboration et al. (Reference Collaboration2023) but no specific type of variability was reported. We give results for the TESS Sector 33 data in which we detected eight significant frequencies. An amplitude spectrum is shown in the third panel from the top of Figure 8, and we list the frequencies in Table 2. Ground-based spectra from the SAAO campaign indicate either an F0 spectral type (based on the weak G band, top panel of Figure 2) or F5 (based on the much stronger G band seen in the second panel from the top of Figure 2). Given the spectral type and detected frequencies a ${\unicode{x03B4}}$
Sct classification is consistent with the observed properties.
${\unicode{x03B4}}$
Sct classification is consistent with the observed properties.
TIC 285540817 was flagged as a variable star by the Gaia Collaboration et al. (Reference Collaboration2023) but no specific type of variability was reported. We give results for the TESS Sector 33 data. Although no spectral classification has been reported, the $T_{\mathrm{eff}}$
and
$T_{\mathrm{eff}}$
and $\log\,g$
values from Gaia DR3 seen in Table 1 indicate an A/F spectral classification. We detected 28 significant frequencies. An amplitude spectrum is shown in the fourth panel from the top of Figure 8, and we list the frequencies in Table 2. Given the spectral type and the detected frequencies a
$\log\,g$
values from Gaia DR3 seen in Table 1 indicate an A/F spectral classification. We detected 28 significant frequencies. An amplitude spectrum is shown in the fourth panel from the top of Figure 8, and we list the frequencies in Table 2. Given the spectral type and the detected frequencies a ${\unicode{x03B4}}$
Sct classification is consistent with the observed properties.
${\unicode{x03B4}}$
Sct classification is consistent with the observed properties.
TIC 287959218 was not known to be a variable star prior to the TESS mission. Cruzalèbes et al. (Reference Cruzalèbes2019) classified the star as A9V. We report results for the TESS Sector 33 data. We detected 27 significant frequencies, with 20 in the higher-frequency region and seven in the lower frequency region. An amplitude spectrum is shown in the third panel from the bottom of Figure 8, and we list the frequencies in Table 2. A spectrum from the SAAO campaign indicated a type F0 from the appearance of the G band, about A5 from the K line, and somewhere in between for the metals, hence our type A5-F0 (Table 1), which is shown in third panel from the top of Figure 2. Given the spectral type and the detected frequencies a ${\unicode{x03B4}}$
Sct/
${\unicode{x03B4}}$
Sct/ ${\unicode{x03B3}}$
Dor hybrid classification is consistent with the observed properties.
${\unicode{x03B3}}$
Dor hybrid classification is consistent with the observed properties.
TIC 289531891 was not known to be a variable star prior to the TESS mission. It was classified as A5-type by Cruzalèbes et al. (Reference Cruzalèbes2019) and we report results for the TESS Sectors 53 and 54 combined data. We detected 43 significant frequencies. An amplitude spectrum is shown in the second panel from the bottom of Figure 8 and we list the frequencies in Table 2. Given the spectral type, along with the detected frequencies a ${\unicode{x03B4}}$
Sct classification is consistent with the observed properties.
${\unicode{x03B4}}$
Sct classification is consistent with the observed properties.
To identify $\Delta\nu$
, we applied the K–S test using all available frequencies. Filtering was applied, however no clear trends were observed in the filtered results. The outcome of the test is shown in Figure 4, where we observe a prominent trough at 1.95 c/d. We applied the
$\Delta\nu$
, we applied the K–S test using all available frequencies. Filtering was applied, however no clear trends were observed in the filtered results. The outcome of the test is shown in Figure 4, where we observe a prominent trough at 1.95 c/d. We applied the $\Delta\nu\propto\sqrt{\bar{\rho}}$
scaling relation to estimate the mean stellar density. This yielded
$\Delta\nu\propto\sqrt{\bar{\rho}}$
scaling relation to estimate the mean stellar density. This yielded $\bar{\rho}$
= 0.05520 (43) g cm
$\bar{\rho}$
= 0.05520 (43) g cm $^{-3}$
. Using this density and the Gaia DR3 surface gravity values, we derived a stellar mass of 8.0 (6) M
$^{-3}$
. Using this density and the Gaia DR3 surface gravity values, we derived a stellar mass of 8.0 (6) M $_\odot$
– well above the expected range of 1.5–2.5 M
$_\odot$
– well above the expected range of 1.5–2.5 M $_\odot$
for
$_\odot$
for ${\unicode{x03B4}}$
Sct stars, indicating that the 1.95 c/d spacing is unlikely to correspond to the true large frequency spacing. Alternatively, if
${\unicode{x03B4}}$
Sct stars, indicating that the 1.95 c/d spacing is unlikely to correspond to the true large frequency spacing. Alternatively, if $\log(g/\text{cm}\,\text{s}^{-2})$
is reduced from the Gaia value 3.802 to 3.6, the resulting mass estimate is 2 M
$\log(g/\text{cm}\,\text{s}^{-2})$
is reduced from the Gaia value 3.802 to 3.6, the resulting mass estimate is 2 M $_\odot$
, within the expected range.
$_\odot$
, within the expected range.
While searching for rotationally split multiplets, we identified one candidate triplet formed by $f_{32}$
,
$f_{32}$
, $f_{33}$
and
$f_{33}$
and $f_{34}$
, with an average splitting of frequency splitting of 0.36379(30) c/d. The corresponding average rotational period is
$f_{34}$
, with an average splitting of frequency splitting of 0.36379(30) c/d. The corresponding average rotational period is $P_{\mathrm{rot}}$
= 2.7488(22) d.
$P_{\mathrm{rot}}$
= 2.7488(22) d.
TIC 309034228 was not known to be a variable star prior to the TESS mission. We report results for the TESS Sector 64 and 65 combined data where we detected seven significant frequencies. An amplitude spectrum is shown in the bottom panel of Figure 8, and we list the frequencies in Table 2. A spectrogram from the SAAO campaign indicates a type A8-A9 from the K line and about F0-F1 from the G band, hence our type A8-F0 (Table 1), which is shown in the third panel from the bottom of Figure 3. Given the spectral type and detected frequencies, a ${\unicode{x03B4}}$
Sct classification is consistent with current photometric data.
${\unicode{x03B4}}$
Sct classification is consistent with current photometric data.
TIC 318720437 was not known to be a variable star prior to the TESS mission. We report results for the TESS Sector 65 data in which we detected 22 significant frequencies. An amplitude spectrum is shown in the top panel of Figure 9, and we list the frequencies in Table 2. A spectrogram from the SAAO campaign indicates an A2 spectral type and is shown in the second panel from the bottom of Figure 3. Given the spectral type and the detected frequencies a ${\unicode{x03B4}}$
Sct classification is consistent with current photometric data.
${\unicode{x03B4}}$
Sct classification is consistent with current photometric data.
Same as in Figure 5 but for another seven stars.

TIC 365496236 was not known to be a variable star prior to the TESS mission. There are no atmospheric parameters available for this star within the Gaia catalogue, and we found no other sources of spectroscopic data. We report results for the TESS Sector 56 data in which we detected 11 significant frequencies. An amplitude spectrum is shown in the second panel from the top of Figure 9, and we list the frequencies in Table 2. If the spectral type is confirmed to be late A or early F, a ${\unicode{x03B4}}$
Sct classification is consistent with current photometric data.
${\unicode{x03B4}}$
Sct classification is consistent with current photometric data.
TIC 396013343 was flagged as a variable star by the Gaia Collaboration et al. (Reference Collaboration2023) but no specific type of variability was noted. Although no spectral classification has been reported, the $T_{\mathrm{eff}}$
and
$T_{\mathrm{eff}}$
and $\log\,g$
values from Gaia DR3 seen in Table 1 indicate an A/F spectral classification. We report results for the TESS Sector 52 data. We detected 31 significant frequencies, with 16 in the higher-frequency region and 15 in the lower frequency region. We show an amplitude spectrum in the third panel from the top of Figure 9, and we list the frequencies in Table 2. Given the spectral type and the detected frequencies, a
$\log\,g$
values from Gaia DR3 seen in Table 1 indicate an A/F spectral classification. We report results for the TESS Sector 52 data. We detected 31 significant frequencies, with 16 in the higher-frequency region and 15 in the lower frequency region. We show an amplitude spectrum in the third panel from the top of Figure 9, and we list the frequencies in Table 2. Given the spectral type and the detected frequencies, a ${\unicode{x03B4}}$
Sct/
${\unicode{x03B4}}$
Sct/ ${\unicode{x03B3}}$
Dor hybrid classification is consistent with the observed properties.
${\unicode{x03B3}}$
Dor hybrid classification is consistent with the observed properties.
TIC 399171933 was flagged as a variable star by the Gaia Collaboration et al. (Reference Collaboration2023) but no specific type of variability was noted. We give results for the TESS Sector 55 data. Although no spectral classification has been reported, the $T_{\mathrm{eff}}$
and
$T_{\mathrm{eff}}$
and $\log\,g$
values from Gaia DR3 seen in Table 1 indicate an A/F spectral classification. We detected four significant frequencies; an amplitude spectrum is shown in the fourth panel from the top of Figure 9, and we list the frequencies in Table 2. Given the spectral type and the detected frequencies a
$\log\,g$
values from Gaia DR3 seen in Table 1 indicate an A/F spectral classification. We detected four significant frequencies; an amplitude spectrum is shown in the fourth panel from the top of Figure 9, and we list the frequencies in Table 2. Given the spectral type and the detected frequencies a ${\unicode{x03B4}}$
Sct classification is consistent with the observed properties.
${\unicode{x03B4}}$
Sct classification is consistent with the observed properties.
TIC 407425104 was flagged as a variable star by the Gaia Collaboration et al. (Reference Collaboration2023) but no specific type of variability was noted. There are no atmospheric parameters available for this star within the Gaia catalogue, and we found no other sources of spectroscopic data. We report results for the TESS Sector 52 data in which we detected 41 significant frequencies, with 40 in the higher-frequency region and one in the lower frequency region. An amplitude spectrum is shown in the third panel from the bottom of Figure 9, and we list the frequencies in Table 2. If the spectral type is confirmed to be late A or early F, a ${\unicode{x03B4}}$
Sct/
${\unicode{x03B4}}$
Sct/ ${\unicode{x03B3}}$
Dor hybrid candidate would appear consistent with current photometric data.
${\unicode{x03B3}}$
Dor hybrid candidate would appear consistent with current photometric data.
TIC 417677656 was flagged as a variable star by the Gaia Collaboration et al. (Reference Collaboration2023), while it was classified as a pulsating variable with a spectral type of F0III by Frasca et al. (Reference Frasca2016). We report results for the TESS Sector 54–56 combined data. We detected 66 significant frequencies, with 64 in the higher-frequency and two in the lower frequency regions, with the latter to be likely a signature of binarity. The amplitude spectrum is shown in the second panel from the bottom in Figure 9, and we list the frequencies in Table 2. Given the spectral type and the detected frequencies a ${\unicode{x03B4}}$
Sct classification is consistent with the observed properties.
${\unicode{x03B4}}$
Sct classification is consistent with the observed properties.
TIC 421817857 was not known to be a variable star prior to the TESS mission. Although no spectral classification has been reported, the $T_{\mathrm{eff}}$
and
$T_{\mathrm{eff}}$
and $\log\,g$
values from Gaia DR3 seen in Table 1 indicate an A/F spectral classification. We give results for the TESS Sector 52 data. We detected 14 significant frequencies, with two of them to be probably a signature of binarity. We show an amplitude spectrum in the bottom panel of Figure 9, and we list the frequencies in Table 2. Given the spectral type and the detected frequencies a
$\log\,g$
values from Gaia DR3 seen in Table 1 indicate an A/F spectral classification. We give results for the TESS Sector 52 data. We detected 14 significant frequencies, with two of them to be probably a signature of binarity. We show an amplitude spectrum in the bottom panel of Figure 9, and we list the frequencies in Table 2. Given the spectral type and the detected frequencies a ${\unicode{x03B4}}$
Sct classification is consistent with the observed properties.
${\unicode{x03B4}}$
Sct classification is consistent with the observed properties.
TIC 425291950 was identified as a short-timescale, main sequence pulsator by the Gaia Collaboration et al. (Reference Collaboration2023). Although no spectral classification has been reported, the $T_{\mathrm{eff}}$
and
$T_{\mathrm{eff}}$
and $\log\,g$
values from Gaia DR3 seen in Table 1 indicate an A/F spectral classification. We report results for the TESS Sector 54 data. We detected 19 significant frequencies, with 17 in the higher-frequency region and two in the lower frequency region. We show an amplitude spectrum in the top panel of Figure 10, and we list the frequencies in Table 2. Given the spectral type and the detected frequencies a
$\log\,g$
values from Gaia DR3 seen in Table 1 indicate an A/F spectral classification. We report results for the TESS Sector 54 data. We detected 19 significant frequencies, with 17 in the higher-frequency region and two in the lower frequency region. We show an amplitude spectrum in the top panel of Figure 10, and we list the frequencies in Table 2. Given the spectral type and the detected frequencies a ${\unicode{x03B4}}$
Sct/
${\unicode{x03B4}}$
Sct/ ${\unicode{x03B3}}$
Dor hybrid classification is consistent with the observed properties.
${\unicode{x03B3}}$
Dor hybrid classification is consistent with the observed properties.
TIC 425819615 was classified A5V by Houk (Reference Houk1978) and is listed as a double or multiple star system in the catalogue of Components of Double & Multiple stars (Wilson Reference Wilson1982). It was not known to be a pulsating star before the TESS mission. We report results for the TESS Sector 27 data. We detected 36 significant frequencies, with 31 in the higher-frequency region and five in the lower frequency region. We show an amplitude spectrum in the second panel from the top of Figure 10, and we list the frequencies in Table 2. Given the spectral type and the detected frequencies a ${\unicode{x03B4}}$
Sct/
${\unicode{x03B4}}$
Sct/ ${\unicode{x03B3}}$
Dor hybrid classification is consistent with the observed properties.
${\unicode{x03B3}}$
Dor hybrid classification is consistent with the observed properties.
Same as in Figure 5 but for another eight stars.

Figure 4 shows the K–S test results. There is a trough at 5.8 c/d and twice that spacing. Since there is no Gaia DR3 data available for this star, including $T_{\mathrm{eff}}$
and
$T_{\mathrm{eff}}$
and $\log\,g$
, we were unable to derive a mass estimate for this pulsator.
$\log\,g$
, we were unable to derive a mass estimate for this pulsator.
While searching for rotationally split multiplets we found a doublet, formed by $f_{12}$
and
$f_{12}$
and $f_{13}$
with a splitting of 1.222(8) c/d. This corresponds to a rotation period of approximately 0.819(5) d.
$f_{13}$
with a splitting of 1.222(8) c/d. This corresponds to a rotation period of approximately 0.819(5) d.
TIC 428055283 was flagged as a variable star by the Gaia Collaboration et al. (Reference Collaboration2023) and has a reported spectral type of A2 (Cannon & Pickering Reference Cannon and Pickering1918, Reference Cannon and Pickering1993). We report results for the TESS Sector 68 data in which we detected 90 significant frequencies, with 83 in the higher-frequency region and six in the lower frequency region. We show an amplitude spectrum in the third panel from the top of Figure 10, and list the frequencies in Table 2. Given the spectral type and the detected frequencies a ${\unicode{x03B4}}$
Sct/
${\unicode{x03B4}}$
Sct/ ${\unicode{x03B3}}$
Dor hybrid classification is consistent with the observed properties. A candidate multiplet was found at
${\unicode{x03B3}}$
Dor hybrid classification is consistent with the observed properties. A candidate multiplet was found at $f_{14}$
,
$f_{14}$
, $f_{15}$
and
$f_{15}$
and $f_{16}$
, with an average frequency splitting of 0.3226(25) c/d, corresponding to a rotation period of 3.0992(25) d, which suggests the star could be a moderate to rapid rotator.
$f_{16}$
, with an average frequency splitting of 0.3226(25) c/d, corresponding to a rotation period of 3.0992(25) d, which suggests the star could be a moderate to rapid rotator.
To identify $\Delta\nu$
, we applied the K–S test using all available frequencies. Filtering was applied, but no clear trends were observed in the filtered results. The outcome of the test is shown in Figure 4, where we observe a prominent trough at 1.71 c/d. We applied the
$\Delta\nu$
, we applied the K–S test using all available frequencies. Filtering was applied, but no clear trends were observed in the filtered results. The outcome of the test is shown in Figure 4, where we observe a prominent trough at 1.71 c/d. We applied the $\Delta\nu\propto\sqrt{\bar{\rho}}$
scaling relation to estimate a mean stellar density of
$\Delta\nu\propto\sqrt{\bar{\rho}}$
scaling relation to estimate a mean stellar density of $\bar{\rho}$
= 0.0422 (6) g cm
$\bar{\rho}$
= 0.0422 (6) g cm $^{-3}$
. With this density and the Gaia DR3 surface gravity values, we derived a stellar mass of 8.28 (30) M
$^{-3}$
. With this density and the Gaia DR3 surface gravity values, we derived a stellar mass of 8.28 (30) M $_\odot$
, well above the expected range of 1.5–2.5 M
$_\odot$
, well above the expected range of 1.5–2.5 M $_\odot$
for
$_\odot$
for ${\unicode{x03B4}}$
Sct stars, indicating that the 1.71 c/d spacing is unlikely to correspond to the true large frequency spacing. Alternatively, if
${\unicode{x03B4}}$
Sct stars, indicating that the 1.71 c/d spacing is unlikely to correspond to the true large frequency spacing. Alternatively, if $\log(g/\text{cm}\,\text{s}^{-2})$
is reduced from the Gaia value 3.728 to 3.5, the resulting mass estimate is 1.71 M
$\log(g/\text{cm}\,\text{s}^{-2})$
is reduced from the Gaia value 3.728 to 3.5, the resulting mass estimate is 1.71 M $_\odot$
, falling within the expected range.
$_\odot$
, falling within the expected range.
TIC 445028229 was flagged as a variable star by the Gaia Collaboration et al. (Reference Collaboration2023) but no specific type of variability was listed. We report results for the TESS Sector 60 data. An amplitude spectrum is shown in the fourth panel from the top of Figure 10, and we list the frequencies in Table 2. We detected four frequencies, with three of them being multiples of the lowest frequency leading us to favour a binary origin for the variability and not pulsations. The orbital period is 0.3274118(8) d and we do not consider this star to be a pulsating variable.
TIC 456643058 was reported as an eclipsing binary by the Gaia Collaboration et al. (Reference Collaboration2023). We report results for the TESS Sector 55 data. An amplitude spectrum is shown in the fourth panel from the bottom of Figure 10, and we list the frequencies in Table 2. We detected four frequencies, with three of them being multiples of the lowest frequency leading us to favour a binary origin for the variability and not pulsations. The orbital period is 0.3009210(14)) days and we do not consider this star to be a pulsating variable.
TIC 458334907 was not known to be a variable star prior to the TESS mission. We report results for the TESS Sector 63–64 combined data. We detected 27 significant frequencies, with 26 in the higher-frequency region and one in the lower frequency region. An amplitude spectrum is shown in the third panel from the bottom of Figure 6, and we list the frequencies in Table 2. A spectrogram from the SAAO campaign indicates an F1 spectral type and is shown in the bottom panel of Figure 3. Given the spectral type and detected frequencies ${\unicode{x03B4}}$
Sct/
${\unicode{x03B4}}$
Sct/ ${\unicode{x03B3}}$
Dor hybrid candidate classification is consistent with the observed properties.
${\unicode{x03B3}}$
Dor hybrid candidate classification is consistent with the observed properties.
TIC 461601525 was not known to be a variable star prior to the TESS mission. Rain, Ahumada, & Carraro (Reference Rain, Ahumada and Carraro2021) classified it as a blue straggler. We report results for the TESS Sector 18, 19 and 20 combined data. An amplitude spectrum is shown in the second panel from the bottom of Figure 8, and we list the frequencies in Table 2. Blue stragglers are known to exhibit ${\unicode{x03B4}}$
Sct-like pulsations, particularly in the form of metal-poor
${\unicode{x03B4}}$
Sct-like pulsations, particularly in the form of metal-poor ${\unicode{x03B4}}$
Sct stars or SX Phoenicis variables (McNamara Reference McNamara2011). The detection of 34 significant frequencies combined with the blue straggler classification, supports a
${\unicode{x03B4}}$
Sct stars or SX Phoenicis variables (McNamara Reference McNamara2011). The detection of 34 significant frequencies combined with the blue straggler classification, supports a ${\unicode{x03B4}}$
Sct classification.
${\unicode{x03B4}}$
Sct classification.
Figure 4 shows the K–S test results where the most significant frequency spacing, was determined to be 2.25 c/d. We applied the $\Delta \nu \propto \sqrt{\bar{\rho}}$
scaling relation to estimate a mean stellar density of
$\Delta \nu \propto \sqrt{\bar{\rho}}$
scaling relation to estimate a mean stellar density of $\bar{\rho}$
= 0.07391(16) g cm
$\bar{\rho}$
= 0.07391(16) g cm $^{-3}$
. With this and the Gaia DR3 surface gravity value, we derived a stellar mass of 8.3 (1.1) M
$^{-3}$
. With this and the Gaia DR3 surface gravity value, we derived a stellar mass of 8.3 (1.1) M $_\odot$
, well above the expected range of 1.5–2.5 M
$_\odot$
, well above the expected range of 1.5–2.5 M $_\odot$
for
$_\odot$
for ${\unicode{x03B4}}$
Sct stars, indicating that the 2.25 c/d spacing is unlikely to correspond to the true large frequency spacing. Alternatively, if
${\unicode{x03B4}}$
Sct stars, indicating that the 2.25 c/d spacing is unlikely to correspond to the true large frequency spacing. Alternatively, if $\log(g/\text{cm}\,\text{s}^{-2})$
is reduced from the Gaia value 3.891 to 3.7 or 3.65, the resulting mass estimate is 2.23 or 1.58 M
$\log(g/\text{cm}\,\text{s}^{-2})$
is reduced from the Gaia value 3.891 to 3.7 or 3.65, the resulting mass estimate is 2.23 or 1.58 M $_\odot$
– within the expected range.
$_\odot$
– within the expected range.
TIC 1972314711 was flagged as a variable star by the Gaia Collaboration et al. (Reference Collaboration2023) but no specific type of variability was listed. We report results for the TESS Sector 55–56 combined data. The amplitude spectrum is shown in the bottom panel of Figure 8, and we list the frequencies in Table 2. We detected three frequencies, with two of them being multiples of the lowest frequency leading us to favour a binary origin for the variability and not pulsations. The orbital period is 0.2219190 d and we do not consider this star to be a pulsating variable.
6. Summary
We have presented results of our analysis of TESS data of variable stars that have atmospheric parameters consistent with A/F spectral type. Not many of these stars were observed with TESS the short cadence and USC modes and we found them serendipitously while searching for pulsating compact stars. Since the pulsation frequencies from the gravity mode region of hot subdwarfs overlaps with the pressure mode region of ${\unicode{x03B4}}$
Scuti stars, the photometry alone does not unequivocally distinguish between these objects. So stars without spectral classification and showing pulsations in that overlap region were targeted for spectroscopy to remove main sequence pulsators from the compact star programme. Thus, they were a by-product of our main project but, given a significant number of them, we have reported them here along with additional analysis suitable for those pulsators.
${\unicode{x03B4}}$
Scuti stars, the photometry alone does not unequivocally distinguish between these objects. So stars without spectral classification and showing pulsations in that overlap region were targeted for spectroscopy to remove main sequence pulsators from the compact star programme. Thus, they were a by-product of our main project but, given a significant number of them, we have reported them here along with additional analysis suitable for those pulsators.
The stars in our sample were researched for any indication of their spectral types. We used Gaia $T_{\mathrm{eff}}$
and
$T_{\mathrm{eff}}$
and $\log(g/\text{cm}\,\text{s}^{-2})$
, spectral types reported by previous studies, or collected ground-based spectroscopy from SAAO. Altogether, we found 43 variable main sequence stars, with only four showing signatures of a binary variation, whereas the majority are pulsators of either
$\log(g/\text{cm}\,\text{s}^{-2})$
, spectral types reported by previous studies, or collected ground-based spectroscopy from SAAO. Altogether, we found 43 variable main sequence stars, with only four showing signatures of a binary variation, whereas the majority are pulsators of either ${\unicode{x03B4}}$
Scuti and/or
${\unicode{x03B4}}$
Scuti and/or ${\unicode{x03B3}}$
Doradus type.
${\unicode{x03B3}}$
Doradus type.
None of the stars was known to be variable prior to the TESS mission, so they were typically not observed at the shorter cadences. The light curves were extracted from Full Frame Images either by the TESS pipeline or using our custom software that is capable of producing light curves from individual pixels. We ran Fourier analyses to detect significant frequencies followed by a search for sequences of equally spaced frequencies (known as small and large separations) and rotationally split modes. We provided prewhitening solutions for all stars. The discussion of our findings of frequency separations and split modes is limited only to those cases that showed some prominent behaviour. Possible frequency separations were tested by means of the K–S test, followed by additional analysis to derive masses of the stars to confirm the validity of the separations. None of the discussed cases is certain enough to be considered a confirmed case, due to unreliable estimates of masses of those stars. However, we showed that a change of around 0.2 in $\log(g/\text{cm}\,\text{s}^{-2})$
brings the estimated mass into the right range.
$\log(g/\text{cm}\,\text{s}^{-2})$
brings the estimated mass into the right range.
Similarly, the search for rotationally induced modes resulted in sporadic frequencies, mostly doublets, that do not produce any convincing cases, so do not confirm detection of rotation. A lack of confirmed cases in both frequency separations and split modes is not unexpected. Notwithstanding the rich frequency spectra of many of the analysed stars, it is commonly known that A/F pulsators do not show prominent features indicative of the rotation or well organised frequency patterns.
We hope that our report will trigger TESS short cadence observations of these stars over a longer data span, potentially leading to detection of lower amplitude modes, which would complete the picture of frequency separations and split modes, allowing for convinced detection of masses and rotation of A/F pulsators.
Acknowledgements
We thank the anonymous referee for their valuable comments, which have significantly improved the quality of this manuscript. This paper includes data collected with the TESS mission, obtained from the MAST data archive at the Space Telescope Science Institute (STScI). Funding for the TESS mission is provided by the NASA Explorer Program. STScI is operated by the Association of Universities for Research in Astronomy, Inc., under NASA contract NAS 5-26555. This paper uses observations made at the South African Astronomical Observatory (SAAO). This research has made use of the SIMBAD database, operated at CDS, Strasbourg, France. This work has also made use of data from the European Space Agency (ESA) mission Gaia (https://www.cosmos.esa.int/gaia), processed by the Gaia Data Processing and Analysis Consortium (DPAC, https://www.cosmos.esa.int/web/gaia/dpac/consortium). Funding for the DPAC has been provided by national institutions, in particular the institutions participating in the Gaia Multilateral Agreement.
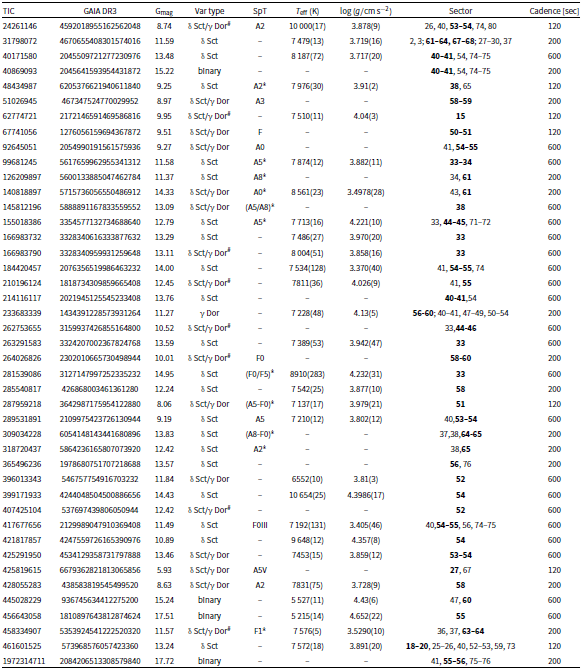
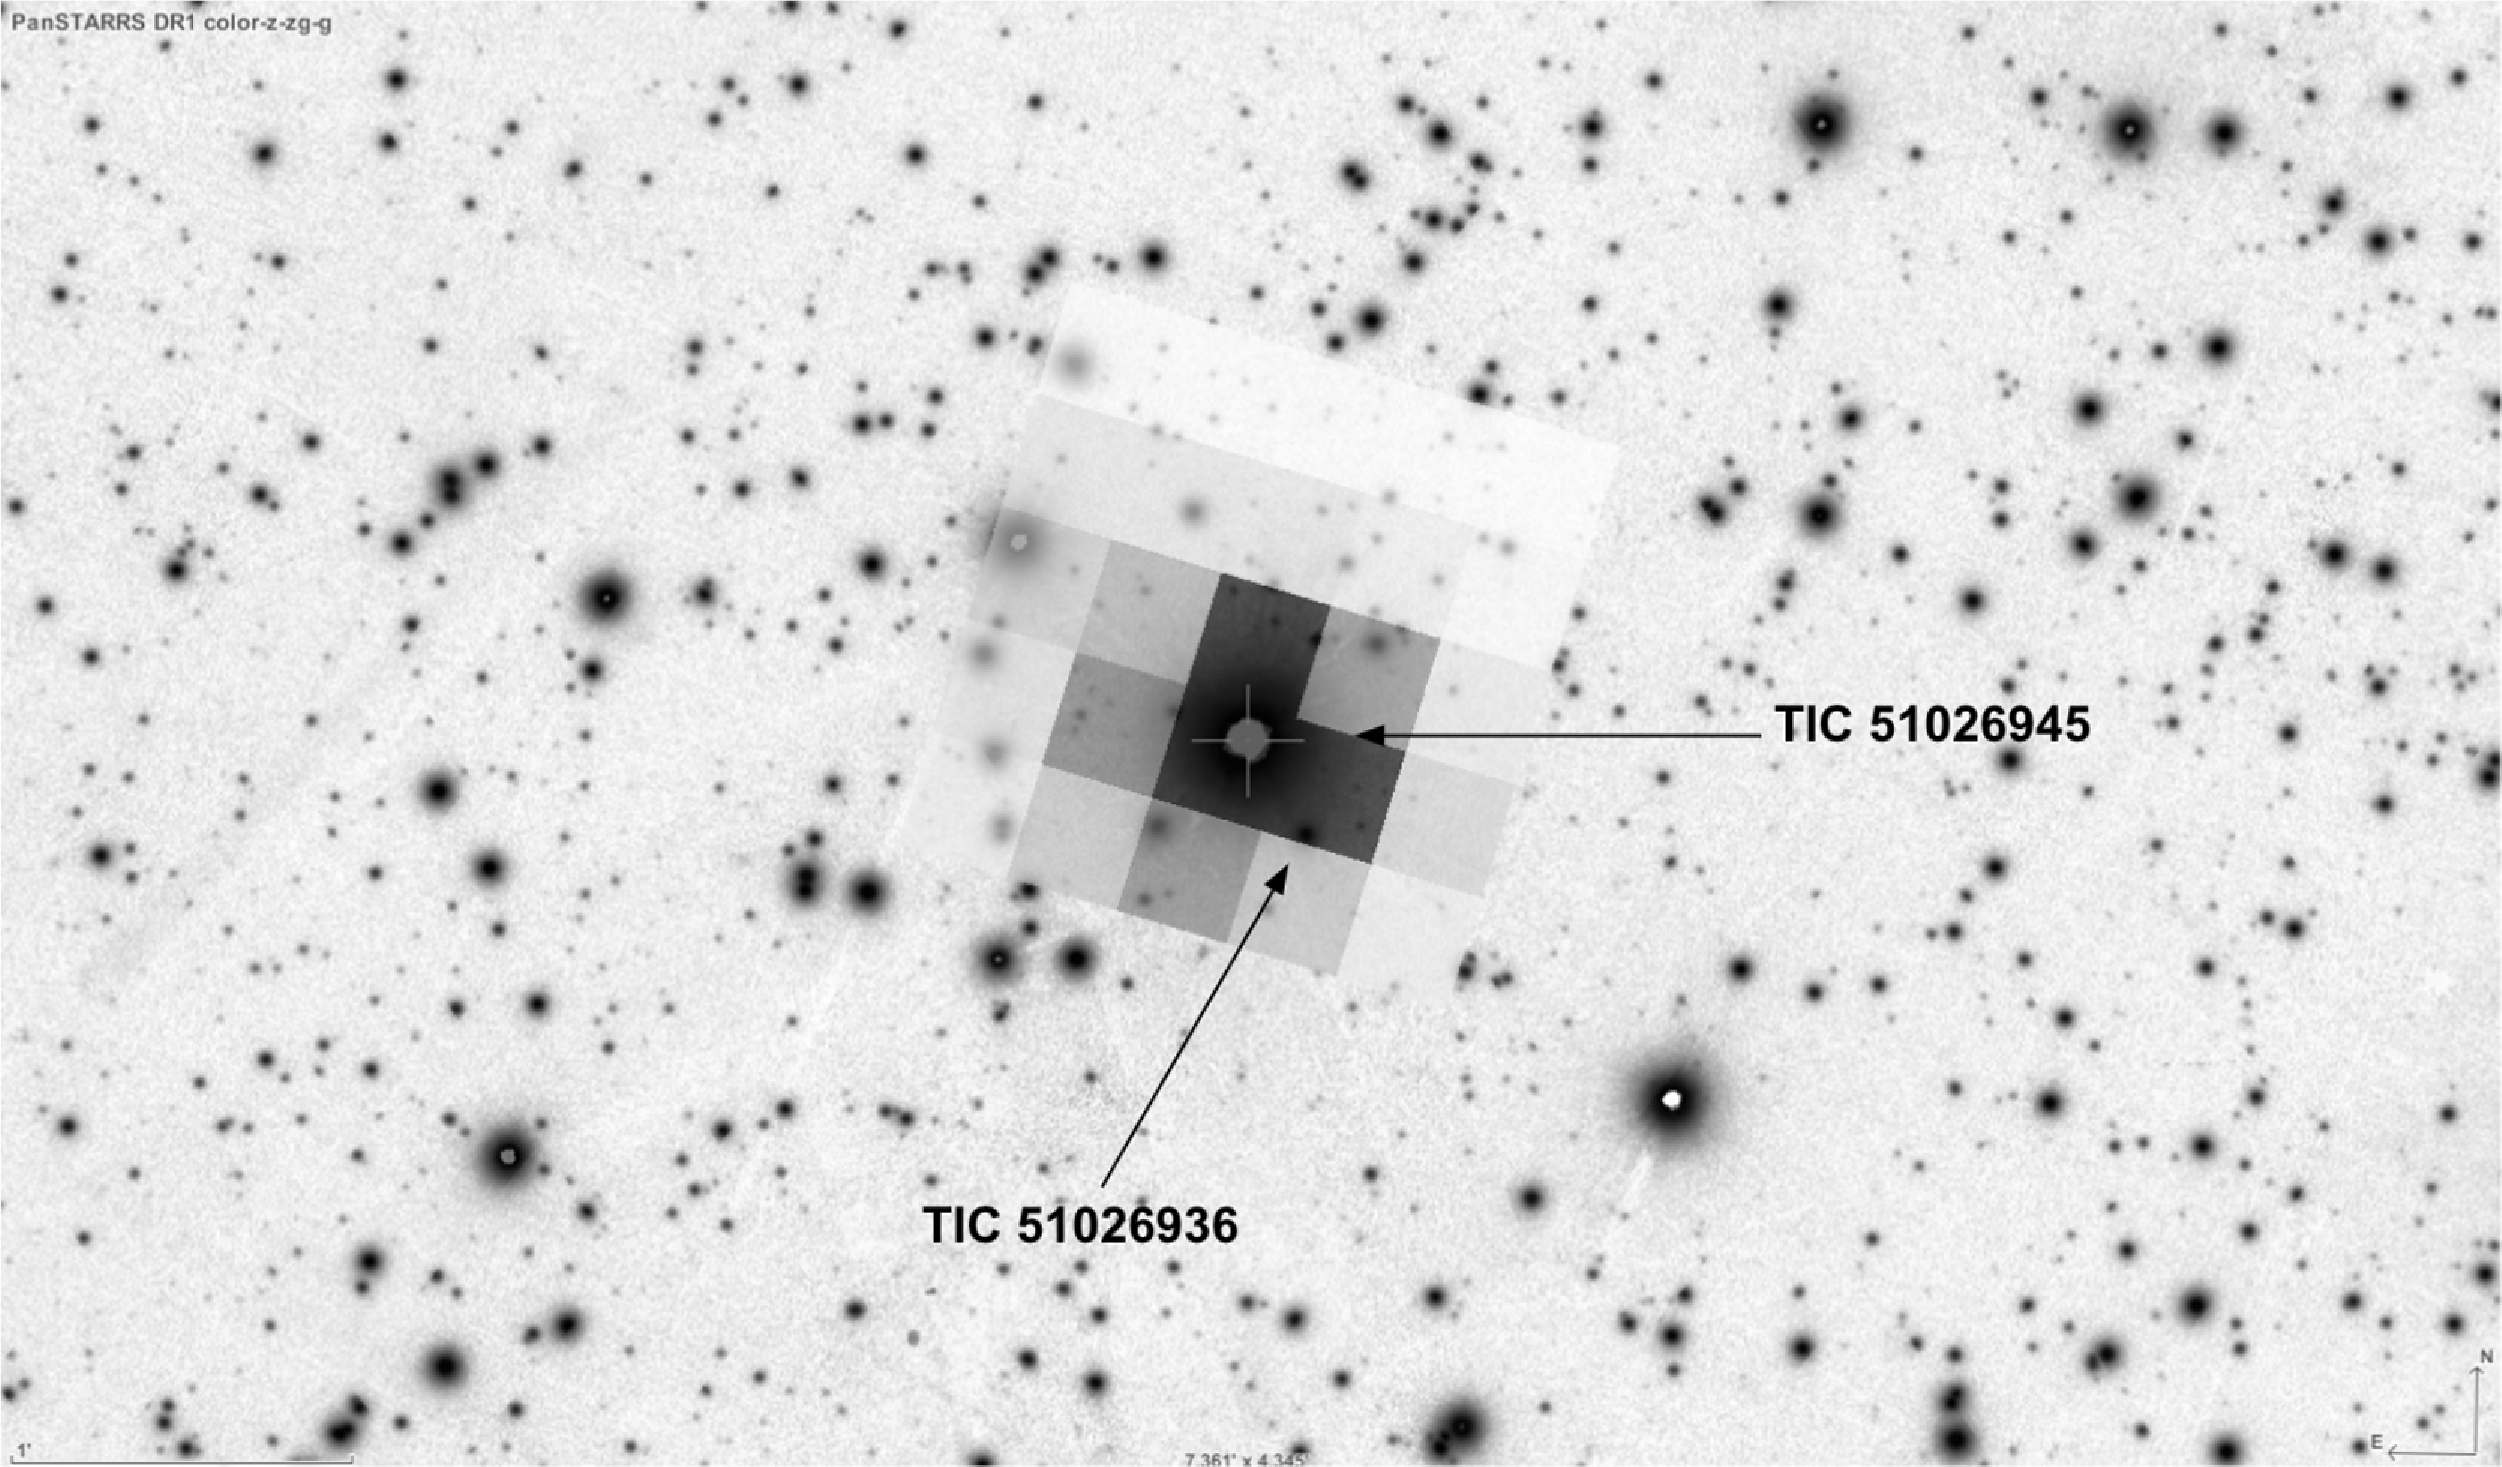


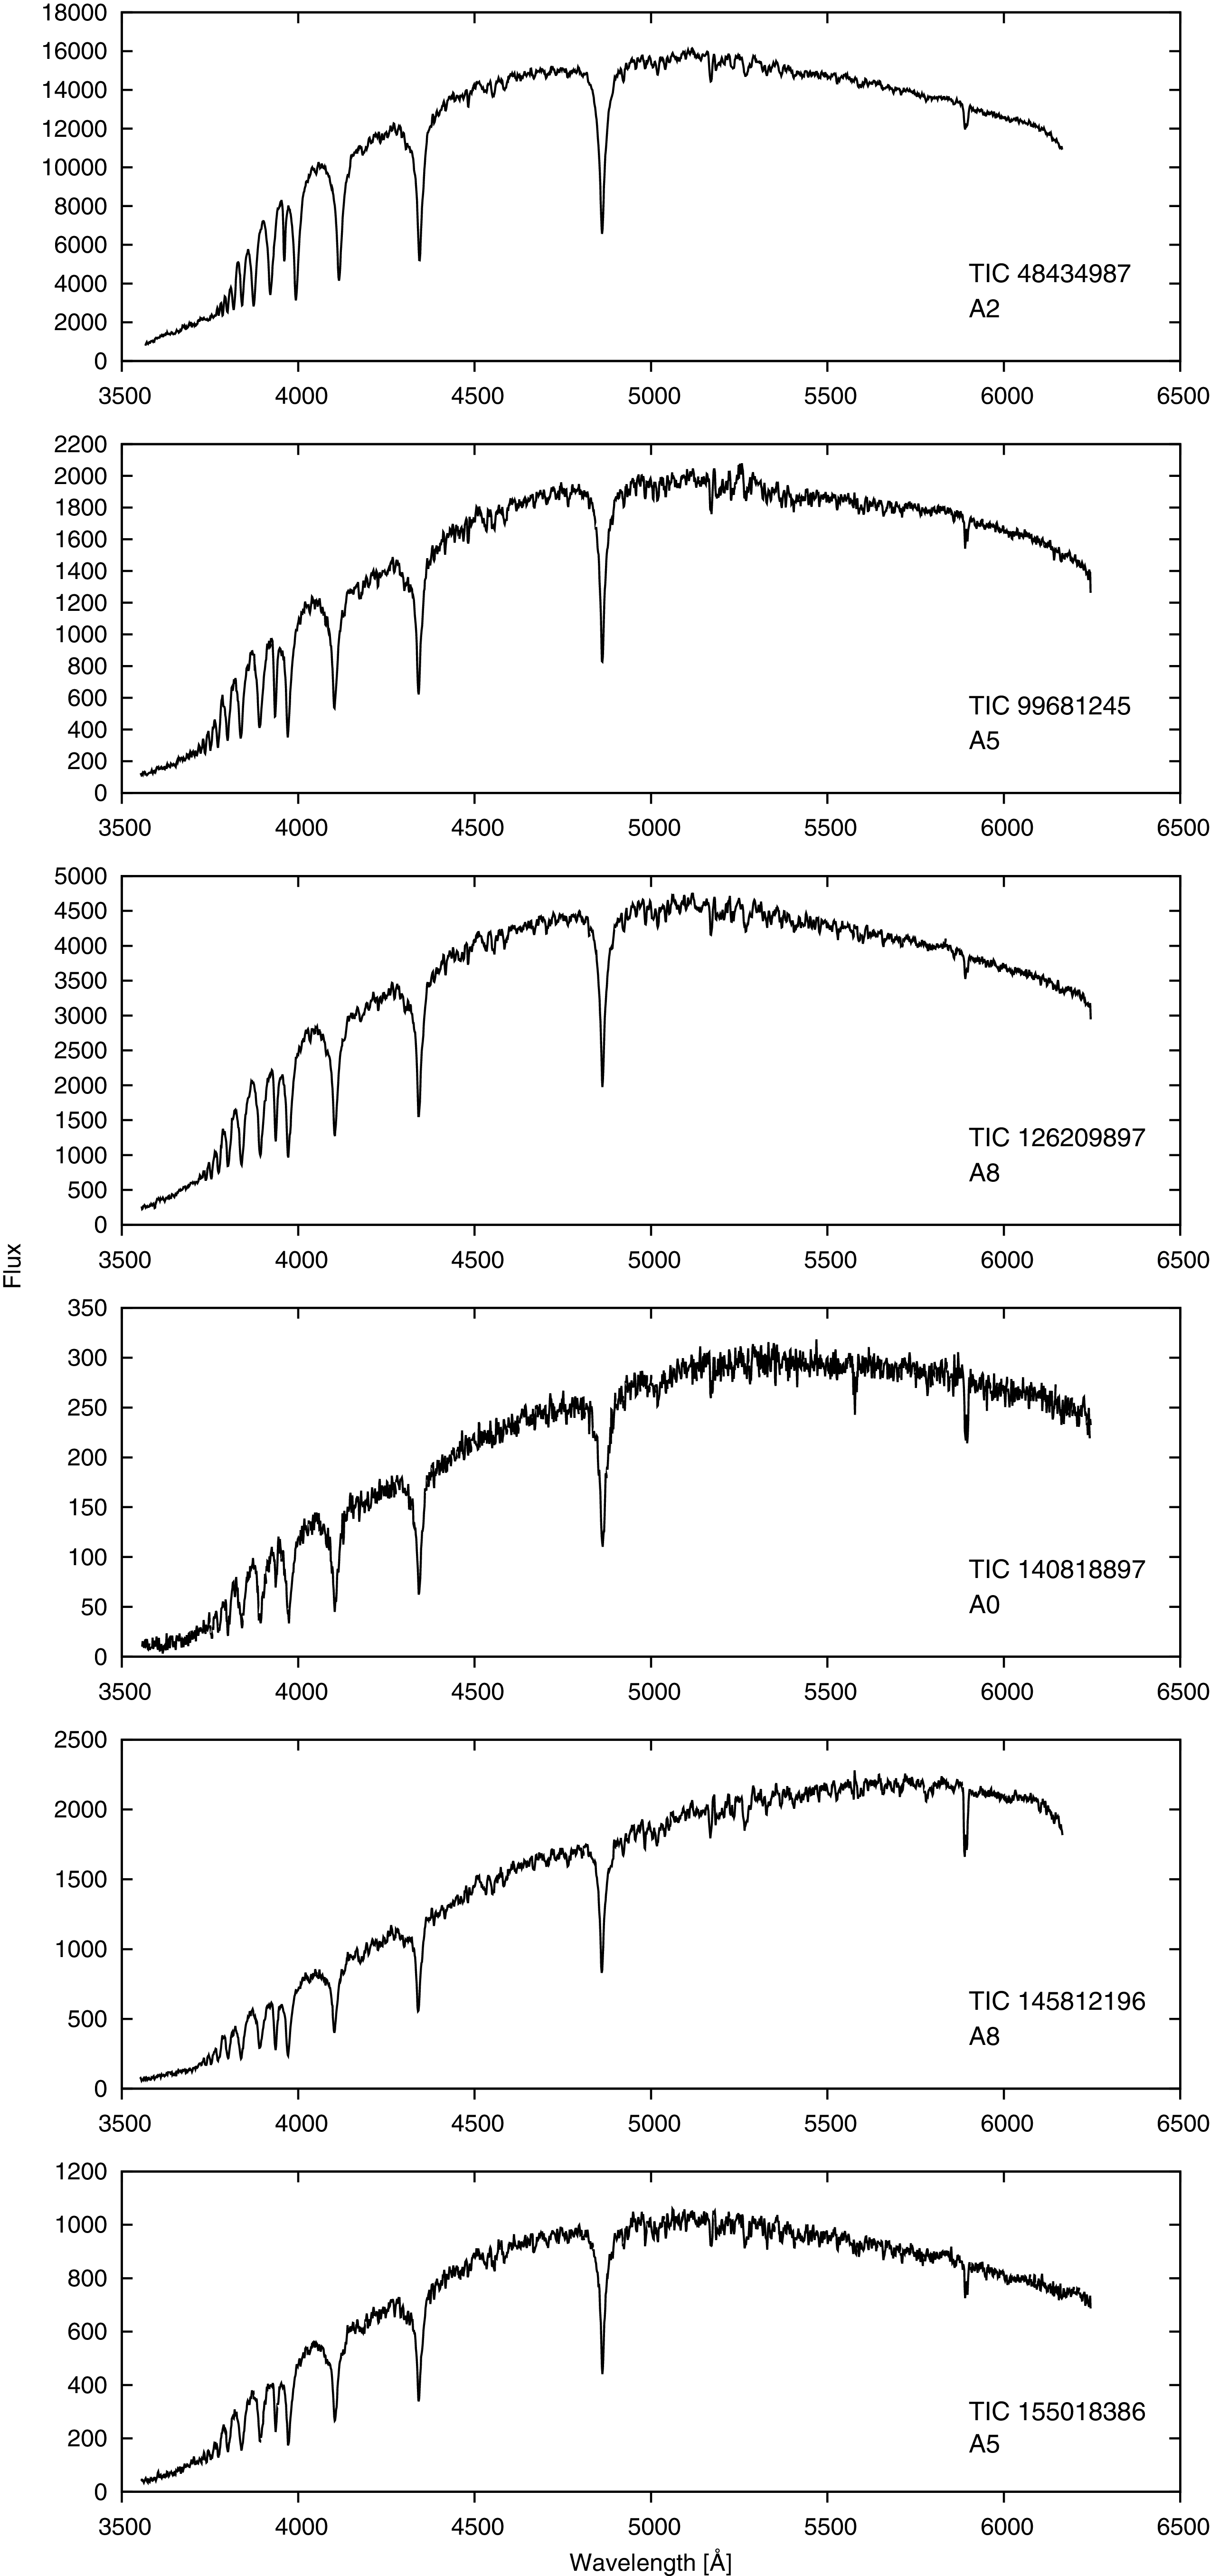
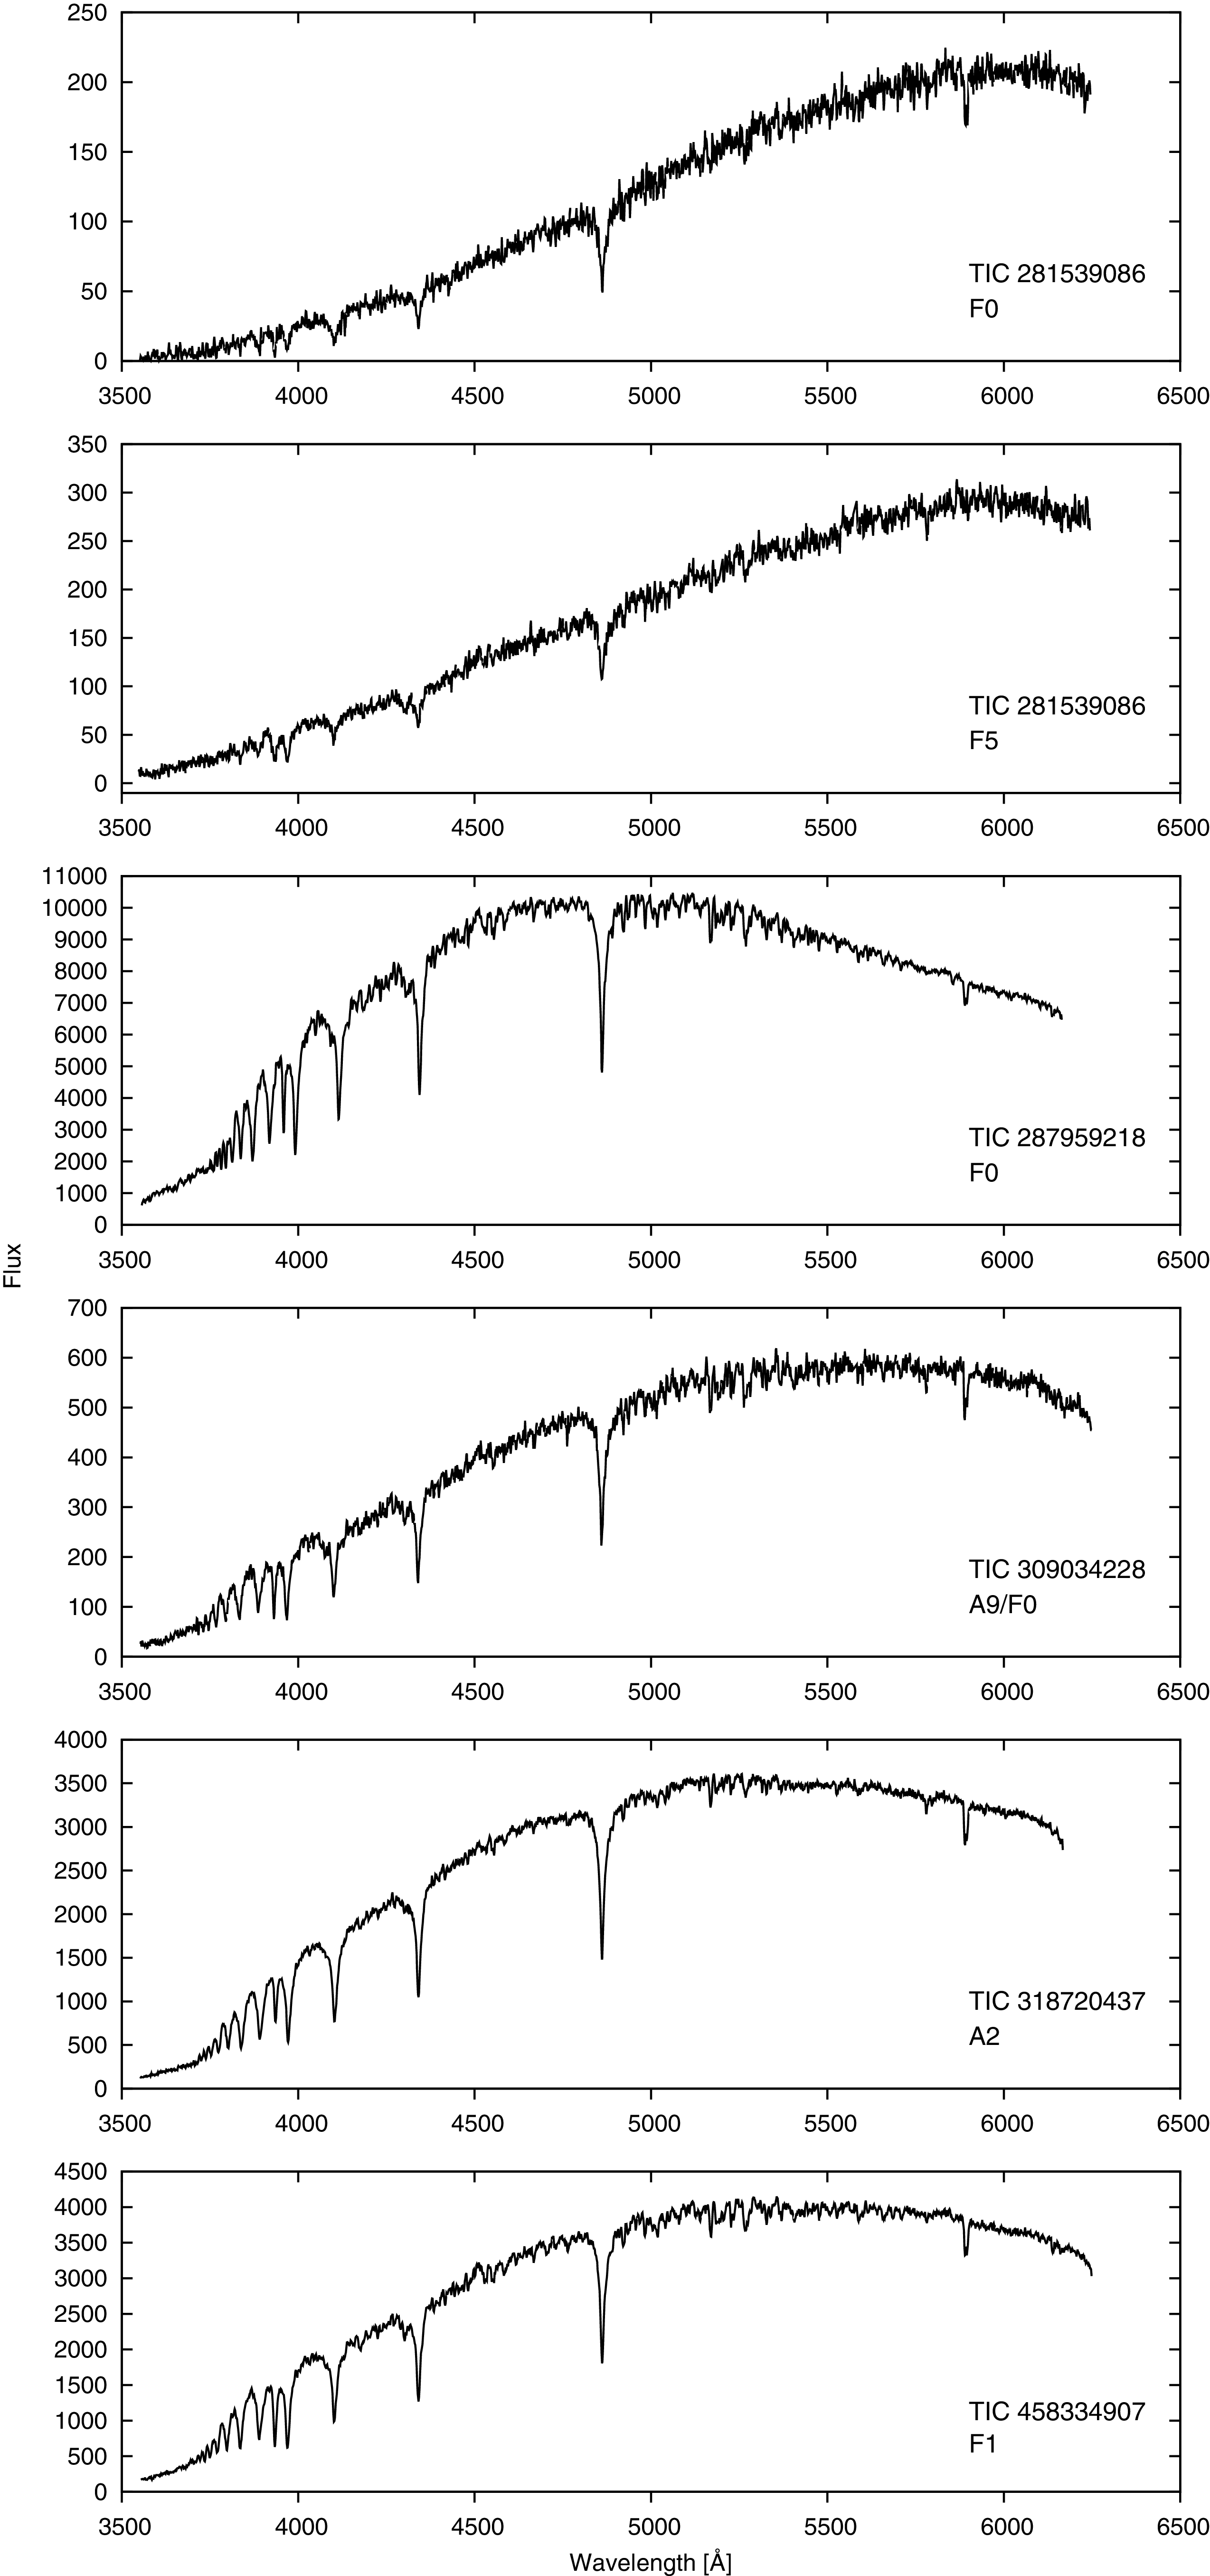
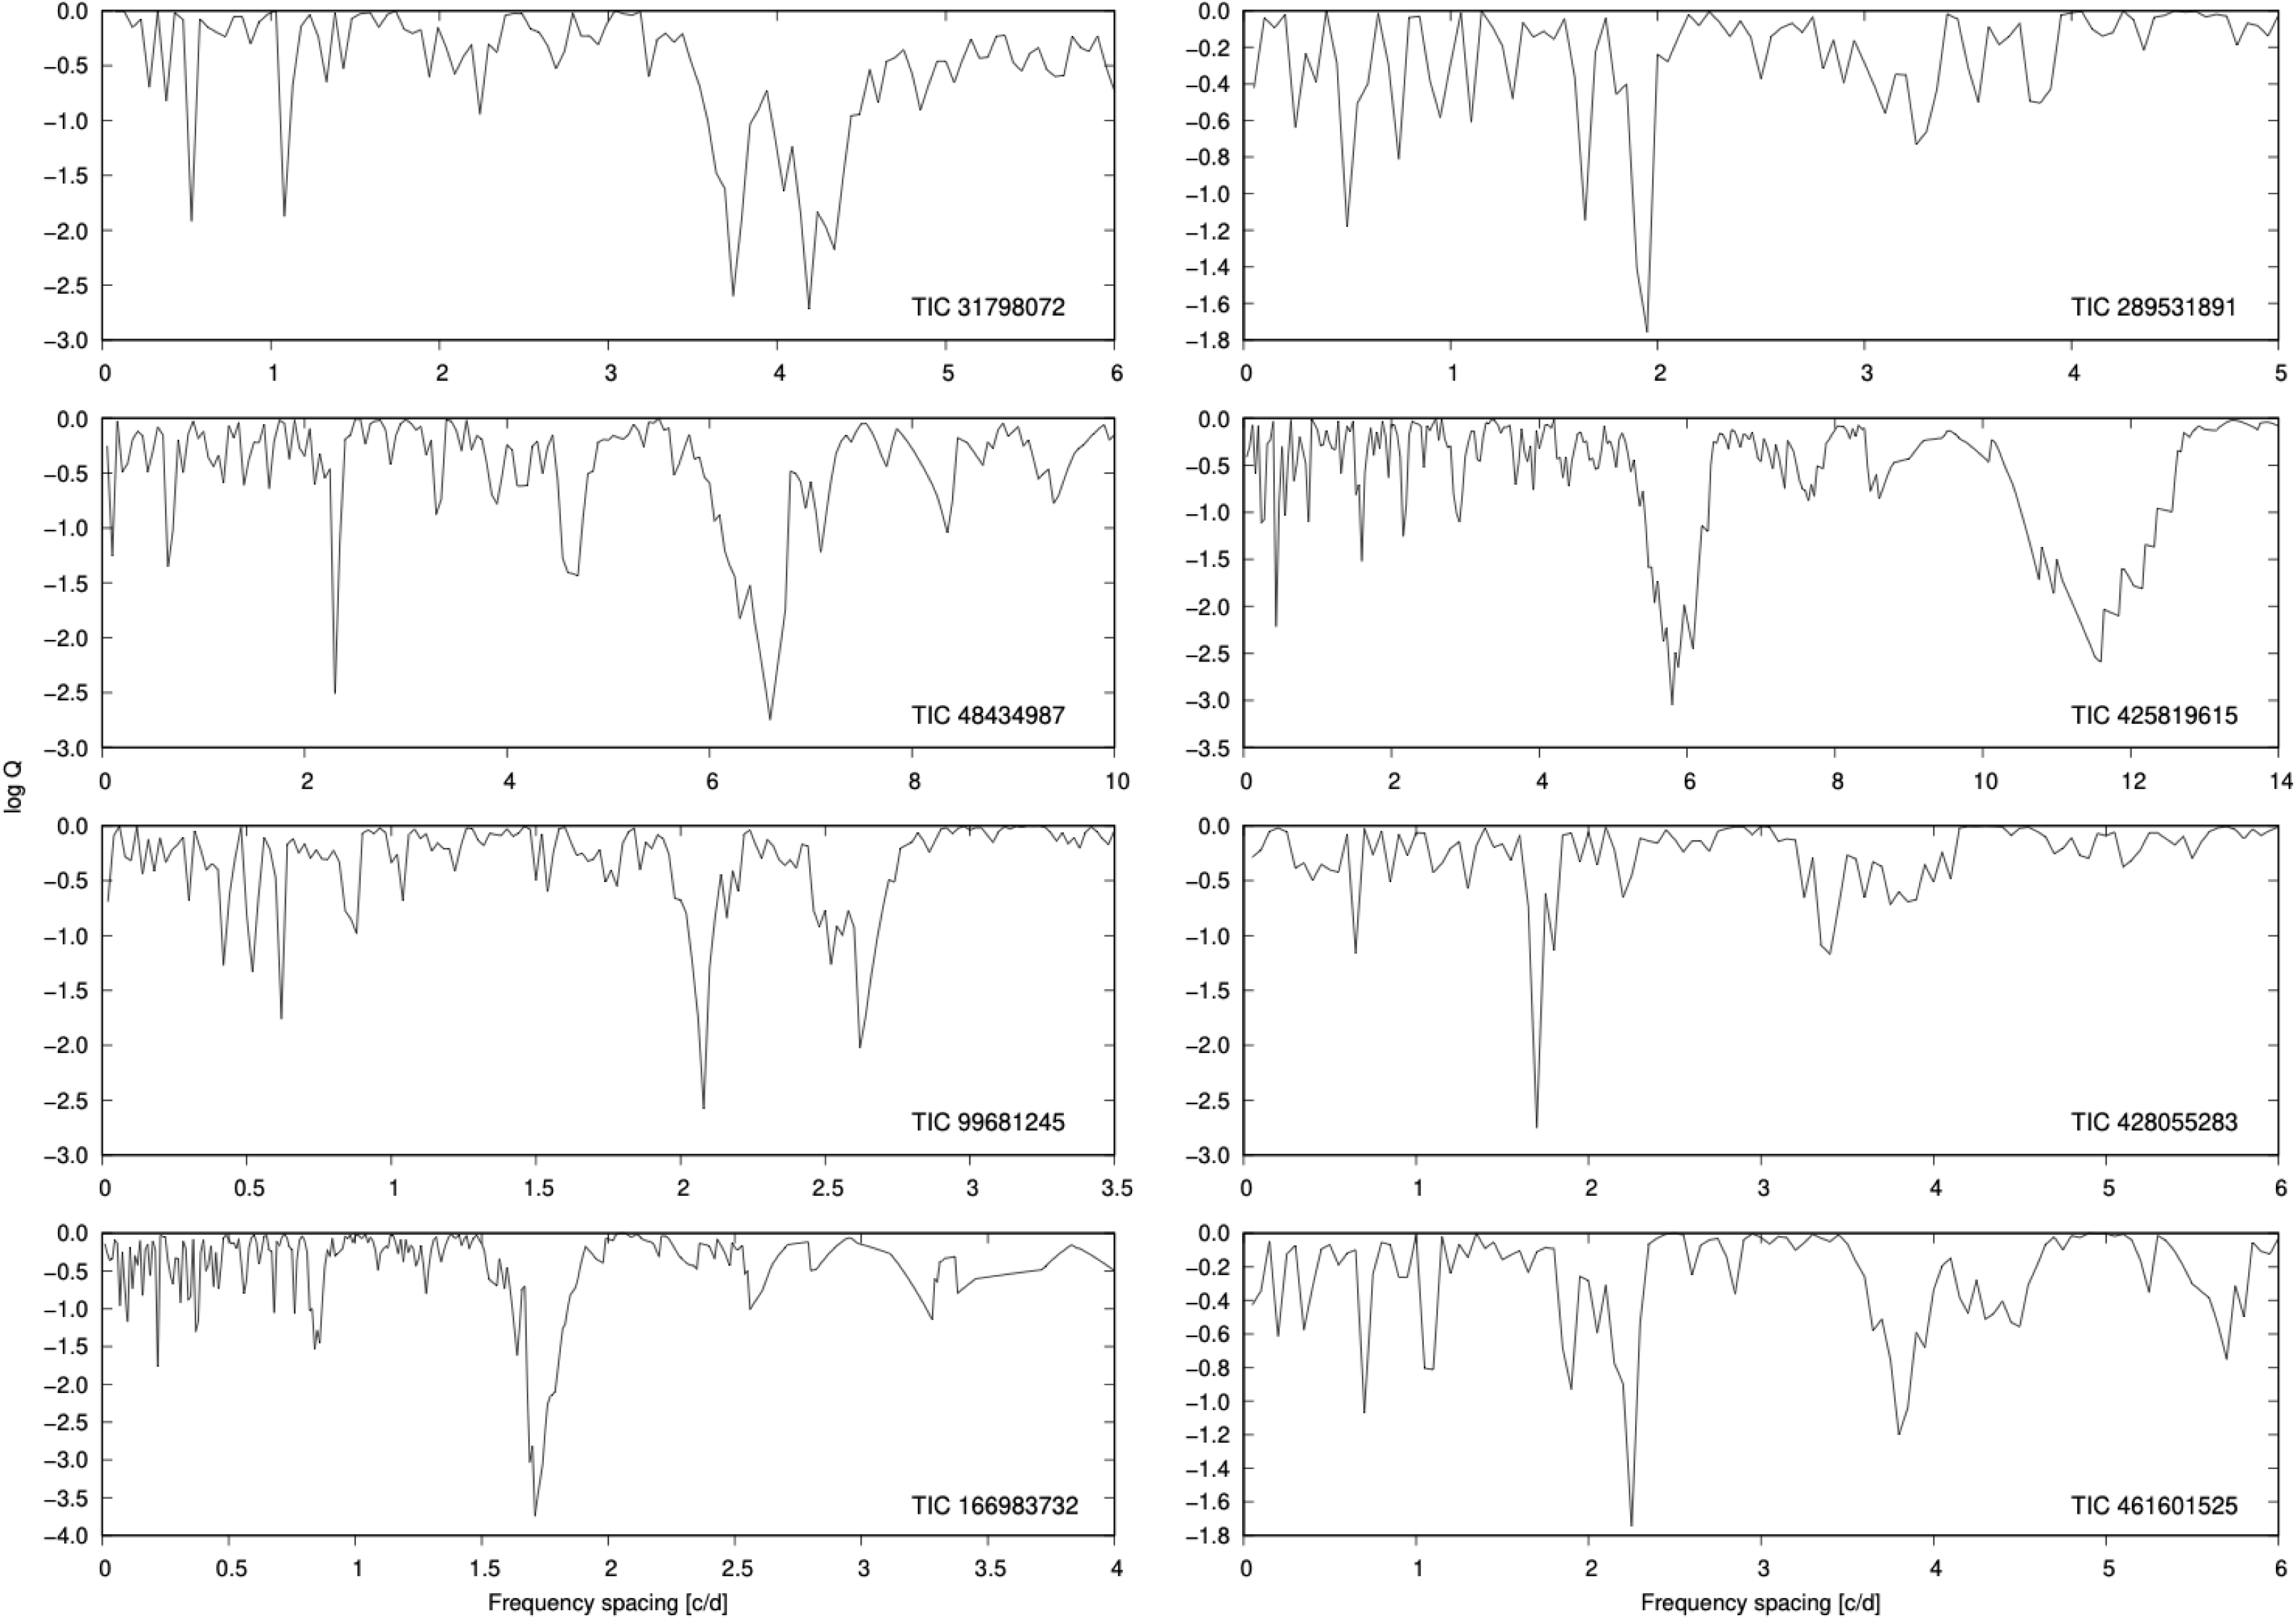
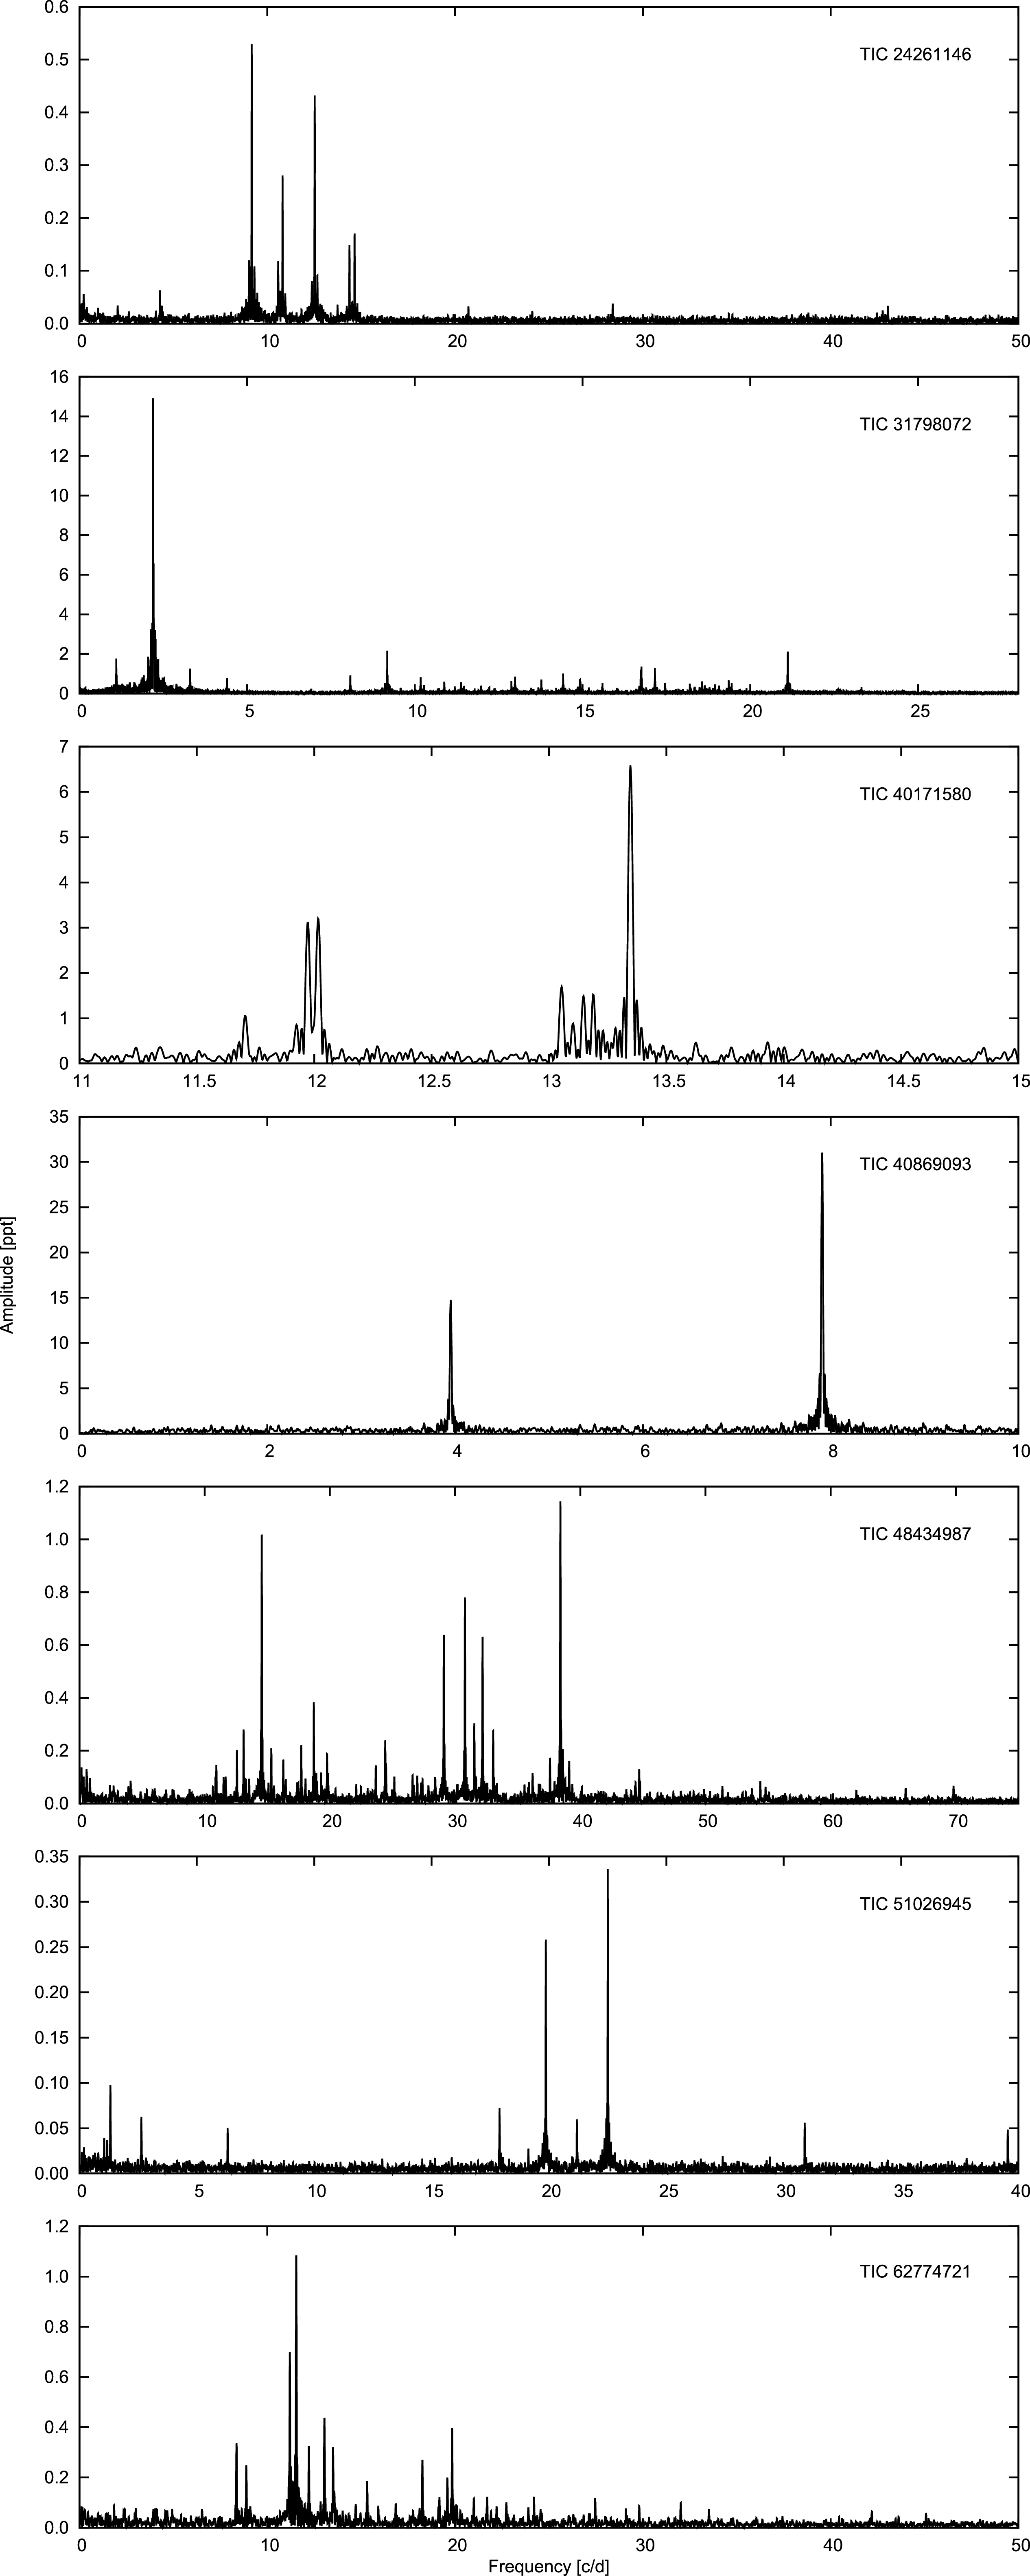
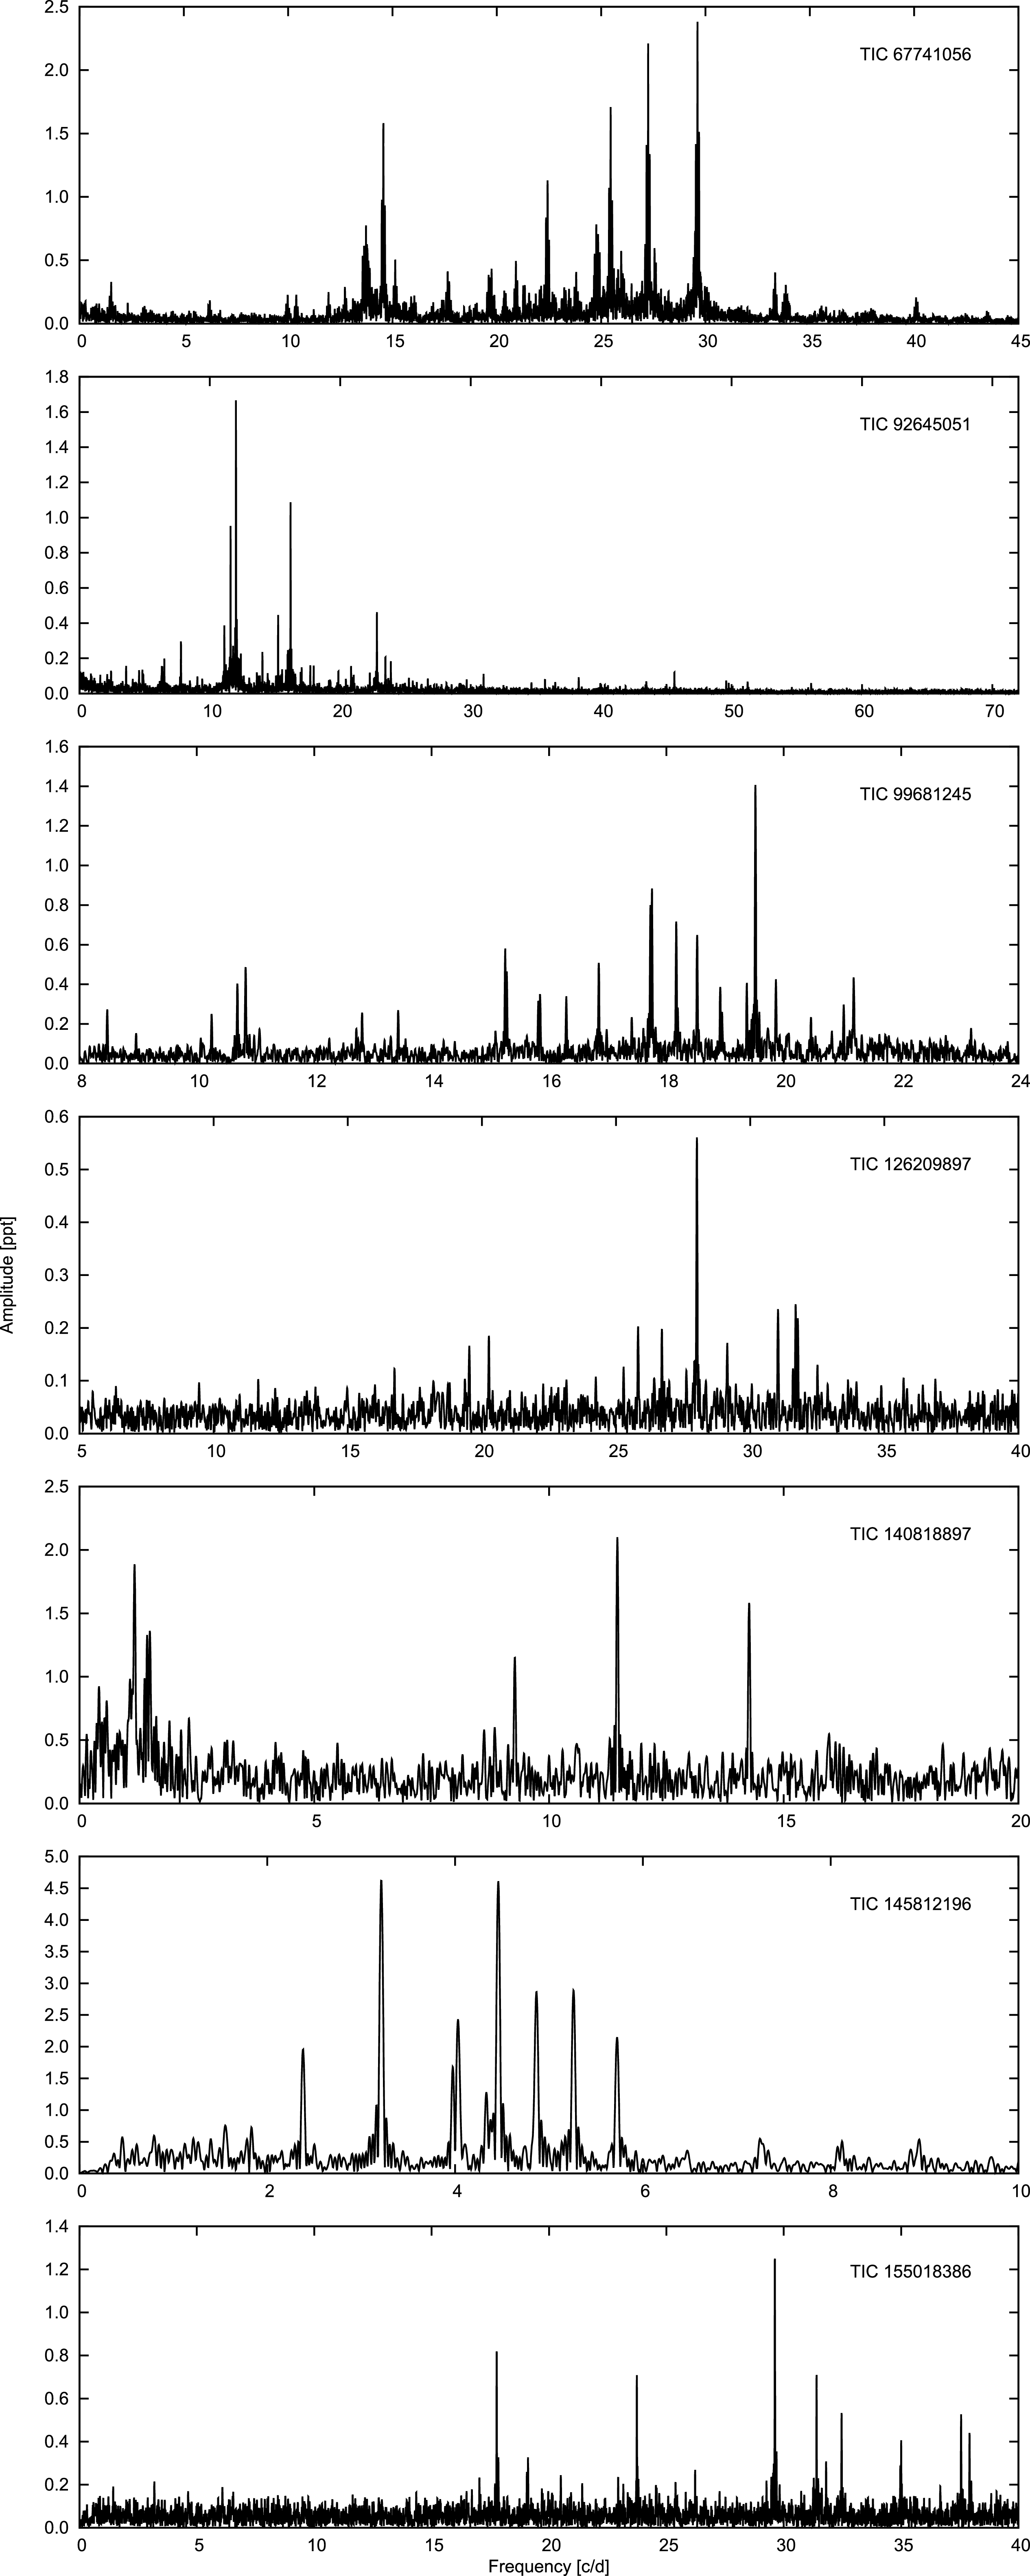
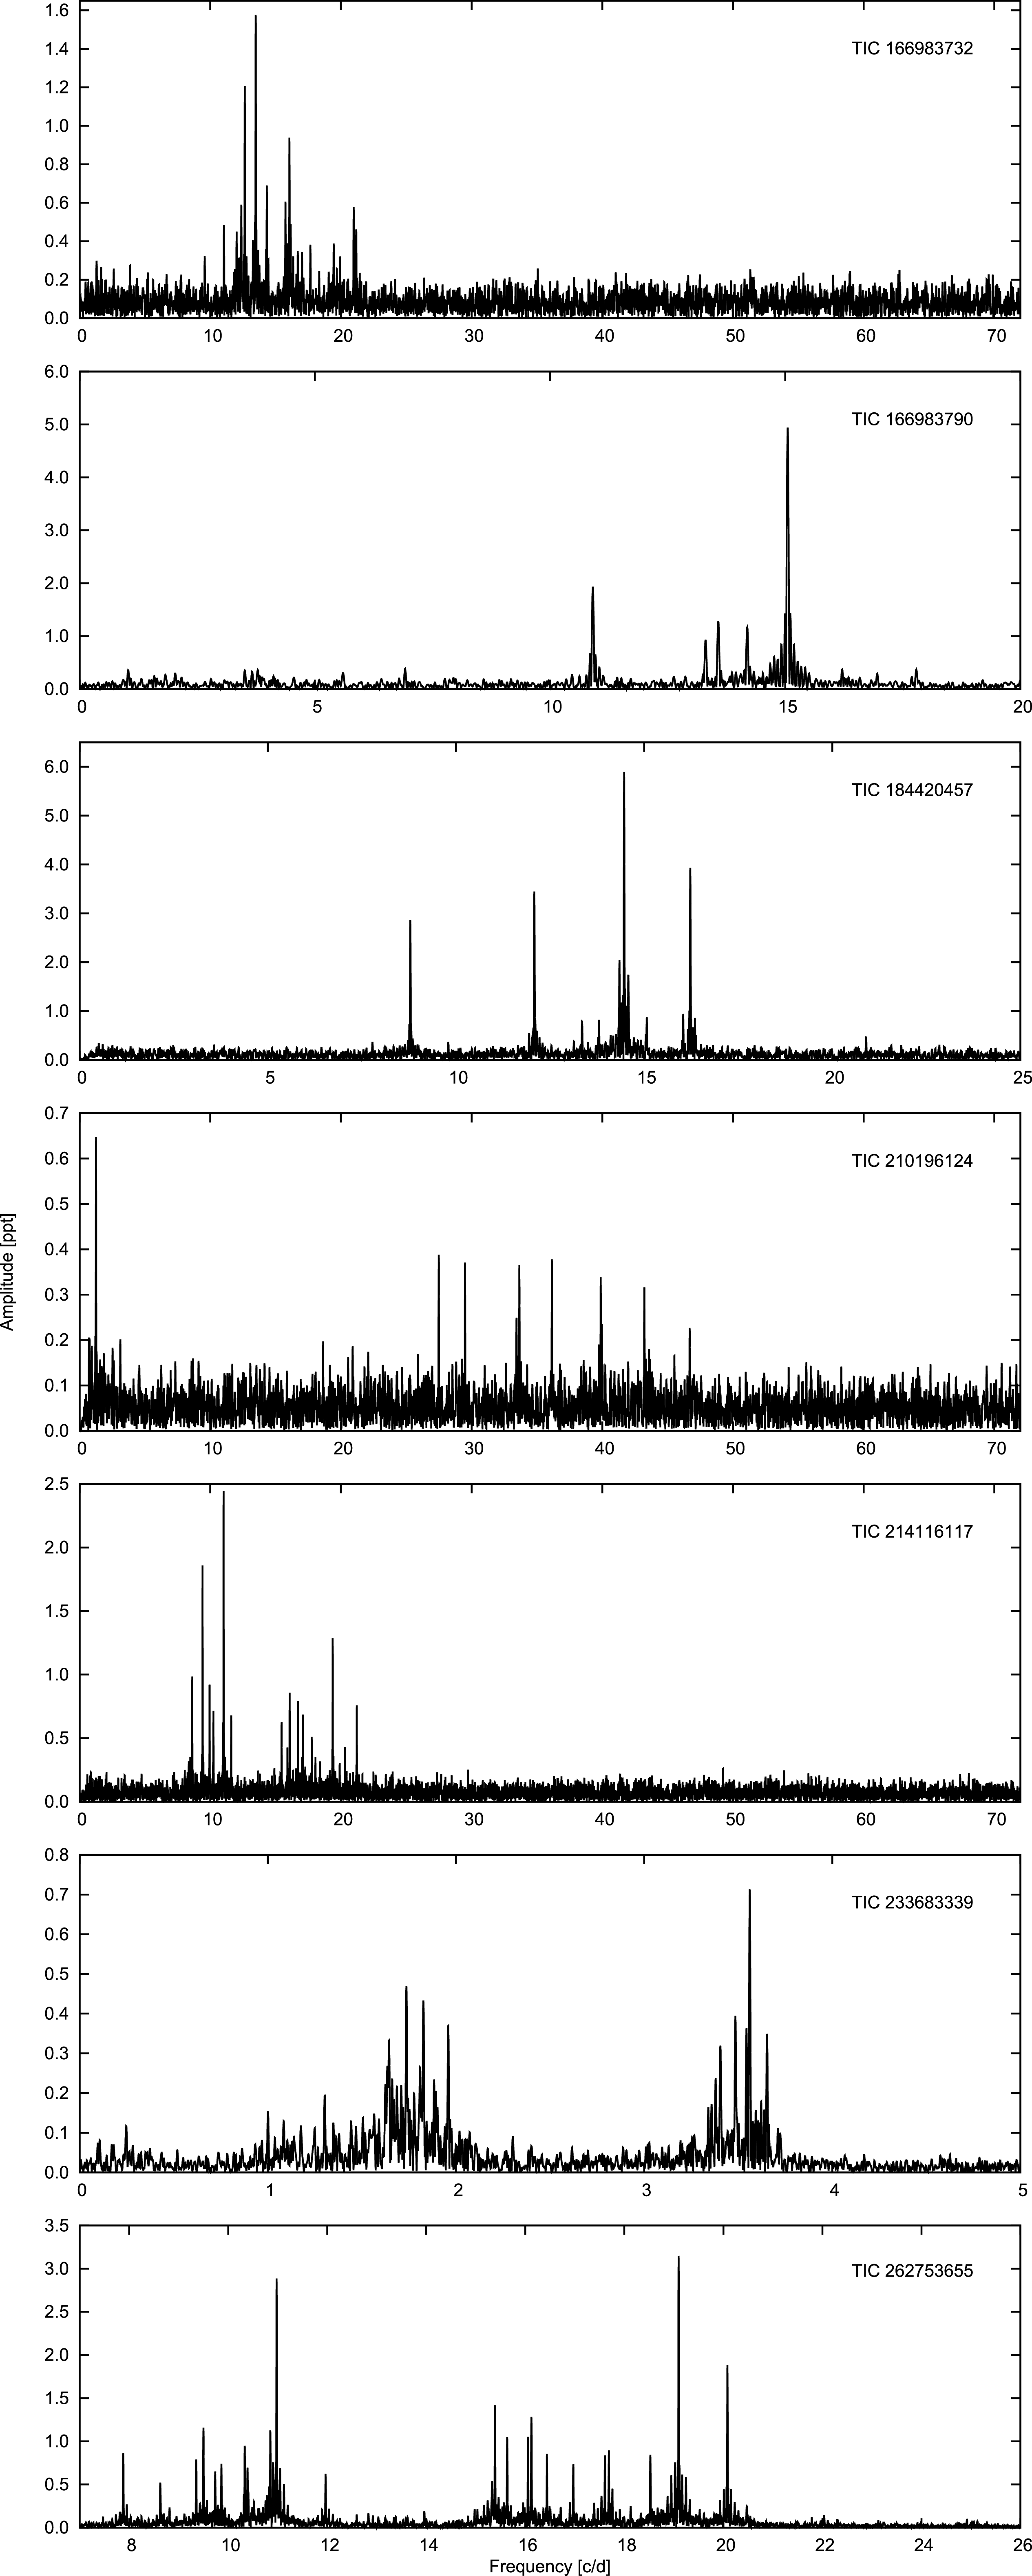
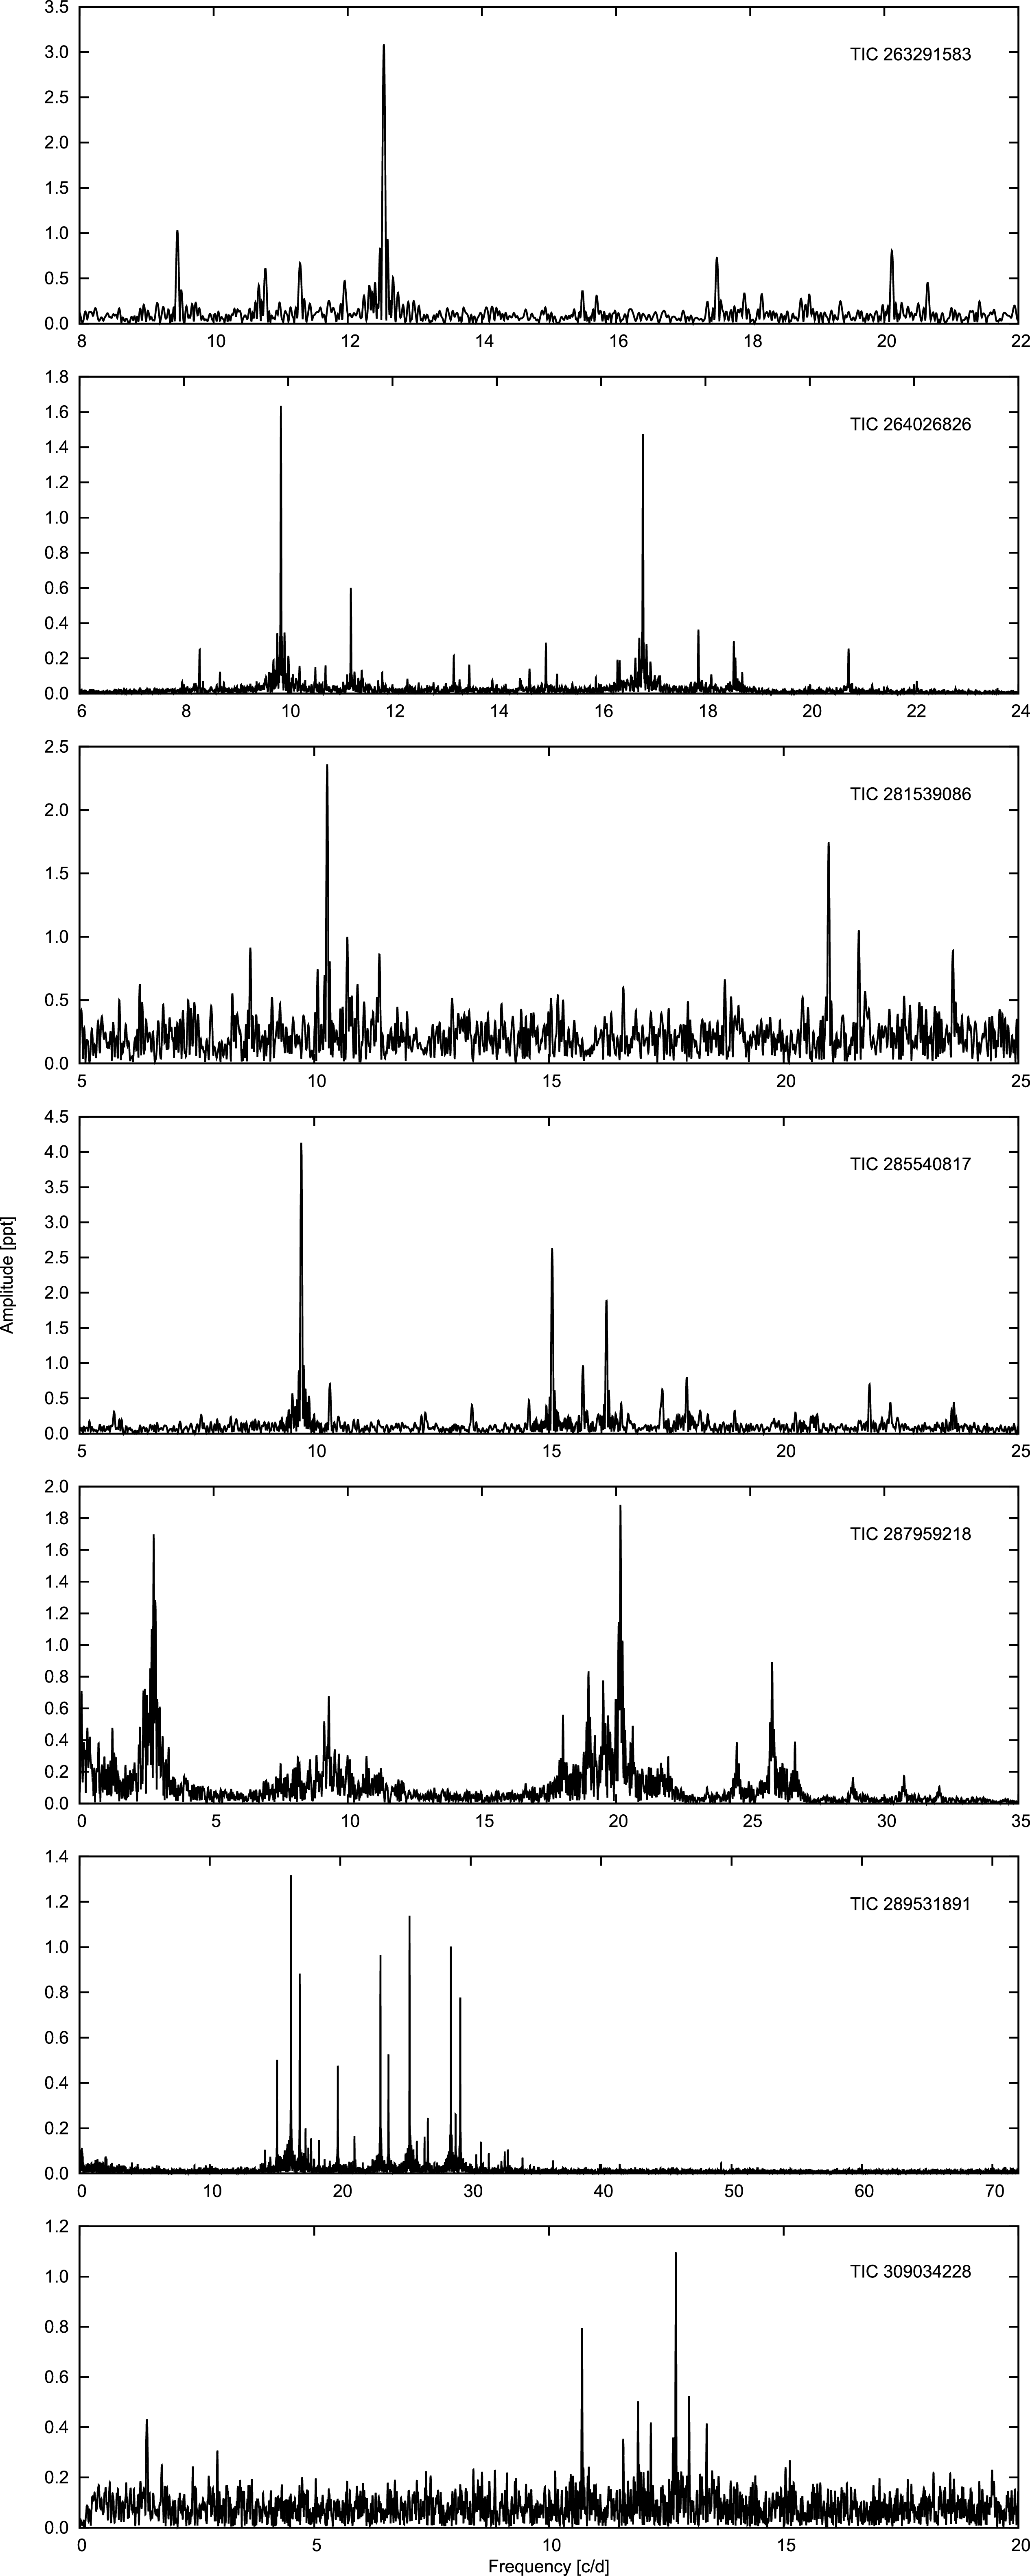
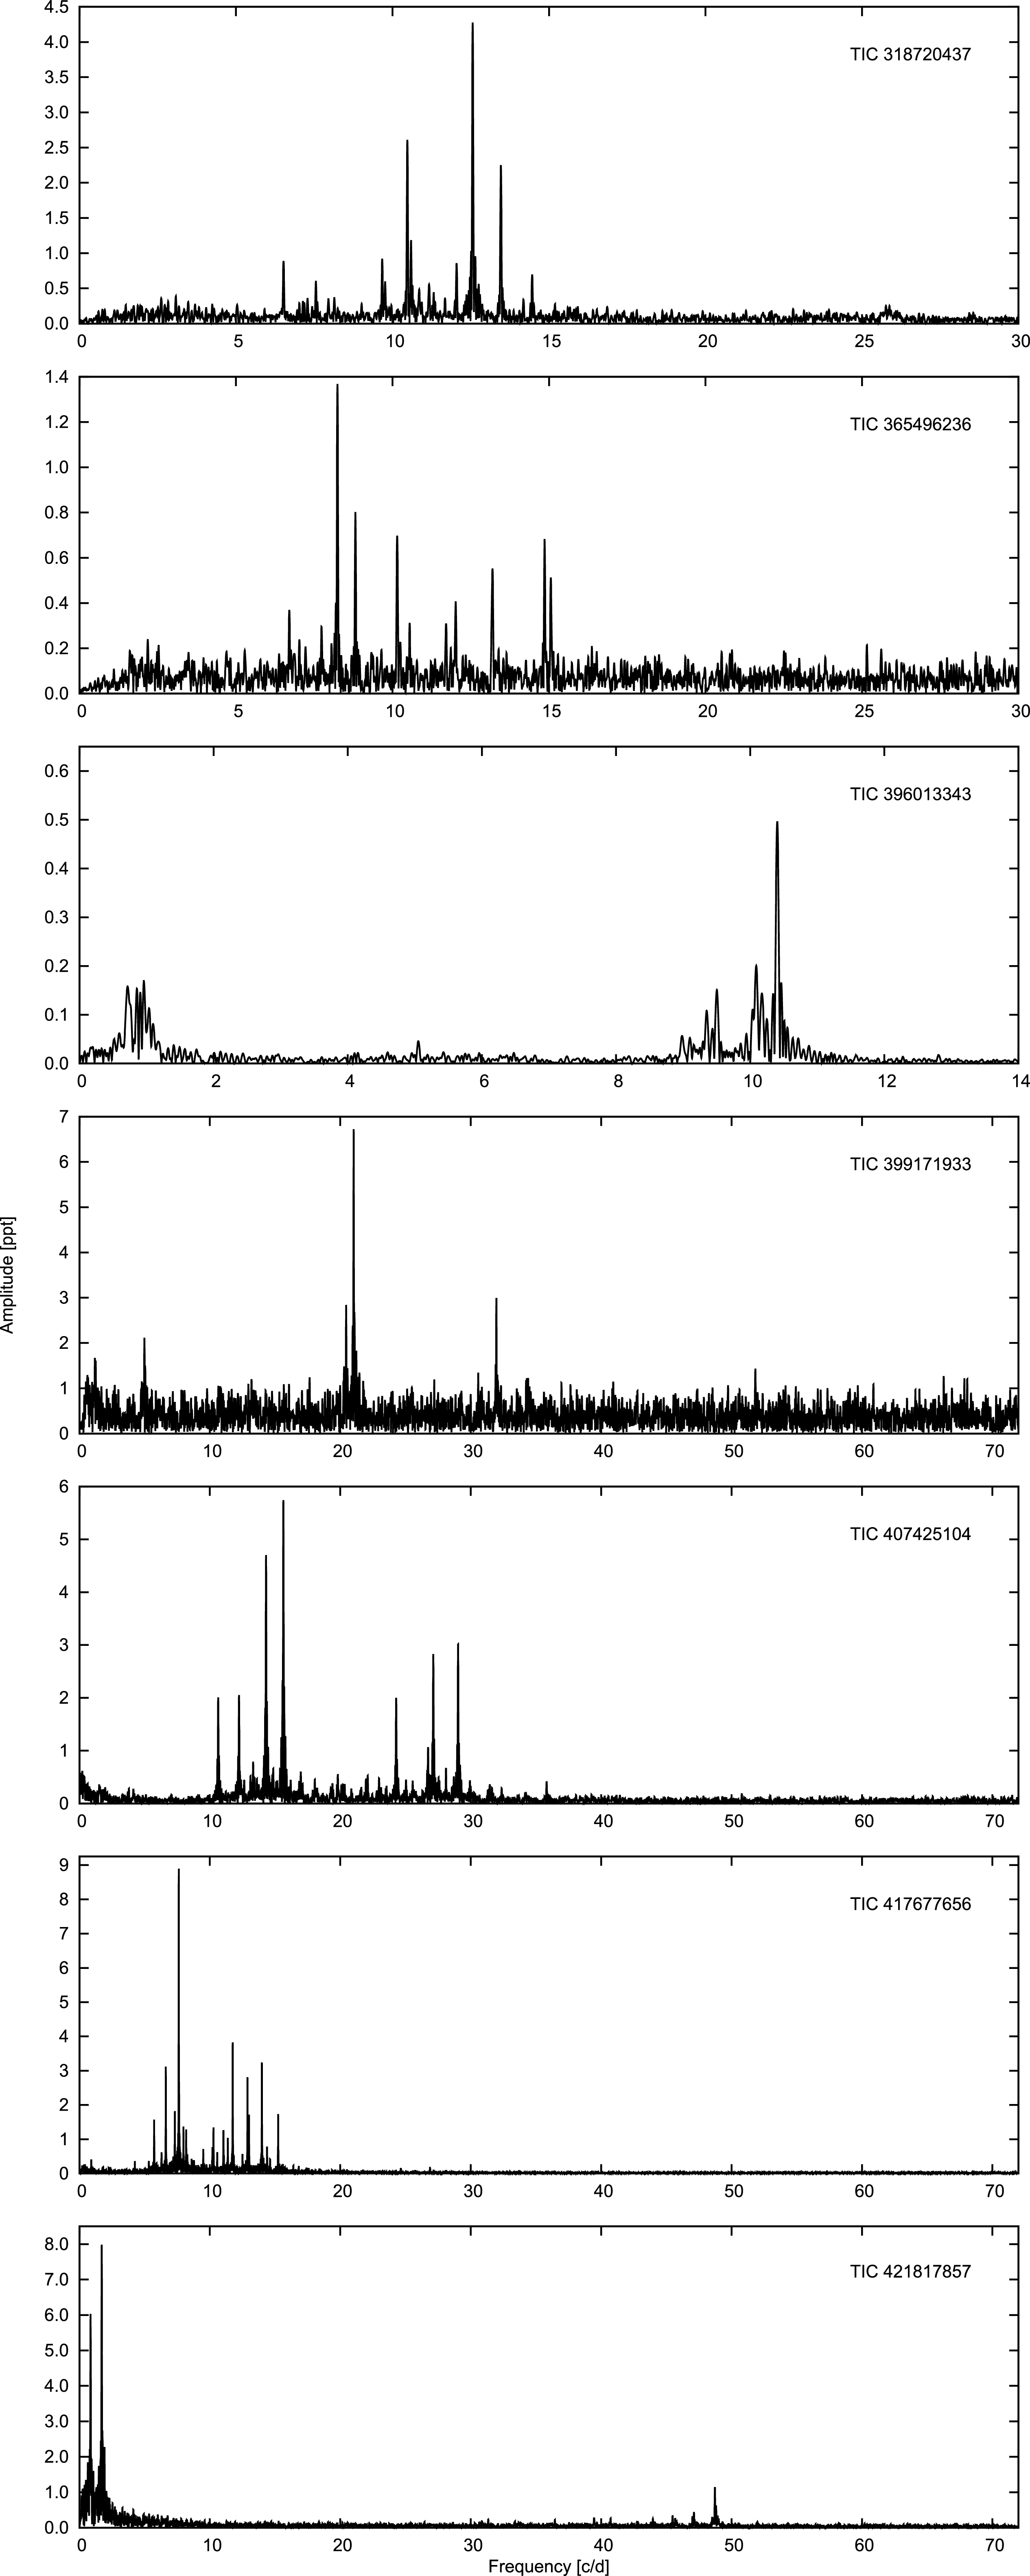
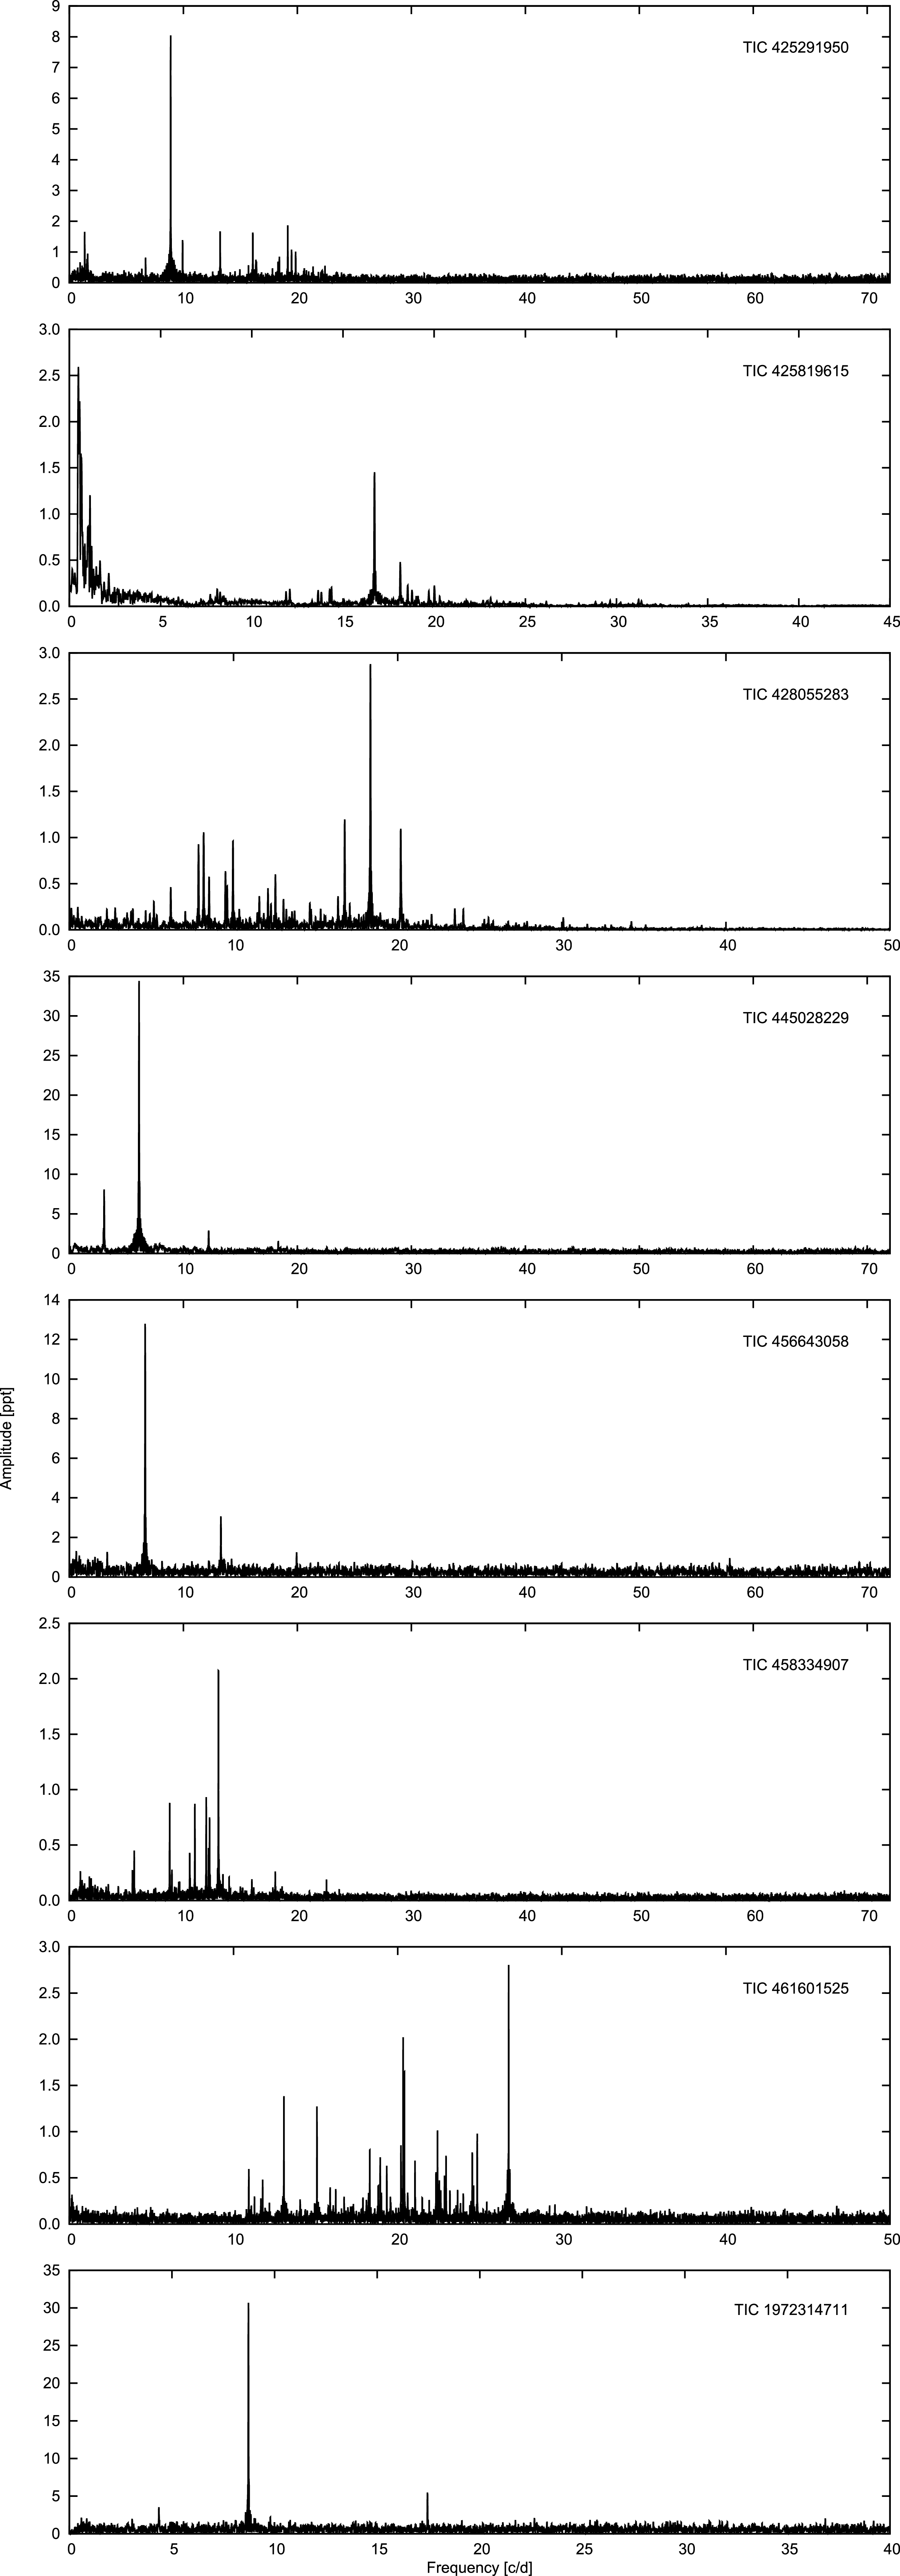

 Open access