


1 Introduction
Multi-Label Text Classification (MLTC) is a supervised machine learning task in which the goal is to learn a classifier that assigns multiple labels to text documents (Herrera et al. Reference Herrera, Charte, Rivera and del Jesus2016). MLTC has many applications in the real world, for example, when a text document is about both politics and economics and we want to label it. Simple classification approaches become computationally expensive when the number of classes is high as for each class (in one-versus-one approach) or for each pair of classes (in one-versus-rest approach) a different model should be trained (Bi and Kwok Reference Bi and Kwok2013). To achieve a good performance in MLTC, instead of optimizing a model for each class separately, the model should be optimized with respect to a global optimum considering all classes. Learning to rank (LTR) has been shown to be an effective approach for MLTC (Yang and Gopal Reference Yang and Gopal2012). In this approach, a model is trained to rank classes regarding the documents and select the topk classes as labels of documents. Rather than creating and optimizing a separate model for each class and predicting the probability of assigning each class to the given document, the learning objective of LTR approach for MLTC is to create a global ranking model that ranks all classes for a given document.
In this paper, we integrate a variety of sources of available information for MLTC using an LTR approach. There are different sources of information for the selection of appropriate classes for documents in the MLTC task, such as text associated with documents and classes. The main aim of our approach is to effectively combine these sources of information in a supervised process. For example, classes can be expanded by their textual labels, which is useful for calculating the similarity of a class with the content of documents (Rousu et al. Reference Rousu, Saunders, Szedmak and Shawe-Taylor2006). Moreover, if there are explicit relations between classes (in the form of a hierarchy or a thesauri structure), we can use it to find the semantic relations between classes and take these relations into account (Rousu et al. Reference Rousu, Saunders, Szedmak and Shawe-Taylor2006; Ren et al. Reference Ren, Peetz, Liang, van Willemijn and de Rijke2014). One of the main sources of information is a set of annotated documents. These documents are used by supervised approaches as training data to create a classification model (Pouliquen, Steinberger, and Ignat Reference Pouliquen, Steinberger and Ignat2003; Nam et al. Reference Nam, Kim, Gurevych and Furnkranz2014). In this paper, using each source of information, we define different features, each reflecting the similarity of documents and classes in a different way. We use an LTR approach for combining different sources of information. Similar to Yang and Gopal (Reference Yang and Gopal2012), we consider each document to be annotated as a query, and use all information associated with a class as a document, an approach applied for document retrieval. We choose LTR as the combination method since it is an effective approach for combining different types of signals. Moreover, it gives us the ability to analyze the contribution of different sources of information in the classification task. The proposed approach can be applied on any document collection that contains the mentioned sources of information. Yet, the approach obtains best performance when applied to document collections with multiple labels per document.
On top of integrating different sources of information, we model the implicit relations of classes based on their co-occurrence patterns in the labeled documents and study how these patterns can help classify the documents more accurately. To do this, we propose a score propagation approach which re-estimates the similarity of classes and documents based on co-occurrence patterns of classes. For a class c, its similarity to a document d is smoothed (by linear interpolation) with another score which is based on the probability of c co-occurring with other classes cʹ and the similarity of cʹ to d.
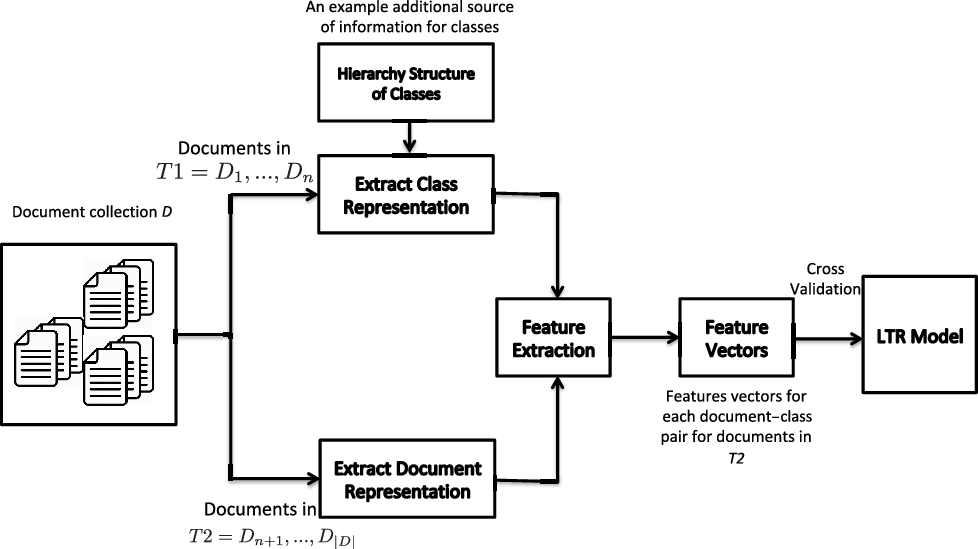
The general pipeline of the proposed method is shown in Figure 1. The pipeline consists of a module for constructing class representations based on a subset of documents or other sources such as hierarchical structure of classes, a module for constructing document representations based on title or body of documents, a module for feature extraction based on similarities of classes and documents, and finally a module for building the LTR model on top of the extracted feature vectors.
The general pipeline of the proposed LTR method for MLTC. First, a subset of the dataset is used for constructing class representations. Additional class representations can be learned using other sources of information such as hierarchy structure of classes. Second, document representations are constructed for the documents in the remaining subset of the dataset. Then, based on document and class representations, similarities of documents and classes are estimated and used as features. After building feature vectors, cross-validation is done to train and evaluate LTR models.
In this paper, we focus on addressing two main research questions:
RQ1: How effective is an LTR approach integrating a variety of sources of information as features for MLTC?
To answer this research question, we evaluate the performance of the proposed LTR approach on the English version of JRC-Acquis (Steinberger et al. Reference Steinberger, Pouliquen, Widiger, Ignat, Erjavec and Tufis2006) and compare our results with JEX (the JRC EuroVoc Indexer) (Steinberger, Ebrahim, and Turchi Reference Steinberger, Ebrahim and Turchi2012), which is one of the state-of-the-art systems developed for classifying JRC-Acquis documents. The results show that the LTR approach improves JEX by 20% in terms of Precision@5 (precision and rank cutoff of 5).
RQ2: Is it worthwhile to use the co-occurrence patterns of classes for MLTC?
To answer our second research question, we analyze the effect of score propagation on the performance of different approaches for MLTC and compare the results achieved by the propagated and the non-propagated versions of each method. The results indicate that propagated versions of all methods outperform their non-propagated counterparts.
Our main contributions are the following:
• We propose a framework for exploiting sources of information including labeled documents, taxonomy relations of classes, and textual labels of classes for MLTC. We define different features using these sources of information and instead of training a classifier per class, create a ranking model that can rank classes based on their similarities to documents.
• We propose a score propagation approach to consider the co-occurrence patterns of classes in the labeled documents. The proposed approach can be applied on top of any classifier for MLTC.
• We make the designed tool publicly available.Footnote a It automatically pre-processes textual data, constructs different representations for documents and classes, and computes different similarity metrics for documents and classes. These similarity metrics are used to build feature vectors for document–class pairs. The feature vectors extracted using JRC-AcquisFootnote b dataset, and Eurovoc concepts are in the LTR format which can be directly used by LTR algorithms to train ranking models.
2 Related work
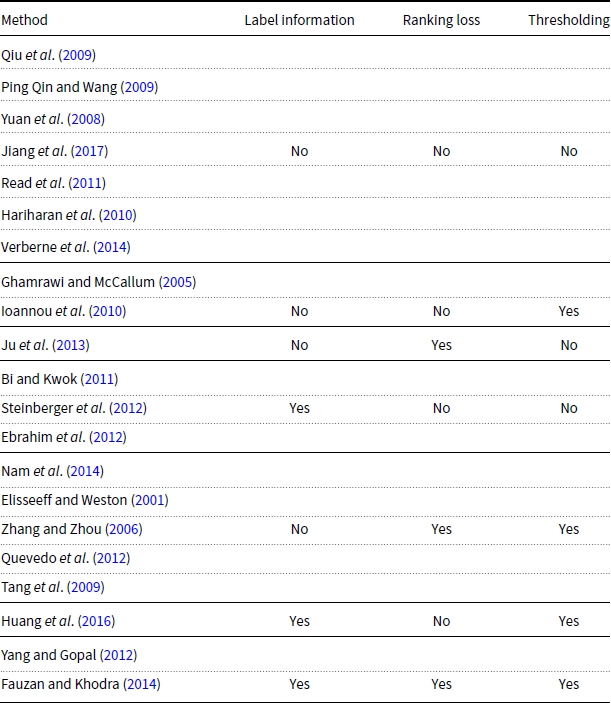
Our method for MLTC touches on research in multiple areas. We review work in three directions: MLTC, LTR for multi-label text classification, and automatic indexing of political documents. A summary of the reviewed work can be found in Appendix A.
2.1 Multi-label text classification
Multi-Label Text Classification (MLTC) is the task of classifying text documents to multiple classes (Tsoumakas, Katakis, and Vlahavas Reference Tsoumakas, Katakis and Vlahavas2010). A well-known approach for MLTC is training a different classifier for each class, and ranking and selecting the classes with regard to the probability of documents belonging to them (Zhang and Zhou Reference Zhang and Zhou2014). Using this approach, Qiu, Gao, and Huang (Reference Qiu, Gao and Huang2009) exploited the well-known SVM classifier for training a binary classification model for each category. Then, they used these models to determine the classes that a document belongs to. Ping Qin and Wang (Reference Ping Qin and Wang2009) further, studied the effectiveness of MLTC based on SVM classifiers. They proposed two different classifiers based on SVMs and concluded that with small adjustments on SVM, it can be very effective for MLTC. In other studies, SVM classifiers are combined with other classifiers to improve its performance (Yuan et al. Reference Yuan, Chen, Jin and Huang2008). The main goal is to resolve some issues associated with SVM, such as its poor performance for samples on cross-zones of multi-categories, using additional classifiers (such as a kNN). Yuan et al. (Reference Yuan, Chen, Jin and Huang2008), showed that the combination of k Nearest Neighbors (kNN) and Support Vector Machines (SVM) boosts the performance of SVM significantly. Instead of SVM, Nam et al. (Reference Nam, Kim, Gurevych and Furnkranz2014) and Jiang, Pan, and Li (Reference Jiang, Pan and Li2017) employed a neural network-based model to determine the labels of documents. They used a feedforward network with a single hidden layer. Instead of commonly used binary relevance-based loss function, they used cross-entropy as loss function to train the network. Finally, a thresholding method on top of the estimated scores for classes is employed to select number of classes. The results showed that a cross-entropy loss is more effective than binary relevance-based loss for MLTC. Huang et al. (Reference Huang, Li, Huang and Wu2016) studied the effectiveness of learning class-specific features for MLTC. The main intuition behind the proposed method is to learn label-specific features for each class that is sparse (incorporated in the model using a regularization), representative of samples of the class (modeled using a regular regression loss), and takes the relation between classes into account (modeled based on interactions of coefficients of learned regression models for classes). The results reported in this paper showed that the learned label-specific features have a comparable performance to state-of-the-art feature selection methods for MLTC.
Most of the mentioned approaches model MLTC as a standard classification task and study the effectiveness of their proposed approaches on datasets with relatively small set of labels. Simple classification approaches become computationally expensive and infeasible when the number of classes is high (Bi and Kwok Reference Bi and Kwok2013). Babbar and Schölkopf (Reference Babbar and Schölkopf2017) proposed a scalable approach for multi-label classification by training one-versus-rest classifiers. Although their proposed approach is computationally efficient, the trained model is large. We consider MLTC a ranking problem and instead of using classification methods, we use an LTR approach to rank classes given a document. We create only one small model (about 45 kilobytes) which can be used to assign classes to documents.
The main characteristic of MLTC discriminating it from single-label text classification is that documents can have more than one label. Therefore, capturing the dependencies between classes and incorporating them in the classification process could be useful to improve the accuracy of classifiers (Ghamrawi and McCallum Reference Ghamrawi and McCallum2005; Hariharan et al. Reference Hariharan, Zelnik-manor, Vishwanathan and Varma2010; Bi and Kwok Reference Bi and Kwok2011; Read et al. Reference Read, Pfahringer, Holmes and Frank2011). Ghamrawi and McCallum (Reference Ghamrawi and McCallum2005) captured these dependencies using conditional random fields, obtaining better classification scores. Read et al. (Reference Read, Pfahringer, Holmes and Frank2011) chained the classifiers to use the dependency information of classes in labeling process. Nam et al. (Reference Nam, Kim, Gurevych and Furnkranz2014) tried to capture these dependencies using neural networks specialized for document classification. In this paper, we use the implicit dependencies of classes in a score propagation framework. Unlike previous work, our approach for incorporating class dependencies is independent of the underlying method and can be applied on top of any classification method. It is noteworthy that a similar label propagation has been used for single-label text classification when the size of training set is small (Rossi, de Andrade Lopes, and Rezende Reference Rossi, de Andrade Lopes and Rezende2016; Wang and Tsotsos Reference Wang and Tsotsos2016).
To classify documents in MLTC, there is a need to first determine the number of classes to be assigned to documents. This is usually done by setting a threshold on the scores estimated for the documents and assigning documents with a higher score than the threshold to the positive and rest of the documents to the negative class (Yang and Gopal Reference Yang and Gopal2012). This strategy does not work for MLTC, especially in the case of ranking-based MLTC task, as in this task we have a ranked list of classes and a document can have more than one class. A common approach for choosing the number of classes in MLTC is calibrating the scores generated for each class, setting a threshold on the scores, and assigning classes with a higher score than the threshold to documents (Ioannou et al. Reference Ioannou, Sakkas, Tsoumakas and Vlahavas2010; Zhang and Zhou Reference Zhang and Zhou2014). A static (fixing a threshold and using it for all documents) or dynamic (learning from training samples and having different threshold values for different documents) approach can be used for setting the threshold. Some popular choices for fixed thresholds are zero, for example, for SVM-like classifiers, and 0.5 for probabilistic classifiers such as logistic regression (Clare and King Reference Clare and King2001; Boutell et al. Reference Boutell, Luo, Shen and Brown2004; Read et al. Reference Read, Pfahringer, Holmes and Frank2011). The dynamic threshold is set using a training set in which samples are a set of pairs of ranked lists with scores and, for each ranked list, an optimal threshold that minimizes a classification loss such as false positives or false negatives given the ranked list (Elisseeff and Weston Reference Elisseeff and Weston2001; Zhang and Zhou Reference Zhang and Zhou2006; Yang and Gopal Reference Yang and Gopal2012; Quevedo, Luaces, and Bahamonde Reference Quevedo, Luaces and Bahamonde2012). For samples in training set, the optimal threshold can be determined; however, for test samples, the threshold should be estimated. This is done by learning a mapping function based on training samples that takes a ranked list and maps it to a threshold. This strategy has been shown to be very effective for MLTC. Similarly, instead of learning a mapping from ranked lists of document to a threshold, the mapping can be learned to map ranked lists to the number of classes directly (Tang, Rajan, and Narayanan Reference Tang, Rajan and Narayanan2009). Besides these generic approaches, some ad hoc thresholding strategies are also used in previous studies. These strategies are specific to the learning algorithms (Furnkranz et al. Reference Furnkranz, Hullermeier, Mencia and Brinker2008; Wehrmann et al. Reference Wehrmann, Barros, Dores and Cerri2017) and cannot be applied on top of other methods. In this paper, we study the effectiveness of a static and a dynamic methods for selecting number of classes and provide insights on effectiveness of each method.
2.2 Learning to rank for multi-label classification
LTR was proposed in the context of ad hoc information retrieval in which the goal is to create a ranking model that ranks documents with respect to queries. The LTR approach has been used for constructing a ranking model to rank classes with respect to a given document and select the most probable classes for the document as its labels (Yang and Gopal Reference Yang and Gopal2012; Ju, Moschitti, and Johansson Reference Ju, Moschitti and Johansson2013; Fauzan and Khodra Reference Fauzan and Khodra2014; Azarbonyad and Marx Reference Azarbonyad and Marx2019). Yang and Gopal (Reference Yang and Gopal2012) mapped MLTC to the ad hoc retrieval problem and used LTR for learning a ranking model. When we view MLTC as a problem of ranking class labels given a document, we can use LTR to estimate a classifier: we simply rank all classes given a document and assign the top k classes (k to be determined by another classifier) as labels to the input document.
Here, we briefly recall the formal principles underlying the used LTR method and describe LTR in terms of our classification task. We assume that we can compute several features which indicate, given a document d and a class c, how much discriminatory information the feature provides to determine if c is a label of d or not. In LTR, these measures are called features. The goal is to find an optimal linear combination of these features. Formally, given n features  $f_i$, we are searching for weights $w_1,\ldots,w_n$ such that the function f(c, d) defined in (1) optimally scores and ranks classes with regard to documents on some test set.
 \begin{equation}f(c,d)= w_1\cdot f_1(c,d) + \ldots + w_n\cdot f_n(c,d).\end{equation}
Similar to Yang and Gopal (Reference Yang and Gopal2012), we use LTR for MLTC. Using LTR for MLTC has many advantages compared to using traditional approaches for MLTC such as SVM’s. Yang and Gopal (Reference Yang and Gopal2012) showed that LTR outperforms classification-based approaches for MLTC by a large margin on a wide variety of datasets with different types of samples, for example, audio, image, and text. They used meta-level features for building an LTR model. The meta-level features are defined based on the distance between classes and documents. To compute meta-level features for a pair of document d and class c, first a kNN classifier is used to find most closest samples from c to d and their distance to d is used to form a feature vector. For document classification task, distances of documents estimated using TF-IDF statistics. Then, an LTR method is trained on top of these feature vectors. While this method has been shown to have a good performance in MLTC, it does not take the relations between classes into account in the MLTC task. Fauzan and Khodra (Reference Fauzan and Khodra2014) used the same framework for classifying documents; however, they focused on text classification, and instead of using meta-level features, they used typical features such as TF-IDF weights of words for learning an LTR model. Their method also outperforms traditional classification-based approaches. Ju et al. (Reference Ju, Moschitti and Johansson2013) tried to extend this idea by modeling the hierarchical structure of labels in the LTR framework. They used LTR as a re-ranker to re-rank the rankings created by a classifier by incorporating the structure of the categories. They achieved similar results to Yang and Gopal (Reference Yang and Gopal2012) confirming the effectiveness of LTR and modeling the hierarchical structure of labels for MLTC.
LTR can learn a global ranking function with respect to all classes, while classification-based approaches try to optimize a classifier locally per each class. In this sense, LTR can also take the relations between classes into account to some extent, which is a core problem in MLTC (Yang and Gopal Reference Yang and Gopal2012). From efficiency point of view, the constructed model of LTR is much smaller than the models constructed by traditional classifiers. Moreover, when using LTR, during inference only one model is used to score instances. Traditional classifiers build a model for each class and use all of them during inference which is less efficient compared to LTR.
2.3 Automatic classification of political documents
In this paper, we conduct our experiments on political documents. In this section, we briefly review previous work on multi-label classification of political documents. Supervised classification of political text including parliamentary proceedings, legislative text, and news articles is an active research area (Steinberger et al. Reference Steinberger, Pouliquen, Widiger, Ignat, Erjavec and Tufis2006; Verberne et al. Reference Verberne, Dahondt, van den Bosch and Marx2014; Dehghani et al. Reference Dehghani, Azarbonyad, Kamps and Marx2015; Dehghani et al. Reference Dehghani, Azarbonyad, Kamps and Marx2016a,b). While standard classification approaches such as SVM are used for classification of news articles and parliamentary proceedings, specialized classification tools are developed for classifying legislative texts such as JRC-Acquis documents. Different approaches have been proposed for automatically assigning labels to JRC-Acquis documents (de Campos and Romero Reference de Campos and Romero2009; Mencía and Fürnkranz Reference Mencía and Fürnkranz2010). In most of these studies, well-known classifiers have been combined with NLP techniques, such as part of speech tagging (Ebrahim et al. Reference Ebrahim, Ehrmann, Turchi and Steinberger2012) and segmentation (Daudaravicius Reference Daudaravicius2012), to achieve a higher performance on JRC-Acquis dataset. Steinberger et al. (Reference Steinberger, Ebrahim and Turchi2012) proposed a framework called JEX for labeling documents with EuroVoc concepts. They first construct a profile for each EuroVoc concept and use the method proposed in Pouliquen et al. (Reference Pouliquen, Steinberger and Ignat2003) for learning a classifier. Similar to feature selection approaches for text classification, JEX first represents each class as a bag of keywords. The keywords are extracted using TF-IDF statistics. Similarly, documents are also represented as bags of keywords. Then, the similarity (cosine and BM25) of document and class representations are used to rank the classes with respect to the documents.
3 Learning to rank for multi-label text classification
In this paper, we use AdaRank (Xu and Li Reference Xu and Li2007) to learn the weights of the features. AdaRank learns f(c, d), introduced in Section 2.2, from a collection of training examples. In our case, these are documents with their set of assigned labels. AdaRank optimizes the function f(c, d) on the evaluation measure of normalized discounted cumulative gain over the complete ranked list.
Note that in this setup, we are not only learning a model which ranks all classes given a document, but a function which scores classes given a document. In Section 4, we will re-estimate this scoring function based on co-occurrence patterns of the classes. Next, we describe the features used to construct f(c, d).
3.1 Features for MLTC
We use different sources of information for extracting the features. The sources used for MLTC are: (1) labeled documents, (2) textual labels of classes, and (3) the relations of classes (thesaurus structure). We create different representations for documents and classes, and use them to extract features.
Representations of documents are based on both title and body text of documents. The first representation (title representation) is based on the titles of documents. We first remove stopwords from the titles and stem them. Then, we represent the titles as bags of stemmed unigrams. The second representation (text representation) is the bag of stemmed unigrams without stopwords based on all text of the document (including the title).
Similarly, we create four representations for each class c. The first two representations (title and text representations) are the union of the title representation and text representation of all documents labeled by c, respectively. The third representation (label representation) is the bag of stemmed unigrams (without stopwords) of the label c. In our dataset, the mean and median number of tokens in the label representation of the classes are 2.12 and 2, respectively. The fourth representation (ancestors label representation) is the union of the label representations of all ancestors of the class c in the thesaurus hierarchy.
We now use the constructed representations and define different features. These representations lead to eight possible combinations of a document and class representations (2 times 4). Moreover, for estimating the similarity of each combination, we employ three IR measures: (a) language modeling similarity based on KL divergence using Dirichlet smoothing, (b) the same as (a) but using Jelinek-Mercer smoothing, and (c) Okapi-BM25. This leads to 24 features which are based on the textual similarity of documents and classes.
In addition to the features reflecting the textual similarity of documents and classes, we define a number of features reflecting the characteristics of classes independent of documents. First, the statistics of the classes in the training data is considered the prior knowledge for determining the likelihood of selecting a class as a label for documents. We define the number of times a class has been selected for annotating documents in the training data as its popularity. Second, the degree of ambiguity of a class implicitly affects its chance for being assigned to documents. We have used the relations between classes in the thesaurus hierarchy and modeled ambiguity with two different features: the number of parents of a class and the number of its children in the thesaurus graph. Another factor for determining the chance of a class for being selected as an annotation of a given document is its generality. We quantify the generality of a class as its depth in the thesaurus hierarchy (i.e., the length of its shortest path to the root).
Finally, for each document–class pair d and c, we construct a feature vector of size 28 (24 features based on the similarity of d and c, and 4 features based on the statistics of c). An overview of the features is given in Table 1. The value of each feature is normalized using Min-Max normalization and re-scaled to the [0, 1] interval.
Features extracted from each document–class pair to train LTR models. Note that for features 1–8, the similarity is calculated using three different methods. Therefore, each of these features represent three features. The size of the final feature vector is 28 (24 features based on the similarity of documents and classes (features 1–8), and 4 features based on the statistics of classes (features 9–12))

4 Propagation framework
In this section, we describe the score propagation framework for re-estimating the similarities of documents and classes based on the implicit relations between classes. This implicit information is the co-occurrence of classes in the labeled documents. Given a set of documents D and a set of classes C, let a similarity function f(c, d) as in Section 2.2 be defined. We can represent this function as a  $|C|\times|D|$ matrix S. We first normalize S by dividing each column $S_d$ by the sum of its values, so that all columns add up to 1. Then, we will step-by-step re-estimate S by incorporating co-occurrence patterns of classes. For that, we create a conditional probability matrix P of size of $|C|\times|C|$. Values of matrix P are determined as $P_{ij} = P(c_i|c_j)$. For each class c, the row $P_c$ is defined as follows: for each class cʹ
 \begin{equation*} P_c(c') = \begin{cases}P(c'|c), & \text{if there is a document labeled by both $c$ and $c'$ and $c \neq c'$} \\[6pt] 0, & \text{otherwise} \end{cases} \end{equation*}
where
 \begin{equation}P(c'|c) = \frac{|D_{c'} \cap D_c|}{|D_c|}\end{equation}
and  $D_c$ is the set of documents labeled with class c.
Now let  $S^0=S$. We re-estimate the scores using P as follows, where t indicates the iteration.
 \begin{equation}S^{t} = \alpha S^{t-1} + (1- \alpha) P S^{t-1}\end{equation}
Here  $\alpha$ is the neighborhood contribution parameter controlling how much we smooth S with the co-occurrence matrix. After each iteration, we normalize the values again by dividing each column by its sum.
This score propagation framework has two hyperparameters:  $\alpha$ and the number of iterations t. In Section 6, we discuss their influence and determine their optimal values.
Example 1 We give an example to illustrate how score propagation works. For simplicity, we assume that we want to re-estimate scores for only one document d. Assume that we have five classes (c1, c2, …, c5) and the following P and S matrices:
 \begin{equation*}P =\begin{bmatrix} 0 && \quad 0.2 && \quad 0 && \quad 0 && \quad 0 \\
0.4 && \quad 0 && \quad 0.3 && \quad 0.2 && \quad 0 \\
0 && \quad 0.3 && \quad 0 && \quad 0 && \quad 0 \\
0 && \quad 0.2 && \quad 0 && \quad 0 && \quad 0.4 \\
0 && \quad 0 && \quad 0 && \quad 0.3 && \quad 0\end{bmatrix}, S =\begin{bmatrix} 0.1 \\ 0.3 \\ 0.2 \\ 0.2 \\ 0.2\end{bmatrix}\end{equation*}
\begin{equation*}P =\begin{bmatrix} 0 && \quad 0.2 && \quad 0 && \quad 0 && \quad 0 \\
0.4 && \quad 0 && \quad 0.3 && \quad 0.2 && \quad 0 \\
0 && \quad 0.3 && \quad 0 && \quad 0 && \quad 0 \\
0 && \quad 0.2 && \quad 0 && \quad 0 && \quad 0.4 \\
0 && \quad 0 && \quad 0 && \quad 0.3 && \quad 0\end{bmatrix}, S =\begin{bmatrix} 0.1 \\ 0.3 \\ 0.2 \\ 0.2 \\ 0.2\end{bmatrix}\end{equation*}
We can represent P matrix as the directed graph shown in Figure 2, where nodes are classes and edges are weighted based on P. A conditional probability  $P(c'|c)=w $ is represented as an edge from c to cʹ with weight w. Let us assume that S[i] returns ith value from the vector S, where indexing starts from 1. In the first iteration of the algorithm, the score of c2 will be re-estimated based on its own score and the scores of c1, c3, and c4 as they are direct neighbors of c2 ( $S^1[2] = \alpha S^0[2] + (1-\alpha) (0.2S^0[1] + 0.3S^0[3] + 0.2S^0[4])$). The score of c4 will be re-estimated based on its own score and the scores of c2 and c5. In the second iteration, the score of c2 again will be affected by the re-estimated scores of its direct neighbors. Since the score of c4 is already affected by the score of c5, in the second iteration, the score of c2 will be affected by the score of c5 as well. Therefore, in iteration t, the indirect neighbors that are reachable by t edges are used for re-estimating scores.
The graph of classes for matrix P introduced in Example 1.

5 Experimental setup
In this section, we describe our research questions, the data, the experiments, and the baselines with which we compare our proposed methods. We recall the two main research questions from the introduction.
RQ1: How effective is an LTR approach integrating a variety of sources of information as features for MLTC?
RQ2: Is it worthwhile to use the co-occurrence patterns of classes for MLTC?
We also perform a feature analysis. We first measure the relative importance of each feature and then see if we can create an almost optimal performing system using only a small set of features. We perform several analysis to understand how the score propagation works and what kind of documents benefit the most from it. Additionally, we examine the effectiveness of a dynamic thresholding method for selecting the number of classes for documents. We study the effect of dataset size on the performance of different methods.
5.1 Dataset, pre-processing, and parameters
We use the English version of the JRC-Acquis dataset which contains documents of the European Union (EU) which are mostly on legal and political topics (Steinberger et al. Reference Steinberger, Pouliquen, Widiger, Ignat, Erjavec and Tufis2006). This dataset contains about 25,000 documents which have been manually labeled with EuroVoc concepts (EuroVoc Reference EuroVoc2014). EuroVoc contains 6796 hierarchically structured concepts, used to annotate political documents and news within the EU and in national governments. Since the structure of documents has changed over the years, we only use the documents of the last 5 years: from 2002 to 2006. We refer to this dataset as JRC1. We use the English version of JRC-Acquis, which contains 16,824 documents, each labeled with 5.4 concepts on average. The median and standard deviation of the number of labels per document are 5 and 1.83, respectively. Each document has a title, body text, and EuroVoc labels assigned to it. The mean and median length of titles of the documents are 21 and 19 words (with stopwords), respectively. The mean and median length of the texts are 2015 and 665 words, respectively.
Moreover, we evaluate the performance of MLTC models on another subset of the English version of the JRC-Acquis dataset, containing documents from years 1994 to 2001. We refer to this dataset as JRC2. This subset of dataset contains 4026 documents. The average number of labels per document on this subset is 5.2. The median and standard deviation of the number of labels per document are 5 and 1.41, respectively. The mean and median length of titles of the documents are 19 and 18 words (with stopwords), respectively. The mean and median length of the texts are 1846 and 537 words, respectively. The statistics of this subset of dataset is very similar to the statistics of JRC1 dataset; however, the number of documents on this subset is significantly lower.
To evaluate the proposed classification methods, we order the collection chronologically and train on the old documents and test on the newest documents. From an application perspective, this is the most natural setup. The 70% oldest documents are used to construct the representations of classes (as documents in LTR) and the co-occurrence matrix of classes. The remaining 30% of the collection is used for training and testing our LTR models. Naturally, the vocabulary and the set of classes used as labels differ in these two parts. To have a fair measure, we have removed the classes from the documents that do not occur in the first part. This leads to 1639 different classes in the JRC1 dataset. The reduction from the original 6796 classes to 1639 is expected as not all of them are used for labeling documents. On top of that, we use a subset of the dataset (not full dataset) in our experiments. Naturally, only a subset of full EuroVoc hierarchy is present in the dataset. The number of unique labels in JRC2 is 975 labels. For our baselines, there is no need to construct representations. Therefore, they can directly use the oldest 70% of the data on top of the newest 30% to build their models. To have a comparable evaluation, for fivefold cross-validation on our baselines, we add the first 70% part of the collection to the training data used in each fold and train their model. We have trained the ranking model using different LTR algorithms (AdaRank Xu and Li Reference Xu and Li2007, SVM-Rank Joachims Reference Joachims2006, and LambdaMART Burges et al. Reference Burges, Svore, Bennet, Andersec and Wu2011). Among them, AdaRank (Xu and Li Reference Xu and Li2007) has a slightly better performance and we report the results of this method.
We use a cutoff point of 5 and report Precision@5 as the main measure to evaluate different methods, since the median number of classes per document in our dataset is 5. Therefore, Precision@5 approximately could be considered as R-Precision as well. Moreover, we compute Recal@5, micro-averaged F-measure, and mean averaged precision (MAP). In Section 6.3, we use an approach for dynamically selecting the number of classes for documents (instead of using a fixed cutoff point) and study its effect on the performance of different classifiers.
We compare our approach to two baselines: JEX and SVM. JEX is one of the state-of-the-art systems developed for classifying JRC-Acquis documents (Steinberger et al. Reference Steinberger, Ebrahim and Turchi2012). Similar to feature selection approaches for text classification (Rehman, Javed, and Babri Reference Rehman, Javed and Babri2017), this method first represents each class as a bag of keywords. The keywords are extracted using TF-IDF statistics. The pre-processing done in this paper is the same as in JEX: we employ the Porter stemmer and consider the 100 top frequent words in the collection as stopwords, which are removed. Similarly, documents are also represented as bags of keywords. Then, the similarity (cosine and BM25) of document and class representations is used to rank the classes with respect to the documents. For SVM, each document is represented by a feature vector using TF-IDF values. Each element of this vector corresponds to a word and its value is the TF-IDF weight of the word in the document normalized by the length of the document. Then, we train an SVM model to estimate the probability of assigning classes to documents and use these probability scores to rank the classes with regard to the documents. In constructing the training set for SVM, we assume that a document belongs to all classes it is labeled with and add the document to the training material of those classes.
Hyperparameter settings We use default parameter settings for JEX. These are optimal for the JRC-Acquis dataset. We use different parameters for the similarity functions used as features in LTR. We use a validation set for setting parameters of different similarity functions. This set contains about 2000 samples and labels assigned to them. Based on pilot experiments, when using titles of documents for calculating the similarities, we use these parameters:  $\mu = 1000$ for LM-Dirichlet, $\lambda = 0.2$ for LM-JM, and $b = 0.65$ and $k_1=1.2$ for Okapi BM25. When we use the text of documents for calculating the similarities, we use these parameters: $\mu = 2000$ for LM-Dirichlet, $\lambda = 0.6$ for LM-JM, and $b = 0.75$ and $k_1=1.2$ for Okapi BM25.
6 Experimental results
In this section, we first answer our two research questions described in Section 5. Then, we study the impact of a dynamic thresholding method for selecting the number of classes for documents on the performance of different classifiers. Afterward, we analyze the effect of training set size of the performance of the classifiers. Finally, we focus more on the score propagation method and study its impact on different types of documents.
6.1 Effectiveness of LTR integrating a variety of sources of information
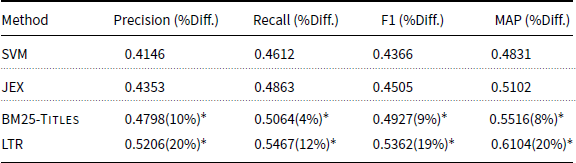
In this section, we evaluate the effectiveness of the LTR approach integrating a variety of sources of information for MLTC and look at the importance of the different features. Table 2 shows the results of the LTR method compared to the baseline system and JEX in terms of Precision and Recall on the JRC1 dataset. Performance of different methods on the JRC2 dataset is also shown in Table 3. BM25-Titles ranks the classes based on the similarities of their title representation with the title representations of documents. This is the best performing single feature and is significantly better than JEX (a performance comparison of different features is presented in Figure 3). Three observations can be made from Tables 2 and 3. First, the LTR method significantly outperforms SVM, BM25-Titles, and JEX, demonstrating that the additional sources of information employed in LTR are effective for the MLTC task. Second, the performance of SVM is the worst among all methods. This result shows that a standard classification approach is not effective for MLTC when there are many classes. We do an additional experiment in which we use the scores estimated by JEX as an additional feature in the LTR approach. The performance of this approach on JRC1 is: Precision = 0.5431 and Recall = 0.5608; and on JRC2 the performance is: Precision = 0.4621 and Recall = 0.4907. Adding JEX to the LTR approach improves the Precision of LTR by 4% on JRC1 and less than 2% on JRC2. This results show that JEX is also providing an additional informative feature. Third, on both datasets, the LTR method outperforms JEX. However, on the JRC2 dataset, the improvements are higher. JRC2 is a smaller dataset with fewer documents. This result shows that using multiple sources of information is even more effective when there are a small number of samples to train an MLTC model.
Performance of SVM, JEX, best single feature, and LTR methods for MLTC on the JRC1 dataset. We report incremental improvement and significance over JEX
 $^*$Indicates t-test, one-tailed, p-value $< 0.05$. $^*$Indicates t-test, one-tailed, p-value $< 0.05$.
Performance of SVM, JEX, best single feature, and LTR methods for MLTC on the JRC2. We report incremental improvement and significance over JEX
 $^*$Indicates t-test, one-tailed, p-value $< 0.05$.
$^*$Indicates t-test, one-tailed, p-value $< 0.05$.
Since JRC1 dataset is bigger than the JRC2 dataset, the results on JRC1 dataset is more reliable. In the rest of this section, we use the JRC1 dataset to perform several analysis and get more insights on the performance of the LTR model.
We now look at the individual features used in the LTR model.
Importance of Different Information Sources for MLTC. We use the trained model of SVM-Rank (Joachims Reference Joachims2006) as well as the Precision of employing each individual feature. Precision of each individual feature is computed using the feature to rank classes and computing Precision based on the rankings. For feature analysis, we assume the weight of each feature is a reflection of its importance. We use SVM-Rank for feature analysis because the weights it gives to the features are more smoothed. The performance of SVM-Rank is almost the same as the performance of AdaRank. Its performance in terms of Precision is 0.5013. AdaRank assigns very high weights to a few features and zero weights to the others. Here, we only want to analyze the importance of features, and AdaRank’s model does not reflect it very well.
Figure 3 illustrates the importance of a selected set of exploited features. We pick only one of the similarity methods (BM25) from each feature type since the other two get very similar scores.
Feature importance: (1) P@5 of individual features, (2) weights in SVM-Rank model.  $title\_D$ and $text\_D$ are title and text representations of document, respectively. $title\_C$, $text\_C$, $label\_C$, and $anc\_label\_C$ are title, text, label, and ancestors’ label representations of classes, respectively. This analysis is done on the model trained on the JRC1 dataset.
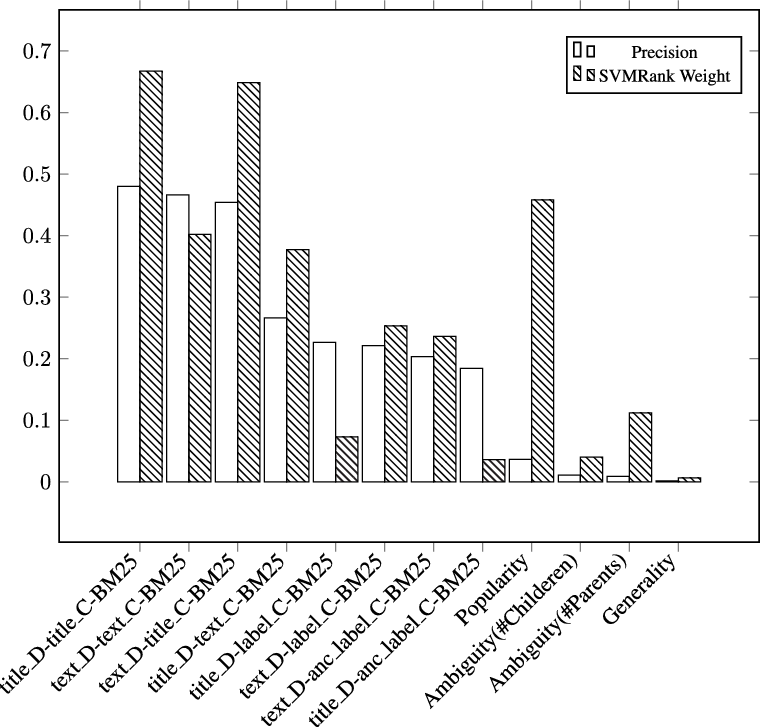
Similarity of title representations of documents and classes is the best performing feature. The performance of this feature is significantly better than the performance of the feature defined using text representations of both classes and documents. Similarity of text representation of the given document and title representation of the classes is also an effective feature. Therefore, title representations can be considered as a succinct predictor of classes. JRC-Aquis is a set of political documents. Titles of political documents tend to be directly descriptive of the content, making the title the most informative part of the document. Body of documents contain more information; however, the amount of irrelevant information in the body of documents is more compared to their title. In addition to this, human annotators will pay considerable attention to the titles. Recall that the titles in this dataset are relatively long (the median is 18 words).
All query-independent features by themselves have very low Precision. Used together with the other features, generality and ambiguity get a very low weight in contrast to popularity. Investigating the hierarchy graph of the concepts, we see that there is little variation in generality: the average number of levels in the hierarchy is 3.85 and its standard deviation is 1.29. There is a considerable difference in the ambiguity: the average number of children is 4.94 (standard deviation is 4.96) and the average number of parents is 1.08 (standard deviation is 0.25). Ambiguity may have low importance because it is not discriminative on this data. The popularity feature is weighted high because of the skewness of the assigned class labels in JRC-Acquis (EuroVoc Reference EuroVoc2014).
The analysis both confirms the intuitions (e.g., the importance of labeled examples) but also highlights features of the document genre (e.g., the importance of titles given their descriptive nature), and the human annotating behavior (e.g., the importance of popularity).
Lean-and-Mean Approach. The LTR uses a rather large set of features. Can we do almost as well with a small subset of the features?
We use our feature analysis to design a small system which uses a diverse combination of sources of information and employs the most efficient features from each source. Our lean-and-mean system is an LTR system trained on four selected features: the BM25 similarities of text representation of documents with text representation, title representation, and label representation of classes, and popularity of classes. Table 4 indicates the performance of this LTR-ttgp approach using only four features. The LTR-ttgp approach is significantly better than JEX and BM25-Titles. Although the performance of LTR is significantly better than the LTR-ttgp method, the performance of LTR-ttgp is 96% of the large LTR system. Moreover, based on our analysis, the computation time of the selected features is less than 50% of the time needed for computing whole features. Therefore, making the selective LTR approach a computationally attractive alternative to the full LTR approach.
Performance of LTR on all features compared to four selected features (LTR-ttgp) on the JRC1 dataset

6.2 Effectiveness of score propagation
In this section, we evaluate the use of co-occurrence patterns of classes in our classifiers. We will see that this method is indeed effective, although the gain diminishes for better classifiers. Table 5 shows the results of propagating scores for the previously used approaches. In all cases, we use the same hyperparameter setting: the neighborhood contribution parameter  $\alpha$ is equal to 0.7 and the number of iterations of the propagation approach is 2. These parameters are tuned on a validation set containing 2000 samples. Re-estimating the scores using classes’ co-occurrence patterns improves performance for all classifiers. Moreover, the results show that the propagation has the highest positive impact on SVM scores. SVM (without propagation) has the lowest performance among all methods. This indicates that when the classifier has a low quality, re-estimating the scores by propagation is more useful.
Performance of the score propagation approach on the JRC1 dataset. We report incremental improvement and significance of each score propagation approach over its non-propagated version

*Indicates t-test, one-tailed, p-value  $< 0.05$.
*Indicates t-test, one-tailed, p-value $< 0.05$.
To gain additional insights into the score propagation approach, we analyze the effect of the parameters on the performance:  $\alpha$ and the number of iterations. We use JRC1 dataset to perform this analysis. Figure 4 shows the Precision of different approaches for different values of $\alpha$. The value of $\alpha$ has a great impact on the performance of all systems. The best performance is achieved for $0.7 \leq \alpha \leq 0.8$ which indicates that although the co-occurrence information is useful for annotating documents more accurately, the similarity of classes and documents is still much more important.
The effect of  $\alpha$ parameter on Precision achieved by propagating the scores of different text classification approaches. The number of iterations is set to 2.

Figure 5 shows the Precision of different classifiers in different iterations of score propagation. All methods achieve their best performance with a few iterations. With only one iteration, the score of a class c is affected by the scores of its direct neighbors (a class cʹ is a neighbor of c if there is a document labeled by both c and cʹ). Therefore, low number of iterations corresponds to using only the scores of co-occurring classes to re-estimate the score of c. With high number of iterations, the score of c is affected by the scores of the classes that are indirect neighbors of c and might not be related to c. Therefore, the results are better with a few iterations where only close neighbors contribute to the score of a class and documents.
Precision achieved in different iterations of score propagation method for different text classification approaches. The value of  $\alpha$ is set to 0.7.

6.3 The impact of using a dynamic threshold for choosing the number of classes
All the results reported so far are achieved by ranking classes for documents and choosing top five classes as labels of documents. In other words, we use the median number of classes in the training set (which is 5) as the number of classes for every document. In this section, we relax this assumption and use a dynamic threshold for choosing the number of classes and study its impact of the performance in MLTC.
To choose the number of classes for documents, we use the approach proposed in Elisseeff and Weston (Reference Elisseeff and Weston2001), Yang and Gopal (Reference Yang and Gopal2012). This method tries to learn a mapping from a ranked list of classes to its optimal number of classes using a training set. The training data for this approach is a set of ranked lists of classes (sorted by their scores regarding a document) and an optimal threshold for each ranked list which is achieved by minimizing a classification loss. Given this training set, the thresholding method tries to find a mapping from the space of ranked lists to the space of thresholds. After selecting a threshold for a document, classes with a score higher than the threshold are assigned to the document. As in Yang and Gopal (Reference Yang and Gopal2012), the classification loss is defined as the sum of false negatives and false positives. Therefore, the training set for learning the mapping is automatically constructed using a ranker to rank classes regarding the documents and assigning a threshold to the ranked list that minimizes the classification loss. After creating this set, an optimal mapping is learned based on a linear-least-square-fit solution (Yang and Gopal Reference Yang and Gopal2012) using the following equation:
 \begin{equation}\underset{w^*, b^*}{\mathrm{min}} \sum_{i=1}^{m} ((w^* r(d_i) + b^*) - s(d_i))^2,\end{equation}
where m is the number of documents in the training set,  $r(d_i)$ is a list of scores corresponding to the ranked list of classes with regard to a document $d_i$, and $s(d_i)$ is the optimal threshold for $r(d_i)$ determined by minimizing the classification loss. The goal of the linear-least-square-fit is to determine the parameters of the linear mapping ( $w^*$ and $b^*$) and use them to determine the thresholds for new instances. Note that the dimensions of the operands are $w^*_{|1|\times|C|}$ and $r(d_i)_{|C|\times|1|}$, and $b^*$ and $s(d_i)$ are scalars. We use the same set of documents used for creating the classifier for learning the thresholding method. After having the learned thresholding model, we use it to select the number of classes for documents in test set.
Table 6 shows the results of this experiment using different classifiers (note that we do not report MAP for this experiment as it is the same as the ones reported in Table 2). Again, we use the JRC1 dataset to do the set of experiments in this section. Dynamic thresholding improves performance on both Recall and Precision for all classifiers. The improvements are significant for Recall but not for Precision (see Table 6). Figure 6 shows the distribution of number of classes for documents in the dataset. The distribution is almost normal with a mean of 5. This explains why a static threshold of 5 has a reasonable performance. Based on the results, on the best performing method (Propagated LTR), for 89% of documents with more than five classes, the dynamic thresholding picks a number higher than 5. For documents with less than five classes, only in 69% of times a number less than 5 is picked. This gives us more insights on why Recall is improved more than Precision, as the dynamic thresholding in general tends to work better for documents with more classes.
Performance of SVM, JEX, BM25-Titles, and LTR, and Propagated LTR methods for MLTC using a dynamic threshold for selecting the number of classes. The significance tests are done on the improvements of each method using a dynamic threshold over its corresponding method which uses a static threshold, for example, setting number of classes to 5

$^*$Indicates t-test, one-tailed, p-value $< 0.05$.
The distribution of number of classes in documents. X-axis corresponds to the number of classes assigned to documents in the ground-truth and Y-axis corresponds to the number of documents in log-scale.
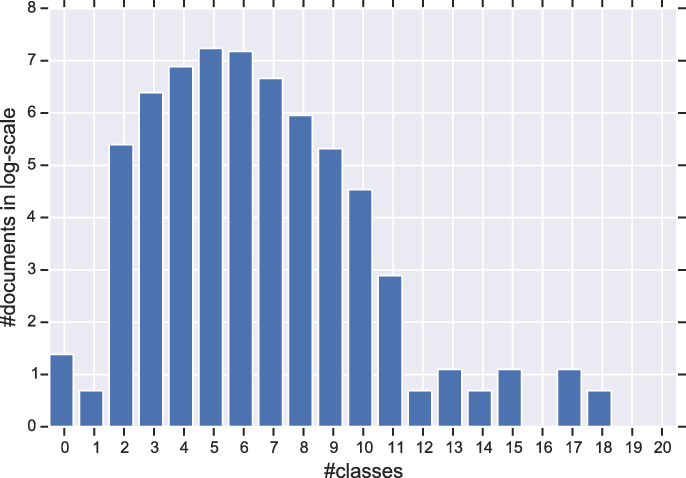
Table 7 shows the root mean squared error (RMSE) and the mean absolute error (MAE) between the true number of classes and the estimated number of classes for different methods. Moreover, in this table, the accuracy of dynamic thresholding in choosing the correct number of classes for documents is shown. The results indicate that, in general, dynamic thresholding performs better in terms of all metrics when the underlying classifier has a good performance. The main reason for this is that when the underlying classifier has a poor performance, the optimal threshold for the ranked list which is obtained by minimizing the classification loss is not reliable. The optimal performance for the thresholding method will be achieved with a perfect classifier which ranks all true classes on top of the ranked list, as in this case the optimal threshold will correspond to the actual number of classes. However, as the performance of the classifier degrades, the ranked lists used for creating the training set for thresholding get more unreliable.
The root mean squared error (RMSE) and mean absolute error (MAE) between the assigned number of classes and the actual number of classes for documents and the accuracy of the thresholding method in choosing the correct number of classes for documents for SVM, JEX, BM25-Titles, and LTR, and Propagated LTR methods for MLTC. The accuracy is calculated by dividing the number of documents for which the thresholding method picked a correct number of classes by total number of documents. We also report RMSE, MAE, and accuracy for the fixed threshold method (choosing top five classes)

Overall, based on the results in this section, we conclude that dynamic thresholding is an effective approach for selecting the number of classes and it can have a big impact of the performance of classifier on MLTC task.
6.4 The impact of dataset size on the performance of different classifiers
In this section, we study the impact of size of training set per class on the performance of different classifiers. To do this, we use JRC1 dataset and select the classes which at least have 20 training samples. Afterward, we balance the dataset by taking an equal number of instances per class. Then, we vary the number of samples per class and report the performance of using different number of instances per class. Figure 7 shows the results of this experiment. This subset of the dataset contains 4381 classes. Again, we use 70% oldest documents for creating the representation of classes and the remaining 30% for training and testing the models.
Precision achieved using different sample sizes for classes. X-axis corresponds to the number of samples used per class for training the classifiers.

The performance of the LTR method is better than the performance of other classifiers for different number of samples per class. This result, again, indicates that the LTR method is the most effective method for MLTC. As the results show, the performance of all methods is getting improved by increasing the number of samples per class. However, the rate of the improvement is different for different models. The rate is quite high for SVM and this method can benefit more from more samples. This is expected as adding more samples helps SVM learn a better decision boundary for classes and generalize better. This effect is similar for JEX and this method also benefits a lot from more samples. The LTR method achieves a good performance with 100 examples per class and the performance does not change much by increasing the number of instances. The impact of increasing the number of samples on the performance of BM25-Titles is similar to this effect on LTR. Both LTR and BM25-Titles are ranking-based classifiers. This results indicate that, first, ranking-based methods are more stable with regard to the number of samples compared to classification approaches. These models create a profile for each class and even with a few samples the created profiles are good enough for computing the similarity of classes and documents. Second, LTR which tries to combine different sources of information is the most stable method. This shows the impact of using all available information on the performance in MLTC. An intelligent combination model can achieve a reasonable performance even when there are only a few samples per class.
6.5 What kind of documents benefit the most from score propagation?
In this section, we analyze the effect of score propagation on the performance achieved for different types of documents. To do this, we first bin the documents on JRC1 dataset based on the number of classes assigned to them in the ground-truth data. Then, we use the LTR method to assign classes to the documents and measure the Precision for each bin. Our running hypothesis is that the score propagation method should have a better performance on documents with more classes, as in this case, there is more information from neighboring classes available for assigning classes.
Figure 8 shows the results of this experiment. The results show that with a low number of iterations, the performance for documents with a low number of classes is higher. For example, for documents with only three or four classes, the best performance is achieved when we do not use the score propagation method at all (Iteration=0). In this case, increasing the propagation effect (number of iterations) results in a lower Precision. On the other hand, for documents with a high number of classes (documents with more than six classes), by increasing the number of iterations, the Precision keeps getting improved.
Precision achieved for different bins of documents in JRC1 dataset based on their actual number of classes in the ground-truth data. X-axis corresponds to the number of classes per document.

These results indicate that when there is more information provided by neighboring classes, the score propagation method can exploit it to re-assign classes to documents more accurately. The score propagation method tries to re-assign the classes based on their co-occurrence information in the training set. For documents with more classes, it can use the scores assigned by the LTR method to co-occurring classes, which are true labels of documents, to increase their scores. When the number of true classes is low, the score propagation still tries to use the information provided by co-occurring classes to re-estimate the scores, but in this case it results in adding more noise as these kind of documents are focused on a few topics and there is no need to disambiguate them using scores provided by relevant classes.
Our score prorogation method has an exploratory behavior. With low number of iterations, the exploration effect is low. However, when we increase the number of iterations, it tries to explore more and use the information provided by indirect neighbors. The results presented in this section indicate that this exploration has a positive impact on documents with a high number of classes and getting more information from even indirect neighbors can help classify these kind of documents. For documents a low number of classes, the score propagation method is not helpful indicating that there is no need for exploration for these kind of documents. Therefore, we conclude that it is best to use the score propagation method when there is a need for exploration, and documents have a high number of classes.
7 Conclusion
Simple classification approaches (such as binary classification methods) for MLTC fail when there is a high number of classes. In this paper, we considered MLTC a ranking problem and proposed LTR as a solution. Our approach is based on combining different sources of information for MLTC. We found that LTR can effectively exploit several sources of evidence, leading to significant improvements over the state of the art. The LTR approach is rather brute force, but is able to infer many complexities of human class assignment based on the observed data. It can also be viewed as a (soft) upperbound on performance, also taking into account the inter-indexer agreement, for example, Livonen (Reference Livonen1995). Our findings mostly confirmed the intuitions with the labeled examples as the key source of evidence. The title evidence was remarkably important, due to its descriptive nature and high precision. Interestingly, popularity is a feature without any power in isolation, but very effective in combination in order to capture important aspects of human labeling behavior.
The proposed LTR approach is built on top of the method proposed in Yang and Gopal (Reference Yang and Gopal2012). While our results confirmed the main findings in Yang and Gopal (Reference Yang and Gopal2012), we extended the use of LTR for MLTC is various aspects: (1) We used LTR in an MLTC setting with a very high number of labels. (2) Our approach combines various signals coming from different sources in a unique way using LTR. (3) We employed a score propagation method on top of the LTR method to directly use implicit relations between classes.
We proposed to use the co-occurrence patterns of classes in the labeled documents to improve the accuracy of the MLTC classifier. This is more effective when the underlying classifier has a low accuracy, indicating that co-occurrence patterns of classes are important signals for classifying documents in MLTC task.
The findings of this research have several theoretical implications. First, the fact that the ranking-based MLTC classifiers perform better than traditional classification approaches implies that more effective MLTC systems can be designed by defining and optimizing for a ranking loss rather than a classification loss. Second, rather than just using a set of training samples, utilizing various sources of information leads to better performances in MLTC. LTR is an effective approach for unifying and utilizing different information sources for MLTC. An interesting future research direction can be designing MLTC systems using various sources of information and by adapting a ranking loss into the MLTC framework. The findings of this research have also practical implications on designing MLTC systems. The identification of a subset of effective features from all sources of information opens up the possibility to design efficient MLTC systems. Also, our analysis on the importance of different features can help human annotators to concentrate their focus on the important parts of documents while assigning labels to them. Moreover, our findings imply that it is more important to use other sources of information such as co-occurrence patterns of classes for hard classification problems. The designed classifier can be adapted in various applications, such as exploratory search, automatic indexing of textual documents, text summarization, and mapping text collection to ontologies. As our analysis showed, most discriminatory feature in our setting is the title of a document. An interesting future direction would be applying the proposed approach for a short-text classification task. In this work, we explored the effectiveness of the proposed method on classifying the English version of JRC-Acquis dataset. As an additional work, this method can be also explored in other versions (languages) of the EuroVoc and JRC-Acquis collection. Moreover, the propagation framework has potential to be explored even with other sources of information that are not part of the data, such as Wikidata or DBpedia. It would be interesting to explore its effectiveness on these kind of information sources.
Acknowledgments
This research was supported by the Netherlands Organization for Scientific Research (ExPoSe project, NWO CI # 314.99.108; DiLiPaD project, NWO Digging into Data # 600.006.014) and by the European Community’s Seventh Framework Program (FP7/2007-2013) under grant agreement ENVRI, number 283465.
Appendix
A.1 Summary of different MLTC methods
A summary of MLTC methods: “Label information” indicates whether label-specific information such as textual gloassary is used or not, “Ranking loss” indicates whether a ranking loss is used for training the classifier or not, and “Thresholding” indicates whether a thresholding method is used for selecting number of labels or not.


 Open access