


Britain at the turn of the twentieth century was a pivotal time and place for the development of a global economic network and the creation of a corporate class of directors. The limited liability and joint-stock company acts of the 1850s and 1860s introduced general incorporation. In the late nineteenth century partnerships were still the main legal form of business organization in British industry. However, the scene changed rapidly: by the mid-1910s, the limited liability company had become the most common form for large businesses.Footnote 1 Hence, 1881–1911 was an important period to assess how the position of company director was evolving when a partnership, and even sole proprietorship, remained important alternatives for an organization. This period also marks the time when advances in communication technology were firmly established to enable instant international transfers of information, allowing the first true multinationals to operate in real-time and creating the conditions for larger and more dispersed firms in a wider range of sectors.Footnote 2 The expansion of incorporation over the period was accompanied by growth in the number of company directors. Who comprised this corporate population was not only of interest to potential shareholders but also, increasingly, to the wider public. Business leaders were one of the groups with power in society and company directors were people with influence who formed local, if not national, elites, and were drawn into wider corporate networks that spanned the country as well as the empire.Footnote 3 Hence, examination of director networks opens some understanding of how business leaders exercised this power, and how they interacted with other influential groups, such as political and aristocratic elites.Footnote 4
Most work on directors has been focused on a small subsection of directors: either those involved with the largest companies, mainly drawn from banks and the largest manufacturers who were the earliest to incorporate, or the elite directors.Footnote 5 Less is known about the characteristics of the wider population of early corporate directors; those who were involved in smaller or newer companies that incorporated over the decades between 1880 and the First World War and were still experimenting with the new corporate form. Our research seeks to address this gap, by examining the full corporate population as represented by the Directory of Directors (DoD) over four cross-sections between 1881 and 1911.Footnote 6 The DoD is a large-scale and valuable source for information on directors for the period, listing directors with the companies, both public and private, in which they were involved.Footnote 7 Rather than sampling specific companies, our research takes directors as the starting point. It allows analysis of their interlocks, providing a full overview of not only elite companies and directors but also smaller and more locally embedded firms. From this, we trace director interconnections to examine how far power structures extended beyond the elite, and to what extent they were still rooted in local business clusters. Because of their wider value, the full data are available as an open-access resource allowing replication and development by others.Footnote 8
The rest of this paper is structured as follows: the next section provides an overview of the literature on director networks and clusters, as well as a brief introduction to network analysis. The following section introduces the data and explores the characteristics and trends of the companies included in the dataset and their directors. The third section focuses on elite directors, while the fourth section examines the geography of corporate clusters. The final section examines Britain’s corporate network as a whole, how it interlocked, and how it evolved.
Networks and ClustersFootnote 9
The study of director networks is tied to several aspects of business history. It examines the individual firms and the people that comprised the population of directors, looks at the interactions and networks shaped by their interlocks, and analyzes how a wider business culture that emerged through the resulting clusters shaped entrepreneurial environments.Footnote 10 There were no formal requirements to become a director, aside from owning a qualifying amount of company capital, and they had varied profiles in terms of background, education, and business experience. The earliest incorporated companies often had Members of Parliament (MPs) or landed gentry on their boards, while many later companies were converted partnerships with most of their directors being the former partners and managers. By the turn of the twentieth century, there were increasingly “professional directors,” as well as retired businessmen who sat on several company boards.Footnote 11
The formal role of the company’s board was determined by the company’s articles of association but generally involved determining company strategy and taking important financial decisions including, for public companies, the dividends to be paid to the company’s shareholders. Over the period studied the everyday management of the company was increasingly in the hands of an executive team, often led by a managing director, two or three other members of the board, and senior salaried staff; the rest of the board might act as strategic replacements or backstops during moments of crisis.Footnote 12 In addition, directors had a key role in creating connections and providing access to resources through their reputations and connections as prominent people and business experience. There was little de jure protection of a shareholder’s investment, and as such investors had to place their trust in their directors.Footnote 13 In most larger companies, ownership was dispersed and directors increasingly held smaller proportions of capital.Footnote 14 For private companies, which were numerous during the pre-First World War era, the main shareholders and directors were the same people, and hence interests were generally aligned. Research on modern large companies suggests that the role of boards is usually greater for smaller than larger corporations, and corporate directors therefore gain considerable power in such firms.Footnote 15 Whether public or private, company directors’ interpersonal relations helped develop financial connections between banks and industry, as well as between the home location, the rest of Britain, its colonies, and the wider world. Their networks, therefore, were potential conductors of information, power, money, and resources, laying the foundations of globalized economies.
Company interlocks occurred when a director sat on the boards of two or more companies. Interlocks were common: by the end of the twentieth century in the United States, 85 to 90 percent of large firms and their directors were linked into a single connected network, with the average number of links needed to reach any of these firms or directors only three or four.Footnote 16 A director participating in several company boardrooms implied two things: firstly, the connection allowed the transfer of ideas and knowledge between the companies, or even between industries. From a firm’s point of view, having a director interlocking with other companies increased the firm’s access to resources, including finance, knowledge about competitors, or the best suppliers. As such, directors can be thought of as human capital. Secondly, interlocking directors stood out from unlinked directors by becoming a separate “class”: instead of solely working for the benefit of the single company, interlocking directors were more likely to act from the perspective of the wider business sector.Footnote 17 They became “of the industry” rather than of the company, particularly in the case of “big linkers” on multiple boards. They were no longer colleagues at one company that met in the context of promoting that company but were recognizable as key members of the corporate elite in their sector and many cases across the economy as a whole.Footnote 18 The study of director networks is important from both angles: on the one hand, examining the potential for knowledge transfers that spread through the connections between people and organizations, and on the other hand, illustrating the extent of group cohesion of the director community within wider business culture.
Literature on director networks as conduits of knowledge and resources has focused on the network mechanisms for the diffusion of business practices.Footnote 19 This could be positive for the companies, and thus for the shareholders, for example in the case of sharing innovative practices or encouraging collaboration. However, it also opened possibilities for losing confidential trade secrets, and for collusion or corruption, such as price rings, and use of unfair insider information in the case of takeovers or acquisitions.Footnote 20 Modern shareholder concerns about directors sitting on multiple boards of public companies include them becoming too busy to focus on their company or, conversely, that the overlap of board memberships and a strong network leads to an informal power base that can control the corporation at the expense of their shareholders.Footnote 21 Literature on the business community, on the other hand, is focused on the cohesion of the corporate community, particularly its elite. Studies have found great similarities between directors in terms of social background and political behavior, both because new directors were selected from existing social networks and because social interaction in the boardroom created shared identities and worldviews, potentially leading to groupthink.Footnote 22 Business elites reproduced and regenerated, so while their individual membership was constantly changing, and competition existed within the corporate group, the business culture remained relatively stable over time.Footnote 23 On the positive side, social closure associated with strongly linked networks formed a key condition for generalized trust.Footnote 24 This type of trust within a group created a set of obligations and expectations and could sanction deviant behavior from within the group. This was important in the context of the pre-First World War business world, where communication could lag, transparency between companies was lower and companies had to trust that other businesses operated under similar norms and values. On the negative side, strong cohesion could lead to a stifling of innovation, as experiences and ideas were homogenous within the group. This could lead to the collective decline of the sector or the whole economy, a criticism leveled at the British corporate elite by Chandler.Footnote 25 However, those whose interlocks bridged across several groups or sectors could counteract this, as they might be more likely to come up with innovative ideas.Footnote 26
Much of the literature on director networks has focused on the elite.Footnote 27 Elite has been defined and delineated in different ways. Many studies focus on directors with titles, often in the context of the “ornamental” appointment of aristocratic directors to attract shareholders or maintain the trust of lenders. Another measure of the elite involves political influence and the presence of MPs on company boards. Wealth, and how landed capital related to business or manufacturing has long been an important issue in economic history.Footnote 28 Studies into the background of individual businessmen show that many were members of educational and social elites as well and that their networks were replicated through shared schools or clubs.Footnote 29 By 1911 almost a quarter of company chairmen had a university education, and almost 60 percent was a member of an elite gentlemen’s club.Footnote 30 The social background of business leaders, however, varied by sector and changed over time.Footnote 31 Even in 1881 large manufacturers had 1–3 professional directors, particularly engineers in public companies.Footnote 32 By 1911, while a large proportion still came from the landed elite, almost 40 percent of company chairmen across all sectors had direct professional or business experience.Footnote 33 Even directors without professional experience often had pertinent roles in terms of delivering access to wider connections and resources, and providing clear business benefits to their companies. For instance, in the nineteenth century different elites, aristocratic, military, or political, dominated the boards of railway companies in different locations; such directors with political connections could help secure property rights.Footnote 34
Another avenue of study of elite networks has been to focus on the largest companies and their directors. A key topic of interest for the study of director networks is the interlocks between banks and major firms as an aspect of the relationship between the financial and manufacturing sectors, the avenues for financing industrialization, and the origins of Britain’s slide in the twentieth century.Footnote 35 Research into this “financial hegemony” examines underlying power relationships within the bank-industrial interlocks, mainly to see whether banks interlocked with other firms in order to control how they spent their finances.Footnote 36 Due to the interest in interlocks between banks and industries, much research has sampled the boards of only the largest banks and other companies. More recently, several studies have pointed out that we need to go beyond just banks to see the rest of the financial sector in considering how finance and manufacturing are interrelated. For instance, in the early twentieth century, nonbank financial institutions were the most interconnected, with insurance companies in particular interlocked with large industrial and transport firms.Footnote 37 Nonbank financials such as financial trusts and land investment have been found to have strong linkages with each other, and also to railways, more than manufacturing and industrial interlocks.Footnote 38
A separate set of scholarly works considers the connections of the noncorporate business population. This is mostly rooted in the literature on industrial business clusters. These were geographical agglomerations of related production activities, where several large firms existed close together, allowing business proprietors to meet, share business news, and form personal connections. These interactions resulted in knowledge communities through which ideas about key products, processes, or innovation flowed more easily than outside the cluster, giving the region a competitive advantage for a certain product over the rest of the country.Footnote 39 Business clusters also created pools of skilled labor in certain industries, which in turn attracted new business. They tended to be spatially anchored in key locations that were industrial or urban, such as global cities for multinationals today.Footnote 40 Their geographies played a role in the creation of interlocks through proximity, access to neighboring firms, and ease of travel.Footnote 41 Research on Australian interlocks, for instance, has found that geographic proximity was a key factor in its pre-First World War director interlocks, with 91 percent of interlocked firms having headquarters in the same city in 1911.Footnote 42 Recent work on Britain has shown that the geography of its industries was relatively stable over the nineteenth century. When new industries emerged, they often linked into older clusters where relevant knowledge or an appropriately skilled labor force already existed. For instance, bicycle and car production emerged in clusters that had existing carriage, metal and tool manufacturing expertise.Footnote 43 Urban locations can be categorized by the key characteristics of their noncorporate business population, such as light manufacturing centers, cotton manufacturing centers, or ports.Footnote 44 These predominantly noncorporate clusters formed the basis from which many of the corporate directors were to emerge over the growth of incorporation between 1881 and 1911, and therefore offer an important point of comparison.
Before moving to the data discussion, we briefly introduce how director networks have been analyzed. Network analysis focuses on visualizing these relationships and identifying the lines of communication. We follow most studies that use network analysis and rely on one or several measures that probe the strength of links or the cohesiveness of the network. In this analysis, we have used Gephi as the network software.Footnote 45 Networks can be either viewed from the connecting companies’ point of view, or the directors’. Most studies focus on only one approach, due to an empirical divide of collecting data based on either a sample of companies or a sample of directors. However, recent research has highlighted the need to look at both companies and directors, as both together simultaneously drove the evolution of corporate networks.Footnote 46 Here, we consider the corporate network as a bipartite network between the companies and their directors. This means that both companies and directors are considered as nodes. The advantage of this approach is that no information about either the director or company is lost when examining the connections.Footnote 47
The network can be measured by its cohesion as a group, through communities that gather together within the wider network, and through characteristics of its individual nodes, for instance as big linkers or bridges between several communities. Big linkers can be identified through the measure of degree centrality, which counts the number of connections a company or director has. This measure finds well-connected nodes, which in practice were often driven by sector. Nodes that acted as bridges between industries or groups can be identified through betweenness centrality, which measures how often a company or director appeared on the shortest path between other nodes in the network. Bridges were often on the periphery of several groups but the only ones to connect them, indicating they could access resources that were sparsely located across the network, with research showing positive relationships between high betweenness scores and the founding of new industrial firms.Footnote 48 Network cohesion can be measured through closeness centrality, which measures each node’s closeness to reach all other directors or firms in the network. Within a large network like the one studied here, however, this measure does not differentiate similar groups. Instead, we use eigenvector centrality, a version of closeness centrality that measures the extended connections of each director or firm, weighing not just the centrality of the nodes connected to the original starting point, but also those to whom this node connects, and so forth. It provides a rounded measure of who the central people or companies in the large network were.
Communities within a larger network can be detected on the basis that nodes are better connected to nodes within the same community and to fewer nodes outside the assigned community—although as they all remain part of the same network, there will be some interaction between the community through bridges. Our analysis has identified communities based on the Leiden algorithm, which creates partitions between groupings of nodes and then iteratively assigns nodes to the community where they are best connected. The process of further partitions and allocations is repeated until each node is assigned to its optimal community.Footnote 49 By examining the characteristics of these communities, we can reach an understanding of the ways in which directors interact.
The Data: The Directory of Directors
This research is based on an annual compilation of company directors: the Directory of Directors (DoD), and linkage as far as possible between its listings and those for the same individuals in the population census. The period covered starts with 1881, the first census year after the initial publication of the DoD, and takes 4 data points, each a decade apart, ending with the last census for which electronic records are currently available in I-CeM: the 1911 census.Footnote 50
The DoD, first published in 1879, was an annual “list of the directors of the joint stock companies of the United Kingdom” by Thomas Skinner, who was also the compiler of the Stock Exchange Year Book (SEYB). The Prefaces of the DoD report that the compilation was based on lists of companies, from which directors were mailed to check their details. This was updated annually, with a turnover rate of 20-30 percent as directors entered or exited their company responsibilities. Skinner states for DoD Reference Skinner1882, that “Inaccuracies there ought not to be, as everything is posted up from official documents, and each of the 8,500 notices now in the book was submitted through the post to the subjects of them.” Hence, its accuracy and currency should be high. However, the precise sampling frame of companies is unclear. Skinner clearly used the SEYB as a starting point and states that it “is intended to be used as a companion to the SEYB.” but the DoD also contained companies that were not in the SEYB. For example, in 1881 the SEYB contained about 2,500 companies, but the DoD listed about 3,000. Skinner’s further sources were chiefly the registration details of new companies when first registered (which was the basis of the SEYB), and personal contacts to company promoters and lenders in the City; he also stated he updated using “particulars … through the press.”Footnote 51 As the DoD became established directors may also have contacted him to ensure inclusion. As a consequence of this compilation method, the DoD contained all listed companies in the SEYB, but may not contain all their directors if they refused to confirm their details; it also contains a range of less prominent locally-listed businesses and some private companies. This makes it a valuable source for the period across a wide range of corporate businesses of different sizes and business forms, containing almost all the largest enterprises and many small firms not covered in other sources.
The DoD listed the directors in alphabetical order, giving their title and name, and either a personal address or their business with a business address. The companies they directed, if more than one, were listed with the director’s role in the company, such as chairman or ordinary director. Our data enrichment coded the companies to sectors and main locations of operation, while director roles were condensed into key groups.Footnote 52 In addition, we have identified the 50 largest companies in our dataset by consulting existing compilations.Footnote 53 Over 90 percent of directors in the DoD provided a main address in England, Wales, or Scotland, and these were geocoded to their location. It was also possible to link around a third of directors to the population censuses 1881-1911, which provides additional data on their demographics and households.Footnote 54
The rise of incorporation over the period 1880-1910s is reflected in the growth of both the number of directors and companies as shown in Table 1. The growth appears to be real and not an artifact of changes in Skinner’s compilation method. His prefatory comments indicated slow growth in the mid-1880s due to “torpor” of the economy, but rapid increases in the late 1880s. In 1892 he observed a greater increase in the number of companies than the number of directors due to the use of “tried men.” Again in 1907 and 1911 he noted the expanding number of directorships of many individuals, with an average of 2 and reaching a maximum of 36.
Descriptive statistics: directors, directorships, and companies by year. NB Companies are an approximate number 1

1 Numbers of companies were compiled from directorships returned by different directors, and although standardized as much as possible, this number may contain some duplicates. Some companies had different boards for sub-divisions, which were counted as separate directorships by its directors.
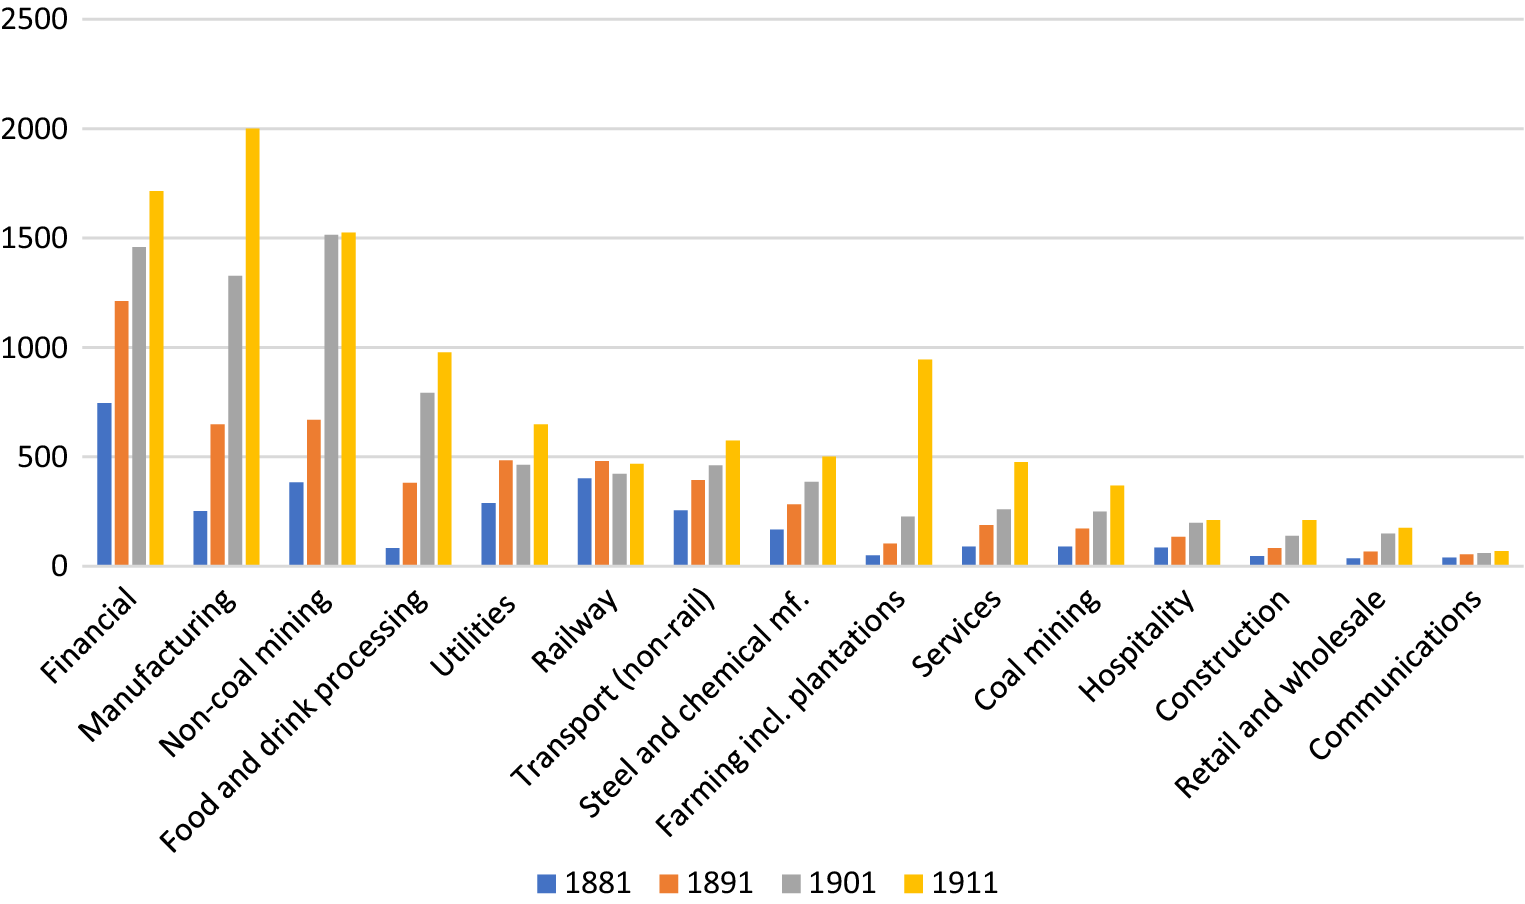
The type of company that sought to incorporate changed over time, which is shown in Figure 1. In 1881, half of the companies were in the financial, railway, and noncoal mining sectors, with manufacturing accounting for just over 8 percent. By 1911, however, manufacturing was the single largest sector accounting for 18 percent of companies. Noncoal mining had a peak at 18 percent of all companies in 1901, reflecting the gold mining boom of the late 1890s, when natural resources investments accounted for a third of nongovernmental capital movement, but then stabilized and the sector decreased in importance in relative terms.Footnote 55 In contrast, farming, which included plantations, and food and drink processing grew to become prominent sectors by 1911. Growth in these sectors was mainly due to foreign and colonial corporate activities: a plantations boom over 1900-1910, particularly rubber, is reflected in this rise.Footnote 56 Some sectors had very low levels of incorporation, such as construction, hospitality, or retail, but even these increased in number over the period. The communications sector (which included cables and telephones) had a high level of incorporation but overall was a relatively small sector. Other sectors, such as railways, other transport, and utilities had been some of the earliest companies to incorporate and were increasingly consolidated into a small number of large firms.
Number of companies by sector and year in the DoD.
The number of directors varied between the sectors. The DoD is an imprecise source for board size as it was compiled from the directors as a starting point, nevertheless, the DoD data accord with other sources that assess board size directly from company records as averaging 9-10 directors.Footnote 57 Skinner sought to capture all board members since he used the SEYB boards as his main sampling frame. Hence, his data were probably almost complete. The largest board sizes throughout the period were in the financial sector (the subsectors of which were banks, investment trusts, and insurance). Insurance companies in particular averaged more than 20 directors on their boards, while banks also had larger boards than most other sectors. Both these subsectors featured large companies with local boards in various locations, resulting in a wide range of directors spread out over the country. Other sectors, such as hospitality and service companies averaged smaller boards, often reflecting their origin as local partnerships converted to corporate businesses.
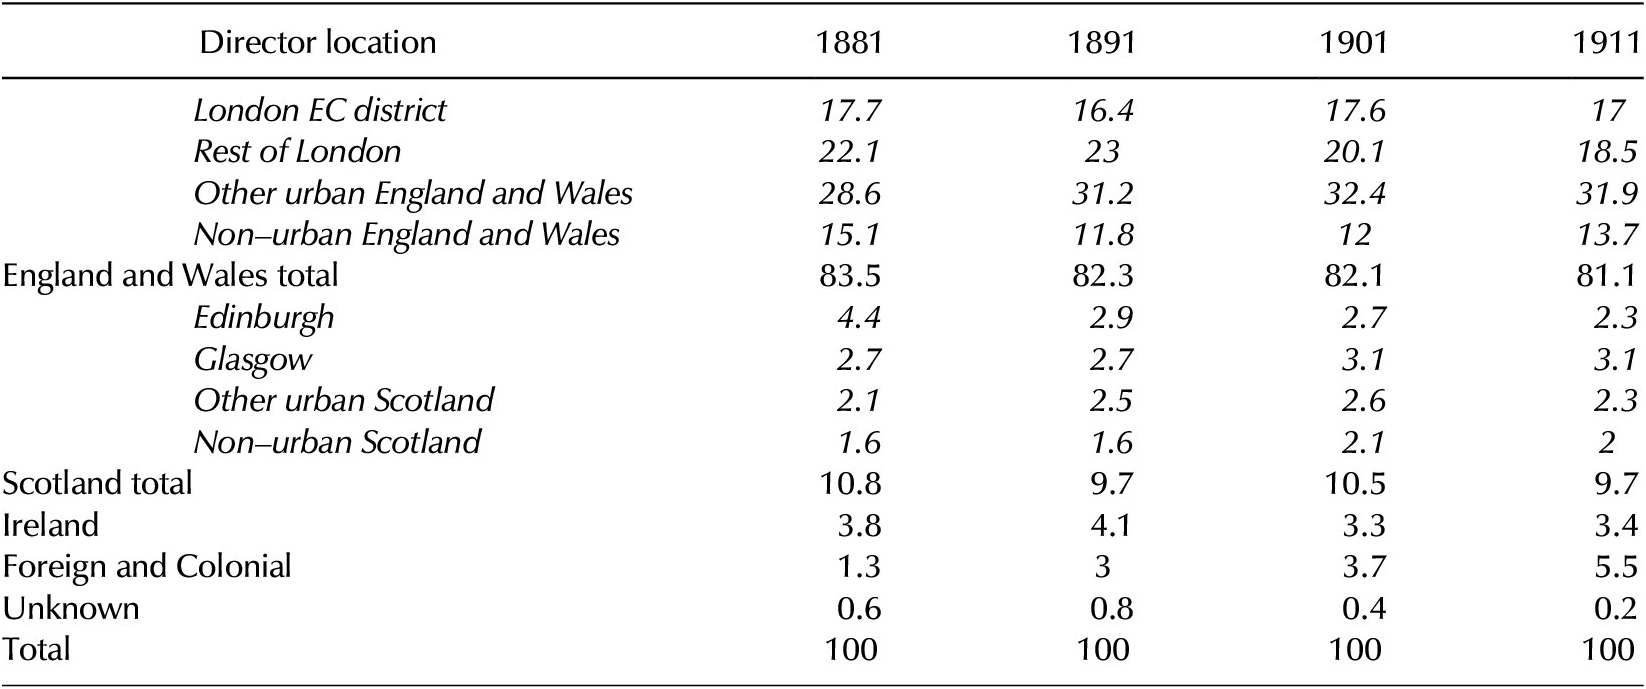
As previously mentioned, location played an important role in the creation of interlocks. The distribution of the directors is strongly suggestive of geographical clustering. Companies mainly registered in London and Edinburgh; hence their directors were likely to be readily accessible to those centers. However, the increasing number of more diverse manufacturing, retail, and other sectors incorporated meant that the focus on London and Edinburgh changed over time. Table 2 shows the breakdown of the directors’ main location. Over 80 percent of the directors were located in England and Wales, around 10 percent in Scotland, 3.5 percent in Ireland, and a steady growth of directors with foreign or colonial domicile.Footnote 58 The directors were skewed to urban locations: over 40 percent of the England and Wales directors were based in London, and another 40 percent in the other major centers: over 80 percent of directors living in cities compared with 60 to 70 percent of the general population.Footnote 59
Percentage of directors by location in full DoD data
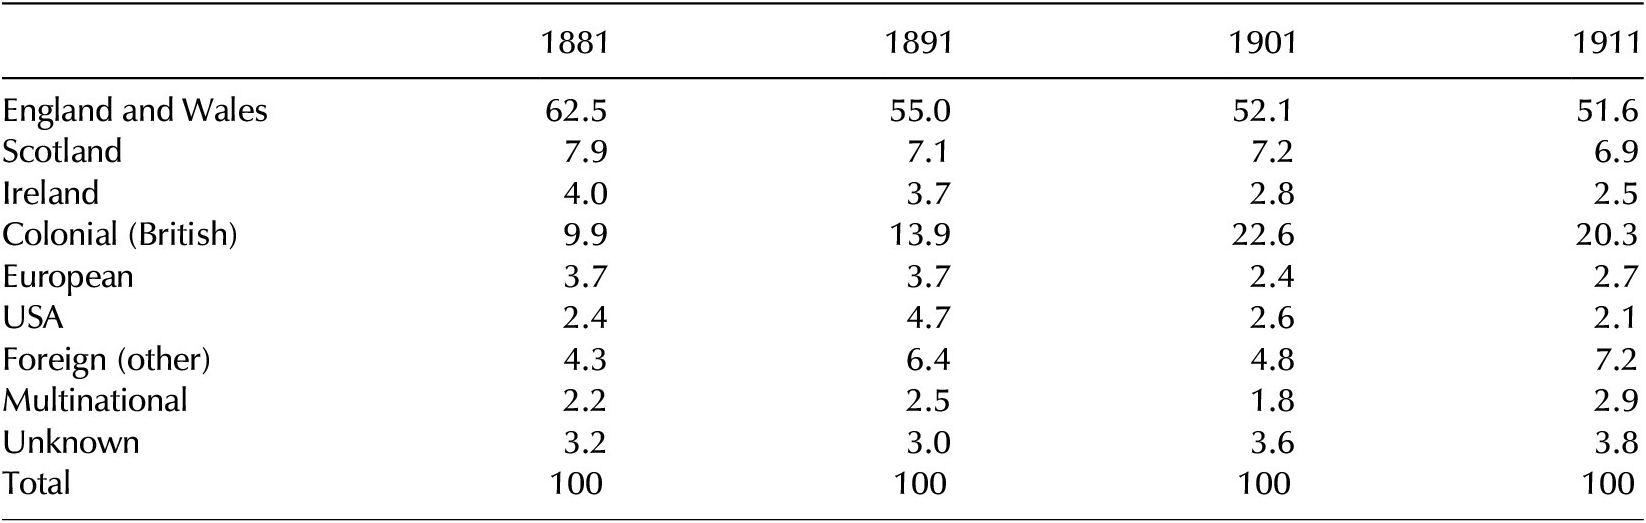
The London Stock Exchange was very international, with previous research estimating that around a third of companies listed in the SEYB had some type of international connection.Footnote 60 Table 3 shows the breakdown of locations of the companies as measured by their main location of activity, which shows that between 30 and 40 percent of the companies were mainly operating outside of Britain. True multinationals were rare: most companies operated in one country or formed a British-colonial or US connection. However, there were directors included in the DoD for companies that only operated in colonial territories or abroad, even though based themselves in Britain (often London or Edinburgh). These companies were predominantly free-standing companies set up to conduct business abroad but registered in England or Scotland as joint stock limited liability companies, so legally domiciled in Britain. The directors of these companies, where public, were the representatives of the shareholders and as such mandated to monitor the companies’ operations abroad, for instance, to ensure the investors’ money was not misused, and were ultimately held responsible by the shareholders.Footnote 61 Some of these companies (for instance, many of the gold mining boom ventures) were essentially shell companies consisting of a board of directors with little activity.Footnote 62 Our analysis focuses on the links created by the directors rather than the success or activity of the company so they have been included, as their connections provide interesting dynamics. They often emerged in groups consisting of several overlapping circles of individuals and enterprises, including financial companies, both mining and nonmining industries, with MPs and other people of prominence as directors.Footnote 63
Percentage of locations of companies of the DoD directors
Elite Directors
Elite directors, measured through aristocratic titles, political influence as MPs, or high-ranking military or naval titles, comprised a relatively small proportion of the directors in the DoD.Footnote 64 The proportion of directors with an aristocratic title remained constant over the period at between 4 and 5 percent. While this still meant that titled directors were overrepresented in the corporate population, as the aristocracy was small, they were not as numerous as previous research on corporate directors suggests.Footnote 65 Most research on directors has tended to focus on the large and prominent companies that were more likely to have one or multiple titled directors: if we only look at the top 50 companies in our sample the percentage of directors with an aristocratic title ranged between 18-20 percent.Footnote 66 Foreman-Peck and Hannah’s study of 339 large, British-owned, listed companies in 1911, found a mean of 1.55 directors with a peerage or baronetcy per company.Footnote 67 The companies included in the DoD that year averaged only 0.14 directors with similar aristocratic titles.Footnote 68 This difference is mainly explained by the companies included in Foreman-Peck and Hannah’s sample, one-third of which were financial companies, which in the DoD had more aristocratic directors than average. Communications and transport companies such as telegraphs, railways, and canal companies had the largest percentages of directors with an aristocratic title on their board, often at twice the average rate. These were mostly large enterprises and usually relied on selling shares to a wide retail shareholder market. The manufacturing sector as a whole had consistently lower numbers of titled directors, as also noted by Foreman-Peck and Hannah.Footnote 69 This reflected a pattern where many raised capital locally or from supporters who were already largely familiar with the businesses; they were less concerned with the retail financial market and any marketing or political lobbying advantage conveyed by a titled director. Similarly, retail companies and hospitality companies also had low proportions of titled directors.Footnote 70 In certain sectors the percentage of aristocrats on the boards increased over time: the banking subsector started with 3.5 percent of directors with an aristocratic title in 1881, which grew to 11.8 percent in 1911, while railway companies saw growth from 6.8 to 13.2 percent. However, this was partly a result of directors being knighted as a result of their corporate role, as was the case with railways. Clearly, the perceived advantage of having an aristocratic board member was not declining over this period, as there were no declines even in sectors that had low levels of aristocratic directors.Footnote 71 However, recent evidence suggests that companies led by directors appointed due to their social status rather than business experience did no better or worse compared to other companies, suggesting that their leadership experience was at least comparable to others.Footnote 72
The nonaristocratic elite, which included directors with military (army or naval) or political titles, on the other hand, was in clear relative decline. The percentage of directors who were MPs was under 1 percent by the end of the period, which is much lower than the 6.5 percent in a recent study by Braggion and Moore, though the samples differ considerably.Footnote 73 Skinner himself observed a major drop after the 1906 General Election, from 237 to 180; from 35 to 27 percent of MPs who held directorships.Footnote 74 Hence national politics affected the trend. Recent research on large manufacturers in 1871 and 1881 suggests political connections could enhance growth, while other analyses suggest mixed results.Footnote 75 The uncertainty of benefits was apparent to contemporaries and was likely to vary by firm and sector depending on their needs. Directors with a military title tended to be more frequent in foreign and colonial ventures, where they made up 5.5 percent of all directors in 1891, as opposed to 3.1 percent of British-based companies. They were heavily involved in colonial railways (15 percent in 1891) as also found by Amini and Toms.Footnote 76 Other sectors with military director presence included plantations and mining. In each case, they may have had local experience. These were expanding sectors over the period both in number as well as percentage of overall companies, yet military presence fell as much in these companies as in British-based companies, suggesting a move away from military presence in financial imperialism over this period.Footnote 77
We can assess more about the background of directors using those that could be linked to the census, which accounts for about a third of the British total.Footnote 78 This analysis confirms a shift over the period between more elite directors in early incorporating sectors and the newer directors. For instance, we can compare the census descriptor of a director’s occupation with their companies. Over time, we identified a definite move from directors defining themselves first and foremost as rentier shareholders who may have had a role in the company, to increasingly recording themselves as part of a corporate group. In 1891 only 8 percent of linked directors stated their main occupation as a director while 11 percent stated they were “living on own means,” usually land rents or investments. However, by 1911 35 percent of census-linked directors in England and Wales called themselves “company director” as their occupation. There were considerable differences between sectors with half of all company directors in retail, and 43 percent of communications directors describing themselves as directors, while only 16 percent of railway directors, 14 percent of financial directors, and 7 percent of utilities directors stated their directorship as their main occupation. Clearly, these directors performed their corporate role as one of many elements of their working lives or as part of their aristocratic grandeur, while retail directors, as one of the least incorporated sectors, closely associated themselves with their business.
As shown by this exploration of the data, the DoD represented a new and diversifying population of company directors, who were increasingly drawn from newly incorporating sectors, and included smaller as well as more prominent companies. Directors increasingly saw themselves first and foremost as company directors rather than rentiers for whom company involvement was secondary. Furthermore, the proportion of elite directors was smaller than previously assumed. The 1881-1911 period witnessed a shift in the make-up of the corporate population to include directors who were likely to have emerged from a pool of companies that chose to incorporate. The following section explores the landscape of noncorporate entities in which these companies were rooted. Since directors were more likely to be urban, we compared their geography with the noncorporate urban populations.
Corporate and Noncorporate Urban Clusters
We examine the composition of company sectors and the location of directors at the city level. This reveals the profile of individual places as well as reflecting wider geographical trends in incorporation. All the main locations included a corporate population from the financial sector, which in 1881 accounted for over half of the directors of Manchester, Liverpool, Edinburgh, and Glasgow, and made up 40 percent of London directors, both in the City as well as outside it. This was due to the early incorporation of banks and insurance companies and shows their importance in networks of directors. This sector remained strong in Scotland, particularly Edinburgh, which was dominated by insurance companies, and Dundee, where it mainly consisted of investment trusts. As shown in Table 2, in Scotland there was a clear movement from Edinburgh towards Glasgow becoming the main cluster of corporate directors. At the start of the period, 41 percent of Scottish directors lived in Edinburgh, which steadily declined to 24 percent in 1911, while the proportion living in Glasgow rose from 25 percent to 32 percent over the same period. This was a trend explained by the underlying change in incorporation. Edinburgh was Scotland’s financial center, while Glasgow housed much of its manufacturing and trade. As over the period, manufacturing companies overtook finance as the most common incorporated company, the center of gravity of the corporate networks in Scotland moved to Glasgow.
Overall, urban sectoral profiles of corporate industries largely corresponded with their general noncorporate business populations, as shown by recent research on urban centers and clusters.Footnote 79 This suggests that the majority of corporate directors largely emerged from the pool of possible local entrepreneurs, and as such were rooted in noncorporate business population networks within their locations. Ports and ship manufacturing towns such as Newcastle, Sunderland, Southampton, and Newport had strong director populations in transport as well as manufacturing, while agriculture and small manufacturing towns such as Colchester and Salisbury had most of their directors running food and drink processing companies. Cardiff had the UK’s greatest proportion of coal mine directors, reflecting its importance as the strategic and managerial center of the South Wales coal trade. Metal and heavy manufacturing towns Rotherham, Stockton, and Darlington had large concentrations in steel and chemical manufacturing companies, while resort towns such as Hastings, Scarborough, and Torquay had relatively larger groups in the hospitality sector, which were mainly hotels as well as entertainment businesses such as piers and theatres. The transition to incorporation was led from certain places. In the manufacturing sector, for instance, towns with long-standing industries adopted incorporation on a significant scale at an early stage, such as Sheffield in steel and small wares, and Newcastle in steel and chemicals, reflecting the role of new capital needs in these industries. As with noncorporate clustering, sectors did not have to line up completely, and new sectors emerged in clusters that had similar skills: by the end of the period Birmingham and Coventry had concentrations of directors in the manufacturing subsector of motor and transport engineering.
The main exceptions of similar corporate and noncorporate town profiles were London and Brighton. This is mainly due to both places having large proportions of directors involved with foreign and colonial companies. From 1891 onwards less than half of directors based in the EC postal district of London were involved with companies that operated in England and Wales. Many were colonial companies: the vast majority of these were noncoal mines, particularly precious metal and diamond mines, as well as some land and investment companies in the financial sector. The proportion of London EC directors with British colonial companies rose steadily from 16 percent in 1881 to over 30 percent in 1901 due to the mining boom, before dropping slightly under 30 percent in 1911. For non-EC London-based directors, involvement in colonial companies rose from 13 to 18 percent, while colonial directorships were generally rare in the main English cities outside of London. Brighton was the main exception, as the only location that came close to emulating the London profile in terms of colonial control. This was due to it being a place where London businesspeople commuted from, or who remained as directors in retirement resided.Footnote 80 Its director population was on average 5 years older than the London directors, and those involved in utility and noncoal mining companies were over 10 years older. This pattern was present for nonurban directors to a lesser extent than the Brighton directors. Nonurban directors living in counties near London had higher proportions of colonial holdings than those further north, again resulting from residential spread from the capital.
Apart from London and Brighton, all other English and Welsh urban directors were mainly involved with English and Welsh companies, at rates of close to or well over 90 percent. Scottish directors also followed this trend, with over 70 percent of Scottish directors involved solely with Scottish companies. Some clusters were broader, particularly those based in Glasgow and Dundee. Glasgow saw a similar growth to London’s involvement in colonial companies over 1881–1891 and was more linked to England and Wales as well, with 15-17 percent of directors involved with English and Welsh companies. Dundee stood out for its strong connection with the USA, although this was declining over the period from 14 percent in 1891 to 4 percent of directors in 1911. Dundee was the center of the Scottish investment trust industry and had a connection with America through its jute industry.Footnote 81 Edinburgh and Aberdeen had over 10 percent of directors involved in England and Wales. Of the directors based in Ireland, 78 percent were solely in Irish companies, with the remainder mostly English and Welsh companies, and only 4 percent for companies located further afield.
So far, we have considered the characteristics of the population of directors. In the rest of this paper, we focus on the links between directors, companies, and locations that were created through interlocking, and explore how the network evolved to include the newer group of incorporating directors.
Britain’s Corporate Network
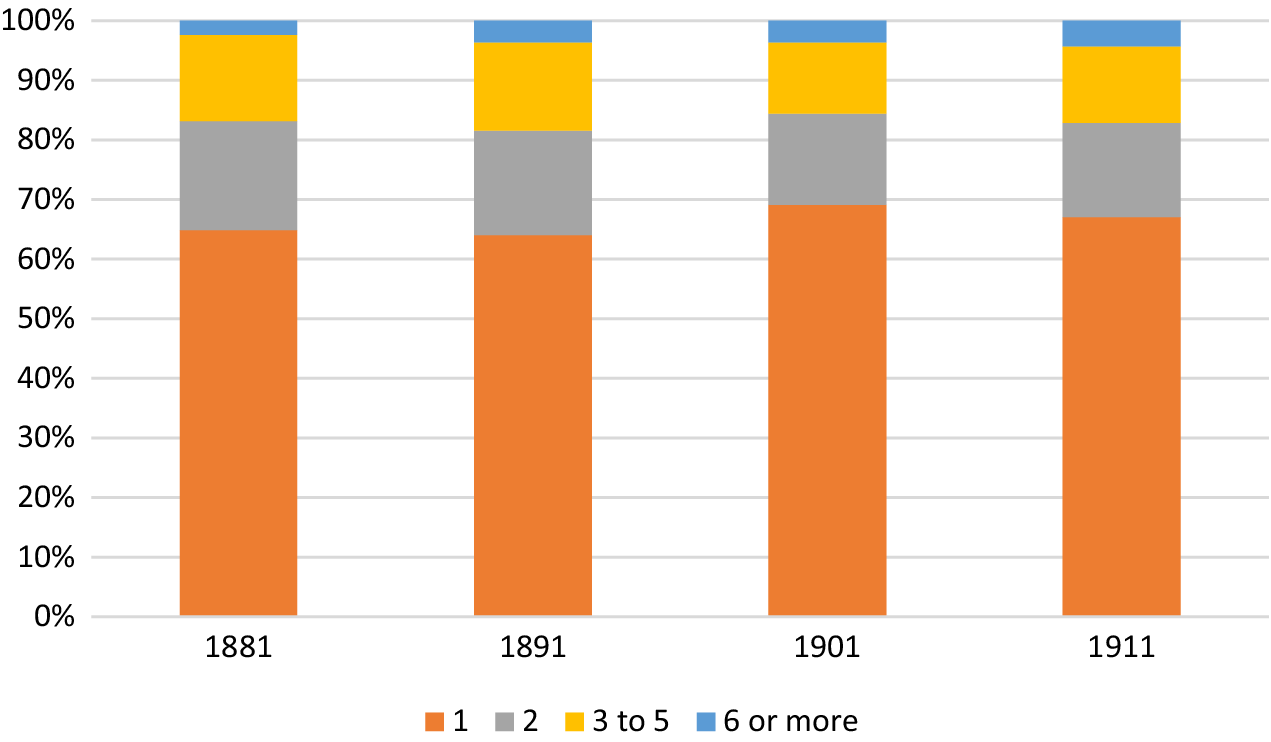
Between 31 and 36 percent of directors in the DoD had multiple directorships that created interlocks between companies. While this proportion remained approximately stable over the period, the number of “big linkers” increased: as Figure 2 shows, only 2.4 percent of directors was involved in more than five companies in 1881, but this had gone up to 4.3 percent in 1911. In 1901 there was a small group of super big linkers: six were directors of over 20 companies, one of them of 40. These were all colonial mining companies, reflecting the gold mining boom of the 1890s and the feature that mining enterprises were generally ring-fenced as separate entities. Based on census data, the directors who created interlocks tended to be older, suggesting more experience, and were more likely to be titled compared with directors who were only involved in one company. Whereas directors with aristocratic titles made up about 4 to 5 percent of the director population, they accounted for 20 percent of directors involved with more than 10 companies in 1881, gradually dropping to just over 14 percent in 1911.
Percentage of directors by number of directorships.
The corporate population was very cohesive, with very few directors and companies that did not in some way connect to the wider network. Directors who had only one company would often sit on the board with directors who were involved in multiple companies, and through them were linked into the wider web of connections. This resulted in a very interlinked corporate population. Across the four decades studied, only 1 to 2 percent of directors in the DoD were isolated from everyone else. These were mostly directors of companies that were overseas, with no other directors in the UK, or directors who were involved in one or two small and local companies, the directors of which only connected to each other.
When looking at the networks from the point of view of the companies, in 1881 and 1891 roughly 7-8 percent of companies did not interlock into the larger network (some interlocked with each other in separate small networks consisting of two or three companies only). The proportion of isolated companies went up to 13 percent in 1901, and down to 11 percent in 1911. Disconnection from the network occurred for companies from all sectors but was more common in sectors with smaller companies, such as retail and services, as well as sectors with many new companies such as manufacturing and food and drink processing. Many of these companies were newly incorporated. These trends suggest that some of these companies emerged from local pools of entrepreneurs who were less connected to existing incorporated companies and their networks. Even in the later years, however, the proportion of isolated companies in the DoD network was much lower than that found when studying only large companies: recent work on the network of the top 250 companies in 1904, found that 30 percent of companies were isolated.Footnote 82 This suggests that there was a group of around 20 percent of companies that were excluded from direct links into the elite network, yet still connected to the wider corporate landscape, which occurred through small or nonfinancial companies.
Certain sectors were more likely to be interlocked. Only 18 percent of board memberships of communications companies were held by a director for whom this was the only directorship, against an average across all sectors of 38 percent in 1881. Another very interlocked sector was mining, particularly noncoal mining. The least interlocked sectors were the same as those most isolated from the network: smaller and/or newer sectors to incorporate including hospitality, retail, and manufacturing. These trends remained stable over the period, with the exception of noncoal mining which became more interlocked in 1901, reflecting the mining boom. Certain roles on the board were also more likely to be involved with interlocking than others. It was rare for a director to be a chairman of only one company; often this role was taken by a director who had experience on multiple boards. Lord Rathmore for instance, an aristocratic director in 1911, was chairman of two railway companies, and an ordinary director of more railways, an insurance company, and the Suez Canal Company.
Interlocks could link companies within the same sector or across different sectors. Sectors where intra-sector interlocks were common included finance and railways, as well as international and colonial (sub)sectors such as noncoal mining, plantations, and communications (which included sub-ocean telegraph cables). About a third of directors with interlocks with at least one British-based company were also involved in a foreign or colonial venture, thus creating a direct link between business activities in the UK and abroad. This was already the case in 1881 and rose only slightly over the period, suggesting that the corporate network was already established as supra-national by the end of the nineteenth century. However, the countries with which these directors formed interlocks changed over time: while interlocks with European and Irish companies declined, the proportion of directors with interlocks between Britain and non-European countries rose from 8 percent to 12 percent, while British-colonial interlocks rose from 19 percent to 24 percent, showing the emergence of the larger globalized networks of the twentieth century.
Much of the literature on director networks is concerned with the links between industrial or manufacturing firms with banks, or the financial sector more widely.Footnote 83 In the British context, this is mainly linked to debates surrounding the degree to which banks supported industrial ventures in terms of finances and strategy during Britain’s economic slide over the twentieth century. Our period was one in which the banking sector underwent considerable consolidation, with many small local banks amalgamated into larger national ones. This was accompanied by reduced access to local credit for smaller firms as the larger banks shifted focus towards commercial banking.Footnote 84 This shift is evident in the changing interlocks between banking directors and other sectors within the director networks. Table 4 shows the percentage of interlocks companies in different sectors made with the three financial subsectors: banks, insurance, and investment companies between 1881 and 1911. Interlocks with banks for smaller, localized companies such as food and drink processing, retail, construction, and services went down over this period, reflecting the narrowing of local banks. The important manufacturing-finance link loosened around the turn of the century: in 1881, 35 percent of manufacturing firms had (at least) one interlock with a bank, which declined to just 9 percent by 1911. This contrasts with the situation in the US and Germany, where the percentage of industrial firms with a banker on board increased over the early twentieth century.Footnote 85 Bank links with the railway sector, on the other hand, showed very little change over time: evidently, the director networks around railways, banks, and also insurance companies were pretty stable over time and may have replicated themselves. Communications, which was a heavily interlocked sector as a whole, maintained a relatively strong link with banks as well. Both sectors represent the international and commercial interests that the larger banks pursued, focusing away from smaller localized firms.Footnote 86
Percentage of companies in a sector that interlocked with the financial subsectors. NB the same company can interlock with multiple subsectors
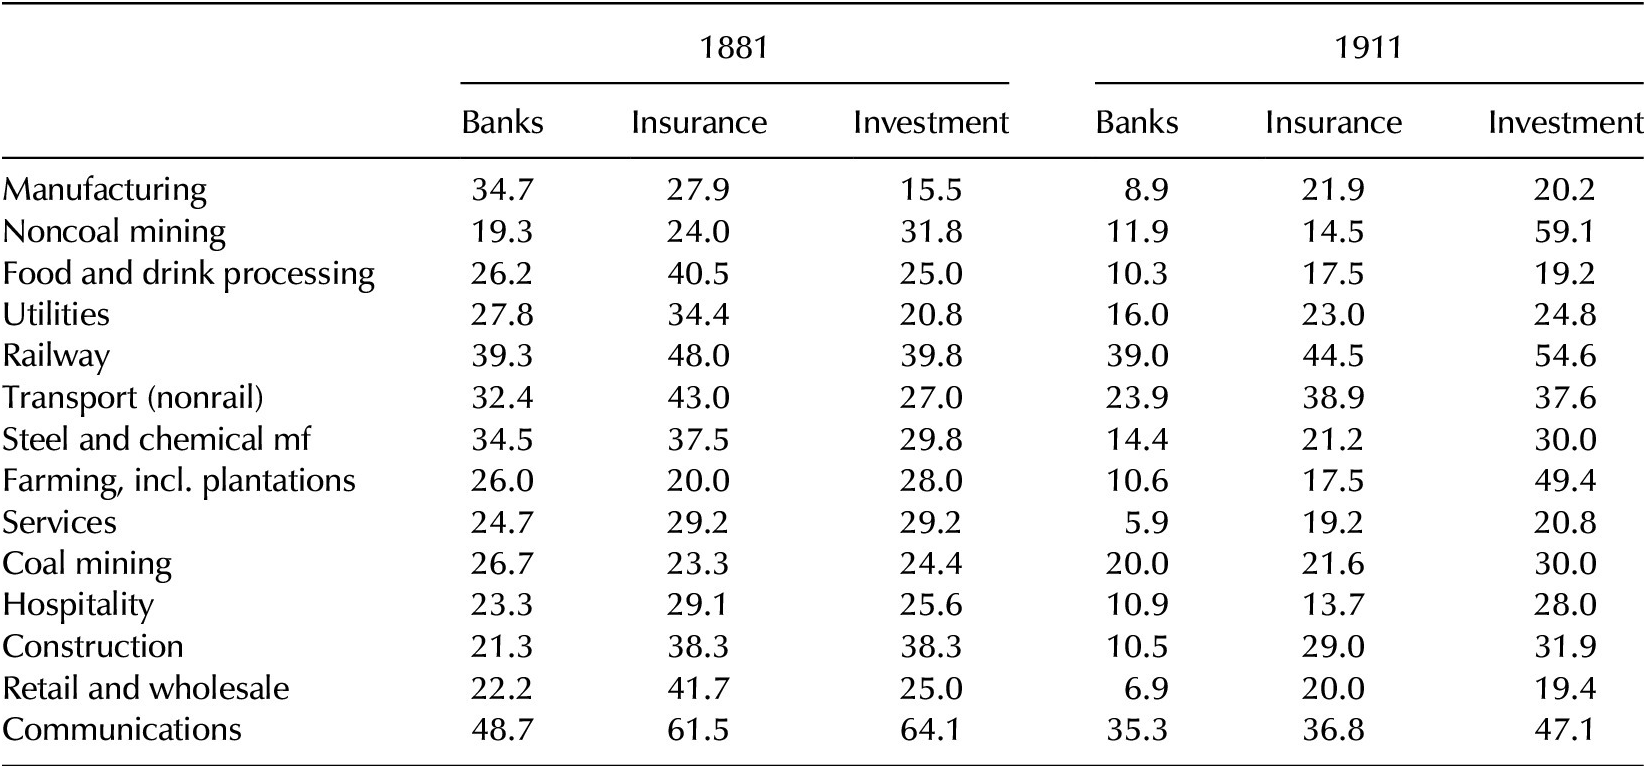
A recent study has shown that in 1904, rather than banks, nonbank financial companies were becoming the most connected, particularly insurance companies.Footnote 87 This finding can be confirmed using the full networks in the DoD, although it is contextualized within the wider pattern of decline in interlocks with the financial sector as a whole. Within these declining interlocks the insurance sector declined less than banks, remaining an important connection: insurance interlocks hovered around a quarter of manufacturing firms throughout the four years studied. Interlocks with investment firms, on the other hand, went up for most sectors over the same period, reflecting the expansion of land, finance, and investment trusts in the financial sector. The increase was largest for international and colonial sectors such as noncoal mining (which included gold and precious stones), plantations, as well as overseas railways, and other transport and infrastructure. Some of the small business sectors, including services, food and drink processing, construction, and retail saw less interlocking with investment firms, again reflecting a move away from local business interlocks to larger international finance, as with banks. Insurance companies remained interlocked with both larger international firms as well as smaller local sectors, where, despite the decline in interlocks over the period, they still remained as numerous or even more numerous than investment interlocks.
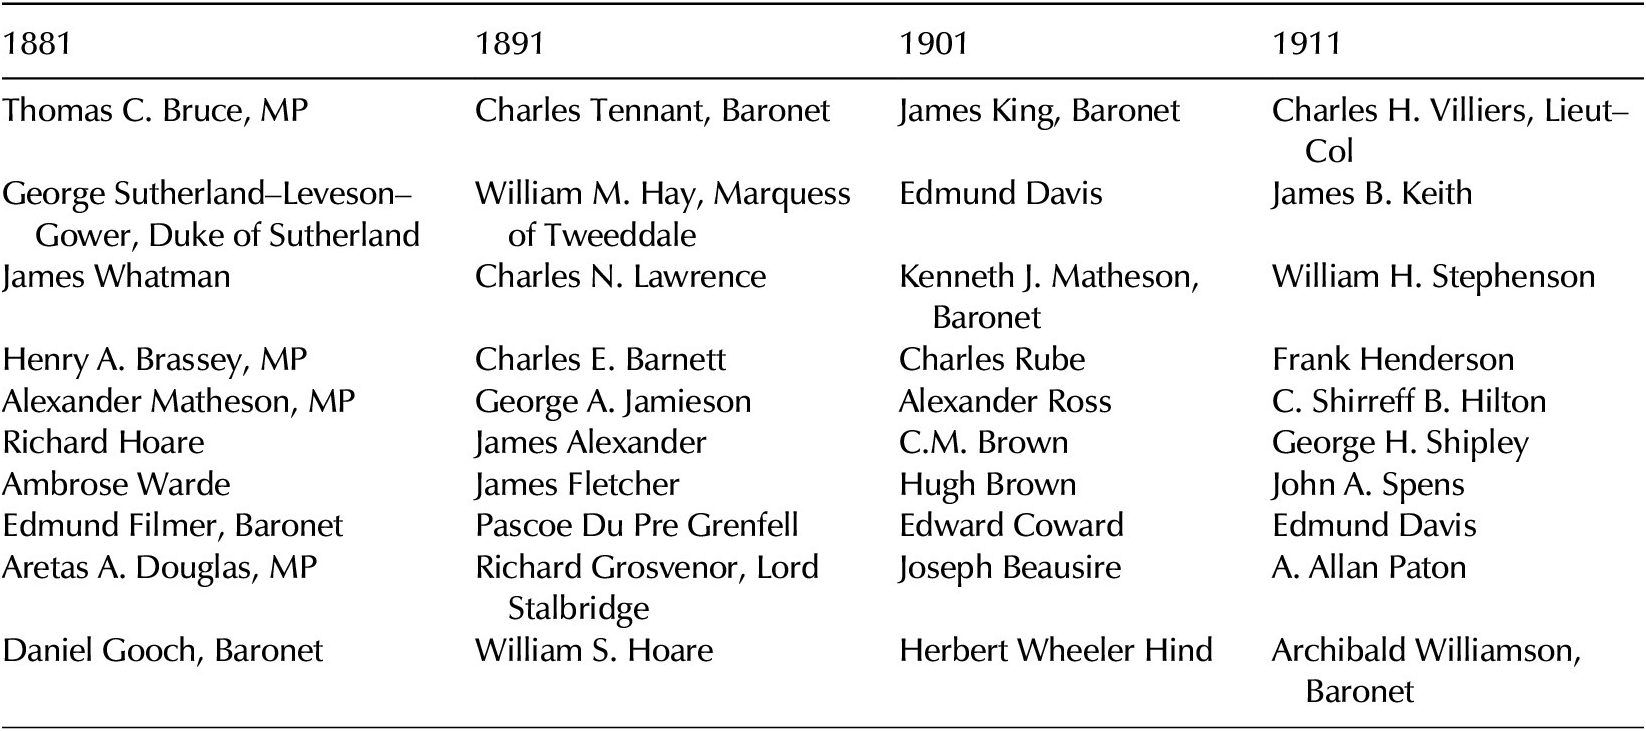
The high level of interlocks of the insurance sector with different types of companies is reflected in the centrality measures of the full bi-partite corporate network. On both betweenness and eigenvector centrality, the best-connected companies with the furthest-reaching influence within the network in all years were insurance companies. Table 5 shows the top 20 for each year as measured by eigenvector, but the top-scoring companies on betweenness were similar. High-centrality noninsurance companies included several of the top 50 companies. In terms of people, the key directors in the corporate network were unsurprisingly mainly elite (see Table 6). In 1881, the top 10 directors on both eigenvector and betweenness centrality were almost all titled or MPs, with seven out of the top 10 directors London-based. In 1891, Sir Charles Tennant, William Montagu Hay (Marquess of Tweeddale), and Charles Napier Lawrence were the key directors in the network on eigenvector centrality. Tweeddale was involved in telegraph and railways companies, which were mainly Scottish. Lawrence’s companies were mainly in the land and investment part of the financial sector and spread across England and abroad. In 1901 the highest-scoring directors were involved in Scottish and colonial companies. Sir James King, chairman of the Caledonian Railway Company and based in Glasgow had the highest eigenvector centrality that year, with the other high-scoring directors (Edmund Davis, Kenneth Matheson, and Charles Rube) all involved in colonial gold mines and land investment trusts. By 1911, only three directors of the top 10 most connected ones lived in London, with some of the highest-scoring ones based in Scotland and northern England. Additionally, only two of them had titles. Evidently, while London was important to Britain’s corporate network and the titled elite played a central role, over the course of the period studied their centrality to the overall corporate network was starting to decline relatively.
Top 20 companies on eigenvector centrality by year

Note: Bold: companies among the top 50 by size for 1881, 1901, and 1911.
Top 10 directors on eigenvector centrality by year
In very large networks like these, it is also useful to look at other dynamics apart from centrality. In particular, we can look at communities that formed within the larger network: the joint groupings of companies and their directors. We have identified communities for each of the four years in our data using the Leiden algorithm. The quality of the partitions created by the algorithm, and thus of the communities, can be measured as modularity on a scale of 0-1. Our community analysis scored 0.89 for 1881, 0.88 for 1891, 0.90 for 1901, and 0.91 for 1911, indicating highly cohesive clustering into communities, with a small general increase over time. Table 7 shows the 10 largest communities for the 4 years studied. In order to assess their elitism, the number of the top 50 largest companies for each community, the percentage of directors in large companies, and those titled have been calculated. In addition, the table summarizes the key director locations, as well as the sectors and locations of the companies in each community.
Largest director communities based on community size (directors + companies) and their key characteristics by year
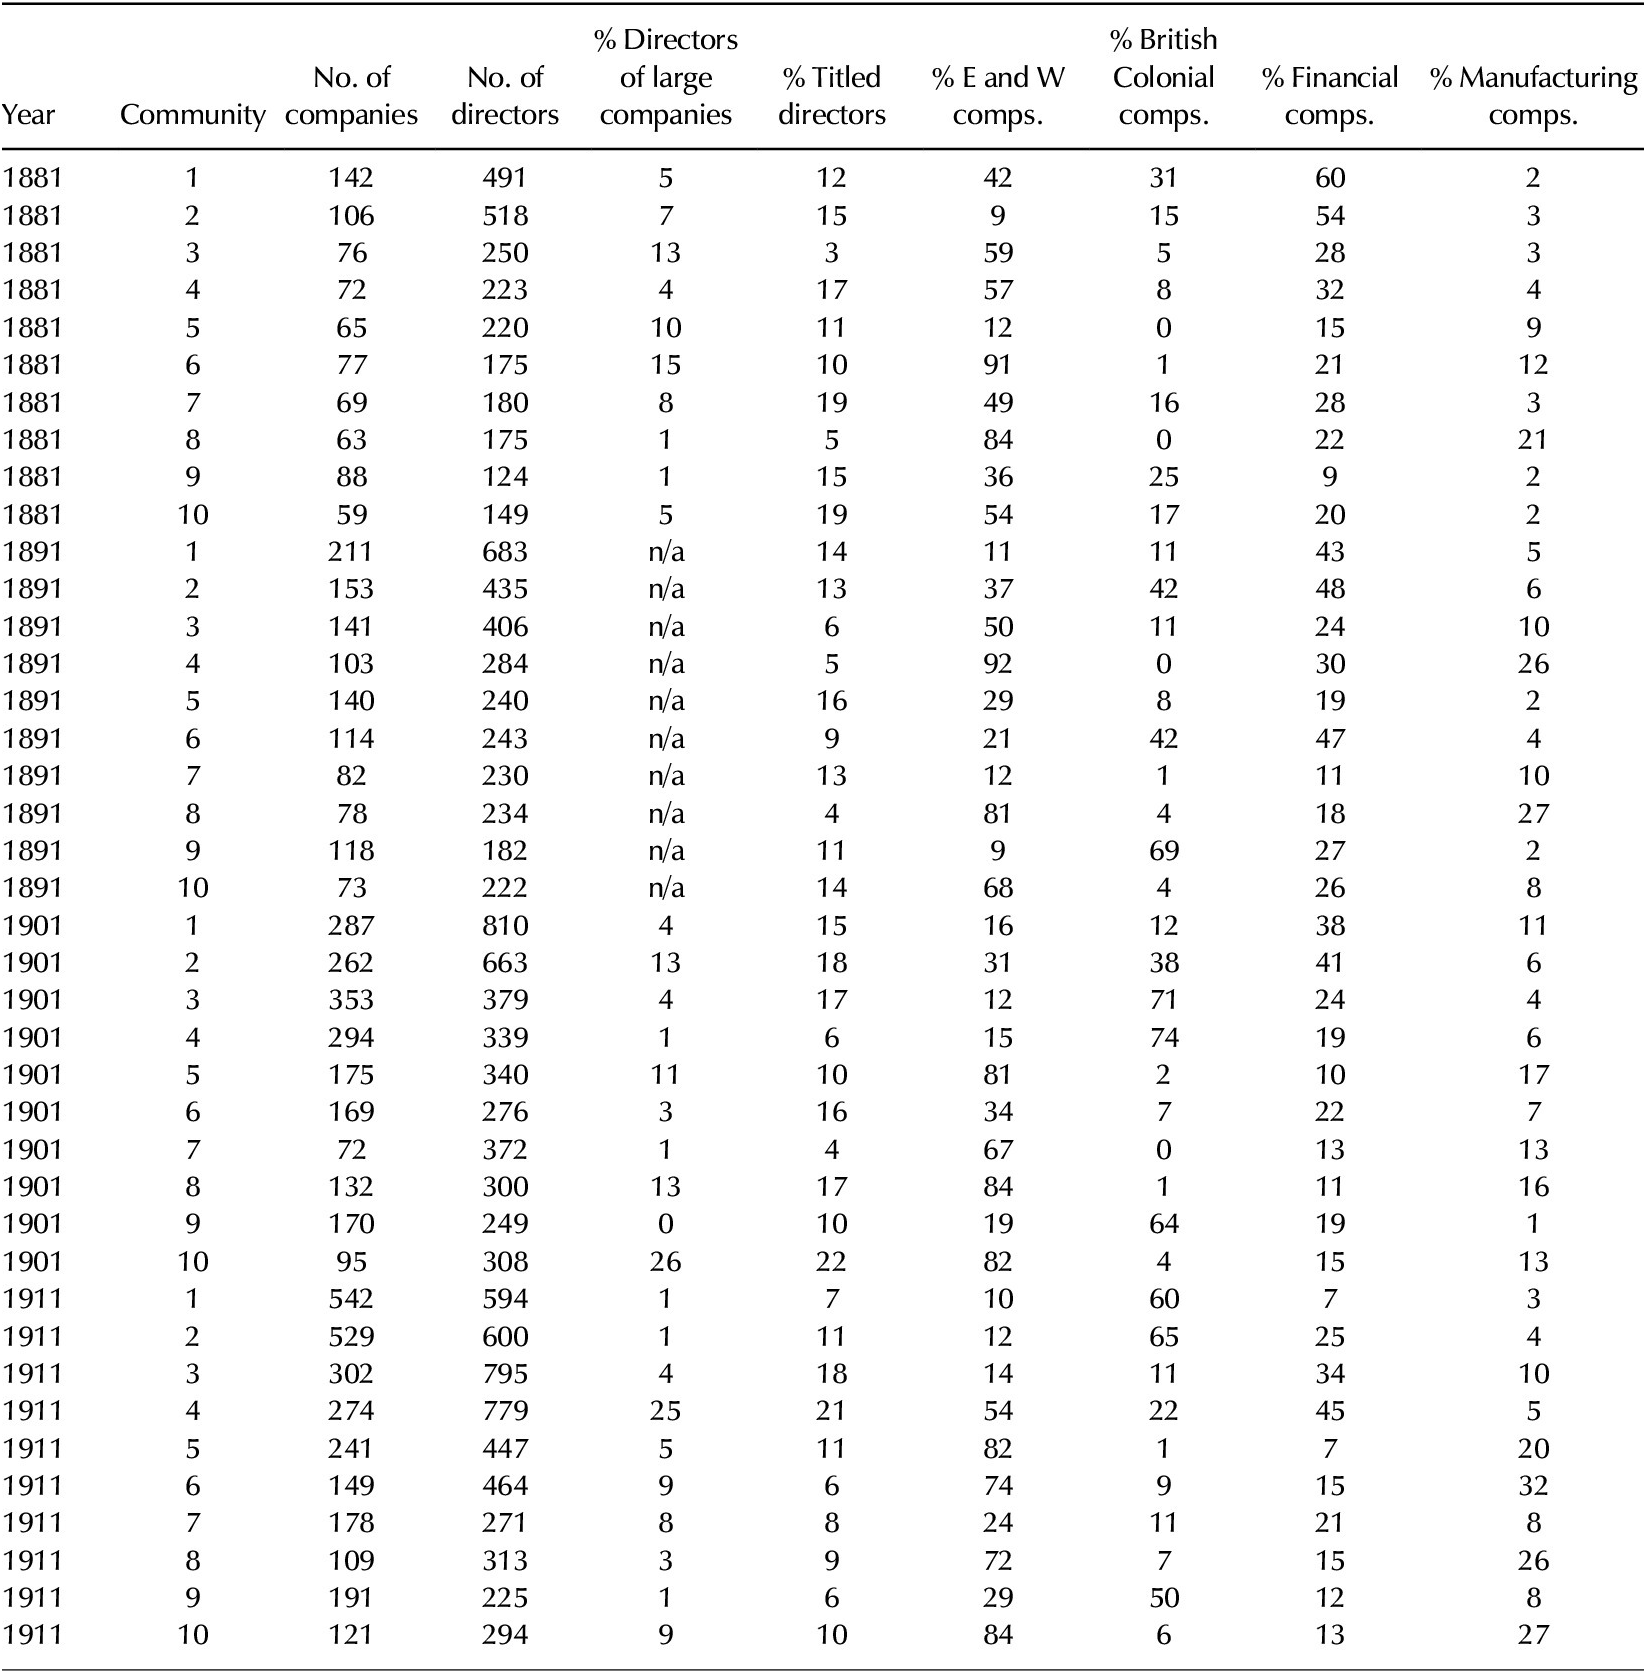
First, it is clear from the results that in all years, communities formed that did not involve elite directors, either by title or through large companies. For instance, the 8th largest community in 1881 included no large companies and only 5 percent titled directors, as did community 7 in 1901. At the same time, some communities were much more elitist, such as group 10 in 1901 where over a quarter of directors were involved in top-50 companies and 22 percent were titled. These elitist communities were often heavily railway or finance-focused, group 10 for instance had over 40 percent railway companies. Secondly, all communities contained some financial companies, although there were higher proportions in the earlier decades than in the early twentieth century. This again reflects the decline of bank interlocking, but also shows the continuing centrality of financial institutions to director networks. Similarly, all communities had at least some directors who were based in London, but while the early decades were very skewed towards the capital (with 5 out of 10 of the largest communities having over 60 percent of their directors based in London in 1881), by 1911 only group 2 had over 60 percent: a group including Alfred Beit, Charles Rube, Charles Rudd and the De Beers Company whose companies were mainly in colonial gold mines and land exploitation. This brings us to a third aspect that is exposed through this analysis: the distinct profile of the communities and their change over time. These profiles reflected the position of the directors in the community—suggesting that the strongest factor bonding them into a network was either their locality or the sector in which most of the companies operated—indicating that directors knew each other through their industries. Some of the communities were clearly formed through location: each of the years had a Scottish community composed of directors mainly resident in Scotland and predominantly Scottish companies. The 1881 and 1891 networks had large Irish communities as well (these fell out of the top 10 in later years). Similar communities formed in England and Wales, such as group 3 in 1881, which was mainly Liverpool-based and included international transport companies such as Cunard as well as more local companies such as Liverpool United Gas Light. This regional clustering was also noted by Wilson, Buchnea, and Tilba in their recent work on director networks over the twentieth century, where their 1904 analysis showed that many links were still local in character.Footnote 88
Other communities were based around specific sectors. For instance, in 1891 group 4 was a community mainly based around companies in textile manufacturing, with the directors spread out over Manchester, Huddersfield, and Bradford. All years had a large cluster around colonial mine ownership, and though these directors were mainly based in London, they formed separate communities from other London-based directors and, in some cases, from each other. In 1901, the time of the mining boom, three separate mining groups in the top 10 largest communities showed distinct types of companies they were involved in: group 3 was focused on gold mines in south and west Africa and included Cecil Rhodes and the Consolidated Gold Mines of South Africa, with 17 percent of this community having an elite title, half of them military. Group 4 was less elitist with only 6 percent of directors having a title; the mining companies in this group were mainly diamond mines. Group 9 fell between in terms of elite directors, and contained mainly mines in Australia and Canada. While these directors may have known each other through other avenues, through their corporate interlocks they fell into distinct communities.
In 1881 and 1891 many directors were still geographically rooted in their local business communities, as shown by the high percentages of directors based in individual cities, and their communities heavily featuring the main industries of that place, including utilities and locally-based companies. This did not always imply isolation, however. In 1891, some of the highest-scoring directors and companies on eigenvector centrality were in the Liverpool community, which featured an international portfolio of shipping companies and was very nonelitist. This suggests that nonelite communities could be very close to the overall power structures through their networks. By 1901 we can see some more geographically dispersed communities emerging, that were grouped around sectors, such as heavy manufacturing connecting several cities in group 5—implying these directors made their own corporate networks across Britain. The largest group in 1911 was geographically dispersed but clustered around rubber plantations, with some of its directors also crossing over into automobile manufacturing or oil which linked the supply chain links to rubber users. Other industry-based communities that year were groups 5 and 6, based around heavy and textile manufacturing, respectively.
Initially, the communities mainly reflected local connections. By the early twentieth century director communities widened to networks that were increasingly national in scope, stretching beyond individual cities. Increased connectivity and real-time information flows made it possible for directors to be further removed from their companies, allowing this geographical widening. In addition, the presence of communities including companies from the same or related sectors indicates that some networks emerged from professional connections, rather than being based on proximity alone. Some community formation would have been facilitated by other elites: schooling, clubs, or being part of the same social class, rather than just being part of the same boards.Footnote 89 In other communities, however, the absence of titled people and the presence of more newly incorporated companies suggests that networks were predicated on professional or commercial links.
Conclusion
Previous work on director networks has mostly focused on the elite, either through the study of titled directors, or those involved in the largest companies. This study, for the first time, has used a rich dataset to examine the wider population of corporate directors during a time when the corporate form was becoming the dominant legal form for larger companies and a wider range of sectors. It has shown that through the expansion of companies incorporating over the 1881-1911 period, the director population expanded and diversified in terms of the sectors represented, and the ways through which they formed networks. Taking this wider population as a starting point we have shown that the corporate population was very connected as a whole, with very few directors and companies completely isolated. The paper has provided an overview of the key changes and started to probe the role of directors in the changing UK business landscape and their reach into the global economy.
Firstly, it has shown that the director population in the decades before the First World War was increasing rapidly in financial companies, overseas farming, and services. However, the largest increases were in industrial and manufacturing companies including food and drink processing, reflecting their shift towards incorporation. These new directors’ profiles strongly overlapped with noncorporate business communities, suggesting the similarity of the newly incorporated companies to their local roots and their local business elites. At the start of the period studied, director networks were still firmly embedded in single locations, and networks and communities were mainly built on proximity. By the early decades of the twentieth century, however, these communities increasingly interlocked with networks that were national in scale based on common sectors and interests rather than locality. Directors’ communities did not necessarily rely on connections to titled directors or already established incorporated sectors, suggesting that power structures in corporate networks could increasingly exist beyond the aristocratic and political elite.
Second, this research has shown the changing role of the financial sector within business networks, which has implications for the way in which companies are able to access financial knowledge and resources such as credit. All urban centers retained some corporate population involved in the financial sector, and most corporate communities involved some financial companies. Clearly, interlocking with this sector was important to company directors, as also shown by the continuing centrality of insurance companies. Raising and retaining capital remained fundamental, but the decline of local banks and the shifting focus of banks towards commercial banking led to a decline of bank interlocks through the period, some of which were replaced by interlocking with financial trusts. Insurance companies, meanwhile, provided a link between the larger internationally focused capital markets and smaller local businesses, placing the insurance sector in the most central position of the full corporate network across all years.
Finally, we start to consider the effects of the expansion of the corporate population on wider board culture. As directors were increasingly drawn from managers or owners involved with the company pre-incorporation, boards shifted from a high proportion of rentiers who held ornamental positions on boards to attract shareholders. Linkage with census records has demonstrated that increasingly board members described themselves first and foremost as directors of the company, opening up a trend towards increasingly managerial directors. However, this was mainly driven by the shifting composition of the corporate populations, and entrepreneurs became directors at the point of incorporation, rather than joining existing companies. In addition, the continuing presence and even expansion of titled directors in certain sectors shows that both “traditional” and “modernizing” trends were operating.
The development of the new corporate form over the period 1881-1911 saw great change. Demonstrating the existence of wider network connections has implications for the people and sectors that had the best access to knowledge about their industries and market opportunities. The study of the population of directors, and how they interacted and networked with the elite, is essential to understanding the development of flows of information, ideas, and knowledge and begins to address how global economies became connected to and embedded in local British business clusters. The dataset that has been developed is fully available which will allow further research on questions around access to power and the evolution of the British economy.
Supplementary Material
To view supplementary material for this article, please visit http://doi.org/10.1017/eso.2024.24.


 Open access

