

1. Introduction
The ongoing shift in pension provision from defined benefit (DB) to defined contribution (DC) has brought more flexibility to the decumulation phase of retirement. Many occupational and private pension plans in developed countries now offer lump-sum payments or phased withdrawals as an alternative to annuitization. Liquid payout options allow individuals to invest, buy an annuity, leave bequests, or increase consumption during the early years of retirement. However, there are concerns that they may trigger individuals to spend the money too rapidly for their own good (Barr and Diamond, Reference Barr and Diamond2008).
In Sweden, annuitization rates have been falling as both the share of second-pillar pension wealth that is not subject to mandatory annuitization and awareness of alternative payouts have increased. Between 2008 and 2015, annuitization rates in several major pension plans fell from well above 80% to 60–65% (Hagen, Reference Hagen2015, Reference Hagen2017b); more recent estimates suggest that these shares are now below 50% (AMF, 2018). This resembles the situation in US DB pension plans where annuitization rates range from 25% to 50% (Mottola and Utkus, Reference Mottola and Utkus2007; Benartzi et al., Reference Benartzi, Previtero and Thaler2011; Banerjee, Reference Banerjee2013; Previtero, Reference Previtero2014; Park and Banerjee, Reference Park and Banerjee2020).
This paper reports the results from a large telephone survey of 1,000 Swedish retirees. Shortly before the survey, these retirees had made a decision on whether to annuitize a substantial fraction of their pension wealth. The survey sample is drawn from the population of Swedish white-collar workers studied in Hagen (Reference Hagen2015). In Swedish occupational pension plans, individuals can choose between a life annuity – the default option – and several phased payouts, which are referred to as fixed-term payouts.Footnote 1 In the fixed-term payout option, the individual specifies the time period over which the pension capital is withdrawn. The fastest rate at which the pension capital can be withdrawn is 5 years.Footnote 2 If no action is taken, the pension is paid out as a life annuity at age 65. Large monetary amounts were at stake in the payout decision of the survey participants; the average monthly pension payment under the life annuity amounted to US$280. The survey data are matched with administrative data from the managing pension company; the administrative data include information on the survey participants' actual payout choice.Footnote 3
The lack of comprehensive and reliable data has been one of the main limiting factors in the empirical literature on annuity demand. Some previous studies rely on administrative data from individual pension companies or pension plan administrators (Bütler and Teppa, Reference Bütler and Teppa2007; Benartzi et al., Reference Benartzi, Previtero and Thaler2011; Chalmers and Reuter, Reference Chalmers and Reuter2012; Previtero, Reference Previtero2014; Hagen, Reference Hagen2015; Bütler et al., Reference Bütler, Peijnenburg and Staubli2017, Reference Bütler, Staubli and Zito2013; Park and Banerjee, Reference Park and Banerjee2020). While such data contain information on actual payout choices and, in some cases, also individual characteristics, there is no information on the retirement savers' own reports of their payout decision (or the reasons thereof). Another group of studies use survey-based data, which rely on payout choices that are either hypothetical (Beshears et al., Reference Beshears, Choi, Laibson, Madrian and Zeldes2014; Agnew et al., Reference Agnew, Anderson and Szykman2015, Reference Agnew, Anderson, Gerlach and Szykman2008; Knoller, Reference Knoller2016; Bockweg et al., Reference Bockweg, Ponds, Steenbeek and Vonken2018) or self-reported (Brown, Reference Brown2001; Inkmann et al., Reference Inkmann, Lopes and Michaelides2011; Cappelletti et al., Reference Cappelletti, Guazzarotti and Tommasino2013; Banks et al., Reference Banks, Crawford and Tetlow2015; Lee, Reference Lee2016). On the positive side, surveys can ask questions that directly measure specific preferences, and examine choices in economic environments that differ from the current one. On the negative side, hypothetical payout choices may not correspond to the choices that people would make in real-life settings. There is also a risk that individuals' self-reports of past or planned payout choices do not correspond to what they actually chose or will choose. To my knowledge, this is the first study that combines survey data with administrative records of actual payout choices.Footnote 4
Access to actual payout choices provides a unique opportunity to examine ex-post the degree to which retirees accurately recall their payout decisions. Individuals are typically faced with annuitization decisions only once or twice in their lifetimes. The inability to accurately recall their payout decisions may have adverse effects on individual welfare. For example, individuals who operate under the assumption that he or she is receiving a life annuity when, in fact, the payment will end in 5 years may experience an unexpected fall in income. Knowledge of the characteristics of those who have misbeliefs about the length of their payouts, and whether such misbeliefs are related to the choice of payout option, can be used by policymakers and pension plan administrators to design more efficient information interventions and/or choice architecture to prevent feelings of regret among retirees.
The main finding of this paper is that a majority of the retiring workers fail to recall whether they chose a life annuity or a fixed-term payout and that the recollection rate differs significantly by payout choice. Specifically, one-third of the annuitants believe they have a fixed-term payout, and only 40% (correctly) reported having a life annuity. Of those who opted out of the life annuity, 77% correctly reported that they have a fixed-term payout. Beyond payout choice, however, few individual characteristics are significantly correlated with an accurate recollection of past payout decisions.
The most likely reason why annuitants are less informed about their payout choice is that the annuity is the default option or the ‘path of least resistance,’ using the terminology of Choi et al. (Reference Choi, Laibson, Madrian and Metrick2002). Individuals often stick with the default because they tend to delay decisions longer than they should and because acts of commission, such as opting out of default, often come with significant transaction costs (Choi et al., Reference Choi, Laibson, Madrian and Metrick2003). In our case, individuals may also have refrained from making an active choice because they procrastinated until it was too late to collect the relevant information to make an informed choice, or because they did not trust their own judgement in making the right choice. Some may even have missed the opportunity of making a payout choice altogether. In fact, one of the few characteristics that predict ignorance is working after retirement. Working pensioners, who may have a lower propensity to think seriously about retirement-related issues, are (i) less likely to opt out of the default and (ii) less likely to remember their payout decision.Footnote 5
The survey also asked participants whether they felt confident that they made the right payout choice. Previous evidence on the relationship between regret and payout decisions predicts an ambiguous relationship between annuitization and regret in our setting. On the one hand, Brown et al. (Reference Brown, Farrell and Weisbenner2011) show that individuals who were nudged into a specific retirement plan were more likely to regret their decision. On the other hand, people who buy annuities tend to be happier with their decision afterwards (Mitchell et al., Reference Panis, Mitchell and Utkus2003). I find that annuitants are, on average, significantly less confident that they made the right payout decision. Interestingly, this relationship becomes weaker when individuals who do not recall their payout decisions are included in the sample.Footnote 6 This result suggests that strong nudges, such as default options, may reduce the level of ex-post regret among the less informed, or less engaged, individuals.
The survey is also used to study individual determinants and motives of annuitization. The survey participants were asked to report the importance of various factors with regard to their payout decisions. In addition, non-annuitants were asked to state their main reason for choosing a fixed-term payout. I restrict these analyses to individuals who accurately recalled their payout decisions in order to focus on annuitization that is likely an outcome of a conscious choice between payout options.Footnote 7
Several individual characteristics are significantly correlated with payout choice. First, individuals with a large amount of pension wealth are more likely to annuitize. These individuals may have lower discount rates, incentives to choose a smaller monthly payout for tax reasons, sufficient money to participate in the annuity market in the first place, and more income to withstand unexpected health shocks (and can therefore afford to buy an annuity) (Bütler and Teppa, Reference Bütler and Teppa2007; Inkmann et al., Reference Inkmann, Lopes and Michaelides2011; Hagen, Reference Hagen2015; Reichling and Smetters, Reference Reichling and Smetters2015).Footnote 8 Second, and as mentioned above, working pensioners are more likely to annuitize, as they may think less about payout-related issues and the pension-claiming process, and hence become more likely to stick with the default. Working individuals may also refrain from fixed-term payouts to avoid a higher marginal tax rate. Third, and in line with previous evidence of adverse selection in annuity markets (Finkelstein and Poterba, Reference Finkelstein and Poterba2002, Reference Finkelstein and Poterba2004), annuitization is increasing in self-reported health. Finally, individuals who consulted a financial advisor prior to the claiming decision are significantly less likely to annuitize. This correlation could be because either active investors (who are more likely to opt out of the default) are also more likely to seek professional financial advice or financial advisors recommend individuals to take a fixed-term payout and invest the money elsewhere.
The most frequent self-reported reason for choosing a fixed-term payout is consumption flexibility. More than 40% of the answers cite the opportunity provided by fixed-term payouts to spend more in the early years of retirement. This result is in line with the empirical fact that real household consumption declines gradually during retirement (Hurd and Rohwedder, Reference Hurd, Rohwedder and Wise2011). It also suggests that allowing for partial annuitization may increase the average percentage of pension wealth being annuitized (Beshears et al., Reference Beshears, Choi, Laibson, Madrian and Zeldes2014).
The second most frequent self-reported reason for choosing a fixed-term payout relates to a willingness to ‘cash out the money before dying.’Footnote 9 In line with theories of loss aversion, individuals may avoid annuitization because they place more weight on the potential losses in the case of an early death than the equivalent gains in the case of longer life (Hu and Scott, Reference Hu and Scott2007). The so-called insurance fallacy – individuals do not insure themselves against good events, such as living longer – may also play a role here (Goedde-Menke et al., Reference Goedde-Menke, Lehmensiek-Starke and Nolte2014).
The remainder of this paper is organized as follows. Section 2 provides a brief description of the Swedish pension system, with emphasis on the structure of the occupational pension plan for white-collar workers. Section 3 describes the survey design, and Section 4 presents and discusses the empirical results. Section 5 presents additional tests, including separate analyses of the various fixed term-payouts, and robustness checks. Section 6 concludes.
2. Institutional background
2.1 The structure of the Swedish pension system
Sweden's pension system has two main pillars: a universal public pension system and a quasi-mandatory occupational pension system for workers whose employer is tied to some occupational pension plan.Footnote 10 Mandatory annuitization applies to all pension wealth in the public pension system. The public pension can be withdrawn at age 61.Footnote 11 While there is no legislated normal retirement age, workers are obliged to leave their employment at age 67 if requested by the employer to do so.Footnote 12
The second pillar consists of several different occupational, employer-provided pension plans. Most occupational pension plans are designed and implemented at the union level. There are four large agreement-based occupational pension plans that cover at least 90% of the total work force (Kjellberg, Reference Kjellberg2018). Two of these plans cover workers employed in the public sector. The other two pension plans cover white-collar workers and blue-collar workers in the private sector, respectively. This study focuses on payout choices in Industrins och handelns tilläggspension (ITP), the pension plan for white-collar workers in the private sector.
2.2 The occupational pension for white-collar workers
The most important source of occupational pension income for white-collar workers in the ITP plan is DB. This component, which is referred to as ITP2, is the focus of this study.
Benefits from ITP2 depend on the final wage prior to retirement. The basic replacement rate of ITP2 is 10% of the final wage. This rate applies to earnings below the so-called income ceiling in the public pension system.Footnote 13 The replacement rate for the portion of the final wage that exceeds the income ceiling is 65%.Footnote 14 The 65% corresponds to the targeted replacement rate for an average worker in the public pension system. The ITP plan, therefore, provides a top-up to the public pension below the income ceiling while maintaining the general replacement rate of about two-thirds of earnings above the income ceiling. This structure implies that the ITP plan plays a relatively more important role for high-income earners.Footnote 15
Like many DB plans, ITP2 leaves little room for individual retirement savers to make their own decisions regarding their pensions. Individuals cannot decide on the magnitude of their own contributions (the replacement rates described above are fixed and apply to everyone); neither are they offered any investment choice during the accumulation phase. ITP2 wealth cannot be transferred from the default managing company, Alecta, to another pension company.
As for the decumulation phase, pensions from ITP2 can be withdrawn from the age of 55, and there is no upper age limit for initiating the payment. If no action is taken by the retiree, the pension is paid out as a life annuity at age 65. While mandatory annuitization used to apply to all ITP2 benefits, fixed-term payouts were introduced as an alternative to annuitization in 2008.Footnote 16 The details surrounding the payout choice are described in the next section.
2.3 Payout options
White-collar workers receive an information letter about the available payout options from Alecta, 3 months before their 65th birthday, along with the corresponding monthly amounts. Individuals can choose to withdraw their ITP2 pension either as a life annuity or over a fixed number of years (5, 10, 15, or 20 years).Footnote 17 The life annuity guarantees the retiree a stream of money up until the point of death. Under fixed-term payouts, payments cease at the end of the stipulated term, or if the individual dies before the end of the term. There is no survivor benefit, meaning that any remaining pension wealth accrues to the other participants of the pension plan. Payments from ITP2 are adjusted for inflation. As noted above, the default is a life annuity paid out at the age of 65.
The conversion factors that determine the relationship between the payout options depend on assumptions about average life expectancy at each claiming age and the rate of return on the pension capital. The conversion factors are, however, independent of gender and marital status. In 2013, the year in which the payout decisions under study were made, the conversion factors at age 65 between the life annuity and the 5-, 10-, 15-, and 20-year payouts were 3.73, 2.72, 1.46, and 1.21, respectively. For example, if an individual is entitled to a life annuity of SEK 2,500 per month, he or she can instead choose a 5-year option paying SEK 9,325 (3.73 × 2,500), a 10-year option paying SEK 6,800 (2.72 × 2,500), a 15-year option paying SEK 3,650 (1.46 × 2,500), or a 20-year option paying SEK 3,025 (1.21 × 2,500). Fixed-term payouts, therefore, increase liquidity but remove the insurance against upside longevity.
Hagen (Reference Hagen2015) compares the expected discounted present value of the life annuity to the expected discounted present value of each of the fixed-term payouts in ITP2.Footnote 18 He finds a ratio marginally below one for all payouts, meaning that the average worker is expected to receive at least as much from a fixed-term payout compared to the life annuity over the remaining expected lifetime. Hagen (Reference Hagen2015) also shows that the attractiveness of the life annuity increases if we consider the expected value of different payout options net of taxes. Due to the progressivity of the tax schedule, the average tax rate on the pension income from ITP2 decreases with the length of the payout for a given level of non-ITP2 income.Footnote 19 In other words, shorter payment horizons result in higher monthly income, but also higher tax bills.
Individuals may receive occupational pension income from different occupational pension plans, and hence they are required to make more than one payout decision. Importantly, the other major occupational pension plans allow only DC capital to be withdrawn as fixed-term payouts. For today's elderly, the pension capital that is not subject to mandatory annuitization in these plans is therefore generally much smaller than that in ITP2 because individuals started to accumulate DC capital in these plans only in the late 1990s or early 2000s. In fact, ITP2 is the only DB plan in Sweden to allow fixed-term payouts. Pension income from the public pension system and other occupational pension plans that the survey participants may have contributed to during their working career can therefore be thought of as pre-annuitized wealth.Footnote 20
3. The survey
I designed the survey together with the pension company Alecta, which manages ITP2 pensions for Swedish white-collar workers. We hired the survey firm IpsosFootnote 21 to administer the survey by telephone in early 2014. The population of interest consisted of 28,000 white-collar workers who had started to withdraw their occupational pension from Alecta in 2013 when they turned 65, which is the normal retirement age. Focusing on withdrawals that were initiated at age 65 is not a major restriction; in 2013, as many as 86% started to collect their ITP2 pension at this age. At the time of the interview, the majority of participants were 65 years old while some had just turned 66.
The pre-determined number of interviewed individuals was 1,000. The sample was stratified on payout choice such that 60% of the interviewed individuals would have chosen a fixed-term payout (5, 10, 15, or 20 years) and the remaining 40% the life annuity.Footnote 22 The upper panel of Table 1, which compares the distribution of payout choices in the sample population to that of the population of interest, shows that the stratification strategy worked. Close to 40% of the survey participants chose the life annuity while the corresponding fraction in the population of interest amounted to 75%. Individuals were chosen randomly within each group until the pre-determined quota was met.
Response analysis

This table reports individual characteristics and payout choices of the survey participants as well as the population of white-collar workers from which the survey sample was drawn. The sample was stratified on payout choice such that 60% of the interviewed individuals would have chosen a fixed-term payout (5, 10, 15, or 20 years) and the remaining 40% the life annuity. Income variables are in 2013 prices, US $1 ≈ SEK 9.
Around 900 individuals who were contacted declined to participate in the survey. The proportion of annuitants among those who refused to participate is very similar to the targeted share of annuitants (i.e., 40%). However, among the fixed-term payouts, having a 5-year payout is relatively less common in the survey (54% of the fixed-term payouts) than in the sample population (60% of the fixed-term payouts). Correspondingly, fixed-term payouts of 10, 15, and 20 years are somewhat overrepresented in the sample population compared to the population of interest. In both populations, however, the demand for fixed-term payouts is negatively correlated to payment horizon with <1% of those opting for a fixed-term payout choosing the 20-year payout.
To examine potential selection issues, we compare the characteristics of the survey participants with the characteristics of the population of interest. The lower panel of Table 1 reports the mean of several variables that can be observed for both populations. Reassuringly, we see that individuals in the survey sample are very similar to the population of interest in terms of gender, pre-retirement income, and education. Note, however, that the average ITP2 pension payment under the life annuity is somewhat smaller than the corresponding payment in the population of interest.Footnote 23
The survey comprised 55 questions and the average completion time was 40 minutes. The survey participants were first asked to report which payout option they had chosen for their ITP2 pension. If they were unsure, or reported the wrong choice, the interviewer informed them of their actual choice. Then followed a series of questions related to their motivations for payout choice, demographics, current financial situation, time preferences, and financial literacy; these questions are described in more detail in the next section. The survey answers were then matched with Alecta's administrative data on the participants' actual payout choices.
3.1 Survey questions and summary statistics
The subsequent analysis of annuity demand will focus on the variables listed in Table 2. The first two columns present the mean and standard deviation of these variables, respectively. The third column provides the number of individuals who responded to the question, i.e., those who neither failed to answer the question nor answered ‘do not know’ or ‘do not want to answer.’ Note that only the register-based variables (pension size and gender) have 1,000 observations while the survey-based variables have fewer than 1,000 observations, in particular the question on pre-retirement income.
Participant characteristics
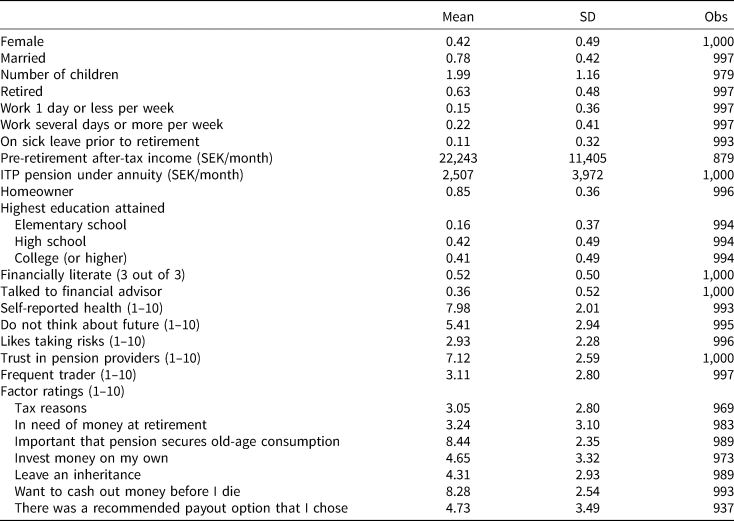
This table reports summary statistics for the survey sample. Income variables are in 2013 prices, US $1 ≈ SEK 9.. The variables are described in Section 3.1.
The first set of questions reported in Table 2 relate to individual background characteristics: 58% of the survey participants are male; 78% are married; and the average number of children is close to 2. Also, 63% report that they are retired (not working at all), and about one-fifth work several days per week or more. The average net-of-tax income before retirement is approximately SEK 22,200 (US $1 ≈ SEK 9), which is 10% higher than the national average in the age group 60–64 years.
The average monthly pension from ITP2 is SEK 4,445 (SEK 2,500 under the life annuity), which is approximately 20% of the average self-reported (pre-tax) income at age 66.Footnote 24 When asked about the relative importance of the ITP2 pension for their total retirement income, 13% report that more than 50% of their total retirement income comes from this pension plan, 22% report between 30% and 50%, 31% between 10% and 30%, 13% below 10% while 21% do not know (not reported in the table). Thus, the ITP2 pension clearly makes up a sizable part of total retirement income.
Turning to education, 16% finished only elementary school and around 41% have a college degree. The corresponding shares in the general population of 65-year-olds in Sweden amount to approximately 25% and 30%, respectively. We conclude that our group of white-collar workers are on average better off both in terms of income and education than other Swedes of similar age.
In line with this finding, I also find that survey respondents have a relatively high level of financial literacy. Specifically, slightly more than half of the survey participants responded correctly to three standard questions on financial literacy, called the ‘Big Three’ (Lusardi and Mitchell, Reference Lusardi and Mitchell2014).Footnote 25 This share is much higher than in Almenberg and Säve-Söderbergh (Reference Almenberg and Säve-Söderbergh2011) and Almenberg et al. (Reference Almenberg, Lusardi, Säve-Söderbergh and Vestman2020) who asked similar questions to a representative sample of the Swedish working-age population in 2011 and 2014, respectively. Moreover, about one-third of the survey participants said they had consulted with a financial advisor prior to making their payout decision.
Participants were also asked to rank the extent to which they agreed with the following statements on a scale from 1 to 10 (a higher number means that they agree more): ‘I do not think much about my future needs’; ‘I like taking risks to win big’; ‘I trust the pension companies that manage my pension wealth’; and ‘I often make changes in my financial portfolio.’ They were also asked to rank the following two statements related to present-bias and risk tolerance, respectively: ‘I do not think much about what I need in the future’; and ‘I am a person who likes taking risks to win big in the future.’
Finally, participants were asked to rate the importance on a scale from 1 to 10 (1 for not important, 10 for very important) of seven statements related to their payout choice. These include: ‘There were tax reasons behind my payout choice’; ‘I was in great need of money when I claimed my occupational pension’; ‘I want to invest my pension capital on my own’; ‘I want to leave a sizable inheritance’; ‘I want to cash out as much as possible of the pension before I die’; and ‘there was a recommended payout option that I chose.’ We will henceforth refer to these as ‘factor ratings.’
4. Main results
This section presents three sets of results: recollection of payout decision (4.1), demographic correlates of annuitization (4.2), and factor ratings (4.3). Section 5 provides robustness checks and additional analyses of payout demand, including separate analyses of the different fixed-term payouts and the relationship between regret and payout decisions. All estimations with a binary outcome are performed using linear probability models with robust standard errors.Footnote 26 In the estimations, I also apply inverse probability weighting to account for the oversampling of fixed-term payouts vis-à-vis the life annuity and the overrepresentation of longer fixed-term payouts, i.e., >5 years (see Section 3).Footnote 27
4.1 Recollection of payout decision
The first annuity-related question in the survey asked participants whether their ITP2 pension would be paid out ‘as a lifelong payment’ or ‘during a fixed number of years.’ If participants were unsure, or reported the wrong choice, the interviewer informed them of their actual choice. The upper panel of Table 3 reports the share who reported having chosen the life annuity (column 1); having chosen any of the fixed-term payouts (column 2); or not knowing or recollecting (column 3) for annuitants (row 1) and non-annuitants (row 2), respectively. The last column shows that 946 out of 1,000 individuals responded to this question.
Knowledge of payout decision
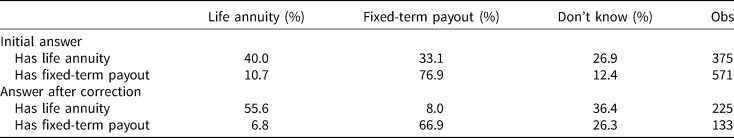
This table reports the share of the survey sample who reported having chosen a life annuity (column 1); having chosen a fixed-term payout (column 2); or not knowing or recollecting (column 3) by their actual payout decision. The lower panel restricts the sample to those who initially stated the incorrect payout option or not knowing.
We first see that only 40% of the annuitants correctly reported having chosen the life annuity. About one-third thought they had chosen a fixed-term payout while 26.9% said that they did not know.Footnote 28 The share of correct answers among those who opted for a fixed-term payout is almost twice that of the annuitants (76.9%). Among those who chose a fixed-term payout, only 10.7% incorrectly stated the life annuity as their choice while 12.4% were unsure. Although a higher share of correct answers is expected among those who had chosen a fixed-term payout as they had rejected the default option, the difference is substantial.
The lower panel of Table 3 shows that the majority of participants who either got the payout option wrong or said that they did not know, agreed with the interviewer when they were informed of their true payout choice. A small proportion (<10%) insisted on their initial response, and between 26% and 36% said that they still do not know.
To examine the characteristics of those who manage or fail to recall their true payout choice, Table 4 reports the results from regressing a dummy variable that takes on the value of 1 if the individual reports the correct payout choice on (most of) the variables listed in Section 3. I use dummy variables to rank individuals by pre-retirement income and ITP2 pension capital: 1st–10th percentile, 10th–30th percentile, 30th–70th percentile (omitted category), 70th–90th percentile, and 90th–100th percentile. The samples in column (1) and (2) comprise annuitants and non-annuitants, respectively. Note that the sample size is smaller than 946 (the number of individuals who reported a payout choice) because there are missing entries for most variables in the data (see Table 2).
Demographic correlates of correct belief
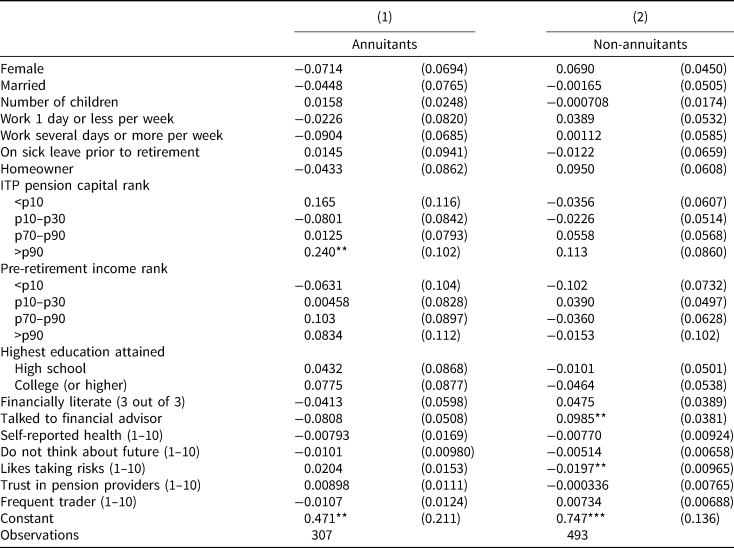
* Significant at the 10% level. ** Significant at the 5% level. *** Significant at the 1% level.
The p-value from an overall F-test of the joint significance of the pension capital rank variables is 0.03 for annuitants (1) and 0.43 for non-annuitants (2). The corresponding p-value for the pre-retirement income rank variables is 0.71 for annuitants (1) and 0.99 for non-annuitants (2).
This table reports the coefficient estimates from a linear probability model regressing a dummy variable that takes on the value of 1 if the individual reports the correct payout choice on a set of independent variables. The samples in column (1) and (2) are restricted to annuitants and non-annuitants, respectively. Inverse sampling probabilities were used. Robust standard errors are in parentheses.
Among annuitants, the only significant variable predicting whether they are able to accurately recall their payout choice is pension wealth; those in the top wealth decile are 24 percentage points more likely to report the correct pension choice compared to those in the middle (30th–70th percentile). Individuals in the bottom wealth quartile are also more likely to report the correct payout choice compared to those in the middle of the wealth distribution, but the coefficient is not statistically different from zero. Individuals with higher levels of income, the more highly-educated, and males are more likely to correctly report their payout choice; however, none of these coefficients is statistically significant. Turning to non-annuitants, individuals who consulted with a financial advisor prior to making their payout decision are almost 10 percentage points more likely to report the correct payout choice. The likelihood of answering correctly is also higher among more risk-averse individuals.Footnote 29
To increase the sample size and potentially the precision of the estimates, I re-estimate Table 4 for a combined sample of annuitants and non-annuitants. The results are presented in Table A1 in the Appendix. While the overall picture does not change much, the coefficient associated with working at least several days per week (at age 66) becomes significant at the 5% level. The finding that individuals who continue to work past the normal retirement age have greater difficulty in recollecting their actual payout choice suggest that they thought less about their pension decisions.Footnote 30 This interpretation is supported by the finding that the negative effect on remembrance is driven by annuitants, i.e., individuals who, either consciously or unconsciously, chose the default payout option.
4.2 Demographic correlates of annuitization
In this section, I examine the demographic correlates of annuitization among our sample of white-collar workers. I restrict the sample to individuals who knew their payout choice, i.e., 40% of annuitants and 77% of non-annuitants (see Section 4.1). The reason for this restriction is to focus on annuitization that was likely a deliberate and conscious decision. As a robustness test, alternative sample definitions are applied, adding, first, those who reported their actual payout choice after being reminded, and, second, the remaining survey participants.
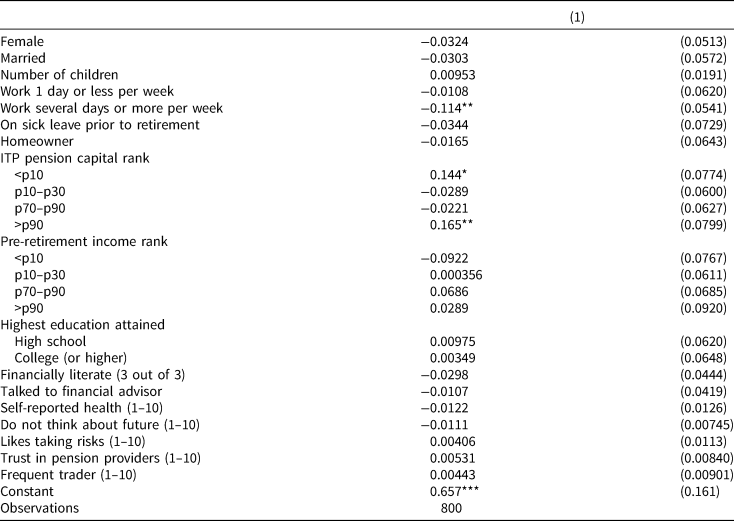
The first column of Table 5 shows the results from regressing a dummy variable for choosing the life annuity on the variables listed in Table 2 (excluding the factor ratings). Out of the 946 individuals who reported a payout choice, 586 fulfil the restriction criteria above. The number of observations in Table 5 then falls to 506 because of missing information for some of the control variables. The corresponding estimates for the extended samples are presented in Table A2.
Demographic correlates of annuitization
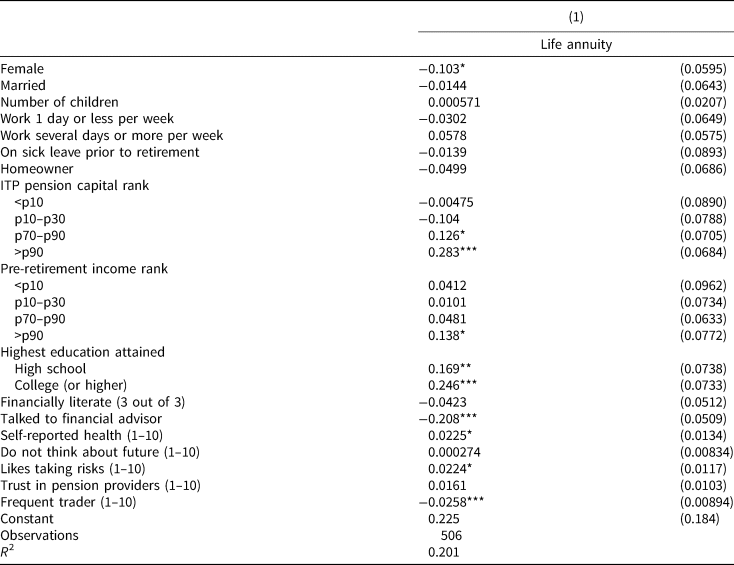
* Significant at the 10% level. ** Significant at the 5% level. *** Significant at the 1% level.
The p-value from an overall F-test of the joint significance of the pension capital rank variables is <0.00. The corresponding p-value for the pre-retirement income rank variables is 0.50.
This table reports the coefficient estimates from a linear probability model regressing a dummy variable that takes on the value of 1 if the individual chooses the life annuity on a set of independent variables. The sample is restricted to individuals who knew their payout choice. Inverse sampling probabilities were used. Robust standard errors are in parentheses.
The results indicate that the monetary amount at stake in the annuity choice is an important predictor of payout decision. In fact, retirees in the top decile of pension capital are 28.3 percentage points more likely to annuitize than retirees in the middle of the pension capital distribution. The coefficients associated with the lower end of the pension capital distribution are negative but statistically insignificant. The corresponding estimates for the extended samples in Table A2 are, however, significant. Here, individuals in the lowest pension decile are 12.3 percentage points less likely to annuitize. These findings are in line with previous studies showing that small capital amounts tend to be withdrawn at a faster rate than larger amounts (Hurd and Panis, Reference Hurd and Panis2006; Bütler and Teppa, Reference Bütler and Teppa2007; Hagen, Reference Hagen2015) perhaps because small amounts are discounted at higher rates than larger amounts (Frederick et al., Reference Frederick, Loewenstein and O'donoghue2002).
The relationship between annuitization and pre-retirement income is less clear. The only significant coefficient is for the top income decile; they are 13.8 percentage points more likely to annuitize than their peers at the 30th–70th percentiles of the pre-retirement income distribution. Hagen (Reference Hagen2015) argues that individuals with the highest incomes may refrain from fixed-term payouts to avoid a higher marginal tax rate.Footnote 31
The results also reveal that continuing to work after pension withdrawal is positively associated with annuitization. Individuals who work full-time or close to full-time are almost 6 percentage points more likely to annuitize compared to fully-retired individuals. The observed positive relationship could possibly be explained by tax incentives or a lower propensity to think seriously about retirement-related issues (and hence to stick with the default payout option). The latter interpretation is supported by the finding in Section 4.1 that annuitants were less likely to recall their payout choice. This interpretation is also supported by the finding that the coefficient on working after retirement increases to 12 percentage points and becomes significant when the full sample is used (column (2) of Table A2).
The coefficients on education reflect an economically meaningful and statistically significant positive relationship between education level and annuitization. Having a college degree is associated with a 25-percentage-point higher likelihood of annuitizing compared to only having finished elementary school (12 percentage points for the full sample). We also see that women are less likely to annuitize, although this result is not robust to sample definition (see Table A2). A number of other demographic correlates, on the other hand, show no significant relationship with the annuity choice. Marital status, number of children, and homeownership are all close to zero and statistically insignificant.
It is also interesting to note that the coefficient for self-reported health is positive and significant. To the extent that subjective health is correlated with life expectancy, this result is in line with previous empirical studies on adverse selection in annuity markets (Finkelstein and Poterba, Reference Finkelstein and Poterba2002, Reference Finkelstein and Poterba2004; James et al., Reference James, Martinez and Iglesias2006). This result is also in accordance with Hagen (Reference Hagen2015) who find that both ex-post mortality and parental longevity are significantly correlated with payout choice. Interestingly, the coefficient on self-reported health becomes insignificant when the sample is extended to those who needed a reminder of their payout choice in order to get it right. This result strengthens the interpretation that the detected positive relationship between self-reported health and annuitization is indeed driven by individuals who base their payout decision on their health status.
The statement related to present bias (‘I do not think about the future’) is not significantly correlated with the annuity choice. One reason why present-biased individuals are not more likely to annuitize might be that present-biased individuals are also more likely to procrastinate, and hence more likely to stick with the default option (Brown and Previtero, Reference Brown and Previtero2020).
When it comes to involvement in financial matters, individuals who report having consulted with a financial advisor or pension expert regarding their pension withdrawal are 20 percentage points less likely to annuitize (7 percentage points for the full sample). This decision could be because active investors are both more likely to opt out of the default and to seek professional financial advice. The decision could also be due to financial advisors prompting their clients to take a fixed-term payout and invest the money elsewhere.Footnote 32 Finally, individuals who report that they often make changes to their financial portfolio are more likely to opt out of the life annuity.
4.3 Factor ratings
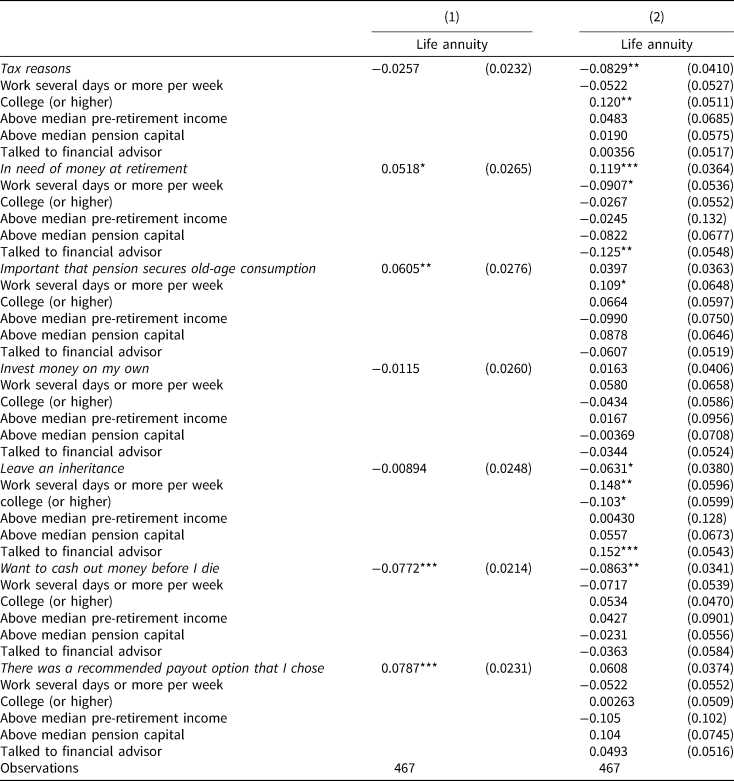
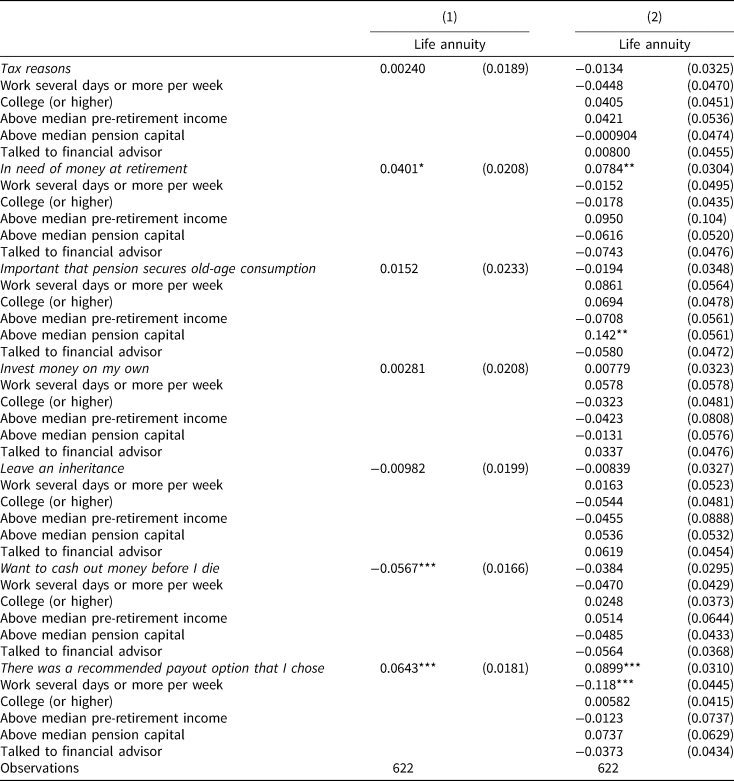
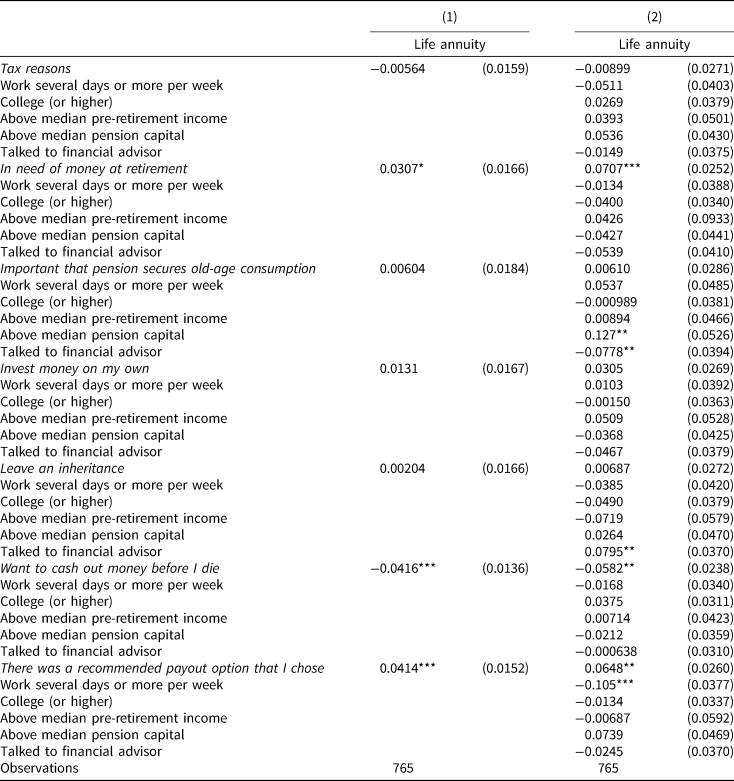
As discussed in Section 3.1, the survey participants were asked to report the importance of various factors with regards to their payout decision. Table 6, column (1), shows the results from regressing a dummy variable for choosing the life annuity on these factor ratings, conditional on the demographic variables discussed in the previous section. To examine whether certain groups of individuals placed more or less weight on certain factor ratings, column (2) adds interaction terms between each factor rating and a subset of the demographic variables used in (1). I focus on characteristics that turned out to be significantly correlated with annuity demand in Section 4.2, including continued work after claiming their pension, pension capital, pre-retirement income, education level, and consulting a financial advisor.Footnote 33 Each factor rating is standardized to have a mean of zero and a variance of one. Recall that the sample is restricted to individuals who knew their payout choice. Tables A4 and A6 in the Appendix present corresponding estimates for the extended samples.
Factor ratings
* Significant at the 10% level. ** Significant at the 5% level. *** Significant at the 1% level.
This table reports the coefficient estimates from a linear probability model regressing a dummy variable that takes on the value of 1 if the individual chooses the life annuity on participants' factor ratings. The factor ratings are standardized to have a mean of zero and a variance of one. Columns (1) and (2) control for the demographic variables in Table 5. Column (2) then adds interaction terms between each factor rating and a subset of the demographic variables used in (1). The sample is restricted to individuals who knew their payout choice. Inverse sampling probabilities were used. Robust standard errors are in parentheses.
Four factor ratings are significant in the first column of Table 6. First, we see that annuitization is increasing in the importance placed on the factor ‘I was in great need of money when I claimed my occupational pension.’ The coefficients of the interaction terms in the second column show that this result is driven by retired individuals and individuals who did not seek financial advice. These individuals may have refrained from a higher pension payment today because they know that they are likely to also be cash-constrained in the future.Footnote 34 Second, annuitization is increasing in the importance placed on the factor ‘it is important that the pension covers my needs when I get very old.’ This result is, again, driven by individuals who were active in the labor market after claiming their pension. In the robustness tables, we also see that individuals with large pension capital put more weight on this factor.
The third significant factor rating, which has a negative sign, is ‘it is important for me to cash out as much as possible while I am still alive.’ This statement could capture many things, such as low life expectancy, a desire to spend more in the early years of retirement, or a more general aversion to losing the money in the case of early death (irrespective of life expectancy). As argued later in Section 5.3, the two latter explanations are likely to matter more. No particular subgroup is uniquely associated with this factor rating as indicated by the insignificant interaction terms in the second column. Fourth, we see that some individuals chose life annuity because they interpreted the life annuity as the recommended option. The estimated coefficient for the statement ‘there was a recommended payout option that I followed’ is positive and significant. While none of the interaction terms is significant in Table 6, the coefficient for working several days a week or working full-time becomes negative and significant when I use the extended samples. These results support the interpretation that individuals who intend to work past the normal retirement age think less about payout-related issues and the pension-claiming process.
The second column of Table 6 contains two further findings that are worth pointing out. First, while the factor rating related to tax concerns (‘There were tax reasons behind my payout choice.’) is unrelated to the annuity choice in general (column 1), the estimate of the interaction term between the weight placed on the tax-related factor rating and having a college degree is positive and significant. In other words, individuals with a college degree, who on average have higher earnings than individuals without a college degree, may have chosen a life annuity, at least partly, for tax reasons. This finding is in line with Hagen (Reference Hagen2015) who shows that individuals who may reach the state income tax threshold under a 5-year payout, thereby having to pay a larger share of their pension income in taxes, are less likely to choose the 5-year payout. Second, the interaction term between consulting a financial advisor and the factor rating related to bequest motives – ‘I want to leave a sizable inheritance.’ – is positive and significant. One interpretation of this result is that individuals who seek financial advice are less worried about their own financial security in old age because they have sufficient income from other sources (recall that they put less weight on the factor rating related to cash constraints); therefore, they put more time and thought into other factors that are important to them, such as leaving a sizable bequest.
5. Further tests and robustness checks
5.1 Sampling reliability
I perform several robustness checks to strengthen the internal validity of the results. As discussed in Section 4, the results are overall relatively robust to sample specification (i.e., including individuals who did not know their payout choice).
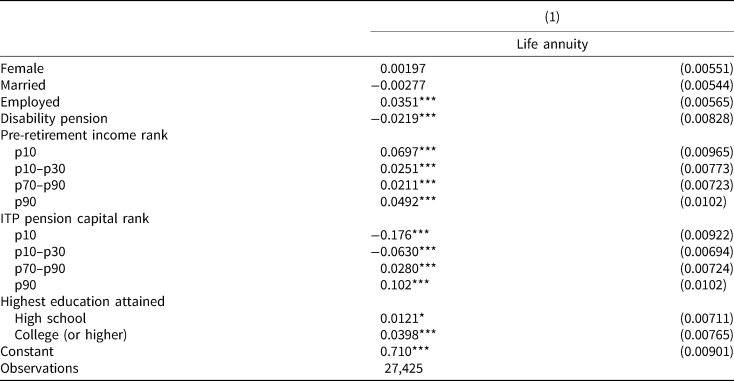
As a further check on sampling reliability, I replace the survey data with register data, specifically individual-level demographic data from Statistics Sweden. I perform a similar analysis of the demographic correlates of annuity demand on the population of interest, i.e., the 28,000 white-collar workers who claimed their pension at age 65 in 2013. The Alecta dataset on pension payouts are merged with the Statistics Sweden dataset.Footnote 35 While pension capital and gender are observed in both datasets, information on marital status, education level, employment at age 66, and pre-retirement income (average labor income between ages 60 and 64) are now drawn from Statistics Sweden instead of from the survey. The latter variables are defined in a way so that they mimic the (self-reported) equivalents in the survey. As a proxy for health, I include a dummy for having received disability pension. The estimation results from a linear probability model on annuity demand are shown in Table 7. Reassuringly, the results are largely in line with the findings in Table 5. While annuitization is unrelated to gender and marital status, it is increasing in education level, health status, and pension capital. Again, we see a U-shaped relationship between pre-retirement income and annuitization, although the U shape here is much more pronounced.
Demographic correlates of annuitization using register data
* Significant at the 10% level. ** Significant at the 5% level. *** Significant at the 1% level.
This table reports the coefficient estimates from a linear probability model regressing a dummy variable that takes on the value of 1 if the individual chooses the life annuity on a set of independent variables. The regression sample contains the population of interest, i.e., white-collar workers who claimed their ITP2 pension at age 65 in 2013. The data are a combination of pension data from the managing company, Alecta, and individual-level demographic data from Statistics Sweden. The register-based variables are constructed to mimic the survey-based variables as closely as possible (see Section 5.1). Robust standard errors are in parentheses.
5.2 Separating the fixed-term payouts
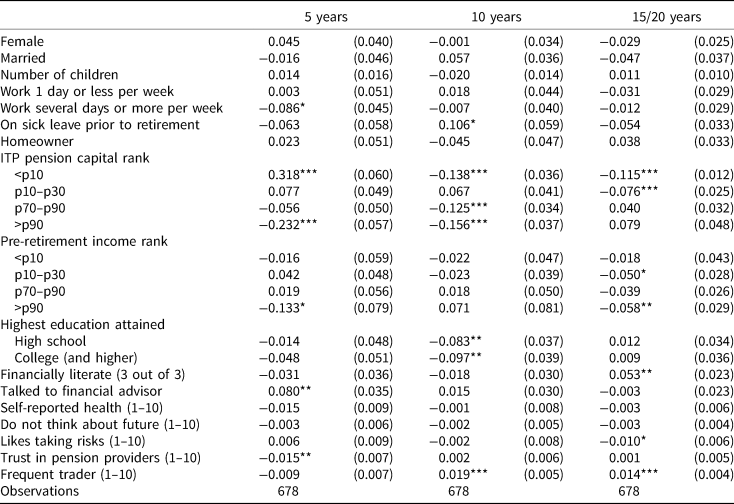
Until now, we have grouped the fixed-term payouts in one category and focused on the demand for life annuities versus all fixed-term payouts. However, the motivations for choosing the 5-year payout may be very different from choosing, for example, the 10-year payout. For this reason, I use a multinomial logit model to study the relationship between the demand for each payout option and the demographic correlates and factor ratings.Footnote 36
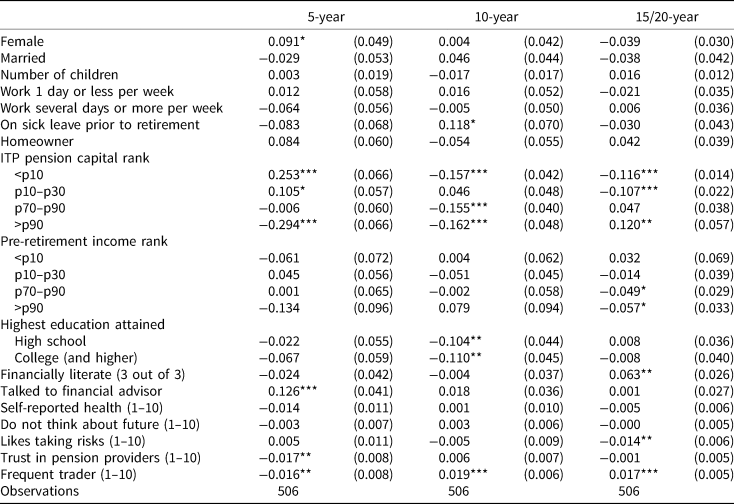
Using the life annuity as the reference category, columns (1)–(3) of Table 8 report marginal effects of each of the demographic correlates considered in Section 4.2 on the respective demand for these payout options: (i) 5 years; (ii) 10 years; and (iii) 15 or 20 years. The marginal effect of each of the binary variables is the discrete change from the base level while the non-binary variables are evaluated at their means.
Demographic correlates of annuitization using a multinomial logit model (marginal effects)
* Significant at the 10% level. ** Significant at the 5% level. *** Significant at the 1% level.
This table reports marginal effects estimated using a multinomial logit model. The marginal effect associated with each coefficient can be interpreted as the variable's incremental effect on the probability of choosing the fixed-term payout indicated in the column heading. Note that 15- and 20-year payouts have been merged into one category. The life annuity is the reference category. The sample is restricted to individuals who knew their payout choice.
We first see that the previously detected positive relationship between being female and the demand for fixed-term payouts is driven by demand for 5-year payouts.Footnote 37 Potential reasons for this gender difference are discussed in Section 5.3.
Moreover, we see that the previously insignificant correlation between sick leave and annuitization masks important heterogeneity with respect to the length of the fixed-term payouts. Specifically, individuals with a recent record of sick leave are almost 12 percentage points more likely to choose the 10-year payout. In contrast, they are about 8 percentage points less likely to choose the 5-year payout, although this estimate is statistically insignificant; this observation does not rule out the possibility that adverse selection plays a role in 5-year payouts since most people would expect to live longer than 10 years. Individuals in poor health may, however, be less concerned with maximizing consumption possibilities in the early years of retirement. The result with respect to health, combined with the observation that education is negatively related to the demand for 10-year payouts but not 5-year payouts, suggest that individuals at higher risk of ending up with an insufficient pension do not choose the payout that offers the most money now – the 5-year payout.
We also see important heterogeneity in the relationship between pension capital and the demand for the different fixed-term payouts. Recall from our main specification in Table 5 that while individuals with the largest capital stocks were significantly less likely to opt out of the life annuity, the corresponding relationship for individuals at the lower end of the capital distribution was inconclusive. The estimates in Table 8 help explain the latter finding: those with the smallest capital stocks clearly prefer 5-year payouts, but are less likely to choose a fixed-term payout of 10 years or longer.
Although the coefficients for pre-retirement income are insignificant, they reveal some differences with respect to income and payout preferences. While the demand for 5-year payouts is lower at both ends of the income distribution, the demand for 10-year payouts seems to increase with income. We also see that the positive correlation between consulting a financial advisor and choosing a fixed-term payout is entirely driven by demand for 5-year payouts.
Finally, there are two individual characteristics that were found to be unrelated to the annuity decision but are now revealed to have a significant correlation with a specific payout term. First, financial literacy is positively correlated with the probability of choosing the 15- or 20-year payout. Second, higher trust in pension providers reduces the likelihood of choosing the 5-year payout. Some individuals may prefer to cash out the money as fast as possible because they do not trust the pension provider to manage their money well or perhaps even to survive in the longer run. This result is in line with Brown et al. (Reference Brown, Ivković and Weisbenner2015) and Bockweg et al. (Reference Bockweg, Ponds, Steenbeek and Vonken2018) who find that individuals who exhibit a lower level of confidence in the government or the pension system are substantially more likely to choose the more immediate payment option.
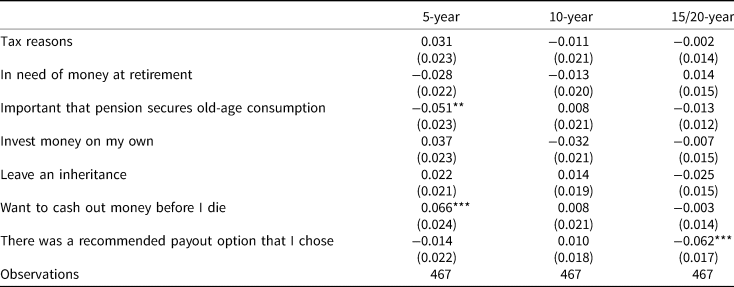
Turning to the factor ratings in Table 9, we see that the demand for 15- and 20-year payouts is lower for individuals who put more weight on the factor rating ‘there was a recommended payout option that I chose.’ Individuals who initially considered a fixed-term payout with a long payment horizon may have received some input during the claiming process about the advantages of insuring against upside longevity. We also see that a stronger preference for cashing out the money before dying is associated with a higher demand for 5-year payouts. The demand for 5-year payouts is also decreasing in the weight put on the statement ‘it is important that the pension covers my needs when I get very old.’
Factor ratings using a multinomial logit model (marginal effects)
* Significant at the 10% level. ** Significant at the 5% level. *** Significant at the 1% level.
This table reports marginal effects estimated using a multinomial logit model. The marginal effect associated with each coefficient can be interpreted as the variable's incremental effect on the probability of choosing the fixed-term payout indicated in the column heading. Note that 15- and 20-year payouts have been merged into one category. The life annuity is the reference category. The sample is restricted to individuals who knew their payout choice.
5.3 Self-reported reasons for choosing a fixed-term payout
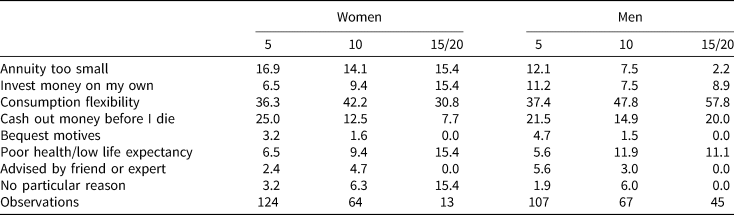
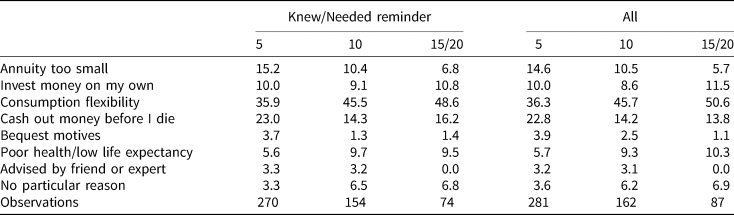
All non-annuitants who took part in the survey were asked to state the main reason for choosing a fixed-term payout. The text answers were then categorized into a number of reasons. Table 10 reports the distribution of ‘self-reported reasons’ for 5-year payouts (column 1), 10-year payouts (column 2), and 15- or 20-year payouts (column 3).Footnote 38
Self-reported reason for choosing a fixed-term payout
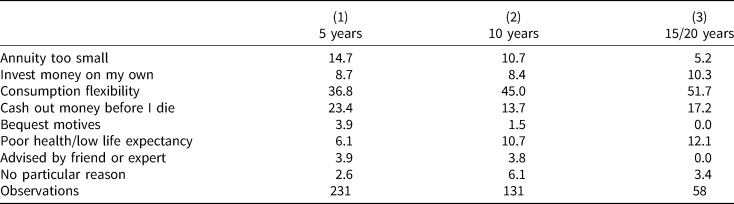
This table reports the distribution (in %) of the self-reported main reasons for choosing the fixed-term payout indicated in the column heading. Note that 15- and 20-year payouts have been merged into one category. The responses were categorized into the relevant groups by the author. The sample is restricted to individuals who knew their payout choice.
More than one-third of those who chose the 5-year payout highlight the opportunity offered by fixed-term payouts to consume more during the early retirement years. This share is even higher among those who chose a fixed-term payout of 10 years or longer. The following statements are typical for the ‘consumption flexibility’ motivation: ‘I need the money more now than I will later in life’; ‘I have a more active life style today than I will have in 10–15 years’; and ‘I want to enjoy the money as much as possible while I am still healthy.’ Some individuals who reported having other occupational pensions said that choosing the fixed-term payout was part of a bigger ‘pension puzzle.’
The second most common motivation relates to the idea of cashing out the money in the eventuality of an early death. ‘You don't know when you are going to die’ and ‘I want to make sure I get the money before I die’ are typical formulations in this category. This motivation is more frequently used by those who chose the 5-year payout compared to others.
The poor health/low life expectancy category aims at capturing the adverse selection issue more specifically by including individuals who explicitly mentioned their poor health status or low life expectancy. Interestingly, this share is almost twice as large among individuals who chose the longer payouts compared to those who chose the 5-year payout. This finding is in line with the result from the multinomial logit analysis that individuals who were on sick leave prior to retirement were significantly more likely to choose the 10-year payout than the 5-year payout.
We also see that around 9% take a fixed-term payout in order to invest the money on their own. Statements like ‘I think I can earn a better return than the pension company’ and ‘I can use the money whenever I want by claiming the money quickly and saving it on my own’ characterize this group. Between 5% and 15% report that they choose a fixed-term payout because the annuity would be too small. Only a few percent said that they chose a fixed-term payout to leave a bequest, or that they were advised by an expert (or friend) to choose a fixed-term payout. Note, however, that these factors could matter alongside the main (stated) reason.
We know from previous sections that women are more likely to choose a 5-year payout than men. Women are, however, no more likely than men to know their payout choice, and none of the female-interacted factor ratings was significantly correlated with annuity demand. To gain some insight with respect to gender differences in payout motives, Table A6 reports the distribution of self-reported reasons by fixed-term payout and gender.Footnote 39 From the top row, we see that a larger share of women report that they chose a fixed-term payout because the monthly payment under the life annuity was too small. This result is expected given that women on average have smaller pensions. Women are more likely than men to report that the main reason for choosing a 5-year payout is because they want to cash out the money before they die. This finding seems at odds with the fact that women tend to live longer than men, but could reflect differences in the availability of alternative sources of income (husband, family, first-pillar pension income). Finally, women are less likely than men to assert that they choose a 5-year payout because they want to invest the money on their own.Footnote 40
5.4 Regret
Section 4.1 provided evidence of widespread unawareness of past payout decisions, particularly among the annuitants (those who chose the default option). Incorrect beliefs about future pension streams could potentially have negative impacts on individual welfare due to sub-optimal consumption and saving decisions, among other things. While such ex-post evaluations are outside the scope of this study, the survey contained one question related to regret. Individuals who made decisions on pension payouts without much prior thought or those who stuck with the default option either knowingly or unknowingly may experience greater ex-post regret compared to those who made an informed decision.
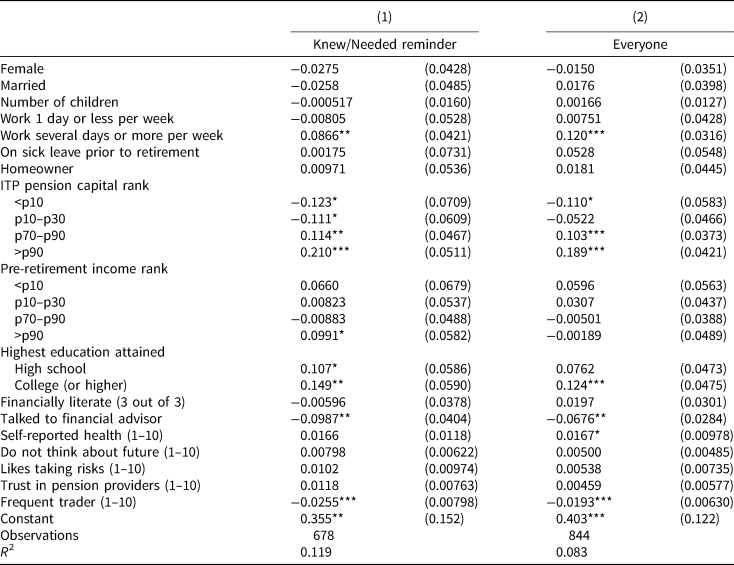
In conjunction with the factor ratings, the survey participants were asked to rank on a scale from 1 to 10 the extent to which they agreed with the statement ‘I am confident that I made the right choice of payout length.’ I examine whether annuitants express greater feelings of regret about their payout decision and whether regret is related to awareness of their decision. Specifically, I regress a dummy variable for choosing the life annuity on the demographic variables used in Section 4.2 as well as the regret variable (standardized). I do this separately for the three samples: those who knew their payout choice, those who knew or needed a reminder to get it right, and all survey participants. The results are reported in Columns 1–3, respectively, of Table 11.
Regret and annuitization

* Significant at the 10% level. ** Significant at the 5% level. *** Significant at the 1% level.
This table reports the coefficient estimates from a linear probability model regressing a dummy variable that takes on the value of 1 if the individual chooses the life annuity on a set of independent variables, including the statement ‘I am confident that I made the right choice of payout length’ (answered on a scale from 1 to 10). The sample is restricted to individuals who knew their payout choice (column 1), individuals who knew their payout choice or needed a reminder to get it right (column 2), and all survey participants (column 3). Each regression controls for the demographic variables in Table 5. Inverse sampling probabilities were used. Robust standard errors are in parentheses.
From the first column, we see that annuitants are significantly less confident that they made the right payout decision. This result is in line with Brown et al. (Reference Brown, Farrell and Weisbenner2011) who show that individuals who were nudged into a specific retirement plan were likely to regret their decision. Interestingly, however, the relationship becomes weaker as individuals who did not know their payout choice are added to the sample. This finding provides indicative evidence that strong nudges, such as default options, may reduce the level of ex-post regret among the less informed or less engaged individuals. There is previous evidence that people who buy annuities are happier with their decision afterwards (Mitchell et al., Reference Panis, Mitchell and Utkus2003).Footnote 41
6. Conclusion
In this paper, I analyze a telephone survey of 1,000 new retirees to study awareness and motivations of pension decisions. The survey population is Swedish white-collar workers who had made pension decisions, choosing among a life annuity and several fixed-term payouts, in their occupational pension plan in 2013. The fastest rate at which the pension capital can be withdrawn is over a 5-year term. The survey was conducted in early 2014. The survey data are matched with administrative records from the managing pension company on the actual payout decisions of the survey participants. Access to actual payout decisions provides a unique opportunity to examine ex-post the extent to which retirees are able to recall their payout choice.
I find that a majority of retiring white-collar workers fail to recall their payout choice. Ignorance is much higher among annuitants; only 40% of the annuitants could accurately recall their payout choice compared to 77% of those who opted for a fixed-term payout. The most likely reason why annuitants are less informed about their payout choice is that the annuity is the default option, or the ‘path of least resistance.’ Beyond payout choice, however, few individual characteristics predict successful recollection.
I also find that annuitants are, on average, more likely to regret their payout choice than those who opted for a fixed-term payout. However, annuitants who were not able to recollect their payout choice when first asked but who were able to accurately report it after being informed by the interviewer do not express more regret than the informed annuitants. This observation suggests that strong nudges, such as default options, may reduce the level of ex-post regret among the less informed or less engaged individuals. In general, allowing retirees to pause or reverse initiated payments may also mitigate feelings of regret.
From an international perspective, Swedish households are financially relatively sophisticated, and white-collar workers are a positively selected group in terms of education and income.Footnote 42 Yet many individuals fail to remember whether or not they recently chose to annuitize a substantial fraction of their pension wealth. How should we interpret this apparent inconsistency? My interpretation is that the low recollection rate reflects a significant body of evidence from many different countries, including Sweden, that pension plans tend to be characterized by low engagement and various behavioral biases. Individuals may refrain from making an active choice because they procrastinated until it was too late to collect the relevant information to make an informed choice, or because they did not trust their own judgement in making the right choice. Some may have even missed the opportunity of making a payout decision altogether.
Engagement in claiming decisions may increase naturally over time – younger cohorts may be more used to and susceptible to freedom of choice in their retirement savings. Compared to DB plans, which is the focus of this study, DC plans generally leave more room for individual retirement savers to make their own decisions regarding their pensions. However, policymakers and pension plan administrators also need to make sure that the choice architecture and the set of available information are designed in such a way that future retirees can easily make informed claiming decisions. For example, online tools that collect and personalize information on accumulated pension capital in different pension plans provide a promising way for retirees to get a better overview of their financial situation. In Sweden, the online platform Minpension.seFootnote 43 is currently launching a device that allows individuals to plan and initiate payouts from all three pillars. Using this platform significantly reduces transaction costs in pension applications and may encourage retirees to exert more effort in making their claiming decisions. Another possibility is to change the choice architecture from choosing inputs (payout choice) to choosing outcomes (desired income profile during retirement) (Goldstein et al., Reference Goldstein, Johnson and Sharpe2008).
As annuitization rates in all major second-pillar pensions in Sweden are approaching 50%, policymakers are increasingly concerned that many individuals will be at risk of outliving their resources. The trend towards shorter payouts is likely to continue as replacement rates in the first pillar continue to fall, and as the share of second-pillar pension wealth that is not subject to mandatory annuitization increases. Furthermore, while today's retirees tend to have a small number of fairly large pension capital stocks, rising worker mobility across sectors implies that tomorrow's retirees are more likely to have a larger number of small pension capital stocks, which in turn could lead to lower annuitization rates. I have documented in this paper that small stocks of pension capital are more likely to be cashed out. The most common self-reported motivation for taking a fixed-term payout is a desire to spend more in the early years of retirement. Many also express a willingness to ‘cash out the money before dying.’ Partial annuitization or bonus payments might therefore be effective in increasing annuitization rates, as argued by Beshears et al. (Reference Beshears, Choi, Laibson, Madrian and Zeldes2014) and Bockweg et al. (Reference Bockweg, Ponds, Steenbeek and Vonken2018). Future research in this field should continue to map trends in annuitization rates across different sectors and countries, and in particular, focus on the later-life consequences of choosing a lump-sum or fixed-term payout, and of potential misbeliefs of past pension decisions.
Acknowledgement
Thanks to Alecta for financially supporting and administrating the survey and to two anonymous referees for providing useful and constructive comments. Financial support from Forte (nr 2017-00092 and 2013-2482) is gratefully acknowledged.
Appendix
Demographic correlates of correct belief, pooled sample
Demographic correlates of annuitization, extended samples
Factor ratings, needed reminder
Factor ratings, everyone
Demographic correlates of annuitization using a multinomial logit model (marginal effects), needed reminder
Self-reported reason for choosing a fixed-term payout, by gender
Self-reported reason for choosing a fixed-term payout, extended samples


 Open access