


Introduction
Volunteer research has received significant attention from researchers in the last decades, driven by the need to develop effective policies for recruiting and retaining new volunteers (Cuskelly et al., Reference Cuskelly, Taylor, Hoye and Darcy2006; Hande et al., Reference Hande, Taylor and Keefe2021; Peachey et al., Reference Peachey, Lyras, Cohen, Bruening and Cunningham2013; Prouteau & Wolff, Reference Prouteau and Wolff2008; Smith et al., Reference Smith, Thomas and Hazeldine2019). While considerable research has focused on understanding the motivations behind individuals’ decisions to initiate volunteer service, the factors influencing volunteers’ commitment to their organizations still require an integrative model that synthesizes them into a comprehensive framework.
The study of volunteer permanence in NGOs, reflecting their sustained participation over time, requires theoretical models to understand the factors that influence the longevity of volunteer engagement (Caligiuri et al., Reference Caligiuri, Mencin and Jiang2013). Although some theoretical models have emerged, there exists little research evidence due to two principal reasons. Firstly, the lack of longitudinal studies due to their inherent methodological challenges and associated costs hinders the academic investigation of dynamic processes such as volunteering (Amireault, Reference Amireault2014). Secondly, as we lack process-based studies, the variables that seem to influence volunteer permanence are usually included simultaneously in theoretical models regardless of at which moment of the process they exert their influence (Chacón et al., Reference Chacón, Vecina and Dávila2007; Marta et al., Reference Marta, Manzi, Pozzi and Vignoles2014).
A wide range of theoretical frameworks exist to account for the complex nature of volunteering (see Hustinx et al., Reference Hustinx, Cnaan and Handy2010 for a review; Hustinx & Lammertyn, Reference Hustinx and Lammertyn2003). Some of these models emphasize the dynamic nature of the volunteer experience, such as the Model of Volunteer Process (Omoto & Snyder, Reference Omoto and Snyder2002), which conceptualizes volunteering as a life cycle comprising antecedents, experiences, and consequences. However, this model may treat the complex transitions within the volunteer journey as a single category rather than examining them in depth (Hustinx et al., Reference Hustinx, Cnaan and Handy2010). Similarly, the Volunteer Stages and Transitions Model (Haski-Leventhal & Bargal, Reference Haski-Leventhal and Bargal2008) accounts for different phases of organizational socialization but assumes a linear progression, which may not adequately capture the complexities of volunteer experiences (Kappelides et al., Reference Kappelides, Barry, Kim, Fredline and Cuskelly2021). Other perspectives, for instance, ecological volunteering models, consider macro-contextual influences (Simon et al., Reference Simon, Sturmer and Steffens2000), further highlighting the need for an integrative approach.
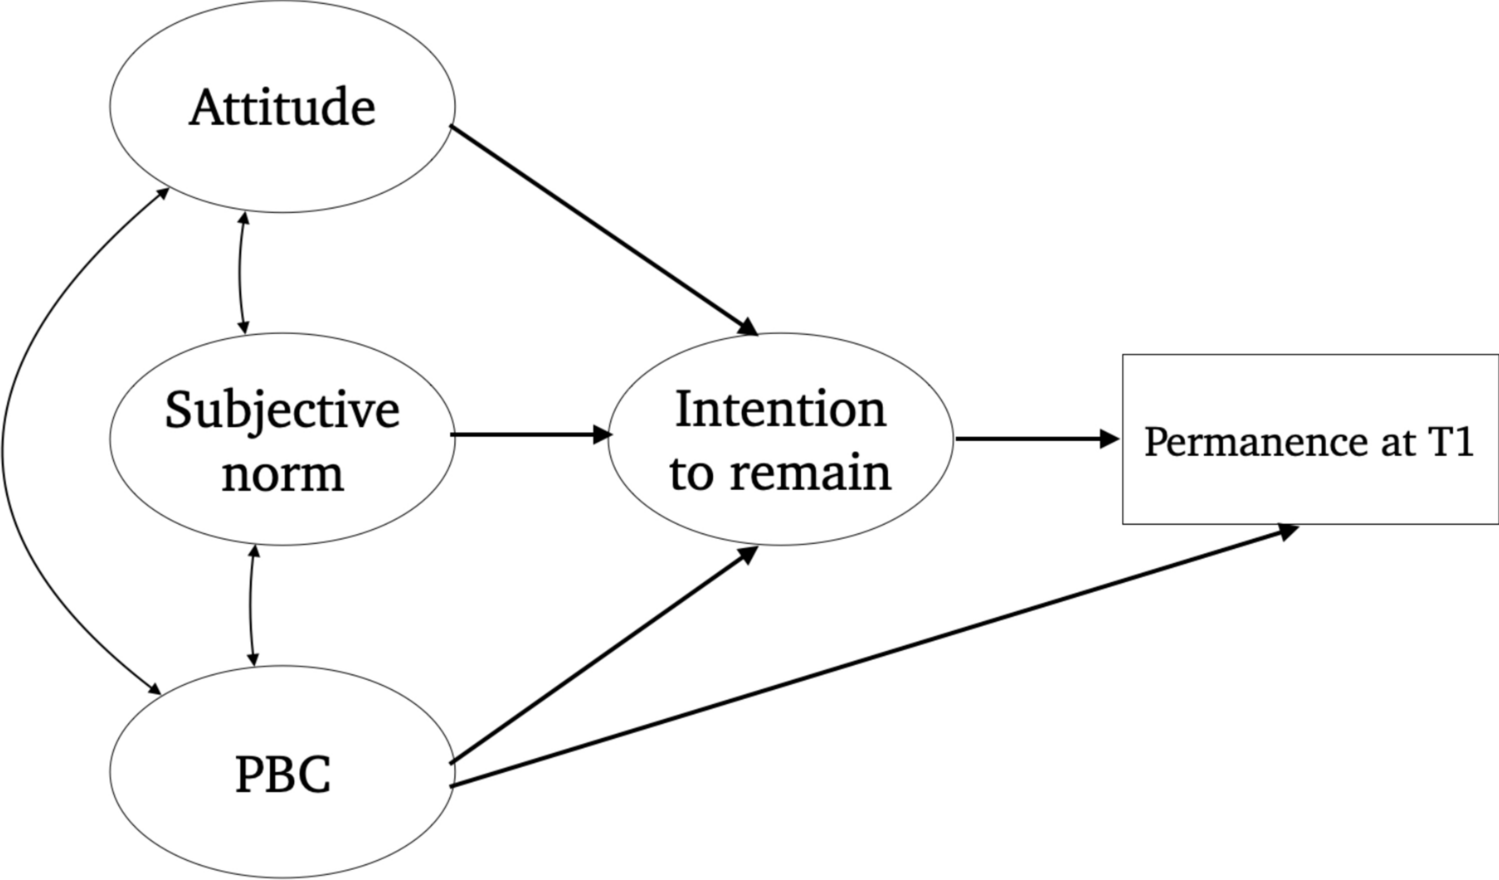
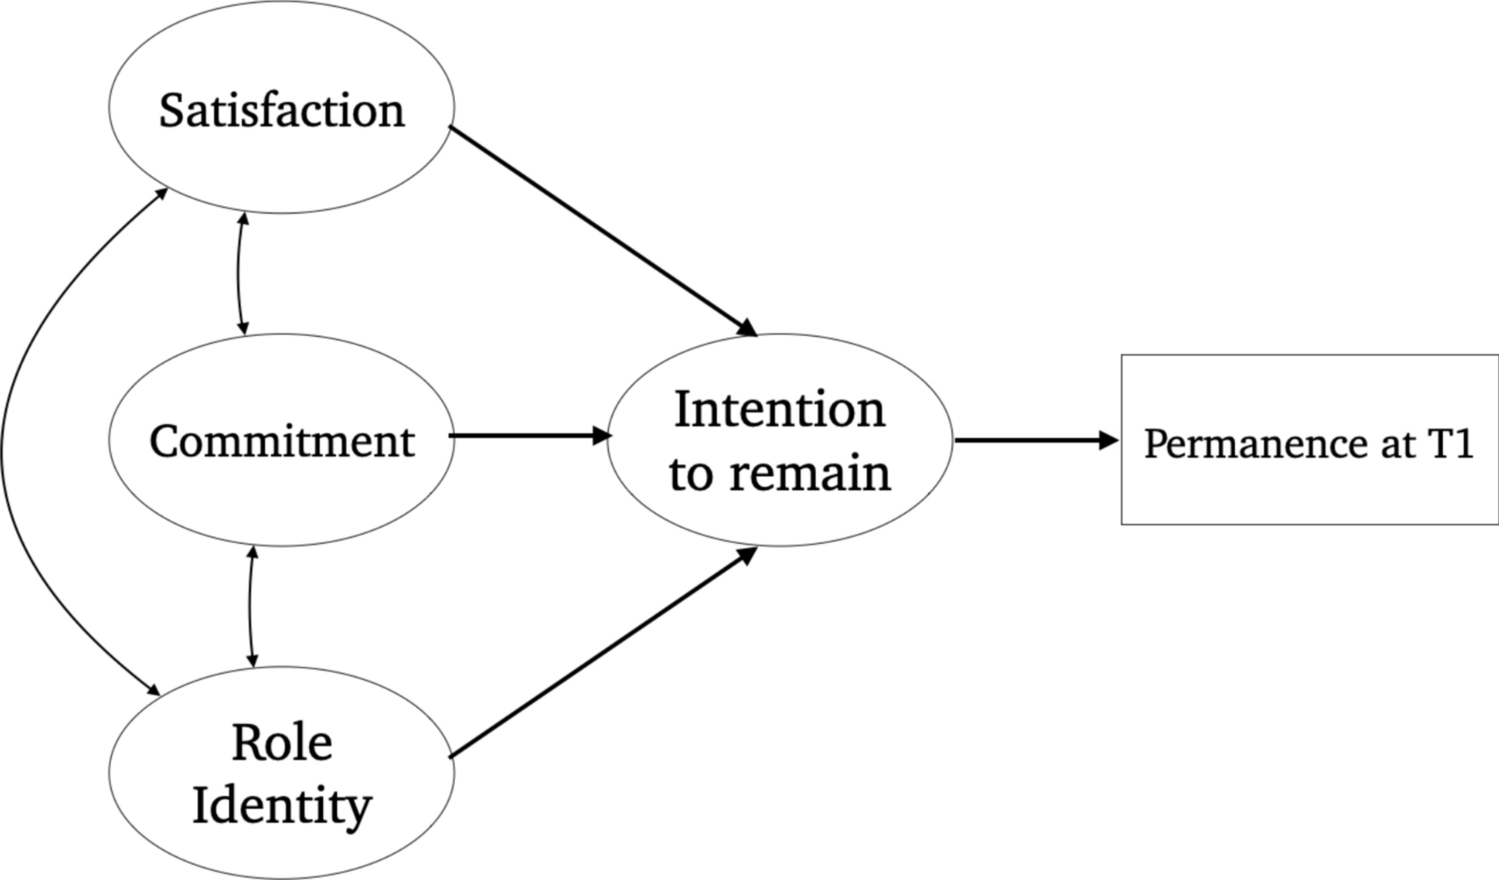
Despite these contributions, the Theory of Planned Behavior (TPB; Ajzen & Driver, Reference Ajzen and Driver1991, Fig. 1) has remained one of the most widely used frameworks in social psychology to study volunteerism (e.g., Okun & Sloane, Reference Okun and Sloane2002), even in combination or comparison with other popular frameworks like the Volunteer Functions Inventory (VFI) (Brayley et al., Reference Brayley, Obst, White, Lewis, Warburton and Spencer2015; Clary et al., Reference Clary, Snyder, Ridge, Copeland, Stukas, Haugen and Miene1998; Greenslade & White, Reference Greenslade and White2005). However, the TPB was not originally designed to explain long-term volunteer retention or the maintenance of volunteering behavior. Addressing these limitations, our research team developed the Three-Stage Model of Volunteers’ Duration of Service (3SMVSD; Chacón et al., Reference Chacón, Vecina and Dávila2007, Fig. 2) to provide a dynamic perspective on volunteer permanence. Unlike previous models, the 3SMVSD explicitly considers how the key psychological predictors of volunteer retention differ across three different phases of the volunteer cycle, filling a critical gap in the literature.
Theory of planned bhavior. Based on Ajzen and Driver (Reference Ajzen and Driver1991)

Three-stage model of Volunteer's duration of service. Based on Chacón et al. (Reference Chacón, Vecina and Dávila2007)

In this study, we examine and compare the fundaments and performance of two theoretical models in the prediction of volunteer permanence after 5 months of a Spanish sample of newcomers volunteers: the Theory of Planned Behavior and the Three-stage Model of Volunteer’s duration of Service.
Applying the Theory of Planned Behavior to Predict Volunteer Permanence
The TPB is a widely used theoretical framework in the study of planned behavior (Ajzen, Reference Ajzen2020; Wang et al., Reference Wang, Ma’rof, Abdullah, Hamsan, Zhang and We2022). TPB uses behavioral intention as the most proximal and better predictor of actual behavior. The TPB suggests that individuals' behavioral intentions are influenced by their attitudes, subjective norms, and perceived behavioral control (Ajzen, Reference Ajzen, Van Lange, Kruglanski and Higgins2012; Grano et al., Reference Grano, Lucidi, Zelli and Violani2008). In the context of volunteer retention, attitudes toward remaining in an organization are shaped by volunteers’ overall satisfaction with their experience, which in turn influences their behavioral intentions (Bang et al., Reference Bang, Smith, Park and Lee2022). Subjective norms refer to the perceived social pressure or expectations from others. Lastly, perceived behavioral control refers to individuals' beliefs concerning their ability to execute the behavior.
The TPB can be applied to diverse contexts and behaviors, making it a versatile framework for studying prosocial behavior. Numerous studies have found that TPB components are significant predictors of individuals' intentions to donate money, blood, or time (Hyde & Knowles, Reference Hyde and Knowles2013; Knowles et al., Reference Knowles, Hyde and White2012; Masser et al., Reference Masser, White, Hamilton and McKimmie2012). The TBP is also employed to predict volunteers' intentions to start helping, return, or remain volunteering (Wu et al., Reference Wu, Yu and Zhou2022), and has been successfully employed in different volunteer domains, such as healthcare, environmental conservation, leisure activities, or tourism (Hauser et al., Reference Hauser, Koontz and Bruskotter2012; Lee & Lina Kim, Reference Lee and Lina Kim2018; MacGillivray & Lynd-Stevenson, Reference MacGillivray and Lynd-Stevenson2013; Pierro et al., Reference Pierro, Mannetti and Livi2003; Wu et al., Reference Wu, Yu and Zhou2022;). Nonetheless, most investigations focus on the intention to volunteer for the first time or occasionally rather than the intention to remain volunteering (Russell et al., Reference Russell, Storti and Handy2022).
Some authors have questioned the sufficiency of the TPB to explain the volunteer process and tried to expand the model including other predictors of intention. For example, some studies have added motivations (Brayley et al., Reference Brayley, Obst, White, Lewis, Warburton and Spencer2015; Cho et al., Reference Cho, Bonn and Han2018), volunteer role identity (Marta et al., Reference Marta, Manzi, Pozzi and Vignoles2014), altruistic concern (Cahigas et al., Reference Cahigas, Prasetyo, Persada and Nadlifatin2023), or other variables related to the behavior itself (Huang et al., Reference Huang, Aguilar, Yang, Qin and Wen2021) to improve the performance of the model.
Despite the widespread use of the TPB to explain volunteer behavior and its empirical support, little is known about its ability to predict volunteer remaining (Lee et al., Reference Lee, Won and Bang2014). Among the scant examples, the study conducted by Marta et al. (Reference Marta, Manzi, Pozzi and Vignoles2014) examined long-term volunteer retention over three years, showing that attitudes, subjective norms, and past behavior influenced retention indirectly through role identity. However, their study did not address the determinants on short or medium-term permanence.
The usage of the TPB to predict volunteers' intention to remain volunteering may not fully comprehend the dynamic nature of volunteers' motives and reasons over time. While TPB focuses on attitudes, subjective norms, and perceived behavioral control as predictors of intention and behavior, it may not account for changes in these factors or the emergence of new reasons for sustaining a behavior (Sheeran et al., Reference Sheeran, Conner and Norman2001). The TPB has been valuable in understanding the initiation of behaviors; however, it has limitations explaining the decision to continue or stay in a behavior, such as volunteering. Furthermore, the TPB assumes that behavior change is a linear progression from intention to action, lacking mechanisms to address the subsequent actions that individuals must take to realize their intentions (More & Philips, Reference More and Phillips2022).
The Three-Stage Model of Volunteers’ Duration of Service
The 3SMVSD (Chacón et al., Reference Chacón, Vecina and Dávila2005) integrates elements from the Functional Model of volunteer motivations (Clary & Snyder, Reference Clary, Snyder and Clark1991), the Role Identity Model (Callero et al., Reference Callero, Howard and Piliavin1987), and theories of organizational commitment (Mowday et al., Reference Mowday, Steers and Porter1979), providing a dynamic theoretical framework that explains volunteer retention across different stages of service. As the TPB, the 3SMVSD assumes that the intention is the best predictor of actual behavior (Ajzen, Reference Ajzen, Kuhl and Beckmann1985; Ajzen & Fishbein, Reference Ajzen and Fishbein1980); however, it postulates that the variables influencing the intention to remain volunteering change over time. Thus, the 3SMVSD includes three stages: short-term permanence (6 months), medium-term permanence (12 months), and long-term permanence (24 months).
According to the 3SMVSD, during the initial stage of volunteering, it is necessary to maintain a balance between expectations and reality to ensure a positive experience and increase the likelihood of remaining committed (Omoto & Snyder, Reference Omoto and Snyder1995). In the first stage, satisfaction is the main predictor of intention to remain volunteering. When satisfaction is high, individuals are more likely to remain committed to the behavior (Claxton-Oldfield & Claxton-Oldfield, Reference Claxton-Oldfield and Claxton-Oldfield2012; Dailey, Reference Dailey1986; Gidron, Reference Gidron1983; Pierucci & Noel, Reference Pierucci and Noel1980). In addition, some investigations have identified satisfaction as the differentiating factor between those who drop out and those who remain engaged in the initial stages of volunteering (e.g., Vecina et al., Reference Vecina, Chacón and Sueiro2009). Focusing on this stage is particularly relevant, as early dropout is one of the most critical challenges faced by volunteer-based organizations (Hustinx & Handy, Reference Hustinx and Handy2009).
Commitment is a reliable indicator of a person's intention to continue working on a task and is the main predictor of intention to remain in a medium-term period. It refers to the motivation that drives a person to persevere even when they face difficulties or other options that could lead to giving up (Brickman et al., Reference Brickman, Dunkel-Schetter and Abbey1987). Commitment leads to a sense of identification with the organization, a desire to belong, acceptance of its goals, and an intention to put in the effort to support it, which can help offset a decrease in satisfaction levels (Wardel et al., Reference Wardell, Lishman and Whalley2000). Studies have shown that both affective and normative commitment can positively impact volunteering (Liao-Troth, Reference Liao-Troth2001; Stephens et al., Reference Stephens, Dawley and Stephens2004), with affective commitment being the most significant and linked to a lower dropout rate (Mathieu & Zajac, Reference Mathieu and Zajac1990; Meyer & Allen, Reference Meyer and Allen1997; Vecina et al., Reference Vecina, Chacón, Sueiro and Barrón2012). Studies have found that a minimum level of initial satisfaction is necessary to develop high levels of affective commitment (Bang et al., Reference Bang, Ross and Reio2013; Chordiya et al., Reference Chordiya, Sabharwal and Goodman2017).
The third stage of the 3SMVSD postulates that role identity is the main factor that predicts long-term permanence. Continuously performing actions in favor of an organization will eventually become a part of a person's self-concept (Callero, Reference Callero1994; Grube & Piliavin, Reference Grube and Piliavin2000; Marta et al., Reference Marta, Manzi, Pozzi and Vignoles2014; Stryker & Burke, Reference Stryker and Burke2000). In this regard, factors such as social norms or satisfaction become less significant predictors of permanence as time passes (Fuller, Reference Fuller2011; Penner, Reference Penner2002), while role identity gains more predictive strength (Theodorakis, Reference Theodorakis1994). Therefore, it seems that after repeatedly performing a behavior linked to a particular role, individuals start developing a new role identity, and these role identities serve as the basis for intention and behavior (Charng et al., Reference Charng, Piliavin and Callero1988; Grube & Piliavin, Reference Grube and Piliavin2000).
Several pieces of evidence support the validity of the 3SMVSD. According to Garner and Garner (Reference Garner and Garner2010), volunteer satisfaction is an important factor that influences volunteer retention in the early stage. Haski-Leventhal and Bargal (Reference Haski-Leventhal and Bargal2008) also found that commitment is essential to achieve higher levels of involvement. Additionally, as predicted by the 3SMVSD, volunteers who stay longer have a higher level of commitment and identity compared to those who leave within the first year (Vecina et al., Reference Vecina, Chacón and Sueiro2010). These "long-haul" volunteers also experience higher levels of emotional fatigue (Chacón et al., Reference Chacón, Vecina and Dávila2017; Clary et al., Reference Clary, Snyder, Ridge, Copeland, Stukas, Haugen and Miene1998; Davis et al., Reference Davis, Hall and Meyer2003), however, the higher levels of identity and commitment may act as protective factors, preventing volunteers from dropping out. Also, Vecina and Chacón (Reference Vecina and Chacón2017) found negative correlations between organizational commitment and role identity with volunteer dropout after seven years. Nevertheless, most of the evidence presented here comes from cross sectional research, so it is still necessary to conduct prospective and longitudinal studies to continue accumulating reliable evidence of the model's feasibility (e.g., Lavenburg & Bernt, Reference Lavenburg and Bernt2011).
While the 3SMVS theorizes predictors across three phases of volunteer permanence, the current study focuses exclusively on the model’s application in the short-term stage. This approach allows us to test its explanatory utility at the outset of volunteer engagement using a sample composed entirely of novice volunteers, thereby offering new insights into the early emergence of motivational and identity-related factors in volunteer retention.
Current Study
Literature reveals a vast number of concepts related to the intention to remain and the permanence of volunteers (e.g., Penner, Reference Penner2002; Purwanto & Rostiani, Reference Purwanto and Rostiani2022; Won et al., Reference Won, Chiu, Bang and Bravo2021). Nonetheless, the primary complexity is to place these concepts regarding their influence along the volunteering process. The objective of this study is to validate the utility of the Three-Stage Model of Volunteers’ Duration of Service (3SMVSD) in predicting volunteer permanence after 5 months and to compare its explanatory performance to that of the Theory of Planned Behavior (TPB). Firstly, considering the literature and nature of the volunteering process, we expect a better performance of the 3SMVSD explaining the intention and permanence of volunteers after 5 months of service. Secondly, given that we focus on short-term permanence, we expect satisfaction to be the primary predictor of both intention and permanence in the 3SMVSD at this early phase of volunteer engagement.
Methods
Sample and Procedure
A total of 271 Spanish volunteers from various fields, health and social care (56%), social assistance (29%), culture (3%), animal and environmental activism (2%), and other categories, completed the questionnaire. The sample was predominantly female (79% women, 18.5% men, and 2.5% non-binary or other). Regarding employment status, 29% were employed or actively seeking employment; the majority of the sample were university students or individuals in early career stages, consistent with the average age of 25.3 years (SD = 8.28). The study was restricted to novel volunteers, defined as individuals who had initiated stable voluntary activity (i.e., non-episodic) within the past 5 months, with a mean duration of 27 days (SD = 17.48) between the onset of volunteering and their participation in the study. Data collection took place across Spain between 2022 and November of 2023. Recruitment followed a snowball sampling approach, where organizations were contacted via email or at events and provided the survey link to their volunteers. Data collection was conducted in two phases, T0 and T1. On T0, participants completed a 20-min online questionnaire remotely after providing informed consent. On T1, 5 months later, they were contacted again via email and/or telephone to assess whether they remained active in their volunteer organization. The Complutense University of Madrid Ethical Committee approved the study.
Measures
Sociodemographic variables. We assessed the age, sex, type of volunteering, study level, work situation, marital status, and number of children of participants.
Attitude. According to Ajzen & Fishbein (Reference Ajzen and Fishbein1980) recommendations, we assessed Attitudes toward volunteering using a semantic differential scale of eight items on a 7-point scale. For example, from 1 (very pleasant) to 7 (very unpleasant). Omega coefficient: .816.
Subjective Norm. We employed a scale based on Marta et al. (Reference Marta, Manzi, Pozzi and Vignoles2014), which assessed the perception of family, friends, and partners approval of four items in a 4-point Likert scale (e.g., “My [family] thinks that volunteering is important for me”). Omega coefficient: .741.
Perceived behavioral control. We employed four items on a 7-point scale ranging from ''strongly disagree'' (1) to ''strongly agree'' (7). Two items correspond to a self-efficacy perspective (Ajzen & Driver, Reference Ajzen and Driver1991; Armitage & Conner, Reference Armitage and Conner1999; e.g., “I feel capable of being a volunteer”), and the other two items correspond to a control perspective (Randall & Gibson, Reference Randall and Gibson1991; e.g., ''The decision to continue as a volunteer next year is exclusively up to me”). Omega coefficient: .695.
Satisfaction. We employed the Volunteer Satisfaction Index (Vecina et al., Reference Vecina, Chacón and Sueiro2009), which assesses three subscales Likert-type from totally unsatisfied (1) to completely satisfied (7). Task satisfaction comprises four items (e.g., “The tasks I usually do have clear and well-defined objectives”). Satisfaction with motives entails six items (e.g., “The tasks I usually do as a volunteer let me establish social relationships with different people”). Lastly, satisfaction with the organization comprises six items (e.g., “I’m satisfied with the interest showed by the organization to take into account my preferences, abilities, and capacities to select the available volunteering positions”). Omega coefficient:.908.
Organizational Commitment. We employed the adapted version of the Meyer et al. (Reference Meyer, Allen and Smith1993) Commitment Scales by Ortega and Martín-Quirós (Reference Ortega and Martín-Quiros2003). The adapted version comprises 18 items equally distributed between an Affective Commitment Scale, a Continuity Commitment Scale, and a Normative Commitment Scale. Participants must respond on a Likert-type scale from (1) strongly disagree to (7) strongly agree (e.g., “Most days I am excited about my work as a volunteer”). Omega coefficient: 0.813.
Volunteer Role identity. We employed a set of items designed by Callero et al. (Reference Callero, Howard and Piliavin1987) and adapted to Spanish volunteers by Chacón et al. (Reference Chacón, Vecina and Dávila2005). The scale includes five Likert-type from totally disagree (1) to totally agree (10) (e.g., “Volunteering is an important part of who I am”). Omega coefficient: 0.702.
Intention to remain. We assessed participants’ short-term intention using the item “I intend to remain as a volunteer for the next 6 months,” rated on a 7-point scale (1 = no intention, 7 = maximum intention).”
Permanence at T1. To address short-term permanence, we asked participants if they remained at the organization 5 months after the beginning of the volunteer activity, as this timeframe aligned with previous research on short-term retention (Veludo-de-Oliveira et al., Reference Veludo-de-Oliveira, Pallister and Foxall2013) and ensured coherence with the 3SMVSD framework.
Data Analysis
We analyzed the data using R (v4.2.3; R Core Team, 2022) and JAMOVI (v2.4.8; The Jamovi Project, 2023). Missing values (2.5–8.3%) were handled via listwise deletion. No extreme outliers were found using z-scores ( >|2.65|). Scale reliability was assessed with McDonald’s omega (Reference McDonald1999).
We reported means and standard deviations, examined bivariate relationships via Pearson correlations, and tested path models using Maximum Likelihood (ML) and ULS estimators (Forero et al., Reference Forero, Maydeu-Olivares and Gallardo-Pujol2009) for robustness. In both models, intention to remain acted as mediator between predictors and permanence at T1. For 3SMVSD, predictors included satisfaction, organizational commitment, and volunteer role identity. For TPB, predictors were attitude, subjective norm, and perceived behavioral control. Model fit was assessed using χ2, R 2, TLI, CFI, RMSEA, and SRMR. Predictive effects were evaluated using standardized coefficients and Wald tests.
To ensure measurement validity, we conducted full CFAs using ULS due to its robustness with ordinal, non-normal data (Forero et al., Reference Forero, Maydeu-Olivares and Gallardo-Pujol2009). The initial TPB model showed poor fit (CFI = 0.886; TLI = 0.873; RMSEA = 0.110; SRMR = 0.109), largely due to issues with the subjective norm construct: a subdimension on romantic partners had high missing data, and one item lacked internal consistency. Both were removed, yielding good model fit (CFI = 0.955; TLI = 0.948; RMSEA = 0.071; SRMR = 0.076).
The 3SMVSD model had initially acceptable fit (CFI = 0.938; TLI = 0.935; RMSEA = 0.075; SRMR = 0.085), but two commitment items had very low loadings (β < 0.20), so they were removed. The revised model improved fit (CFI = 0.952; TLI = 0.949; RMSEA = 0.069; SRMR = 0.079). Full CFA results and loadings are provided in Supplementary Materials.
A sensitivity analysis confirmed stable results across original and refined models, supporting the robustness of the findings.
Results
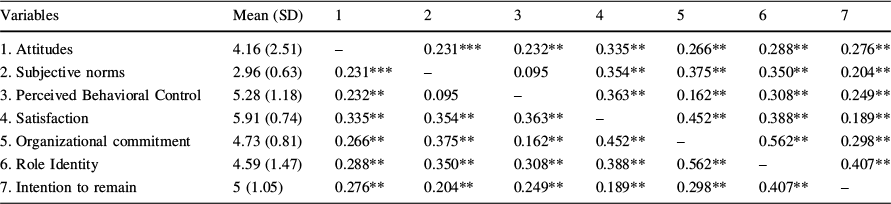
Descriptive statistics and bivariate Pearson correlations between all variables in the models are shown in Table 1.
Descriptive statistics and bivariate correlations

|
Variables |
Mean (SD) |
1 |
2 |
3 |
4 |
5 |
6 |
7 |
|---|---|---|---|---|---|---|---|---|
|
1. Attitudes |
4.16 (2.51) |
– |
0.231*** |
0.232** |
0.335** |
0.266** |
0.288** |
0.276** |
|
2. Subjective norms |
2.96 (0.63) |
0.231*** |
– |
0.095 |
0.354** |
0.375** |
0.350** |
0.204** |
|
3. Perceived Behavioral Control |
5.28 (1.18) |
0.232** |
0.095 |
– |
0.363** |
0.162** |
0.308** |
0.249** |
|
4. Satisfaction |
5.91 (0.74) |
0.335** |
0.354** |
0.363** |
– |
0.452** |
0.388** |
0.189** |
|
5. Organizational commitment |
4.73 (0.81) |
0.266** |
0.375** |
0.162** |
0.452** |
– |
0.562** |
0.298** |
|
6. Role Identity |
4.59 (1.47) |
0.288** |
0.350** |
0.308** |
0.388** |
0.562** |
– |
0.407** |
|
7. Intention to remain |
5 (1.05) |
0.276** |
0.204** |
0.249** |
0.189** |
0.298** |
0.407** |
– |
* p = 0.05; ** p = 0.01
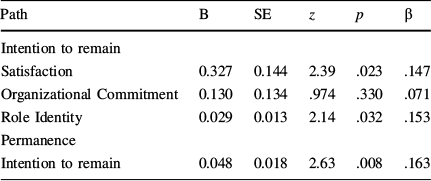
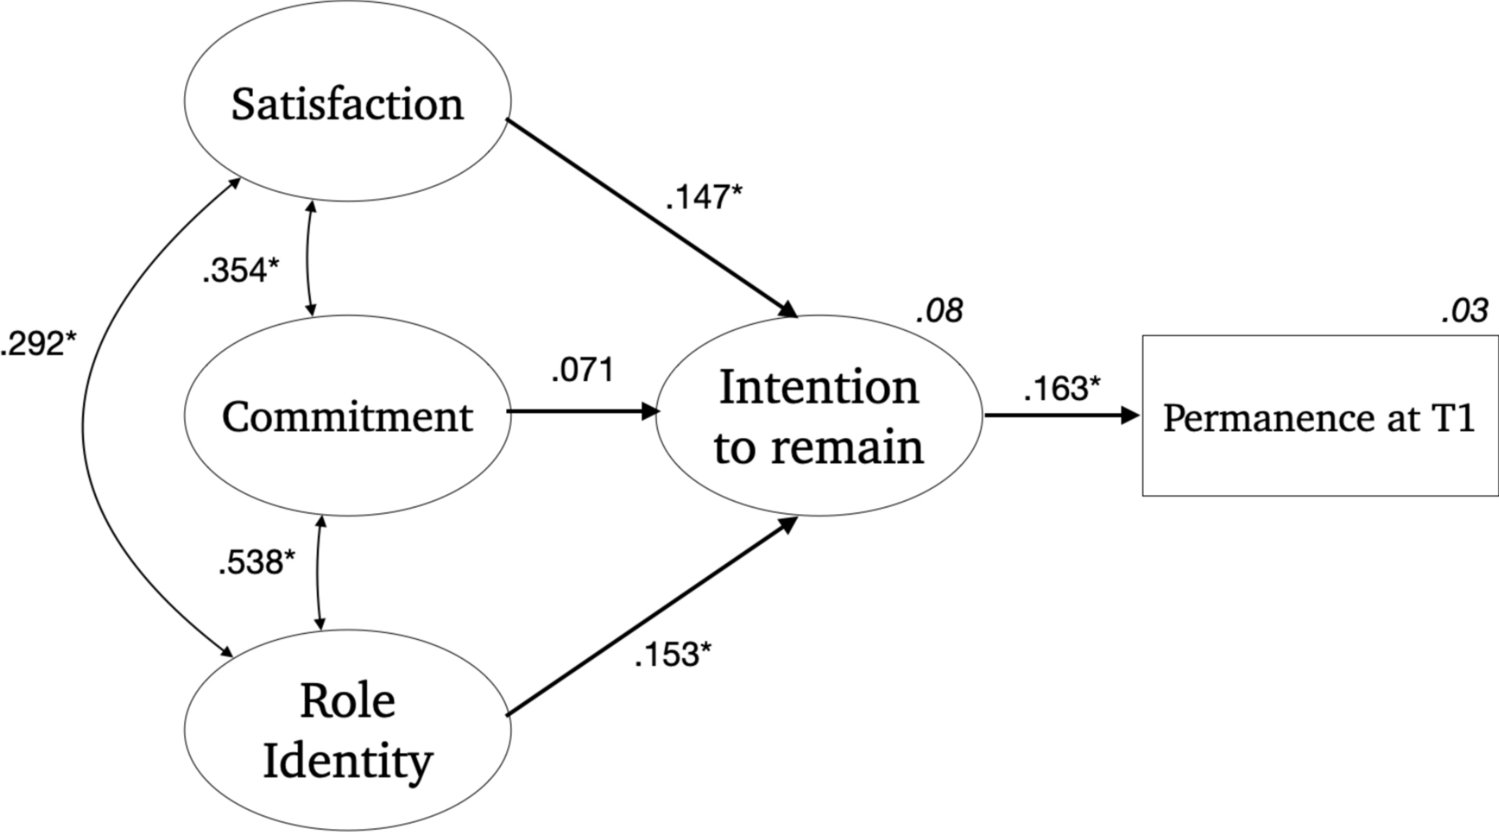
For the 3SMVDS the chi-square test indicated that the model fit the data well (χ2(3) = 1.25, p = 0.742), and global fit indices yielded satisfactory values (CFI = 1; TLI = 1; RMSEA = 0.001; SRMR = 0.013). Regarding model predictions (see Table 2 and Fig. 3), it was found a statistically significant direct effect of intention to remain on permanence at T1 (β = 0.16, p = 0.008, R 2 = 0.03). The greater the intention to remain, the stronger the correlation with increased permanence. It was also found a statistically significant direct effect of role identity (β = 0.15, p = 0.03) and satisfaction (β = 0.15, p = 0.02) on intention to remain. In this context, a higher level of role identity and greater satisfaction correspond to an increased intention to remain. There was no statistically significant effect of organizational commitment on intention to remain (β = 0.07, p = 0.330). These three predictors together yielded a R 2 of .08.
Path analysis—three-stage model of volunteer’s duration of service
|
Path |
B |
SE |
z |
p |
β |
|---|---|---|---|---|---|
|
Intention to remain |
|||||
|
Satisfaction |
0.327 |
0.144 |
2.39 |
.023 |
.147 |
|
Organizational Commitment |
0.130 |
0.134 |
.974 |
.330 |
.071 |
|
Role Identity |
0.029 |
0.013 |
2.14 |
.032 |
.153 |
|
Permanence |
|||||
|
Intention to remain |
0.048 |
0.018 |
2.63 |
.008 |
.163 |
B Unstandardized regression coefficient; SE Standard error of B; z Wald test value; p = Wald test p value; β Standardized regression coefficient
Path analysis diagram for the three-stage model of volunteer’s duration of service. Standardized regression coefficients, correlations, and percentage of explained variance are shown. * p = 0.05

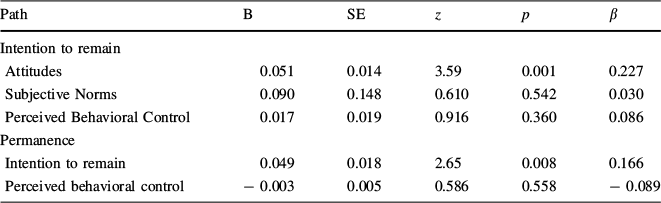
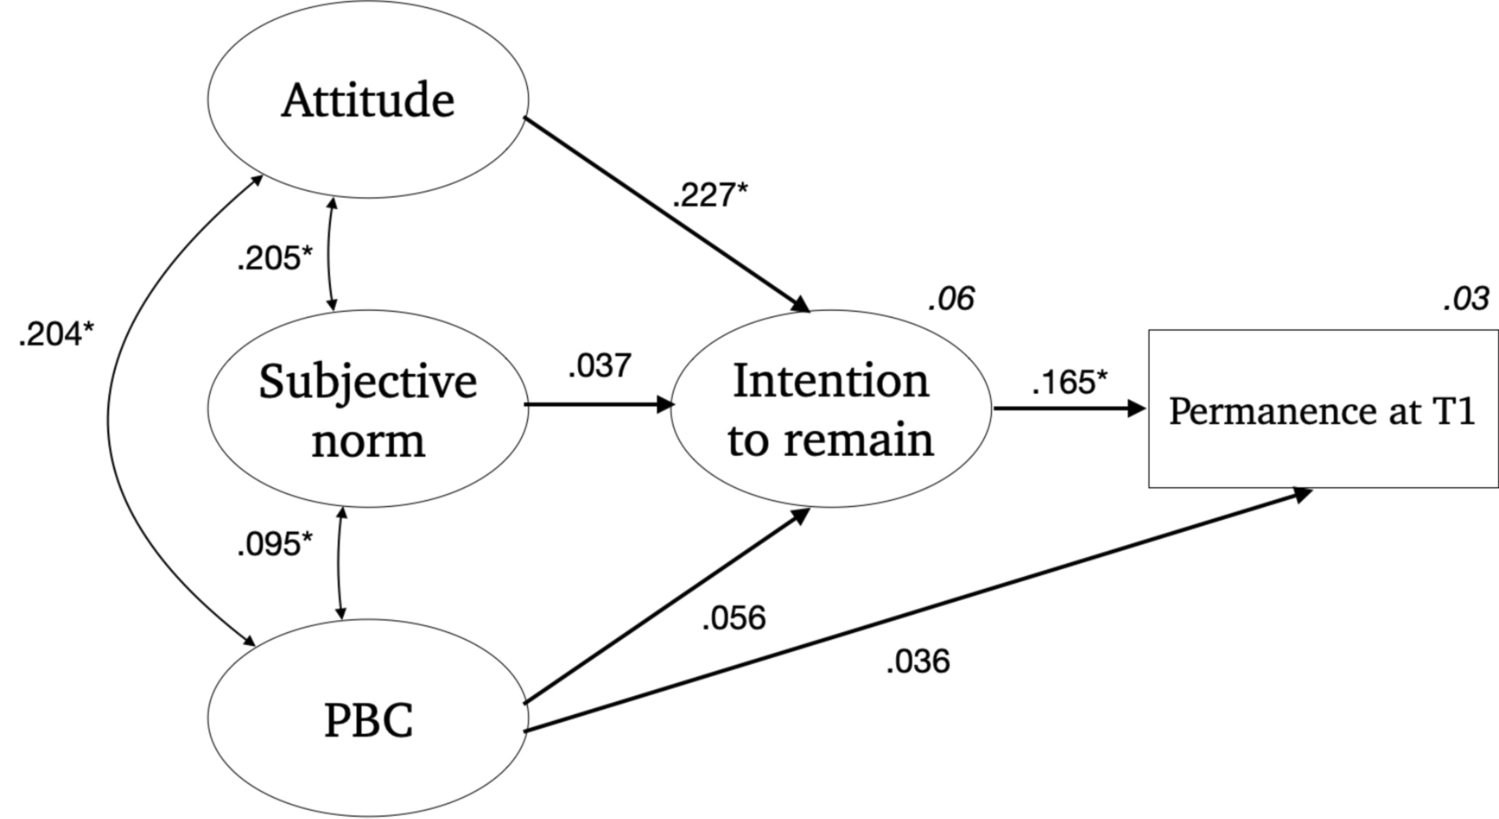
In the case of the TPB, the chi-square test indicated that the model fit the data well (χ2(2) = 4.22, p = 0.121), although not all global fit indices yielded satisfactory values (CFI = 0.896; TLI = 0.637; RMSEA = 0.066; SRMR = 0.030). In regards with model predictions (see Table 3 and Fig. 4), while intention to remain was found to predict permanence at T1 (β = 0.16, p = 0.008), perceived behavioral control did not (β = 0.04, p = 0.558). These two variables together achieved a R 2 value of .03. It was found an effect of attitude on intention to remain (β = 0.23, p < 0.001), so higher values of attitude were predictive of an increased intention to remain. There was no statistically significant effect of subjective norm (β = 0.43, p = 0.542) neither perceived behavioral control (β = 0.05, p = 0.360) on intention to remain. These three predictors together explained the 6% of the variability of intention to remain.
Path analysis—theory of planned behavior

|
Path |
B |
SE |
z |
p |
β |
|---|---|---|---|---|---|
|
Intention to remain |
|||||
|
Attitudes |
0.051 |
0.014 |
3.59 |
0.001 |
0.227 |
|
Subjective Norms |
0.090 |
0.148 |
0.610 |
0.542 |
0.030 |
|
Perceived Behavioral Control |
0.017 |
0.019 |
0.916 |
0.360 |
0.086 |
|
Permanence |
|||||
|
Intention to remain |
0.049 |
0.018 |
2.65 |
0.008 |
0.166 |
|
Perceived behavioral control |
− 0.003 |
0.005 |
0.586 |
0.558 |
− 0.089 |
B Unstandardized regression coefficient; SE standard error of B; z Wald test value; p = Wald test p value; β Standardized regression coefficient
Path Analysis diagram for the Theory of Planned Behavior. Standardized regression coefficients, correlations, and percentage of explained variance are shown. * p = 0.05

Discussion
Our primary objective was to validate the utility of the Three-Stage Model of Volunteers’ Duration of Service in predicting short-term volunteer permanence (5 months) and to compare its explanatory performance to that of the Theory of Planned Behavior. The results indicate that the 3SMVSD offers a more robust theoretical framework for explaining short-term volunteer retention, with a superior model fit compared to the TPB. Both models showed comparable the predictive accuracy, which remained modest.
Performance of the TPB Model
The TPB remains a widely employed framework for understanding prosocial behaviors, particularly in initiating voluntary activities. However, consistent with prior literature, our findings indicate that its predictive efficacy diminishes when applied to maintenance or behavior change (Meng et al., Reference Meng, Zhu, Chen, Zhou, Tao, Wang, Li, Zhang, Wang, Wu, Luo and Hu2024). The TPB posits that attitudes, subjective norms, and perceived behavioral control shape behavioral intention, which subsequently predicts actual behavior (Ajzen, Reference Ajzen2012). However, our results suggest that these constructs alone are insufficient to fully account for volunteer retention over time, reinforcing the argument for integrating additional variables in predictive models of sustained engagement (Theodorakis, Reference Theodorakis1994).
To enhance the TPB’s predictive validity in volunteer retention, prior research has emphasized the role of volunteer identity as an additional determinant (Finkelstein & Penner, Reference Finkelstein and Penner2004; Grube & Piliavin, Reference Grube and Piliavin2000). Longitudinal studies suggest that role identity strengthens over time as a predictor of sustained engagement (Pavey et al., Reference Pavey, Greitemeyer and Sparks2012; Winterich et al., Reference Winterich, Aquino, Mittal and Swartz2013), further supporting the limitations of TPB in capturing the evolving nature of volunteer retention.
Performance of the 3SMVSD Model
Our findings indicate that the 3SMVSD exhibits better model fit than the TPB in explaining intention to remain and actual permanence, yet predictive accuracy was very similar. As hypothesized, satisfaction emerged as a significant predictor of short-term retention. Prior studies confirm that volunteer satisfaction strongly influences intention to remain and retention (Claxton-Oldfield & Claxton-Oldfield, Reference Claxton-Oldfield and Claxton-Oldfield2012; Dailey, Reference Dailey1986; Pierucci & Noel, Reference Pierucci and Noel1980; Dwiggins-Beeler et al., Reference Dwiggins-Beeler, Spitzberg and Roesch2011), particularly in early engagement (Vecina et al., Reference Vecina, Chacón and Sueiro2009).
In contrast, commitment did not emerge as a significant predictor of volunteer permanence at 5 months, aligning with the 3SMVSD’s theoretical premise that commitment requires time to develop (Lachance et al., Reference Lachance, Bakhsh, Thompson and Parent2021). Literature suggests that commitment strengthens with prolonged engagement and depends on initial satisfaction (Bang et al., Reference Bang, Ross and Reio2013; Chordiya et al., Reference Chordiya, Sabharwal and Goodman2017). This supports the notion that commitment becomes increasingly relevant only after volunteers have accumulated experience and deeper organizational connections.
Volunteer Role Identity
Contrary to expectations, volunteer role identity emerged as a significant predictor of retention at 5 months, suggesting that identity formation may occur earlier than proposed in the 3SMVSD. The 3SMVSD assumes that role identity requires sustained engagement and social reinforcement to develop (Grube & Piliavin, Reference Grube and Piliavin2000; Marta et al., Reference Marta, Manzi, Pozzi and Vignoles2014). However, our findings indicate that volunteers may already identify with the volunteer role in the early stages of the volunteer activity.
Some hypotheses may account for this result. One possibility is that the volunteer role identity measure may inadvertently capture personal identity aspects rather than social identity dimensions, potentially skewing results toward self-identity rather than role identity by neglecting the social facets of identity (White et al., Reference White, Thomas, Johnston and Hyde2008) In this case, the measure may reflect an aspirational self-concept rather than an identity shaped by actual role performance.
Another explanation is that individuals may commence volunteerism with a preconfigured role identity (similar to pre-professional identity in Jackson, 2016; Woodall et al., Reference Woodall, Pich, Armannsdottir, Allison, Howarth and Poorrezaei2022). This concept aligns with theories positing that role identity is shaped not only by direct experience but also by internalized group expectations regarding the behaviors associated with a given role (Charng et al., Reference Charng, Piliavin and Callero1988; Van Dyne & Farmer, Reference Van Dyne and Farmer2004). Prior research highlights the role of pre-existing expectations in shaping volunteer commitment, further supporting the notion that role identity may emerge at earlier stages than previously thought (Omoto & Snyder, Reference Omoto and Snyder1995).
Limitations
While this study provides valuable insights into early stage volunteer retention, some limitations must be acknowledged. Firstly, the study counts with a relatively small sample size because of sample attrition. This attrition may occur as participants either cease their volunteer activities or discontinue their involvement in the study. While the attrition rate falls above what is usual in this type of study (Tambs et al., Reference Tambs, Rønning, Prescott, Kendler, Reichborn-Kjennerud, Torgersen and Harris2009) maintaining around 50% of the initial sample (271 out of 517 participants), this reduction significantly limits the dataset available for analysis, potentially influencing the results and their ecological validity.
Secondly, another limitation of this study is the relatively young age of the sample, with an average age of 25 years. This age distribution may influence the generalizability of our findings, as younger volunteers may have different motivations, commitments, and retention patterns compared to older volunteers (e.g., Ramadhia & Arfensia, Reference Ramadhia and Arfensia2023). Research suggests that younger volunteers often engage in volunteering activities due to personal growth, career development, or social connection, whereas older volunteers may be more driven by community engagement, social interaction, or a sense of duty (Chen et al., Reference Chen, Lan and Yan2023). Future studies should include a more age-diverse sample to determine whether the predictive capacity of these models holds across different life stages.
Also, while the study focused on first-time volunteers, individuals with previous occasional prosocial engagement might already possess a developed role identity, potentially explaining its early emergence. This possibility warrants careful monitoring in future studies. Additionally, it should be noted that path analysis does not account for measurement error, which may limit parameter precision. Although our complementary CFAs indicated good measurement properties, future research should consider full SEM to jointly model measurement and structural components.
Future Research Directions
Future research should explore the distinction between pre-existing volunteer role identity and experience-based volunteer role identity, as refining this differentiation could clarify how identity formation influences long-term engagement. Developing more precise measures would enhance understanding of the mechanisms through which role identity influences volunteer retention over time.
Additionally, extending longitudinal research beyond the initial stages is crucial to assessing the evolution of satisfaction, commitment, and identity. Studying these factors and other additional psychosocial factors over an extended period would improve the predictive accuracy of retention models and guide strategies to enhance long-term volunteer engagement.
Practical Implications
The findings of this study offer valuable insights for NGOs and volunteer management programs seeking to enhance retention strategies. By demonstrating that satisfaction is a key predictor of short-term permanence, the results emphasize the need to prioritize volunteer experiences in the initial months of service. Ensuring that volunteers feel valued and engaged from the beginning can significantly impact their decision to continue.
Moreover, the findings highlight the relevance of preconfigured role identity in early volunteer engagement. If role expectations can influence retention during the initial stages, organizations should strategically promote an appealing volunteer identity that individuals aspire to adopt. Emphasizing core values, expected behaviors, and key competencies associated with the volunteer role may encourage prospective volunteers to develop an early sense of identification with the position, thereby facilitating long-term engagement.
Ultimately, this study reinforces the necessity of tailoring retention strategies to different stages of volunteer engagement. While satisfaction plays a dominant role in the initial phases, commitment and fully developed role identity are expected to increase in importance over time. Understanding these dynamics enables organizations to implement evidence-based strategies that cultivate a stable and engaged volunteer workforce.
Conclusion
This study validates the efficacy of the 3SMVSD over the TPB in predicting short-term volunteer permanence, emphasizing the crucial role of satisfaction in early engagement. While role identity emerged earlier than expected, these findings advance our understanding of volunteer retention mechanisms and offer practical recommendations for volunteer organizations seeking to enhance engagement and retention strategies.
Funding
Open Access funding provided thanks to the CRUE-CSIC agreement with Springer Nature. This work was supported by the Spanish Science, Innovation and Universities Ministry under Grant PID 2019-1073564RB-100.
Declarations
Conflict of interest
No potential conflicts of interest are declared.
Human or Animal Participants
This study adheres to ethical standards for research involving human participants. No animals were involved in this research.
Informed Consent
Informed consent was obtained from all participants.


 Open access