


Introduction
Imaging from the atomic to the bulk scale to understand system dynamics and connectivity is a common need for nearly all science fields. For example, in biology, visualizing molecular-scale metabolic flow within individual cells as well as in the context of a whole plant is a grand challenge. This requires similar multiscale three-dimensional (3D) imaging approaches as those needed in materials science to link atomic-structure defects to crack propagation and component failure in jet engines or to understand mechanistic details of how chemical changes affect the nanoscale morphology of solid phases leading to reduced capacity of battery systems or activity and selectivity loss in catalysts. The ability to visualize the whole system intact with low resolution, such as with x-ray microcomputed tomography, and then sequentially zoom in with increasing spatial resolution and narrower field-of-view using x-ray nanotomographyReference McDermott, Le Gros and Larabell1 or electron tomography approaches,Reference Ercius, Alaidi, Rames and Ren2 promises new paradigms for interrogating not only static systems, but also systems perturbed or evolving over time.
Tomography using x-rays and electrons
The mathematical basis of tomography—3D imaging using two-dimensional (2D) projections acquired from different perspectives—has been known for almost 100 years.Reference Radon3,Reference Radon4 For tomography, a series of projections of the specimen, conventionally 50–150, are acquired by tilting the specimen relative to the probing beam or vice versa, while recording an image at each tilt step. Subsequently, these 2D images are aligned and reconstructed, or back-projected, to create the 3D volume, conventionally a 3D intensity map of a specific contrast mode. Technological limitations prevented immediate implementation and application from the 1920s to 1950s. The first groundbreaking experiments for tomography using x-rays occurred in the early 1960s,Reference Oldendorf5 while those using electrons occurred later in the same decade.Reference Derosier and Klug6–Reference Hoppe, Langer, Knesch and Poppe8 Since then, much progress and impact has been realized specifically for the analysis of complex 3D materials where conventional 2D imaging approaches may lead to erroneous interpretations of structure or function, as illustrated in Figure 1.
Illustration of how 2D projections can limit interpretation of spatial relationships. (a) A transmission electron microscope image of multiwalled carbon nanotubes taken up by a macrophage cell that appear clustered and aggregated when limited to only the 2D projection data; however, (b) upon 3D reconstruction and modeling of the tomogram, each multiwalled carbon nanotube (red) is found to be locally concentrated, but actually freely dispersed with minimal to no interaction between individual nanotubes for this sample condition. Note: Scale bars = 500 nm. Courtesy V. Vu.

While tomography has been historically dominated by biological applications because of the complexity of cells, its relevance and scope in the development of advanced materials has dramatically increased due to progress in materials science. In recent years, materials research across the disciplinary boundaries of biology, chemistry, and physics is increasing, which has pushed the development of this approach. For instance, expanding from the initial conventional bright-field transmission electron microscopy (TEM) tomography, almost all imaging modes used in materials science have now been combined with tomography (Figure 2). All TEM and scanning TEM (STEM)-based approaches give information on the 3D buildup of materials with nanometer-scale resolution, while x-ray-computed-tomography approaches typically range from the 10s to 1000s of nanometers resolution depending on the field of view and, most notably, have a large penetration depth to study bulk samples. Complementary techniques, such as focused ion beam–scanning electron microscopy (FIB–SEM) tomographyReference Cantoni and Holzer9,Reference Kotula, Rohrer and Marsh10 and atom probe tomography,Reference Amouyal and Schmitz11,Reference Kelly and Larson12 also yield nanoscale 3D information, and these techniques can provide additional levels of synergistic analysis for linking multiscale data on the same sample.
Overview of imaging modes tested for projection-based tomography classified into x-ray approaches, transmission electron microscopy (TEM) using a broad parallel beam, and scanning TEM using a focused/convergent electron probe.

The expansion of tomography-compatible imaging modes has enabled investigations of the widest possible range of materials with good contrast, ranging from molecular assemblies in their native solution environmentReference Al-Amoudi and Frangakis13,Reference Al-Amoudi, Norlen and Dubochet14 to high-atomic-number (nano)composites.Reference Ercius, Alaidi, Rames and Ren2,Reference Friedrich, de Jongh, Verkleij and de Jong15,Reference Midgley and Dunin-Borkowski16 In this context, the advent of computer-controlled optics, sample stages, and detectors are also noteworthy, as these have enabled automation of data acquisition, which can be quite time consuming, taking up to a few hours for the acquisition of one tilt series.
After data acquisition, the images in the tilt series are aligned with respect to a common origin and tilt axis often using high-contrast fiducial markers. Subsequently, a numerical algorithm reconstructs a 3D intensity map from the series of aligned 2D projections.Reference Kremer, Mastronarde and McIntosh17,Reference Mastronarde18 Depending on the imaging approach utilized when acquiring the data, interpretation of the 3D intensity map may be inverted (bright versus dark objects). However, for display or modeling, it is of interest to render interfaces between materials or the outline of cellular organelles.
The rendering of a 3D model usually involves volume segmentation, a process by which the 3D intensity map is partitioned into multiple segments (i.e., phases, components, compartments, materials). The benefit of the resulting simplified representation of the 3D intensity map is not limited to 3D rendering for visualizationReference Goddard, Huang and Ferrin19 and qualitative interpretation, but is now more commonly used to quantify the size, shape, and relative location of components. Segmentation can be performed by manual methods;Reference Midgley, Thomas, Laffont, Weyland, Raja, Johnson and Khimyak20–Reference Arslan, Walmsley, Rytter, Bergene and Midgley22 using automated operator-independent algorithms, for instance, based on intensity differences;Reference Friedrich, Guo, de Jongh, Pan, Bao and de Jong23–Reference Rigort, Gunther, Hegerl, Baum, Weber, Prohaska, Medalia, Baumeister and Hege25 or by using models of the structures to be analyzed.Reference Bohm, Frangakis, Hegerl, Nickell, Typke and Baumeister26–Reference Gommes, Friedrich, Wolters, de Jongh and de Jong28 The biggest advantage of quantification of 3D intensity maps is that complex structures can be broken down into a few sample-relevant descriptors that can be compared to bulk characterization techniques and used to determine if representative volumes are probed. A few examples of quantitative analysis of electron tomograms, illustrating the potential of the approach for a range of different materials, are shown in Figure 3.
Materials examples of quantitative electron tomography: (a) schematics showing a numerical x-z cross section (gray scale) with 3D rendered catalyst metal particles (different colored spheres) in a porous silica support (purple) overlaid. Maximized neighbor distances (as shown in graph) minimize deactivation during a reaction;Reference Prieto, Zecevic, Friedrich, de Jong and de Jongh58 (b) two stages of calcium phosphate nucleation and growth (spherical and polymeric [pol.] assemblies) where the fractal dimension (D f) of the assembly gives insight into the reaction path;Reference Habraken, Tao, Brylka, Friedrich, Bertinetti, Schenk, Verch, Dmitrovic, Bomans, Frederik, Laven, van der Schoot, Aichmayer, de With, DeYoreo and Sommerdijk59 (c) self-organized binary nanoparticle superlattice where knowledge and control of the relative location of components is key to understanding the emerging materials properties.Reference Friedrich, Gommes, Overgaag, Meeldijk, Evers, de Nijs, Boneschanscher, de Jongh, Verkleij, de Jong, van Blaaderen and Vanmaekelbergh27

The examples indicate that a large range of materials can be investigated and quantified by tomography, however, the imaging conditions may differ significantly. It is probably fair to say that the damage introduced by the incident beam constitutes a physical limit to 3D imaging, including the achievable resolution. Resolution estimates based on angular sampling alone, such as formulated in the Crowther criterion (the achievable resolution can be estimated based on the diameter of the reconstructed volume, π, and the number of projections in the tilt series),Reference Crowther, Derosier and Klug29 give a rule of thumb to calculate which feature details should be visible, but do not fully incorporate the effect of dose. Moreover, for tomography, both the alignment accuracy and applied reconstruction algorithm (of which quite a few exist) play an important role in the quality and interpretability of the final 3D intensity map. Hence, combined approaches to estimate resolution, taking angular sampling, dose limit, and reconstruction algorithm into account, need to be developed.Reference Chen, Goris, Bleichrodt, Mezerji, Bals, Batenburg, de With and Friedrich30,Reference Chen, Friedrich and de With31
Conversely, one could argue that based on the limited dose, one should find the best angular sampling scheme and reconstruction approach to increase resolution or, in more general terms, increase the information content of the 3D intensity map. It becomes clear that tomography, while a rather involved and time-consuming technique, has high relevance and application potential for 3D nano-/micro-/meso-/macrostructured materials to arrive at unambiguous structure–function relations. In this context, we expect it to become a required analysis method for complex and multiscale structures. For more details on specific applications of tomography, we refer the interested reader to detailed reviews.Reference Ercius, Alaidi, Rames and Ren2,Reference Friedrich, de Jongh, Verkleij and de Jong15,Reference Midgley and Dunin-Borkowski16 In this issue of MRS Bulletin, we focus on recent developments in tomography that enable new science in multidimensional materials research.
In this issue
The use of analytical imaging modes based on electron energy-loss spectroscopy (EELS), energy dispersive x-ray (EDX) spectroscopy, electron diffraction, and electron holographic tomography, in addition to classical imaging techniques, is opening another dimension for the analysis of complex materials. These provide not only 3D intensity information to discriminate between components, but also direct information on physical and chemical differences. For example, electron holographic tomography can be applied to quantitatively map the electrostatic potential distribution in semiconductors in 3D.Reference Twitchett-Harrison, Yates, Newcomb, Dunin-Borkowski and Midgley32,Reference Wolf, Lubk, Lichte and Friedrich33 Furthermore, researchers are starting to use the combination of tomography with low-loss EELS information to map the electronic structure of materials in 3D for plasmonic applications. The article by Leary and Midgley on analytical electron tomography in this issue provides insight into the electronic, chemical, and optical properties of materials at the nanoscale.
Electron tomography visualizes 3D structures with nanometer resolution, as previously described. A few early examples of sub-nm resolution imaging of crystalline lattice planes in molybdenum disulfideReference de Jong, van den Oetelaar, Vogt, Eijsbouts, Koster, Friedrich and de Jongh34 and graphitic carbonReference Leschner, Biskupek, Chuvilin and Kaiser35 have been reported. Nevertheless, pushing electron tomography toward true atomic resolution has been a long-standing goal in materials science. The first experiments were performed on perfectly regular 3D lattices using discrete tomographyReference Batenburg36 in combination with quantitative high-angle annular dark-field–STEM imaging. Recently, a more general approach for 3D atomic imaging of irregular crystalline structures based on a limited/small number of high-resolution images has been developed. Bals et al. further explore this topic in their article, and illustrate its potential for innovative studies of interfaces, defects, and lattice deviations with atomic resolution in 3D.
The importance of advanced data acquisition and reconstruction approaches in tomography for obtaining high-fidelity reconstructions cannot be underestimated. The article by Dahmen et al. highlights different sampling approaches based on images with both large and small depths of field, including their reconstruction. Notably, the authors provide an outlook on the combination of tomography techniques with dynamic sampling, such that the electron dose is applied only where needed. This has implications for studies on both beam-sensitive and beam-insensitive samples, such as biological materials, polymers and composites, zeolites, and ceramic or metallic materials. In particular, as achievable resolution is inversely related to the exposed dose, new schemes for tilt series sampling could have a significant impact toward providing alternative sampling schemes to enhance biological subtomogram averaging of equivalent and repeated components found within a reconstructed volume. This emerging tomogram analysis technique has already generated much interest due to its ability to solve structures of nonreproducible or nonisolatable substructuresReference Bharat, Russo, Lowe, Passmore and Scheres37–Reference Schur, Hagen, de Marco and Briggs40 that are a limitation for other cryo-EM approaches, such as single-particle reconstruction.
Cryogenic transmission electron tomography heralded a new frontier, especially for molecular biology, by allowing 3D tomographic imaging of cells simply frozen in near-native buffer conditions—thereby mimicking how they exist in nature. Yet, nearly all electron tomograms over the previous five decades used bright-field TEM tomography approaches and incorporated heavy-metal stains or highly defocused imaging conditions to generate the necessary contrast to visualize the cells or biological samples of interest.Reference Gan and Jensen41 In recent years, more conventional materials science techniques, such as EELS and STEM, have begun to infiltrate into the biological realm largely due to the promising ability to link structure and chemistry to function.Reference Aronova, Sousa and Leapman42 In particular, the development of cryogenic scanning transmission electron tomography with dynamic focusing has created an alternative approach for visualizing whole biological cells. This is discussed in detail in the article by Elbaum et al., along with a discussion on additional benefits (such as finer control over electron doses, tighter depth of focus, and Z-contrast imaging) and future directions for biological and soft material imaging. We should add that cryo-electron tomography in TEM or STEM mode is also highly relevant for materials scientists working on solution-based synthesis and assembly of materials.Reference Friedrich, Frederik, de With and Sommerdijk43,Reference Eggenhuisen, Friedrich, Nudelman, Zecevic, Sommerdijk, de Jongh and de Jong44 An example (nucleation and growth of mineral phases that can be addressed by this technique) is shown in Figure 3b. We should also emphasize that cryogenic tomography is not limited to aqueous solutions or suspensions, which further broadens the application potential of the technique (i.e., for investigating the 3D morphology of macromolecular crystals in organic solvents).Reference Wirix, Bomans, Friedrich, Sommerdijk and de With45
Imaging from the atomic to the bulk scale to understand system dynamics and connectivity is a common need for nearly all science fields. Tomography methods are the enabling technology for such hierarchical visualization approaches, and electron and x-ray tomography have experienced significant breakthroughs in recent years. Future impact will arise from the fusion of both electron and x-ray tomography with correlated optical imaging methods to yield multimodal and multiscale data sets from the same sample.Reference Carlson, Gelb, Palshin and Evans46–Reference Sartori, Gatz, Beck, Rigort, Baumeister and Plitzko50 In particular, sequentially zooming in to see correlative structural details from coarse resolution for bulk materials to atomic resolution with site-selected and thinned liftout regions of the same sample would help to link structure with function across the mesoscale. Recently, leading work has been published integrating x-ray computed tomography, serial section FIB–SEM tomography, electron backscatter diffraction, and TEM elemental analysis on the same sample.Reference Burnett, McDonald, Gholinia, Geurts, Janus, Slater, Haigh, Ornek, Almuaili, Engelberg, Thompson and Withers51 Such correlative multiscale tomography approaches can be extended to many fields and research problems. The article by Bradley and Withers describes the applications of this method toward structural biomaterials.
Future directions
While materials properties are defined by atomic arrangements and multiscale morphology, interactions with the environment often occur via somewhat longer range magnetic or electric fields and chemical gradients that surround the material. To map these fields, electron holographic tomography is useful.Reference Lai, Hirayama, Fukuhara, Ishizuka, Tanji and Tonomura52,Reference Wolf, Lubk, Röder and Lichte53 Unfortunately, data acquisition and processing are involved, such that implementation as a standard-imaging mode will require some time. Despite its current experimental drawbacks, the technique could contribute significantly to materials research dealing with bottom-up assembly of nanostructures using electrostatic or magnetic interactions.
From another perspective, in order to study assembly dynamics, imaging in liquids is potentially more important, as interactions can be inferred from the evolution of transient structures. We guide the reader to the January 2015 issue of MRS Bulletin on “Frontiers of in situ electron microscopy.”Reference Zheng, Meng and Zhu54 By combining tomography with liquid-cell TEM experiments, the 3D structure can be obtained from images of individual nanoparticles rotating freely in solution (i.e., synthesized in solution).Reference Park, Elmlund, Ercius, Yuk, Limmer, Chen, Kim, Han, Weitz, Zettl and Alivisatos55 Such approaches are exciting to consider, but may be difficult to apply broadly due to beam sensitivity or charging effects during data collection that may either degrade or blur image quality or interpretability.
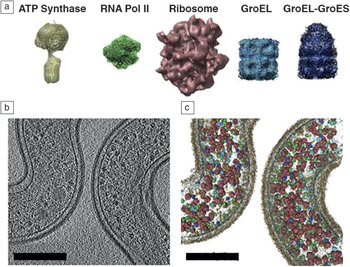
Beyond the vision of in situ tomography, one of the long-held dreams of biology has been to place atomic and molecular details of proteins and small molecules within a whole cell or tissue context. Visual proteomicsReference Beck, Malmstrom, Lange, Schmidt, Deutsch and Aebersold56,Reference Nickell, Kofler, Leis and Baumeister57 is an emerging field of study that attempts to accomplish this goal by using advanced tomography approaches to reconstruct entire cellular environments and use subtomogram averaging and feature identification to localize and quantify proteins with known structures (Figure 4). Since biological cells are highly complex environments containing thousands to tens of thousands of individual proteins and macromolecular complexes of various shapes, sizes, and relative quantity, the visual proteomics approach is highly computationally intensive. This requires new algorithms and high-performance computing to be married to advanced structural biology and tomography methods to make it a widely adopted approach. Once visual proteomics are fully realized for a single cell, the next logical question will be how that cell fits into the larger tissue context or biological community. Visual proteomics will thus need to fuse with correlative tomography approaches, as discussed by Bradley and Withers in their article. This will not only further complicate the amount of data collected, processed, modeled, and archived, but also increase the types of algorithm functionality and automation needed. Ultimately, it would be ideal to have the ability to perform time-resolved visual proteomics experiments to understand how the number of proteins and their localization within the cell change due to environmental perturbations and other stresses. While such work may not be realized for some time, much of the foundation has been or is currently being developed.
Example of the visual proteomics methodology. Macromolecular protein complexes of known structure (a) are used for computational 3D template matching within a solved 3D electron tomogram (b) to create a detailed map/model of (c) protein localization and quantification within the biological whole-cell context. Visualizing the spatial organization of the proteome in this way is important for understanding protein/enzyme interactions at the molecular level that may not be detectible by conventional approaches.Reference Beck, Malmstrom, Lange, Schmidt, Deutsch and Aebersold56 Note: relative abundance and localization of ATP Synthase, RNA Polymerase II (RNA Pol II), Ribosome, GroEL, and GroEL-GroES protein complexes. Scale bars = 200 nm.
Conclusions
Three-dimensional visualization is key for fundamental understanding of complex systems ranging from the atomic to the bulk scale. A number of important developments are currently ongoing that extend the existing capabilities significantly and are fostering all-new science. We see a bright future for tomographic methods to provide key insights into material architectures, synthesis, and functionality across the boundaries of biology, chemistry, and physics that impact bioenergy, environmental, health, structural materials, and energy-storage applications.
Acknowledgment
J.E.E. acknowledges support from the Department of Energy’s Office of Biological and Environmental Research Mesoscale to Molecules Project #66382.


