


1. Introduction
Psychometric tests, designed to measure a person’s personality or other latent aspects that cannot be directly observed, are an established standard in many firms’ hiring procedures. Psychometric tests are used on approximately 60%–70% of U.S. job-seekers (Weber and Dwoskin, Reference Weber and Dwoskin2014), and 75% of international firms either use or plan to use them in the future (Kantrowitz et al., Reference Kantrowitz, Tuzinski and Raines2018). However, strategic misrepresentation in these tests has been a long-standing concern both in industry and in academia (Morgeson et al., Reference Morgeson, Campion, Dipboye, Hollenbeck, Murphy and Schmitt2007; Tett and Simonet, Reference Tett and Simonet2021; Viswesvaran and Ones, Reference Viswesvaran and Ones1999). It has also been suggested that psychometric testing is unfair or discriminatory against minorities or those with disabilities (Hawkins and Monroe, Reference Hawkins and Monroe2021; McGee and McGee, Reference McGee and McGee2025; Weber and Dwoskin, Reference Weber and Dwoskin2014).
In this article, I design a laboratory experiment to evaluate under what conditions personality testing may be effective. I design the lab experiment to be analogous to ‘hiring’ using personality testing, and the subsequent ‘work effort’, at least in so far as a lab experiment permits. The experiment consists of 2 main parts, a personality test followed by a cooperation task. For the personality test, I elicit the ‘Big Five’ personality traits, and for the cooperation task, I use a repeated public goods game (PGG). In the PGG, participants can make socially-optimal contributions to a public good, but face a personal incentive to free-ride and contribute less (for the exact implementation, see Section 3.2.2). I interpret contributions to the public good as ‘work effort’, which is something an employer would like to encourage. I focus on the Big Five personality trait of ‘Agreeableness’, the tendency to act in a cooperative, unselfish manner, as some research finds it is positively associated with contributions in the PGG and other similar social dilemmas. I sort participants into groups for the PGG based on their Agreeableness score, to mimic the role of an employer hiring based on personality tests in an attempt to maximize their firm’s success.
The use of Agreeableness was motivated in the pre-registration by its relationship with behavior in the PGG citing the following papers: (Kagel and McGee, Reference Kagel and McGee2014; Perugini et al., Reference Perugini, Tan and Zizzo2010; Thielmann et al., Reference Thielmann, Spadaro and Balliet2020; Volk et al., Reference Volk, Thöni and Ruigrok2012). I caveat this motivation using the meta-analysis of Thielmann et al. (Reference Thielmann, Spadaro and Balliet2020) rather than the individual studies. While this meta-analysis reports Agreeableness is associated with prosocial behavior both over all games and all PGGs they consider, they find no evidence of a relationship in social dilemmas with repeated interaction, that is, of the type used in this study.Footnote 1 I used a repeated PGG to be analogous to a cooperative teamwork environment, which is rarely one-shot or without feedback. While the following was not pre-registered, using Agreeableness is realistic as it has been recommended for team selection (Morgeson et al., Reference Morgeson, Reider and Campion2005), is a strong predictor of team field performance (Bell, Reference Bell2007), and two of the key themes of its impact are teamwork and work investment (Wilmot and Ones, Reference Wilmot and Ones2022).Footnote 2
The key treatment dimension in the experiment is the timing of information about the purpose of the initial personality questionnaire, that is, the group formation rule for the PGG. There are 3 treatments on the time dimension, Before the personality test, After the personality test (but before the PGG), and Never. In the Before treatment, participants have an incentive to misrepresent their personality to try and get into a more cooperative group. Whereas in the Never treatment, participants are never informed about how groups are formed, and therefore have no material incentive to misrepresent their personality. Finally, in the After treatment, participants also have no material incentive to misrepresent their personality as the group formation rule is only revealed directly after the personality test. Strategic misrepresentation could reduce the effectiveness of the group formation rule in increasing contributions in the PGG due to the compression of Agreeableness scores and potential mistrust. Whereas, knowledge of the rule could increase its effectiveness by reducing uncertainty about group members’ cooperativeness, suggesting After $>$
Never
$>$
Never $>$
Before in terms of effectiveness. The second treatment dimension is the group formation rule itself. Groups are typically randomly assigned in economics experiments, which makes a Random treatment (henceforth RAND) a natural baseline for the Agreeableness group formation rule (henceforth AGRE). The experiment is a 3
$>$
Before in terms of effectiveness. The second treatment dimension is the group formation rule itself. Groups are typically randomly assigned in economics experiments, which makes a Random treatment (henceforth RAND) a natural baseline for the Agreeableness group formation rule (henceforth AGRE). The experiment is a 3 $\times $
2 design, so participants in the RAND treatment also have the group formation rule revealed to them either Before or After the personality test, or Never, meaning they are clean comparisons for their respective AGRE treatment.
$\times $
2 design, so participants in the RAND treatment also have the group formation rule revealed to them either Before or After the personality test, or Never, meaning they are clean comparisons for their respective AGRE treatment.
1.1. Related literature
One relevant area of research in the PGG has centered on mechanisms or interventions aimed at increasing contributions in the PGG. Examples include allowing for punishment (Fehr and Gächter, Reference Fehr and Gächter2000), endogenous group formation (Ahn et al., Reference Ahn, Isaac and Salmon2009; Charness and Yang, Reference Charness and Yang2014), inducing a group identity with a team-building task (Charness et al., Reference Charness, Cobo-Reyes and Jiménez2014), or priming with words related to cooperation (Drouvelis et al., Reference Drouvelis, Metcalfe and Powdthavee2015). Another strand of PGG research sorts groups based on previous contribution behavior, and found that this type of sorting is effective (Burlando and Guala, Reference Burlando and Guala2005; Gächter and Thöni, Reference Gächter and Thöni2005; Gunnthorsdottir et al., Reference Gunnthorsdottir, Houser and McCabe2007; Ones and Putterman, Reference Ones and Putterman2007). I contribute by studying an intervention that sorts using a personality test. I vary the timing of information about the sorting rule, whereas previous studies on sorting hold this constant, and typically do not reveal it.
Another relevant strand of literature considers how individual characteristics are related to behavior in social dilemma games like the PGG. Of particular interest are studies that elicit the Big Five personality trait of Agreeableness. In terms of individual studies in economics, Volk et al. (Reference Volk, Thöni and Ruigrok2012) and Perugini et al. (Reference Perugini, Tan and Zizzo2010) find Agreeableness to be correlated with contribution behavior in the one-shot and repeated PGG, respectively. Whereas in the related repeated Prisoner’s Dilemma, Kagel and McGee (Reference Kagel and McGee2014) find a positive correlation of Agreeableness with cooperation, while Proto et al. (Reference Proto, Rustichini and Sofianos2019) observe this only in early periods. Additionally, Gill and Rosokha (Reference Gill and Rosokha2024) find that the trust facet of Agreeableness is related to cooperation through learning. In terms of comparable studies in psychology (i.e., incentivized with no deception), Corr et al. (Reference Corr, Hargreaves Heap, Seger and Tsutsui2015) find a positive relationship between Agreeableness and cooperation in a one-shot PGG, while Glöckner and Hilbig (Reference Glöckner and Hilbig2012) find no relationship in a one-shot Prisoner’s Dilemma. A meta-analysis over all fields finds a positive relationship between Agreeableness and prosocial actions in one-shot social dilemma games, but not when they are repeated (Thielmann et al., Reference Thielmann, Spadaro and Balliet2020).
This article also contributes to the literature on faking personality tests in general, and the implications for using them in job-hiring. These studies can be grouped into 2 categories: ‘fake-good’ (or bad) studies, where participants are explicitly instructed to misrepresent themselves, and ‘applicant-incumbent’ studies, where job-seekers’ responses are compared to those already in a similar job. In fake-good studies, meta-analyses by Viswesvaran and Ones (Reference Viswesvaran and Ones1999) and Walker et al. (Reference Walker, Double, Birney and MacCann2022) suggest that people can misrepresent their personality in Big Five and Dark Triad personality tests, respectively. On applicant-incumbent studies, meta-analyses suggest job-seekers do misrepresent themselves on Big Five personality tests (Birkeland et al., Reference Birkeland, Manson, Kisamore, Brannick and Smith2006; Hu and Connelly, Reference Hu and Connelly2021). I contribute to this literature by: indirectly incentivizing misrepresentation through PGG group type, considering whether suspected misrepresentation contaminates subsequent work cooperation, and exploring the counterfactual where job-hiring is through a personality test but misrepresentation is ruled out (AGRE After).
The closest related paper is by McGee and McGee (Reference McGee and McGee2024). In their experiment, participants’ Big Five traits were measured in a baseline session, then again a week later. Before the second test, participants were offered an extra payment if ‘hired’ for a hypothetical job based partly on the second Big Five test, using a description that implied a specific trait was ideal. They find that participants misrepresent their personality in the presence of incentives. My approach is complementary but distinct, as I consider how misrepresentation could impact subsequent behavior, and test misrepresentation in a between-participant design as is common in the dishonesty literature (Fischbacher and Föllmi-Heusi, Reference Fischbacher and Föllmi-Heusi2013).
Two other relevant papers are by Drouvelis and Georgantzis (Reference Drouvelis and Georgantzis2019) and Cartwright et al. (Reference Cartwright, Chai and Xue2023). Drouvelis and Georgantzis (Reference Drouvelis and Georgantzis2019) have participants complete a Big Five personality test and then play a Dictator Game and a two-player one-shot PGG. They pair participants by their Agreeableness (High, Low, or Mixed), and tell this to the pair, except in a baseline no info treatment. They find contributions are higher when participants are told their pair is High compared to Low or Mixed. However, they find no difference in contributions by Agreeableness group type when no info is given. Cartwright et al. (Reference Cartwright, Chai and Xue2023) study a repeated four-player PGG that takes place after a social value orientation (SVO) task (Murphy et al., Reference Murphy, Ackermann and Handgraaf2011). SVO overlaps with Agreeableness and is related to cooperative behavior (Pletzer et al., Reference Pletzer, Balliet, Joireman, Kuhlman, Voelpel and Van Lange2018). They vary by treatment what info is given about other group members’ SVO, and only find differences in contributions between pro-social and pro-self types when at least some information about SVO is given. My main additional contribution is permitting strategic misrepresentation of Agreeableness—both of these designs are somewhat similar to my After or Never treatments. Another difference is that I do not provide info on the specific composition of a participant’s group (i.e., high or low Agreeableness).
My experiment also tests whether ‘unexpected data use’ (Charness et al., Reference Charness, Samek and van de Ven2022) influences participants’ future decisions. Unexpected data use is when responses are used in a way not described to participants when they provided that data. This could cause problems for a similar reason as to why deception is not used in economics experiments—a loss of control over participants’ beliefs and expectations (Cason and Wu, Reference Cason and Wu2019; Cooper, Reference Cooper2014). If a participant does not believe all of what they are told in experiments, then they would not always reveal what they would do if the situation was exactly as described. For example, previous unexpected data use may cause participants to behave more pro-socially, as they anticipate their decision could have some additional future consequence, like being revealed to others. The experimenter would then be unable to observe a participant’s true pro-social preferences for the specified decision environment. Charness et al. (Reference Charness, Samek and van de Ven2022) find that researchers consider unexpected data use as useful and not deceptive, but that student participants’ views differ, making it important to examine whether participants change their behavior after its use.
2. Experiment
All aspects of this experiment and the statistical analysis were pre-registered unless otherwise stated. The experiment consists of 3 parts that are common to all treatments. Part 1 is a Big Five questionnaire, Part 2 is a PGG, and Part 3 is a short questionnaire that elicits 4 other personality traits. The first treatment dimension is how groups are formed in Part 2, the PGG. In the RAND treatments, groups of three are formed randomly from all participants in the session. In the AGRE treatments, participants are first randomly shuffled into silos of six. Within each silo, the 3 participants with the highest Agreeableness scores (as elicited in Part 1) are assigned to one group (henceforth the H group), while the remaining three are assigned to another group (the L group). If information on the Agreeableness group formation rule is provided, then participants are told the definition of Agreeableness, and how being in a high Agreeableness group could be beneficial for the Part 2 PGG (see Section 3.3). The second treatment dimension is the timing of when information about the group formation rule is provided. This is either Before Part 1, After Part 1 but before Part 2, or Never. A full 3 $\times $
2 factorial design is conducted. The main outcome variables of interest are the Agreeableness scores as reported in Part 1, the Part 2 PGG contributions, and ‘Positive Perception’, an aggregation of socially-desirable responses (defined in Section 3.2.3) in the Part 3 personality questions.
$\times $
2 factorial design is conducted. The main outcome variables of interest are the Agreeableness scores as reported in Part 1, the Part 2 PGG contributions, and ‘Positive Perception’, an aggregation of socially-desirable responses (defined in Section 3.2.3) in the Part 3 personality questions.
2.1. Hypotheses
A list of all pre-registered Hypotheses is presented in Table 1. I now briefly describe the possible channels for each Hypothesis, and provide a more detailed description in Appendix B.
Summary of hypotheses

Note: Treatment groups: After & Never (effectively the same treatment during Part 1) = {AGRE After, AGRE Never, RAND After, RAND Never}, Unaware (that personality responses were/could be used in Part 2) = {AGRE Never, RAND Before, RAND After, RAND Never}.
In the Part 1 questionnaire, there are effectively 3 treatment groups, AGRE Before, RAND Before, and After & Never, as only participants in the Before treatments have seen anything different. In AGRE Before, participants have an incentive to misreport and increase their Agreeableness scores if they want to be in (avoid) H (L) PGG groups in Part 2 (H1). Whereas, participants in After & Never know there is a Part 2 PGG, but have not been told about group formation. If they respond differently in Part 1, it would be due to the suspicion (which is sometimes correct) that their responses would be used in some way in Part 2, and I posit most anticipated uses would likely be in the direction of what is socially desirable (H2).
In the Part 2 PGG, I first test whether the Agreeableness group formation rule is effective through creating groups of different levels of Agreeableness. I compare PGG contributions between H, L, and RAND groups within their respective timing conditions separately, to avoid the possible timing confounds described below. As groups with higher Agreeableness are predicted to contribute more, then H groups should contribute more than RAND, and they in turn more than L (H3). I then test the same type of group (i.e., H, L, or RAND) across adjacent timing conditions. Comparing Before and After, I predict H groups in Before will contribute less due to mistrust from possible Agreeableness misrepresentation in Part 1 and due to compressed Agreeableness scores reducing the group formation rule’s effectiveness by making groups more similar to RAND (H4), with the latter effect also increasing contributions in L groups. Comparing After and Never, I predict that those in H (L) groups in After will contribute more (less) due to (dis-)encouragement they are with similarly (dis-)Agreeable people, as they will believe they are less (more) likely to be taken advantage of (H5).Footnote 3
In the Part 3 questionnaire, there are 3 comparison groups of interest in terms of previously disclosed ‘data use’ of personality responses. The first group is participants in AGRE Before, the second group is participants in AGRE After, and the third group is all other participants, as they remain Unaware of potential data use of personality responses. The variable of interest for Part 3 is ‘Positive Perception’, a combination of all personality questions in Part 3 based on how positively they might be perceived by others (exact details in Section 3.2.3). Participants in AGRE After learn their Part 1 personality responses were used in an initially unannounced way. As a result, they may also believe that their Part 3 personality responses could also be used in some unannounced way (despite statements to the contrary), and report more socially-desirable responses than they otherwise would have (H6, H7). Whereas those in AGRE After had their Part 1 responses used in an announced way and thus would be more trusting of the experimenter that Part 3 responses will be used as stated (H6). However, knowing personality responses were used in some relevant way could still result in increased reported Positive Perception (H8).
3. Methods
3.1. Participants
There were 432 participants (182 male, 246 female, 4 other, $M_{age}=23.2$
,
$M_{age}=23.2$
, $SD_{age}=4.7$
, see Table C4 for full demographics by treatment), that is, 144 groups of three. Each RAND treatment has observations from 16 groups of three, and each AGRE treatment has observations from 32 groups of three. I collected a different number of groups by treatment as observations in the AGRE treatments are split between L and H groups. I determined the number of participants based on what was feasible given the total research budget and then considered whether this number was appropriate using simulation-based power analyses. I based this on whether the minimum detectable treatment effect at the 5% level with 80% power seemed reasonable given the number of participants in each treatment (see Appendix SE of the Supplementary Material for more details). No definition of exactly what was ‘reasonable’ was pre-registered, only that I considered it so at that time. The simulated datasets imply the treatment comparisons that have the lowest power would have a minimum detectable effect size of
$SD_{age}=4.7$
, see Table C4 for full demographics by treatment), that is, 144 groups of three. Each RAND treatment has observations from 16 groups of three, and each AGRE treatment has observations from 32 groups of three. I collected a different number of groups by treatment as observations in the AGRE treatments are split between L and H groups. I determined the number of participants based on what was feasible given the total research budget and then considered whether this number was appropriate using simulation-based power analyses. I based this on whether the minimum detectable treatment effect at the 5% level with 80% power seemed reasonable given the number of participants in each treatment (see Appendix SE of the Supplementary Material for more details). No definition of exactly what was ‘reasonable’ was pre-registered, only that I considered it so at that time. The simulated datasets imply the treatment comparisons that have the lowest power would have a minimum detectable effect size of $d=0.52$
,
$d=0.52$
, $d=0.49$
, and
$d=0.49$
, and $d=0.43$
for Agreeableness, Average PGG Group Contributions, and Positive Perception, respectively. These are all about medium effect sizes (
$d=0.43$
for Agreeableness, Average PGG Group Contributions, and Positive Perception, respectively. These are all about medium effect sizes ( $d \approx 0.5$
) assuming the assumptions were correct.Footnote
4
$d \approx 0.5$
) assuming the assumptions were correct.Footnote
4
Participants were German-speakers in either Innsbruck or Vienna, who had signed up to participate in economics experiments at the EconLab at the University of Innsbruck (UIBK) or the Vienna Center for Experimental Economics (VCEE) at the University of Vienna. Twenty sessions (366 participants) were run at the UIBK EconLab, and four sessions (66 participants) were run at VCEE. Participants were recruited for sessions using the online database hroot (Bock et al., Reference Bock, Baetge and Nicklisch2014) at the UIBK EconLab, and ORSEE at VCEE (Greiner, Reference Greiner2015). Participants were paid based on their cumulative earned points over 15 rounds of the PGG described in Section 3.2.2. Points were converted at a rate of 1,000 points = €3, and participants received a show-up fee of €4. The experiment was 45–60 minutes long with average earnings of €16.03.
3.2. Materials and measures
3.2.1. Part 1—Big Five elicitation
Part 1 consists of 50 questions to elicit the Big Five personality traits (McCrae and John, Reference McCrae and John1992). These traits are Openness to experience, Conscientiousness, Extraversion, Agreeableness, and Neuroticism. Each Big Five characteristic is elicited using the 30 question ‘BFI-2-S Inventory’ (Rammstedt et al., Reference Rammstedt, Danner, Soto and John2020; Soto and John, Reference Soto and John2017). The remaining 20 questions are all on Agreeableness, and sourced from the International Personality Item Pool’s (IPIP) ‘100-Item Lexical Big-Five Factor Markers’ (Goldberg, Reference Goldberg2002; Goldberg et al., Reference Goldberg, Johnson, Eber, Hogan, Ashton, Cloninger and Gough2006; Streib and Wiedmaier, Reference Streib and Wiedmaier2001). The Agreeableness trait is disproportionately weighted (26/50) as it is of primary interest and used for group formation in Part 2 in the AGRE treatments. Participants are asked how much they agree each statement applies to them using a 5-point Likert scale (Likert, Reference Likert1932). The five points are labeled: 1 = Disagree strongly, 2 = Disagree a little, 3 = Neither agree nor disagree, 4 = Agree a little, and 5 = Agree strongly. They are presented using horizontal radio buttons. Participants face blocks of 5 questions on a page, and all questions are presented in a random order drawn independently across participants. Personality traits are scored based on each participant’s numerical (i.e., 1–5) responses by the following formula: $Trait = \frac {\sum _{i \in Q} Response \times I(+veKey_i) + (6-Response)\times I(-veKey_i))}{n}$
, where Q is the set of relevant questions to that trait and n is the size of set Q. See Appendix SB of the Supplementary Material for further details on the personality trait questions and their scoring.
$Trait = \frac {\sum _{i \in Q} Response \times I(+veKey_i) + (6-Response)\times I(-veKey_i))}{n}$
, where Q is the set of relevant questions to that trait and n is the size of set Q. See Appendix SB of the Supplementary Material for further details on the personality trait questions and their scoring.
3.2.2. Part 2—Public goods game
Part 2 consists of a PGG adapted from the version used by Lugovskyy et al. (Reference Lugovskyy, Puzzello, Sorensen, Walker and Williams2017). Groups of three are assigned by the group formation rule (i.e., randomly or by Agreeableness). Each group of three remains together for 15 ‘group cooperation decisions’. In each decision, each participant has 25 tokens they can allocate to either a Private account or a ‘Cooperation’ account. Each token a participant allocates to the Private account earns that participant 10 points. Each token a participant allocates to the Cooperation account earns each of the 3 group members (i.e., including the participant in question) 4 points each (i.e., 12 points to the group overall). I refer to tokens allocated to the Cooperation account as ‘contributions’. Participants decide how many tokens to allocate to the Cooperation account, with the rest being allocated to their Private account. After making their decision, participants are given a summary of their own contribution and the total group contribution in that round. These round summaries are also available at any time during Part 2 in a history table that is displayed at the bottom of the screen.
3.2.3. Part 3—Final questionnaire
In Part 3, participants are first told they are to complete a final survey, and that their final earnings for the experiment have already been set. Participants then answer 16 personality questions and a demographic questionnaire. The 16 questions elicit the Dark Triad (Paulhus and Williams, Reference Paulhus and Williams2002), and the Sincerity and Fairness facets of the Honesty-Humility trait from HEXACO (Ashton and Lee, Reference Ashton and Lee2009). The three Dark Triad measures are Machiavellianism (Christie and Geis, Reference Christie and Geis1970), Narcissism (Raskin and Hall, Reference Raskin and Hall1979), and Psychopathy (Hare, Reference Hare1985). The questions were elicited in the same format as in Part 1, with the exception that only four questions were shown on each page, given that there were 16 total questions. I combine all of the personality traits elicited in Part 3 into one measure based on how likely it is that they would be positively perceived by others. I take the average of each participant’s 16 responses to the Part 3 questions, where Dark Triad traits are reversed ( $6$
-
$6$
- $Response$
) and Honesty-Humility is left unchanged (after the initial positively- or negatively-keyed adjustment is made). I call this combined measure ‘Positive Perception’. After the personality questions, participants filled in their age, gender, field of study, GPA, years at uni, number of previous economics experiments, and their enjoyment of the experiment.
$Response$
) and Honesty-Humility is left unchanged (after the initial positively- or negatively-keyed adjustment is made). I call this combined measure ‘Positive Perception’. After the personality questions, participants filled in their age, gender, field of study, GPA, years at uni, number of previous economics experiments, and their enjoyment of the experiment.
3.3. Procedures
All participants within a session faced the same treatment, which was randomly assigned.Footnote 5 In all treatments, participants were given a short overview of the PGG in Part 2 (see Appendix SD of the Supplementary Material) before completing the Part 1 questions. If information about the group formation rule is provided (i.e., in Before or After), it is provided either directly before or directly after participants complete the Part 1 questions. In the AGRE Before and After treatments, participants are presented with the following message:
For Part 2, you will be assigned to a group of three based on your ‘Agreeableness’ score. Your Agreeableness score is determined by your responses to particular questions in Part 1.
Agreeableness is a personality trait where people high in Agreeableness are often described as selfless, trusting, good-natured, generous, and forgiving. (Costa, McCrae, & Dembroski, 1989)
In scientific studies, a high level of Agreeableness has been found to have a positive effect on group cooperation decisions similar to the type in Part 2. [References button with pop-up window that listed the following info: Perugini, Tan, & Zizzo in Economic Issues, Volume 15, Part 1, 2010. Volk, Thöni, & Ruigrok in the Journal of Economic Behavior & Organization, Volume 81, Issue 2, 2012. Kagel & McGee in Economics Letters, Volume 124, Issue 2, 2014. Thielmann, Spadaro, & Balliet in Psychological Bulletin, Volume 146, Issue 1, 2020.]
Each group of three is formed from 6 randomly selected subjects. The 3 subjects with the highest Agreeableness scores will be assigned to one group, and the remaining 3 subjects to the other group.
After all participants completed the Part 1 questions the computer formed groups by the group formation rule, and they made their Part 2 PGG contribution decisions, followed by the Part 3 questions.
4. Results
All analyses were conducted in Python using Stata 17 (tobit, xttobit, metobit) (StataCorp, 2021), SciPy (mannwhitneyu) (Virtanen et al., Reference Virtanen, Gommers, Oliphant, Haberland, Reddy, Cournapeau, Burovski, Peterson, Weckesser, Bright, van der Walt, Brett, Wilson, Millman, Mayorov, Nelson, Jones, Kern, Larson and Vázquez-Baeza2020), or Pingouin (compute_effsize, compute_esci, cronbach_alpha, rcorr, pairwise_corr) (Vallat, Reference Vallat2018).
4.1. Descriptive results
A summary of the dependent variables by treatment and high or low Agreeableness group type (where applicable) is presented in Table 2. Table 3 reports the means, correlations, and Cronbach’s alpha between all elicited personality traits and individual contributions in the PGG. Figure 1 displays a distributional summary of the 2 personality-dependent variables, separated into their relevant treatment groups. Figure 1 suggests any treatment effect, if present, is quite small.
Summary statistics by treatment and Agreeableness group type

Note: Mean given, then standard deviation in parentheses. Low and High Agreeableness groups are reported separately for AGRE treatments, with Low Agreeableness groups reported first (on the top) in a cell, and High Agreeableness groups reported second (bottom). Avg. PGG Group Cont. = Average PGG Group Contribution $\in [0,25]$
and reported at the group per round level, meaning
$\in [0,25]$
and reported at the group per round level, meaning $(48\div 3) \times 15=240$
observations.
$(48\div 3) \times 15=240$
observations.
Means and inter-correlations between personality traits and PGG contributions

Note: Cronbach’s alpha given in italics in the diagonal. Pearson correlation coefficient in the off diagonal, with ***= $p<0.01$
, **=
$p<0.01$
, **= $p<0.05$
, *=
$p<0.05$
, *= $p<0.10$
. Pooled observations over all treatments (
$p<0.10$
. Pooled observations over all treatments ( $n=432$
). PGG Cont. is averaged at the individual level. Abbreviations: Agreeabl. = Agreeableness, Openness = Openness to experience, Neurot. = Neuroticism, Extrav. = Extraversion, Conscie = Conscientiousness, Hon. Hum. = Honesty Humility, Machiav. = Machiavellianism, Psychop. = Psychopathy, and PGG Cont. = PGG Contributions.
$n=432$
). PGG Cont. is averaged at the individual level. Abbreviations: Agreeabl. = Agreeableness, Openness = Openness to experience, Neurot. = Neuroticism, Extrav. = Extraversion, Conscie = Conscientiousness, Hon. Hum. = Honesty Humility, Machiav. = Machiavellianism, Psychop. = Psychopathy, and PGG Cont. = PGG Contributions.
Figure 2 graphically illustrates average contributions over time by treatment. Figure 2 displays declining contributions over time, which is typical in this type of PGG. Figure 2 visually suggests that AGRE Before and AGRE After increase contributions by about 2–4 tokens on average when compared to RAND, and that this level shift is sustained over time. However, this increase is observed regardless of whether the group is of H or L Agreeableness. In addition, AGRE Never appears to be ineffective as it is quite close to RAND. From the patterns in Figure 2, it follows that the Agreeableness group formation rule does not increase contributions by creating groups with high levels of Agreeableness.
Personality-dependent variables by treatment group.
Note: Mean value overlaid. The 3 lines in the box are the 75%, 50%, and 25% quartiles when going from top to bottom, the top (bottom) whisker is the largest (smallest) value that is below (above) 1.5 times the difference between the 75% and 25% quartiles, and values outside this range are diamonds.

Average contributions by round.

4.2. Pre-registered analysis
This section presents all analyses that were in the main body of the pre-registration, except for unsophisticated misrepresentation, which is now in Appendix SA.3.1 of the Supplementary Material. This section also presents the analysis of individual traits on PGG contributions, which was in the Appendix of the pre-registration.
4.2.1. Part 1: Strategic misrepresentation of Agreeableness
For misrepresentation of Agreeableness, there are 3 comparison groups: AGRE Before, RAND Before, and all After & Never treatments, because treatments can only impact Part 1 responses if they differ before Part 1. I find that Agreeableness in RAND Before ( $M=4.04$
,
$M=4.04$
, $SD=0.47$
) is not statistically significantly different than in AGRE Before (
$SD=0.47$
) is not statistically significantly different than in AGRE Before ( $M=4.13$
,
$M=4.13$
, $SD=0.43$
,
$SD=0.43$
, $U_{48,96}=2,090.5$
,
$U_{48,96}=2,090.5$
, $p=0.37$
,
$p=0.37$
, $d=0.21 95\% \; CI=[-0.14,0.56]$
), suggesting people are not substantially misrepresenting their Agreeableness when they know PGG groups will be formed based on this trait. I also find that Agreeableness in RAND Before (
$d=0.21 95\% \; CI=[-0.14,0.56]$
), suggesting people are not substantially misrepresenting their Agreeableness when they know PGG groups will be formed based on this trait. I also find that Agreeableness in RAND Before ( $M=4.04$
,
$M=4.04$
, $SD=0.47$
) is very similar to After & Never (
$SD=0.47$
) is very similar to After & Never ( $M=4.04$
,
$M=4.04$
, $SD=0.46$
,
$SD=0.46$
, $U_{48,288}=7,062$
,
$U_{48,288}=7,062$
, $p=0.81$
,
$p=0.81$
, $d<0.01 95\% \; CI=[-0.31,0.31]$
), suggesting people do not change their answers in response to suspicion about how they might be used in future parts. Finally, the comparison between AGRE Before and After & Never also finds no statistically significant difference (
$d<0.01 95\% \; CI=[-0.31,0.31]$
), suggesting people do not change their answers in response to suspicion about how they might be used in future parts. Finally, the comparison between AGRE Before and After & Never also finds no statistically significant difference ( $p=0.10$
,
$p=0.10$
, $d=0.20$
,
$d=0.20$
, $U_{96,288}=15,369$
,
$U_{96,288}=15,369$
, $95\% \; CI=[-0.03,0.44]$
). In Appendix SA.3.1 of the Supplementary Material, I also consider ‘unsophisticated’ misrepresentation of the other Big Five traits, but find no differences in most traits.
$95\% \; CI=[-0.03,0.44]$
). In Appendix SA.3.1 of the Supplementary Material, I also consider ‘unsophisticated’ misrepresentation of the other Big Five traits, but find no differences in most traits.
4.2.2. Part 2: PGG contributions
To test for treatment differences between 2 comparison groups, I first drop all observations except for those 2 comparison groups, and create a dummy variable called Treatment that is 1 if the observation belongs to one of the comparison groups and 0 otherwise. I then conduct a panel Tobit regression over PGG groups and rounds, with random effects for PGG groups and a linear time trend. The dependent variable is the average number of tokens contributed by the three PGG group members in a given round, which is possibly censored at 0 and 25, hence the use of the Tobit. The regression specification is as follows: $Average\, PGG \, Contribution_{g,r} = \beta _{0} + \beta _1 Treatment_g + \beta _2 Round + u_g + \epsilon _{g,r}$
.
$Average\, PGG \, Contribution_{g,r} = \beta _{0} + \beta _1 Treatment_g + \beta _2 Round + u_g + \epsilon _{g,r}$
.
Table 4 summarizes the results from tests of the numbered Hypotheses on PGG contributions. The only statistically significant results are between the RAND Before treatment and those in either the H group or the L group of the AGRE Before treatment. Table 4 provides no support for any of H3, H4, or H5, suggesting 3 things. Firstly, group formation by Agreeableness is generally ineffective in changing contributions in the PGG—both H and L Agreeableness groups contribute similarly within each of the Before, After, and Never treatments (H3). Secondly, the possibility of strategic misrepresentation of personality in Part 1 due to Part 2 group incentives does not affect contributions in the PGG—H(L) groups in AGRE Before do not contribute less (more) than H(L) groups in AGRE After (H4). Thirdly, there is no (dis-)encouragement effect of knowing the group has similarly high (low) Agreeableness—H(L) groups in AGRE After do not contribute more (less) compared to H(L) groups in AGRE Never (H5).
Efficiency—Regressions

Note: For brevity, only the statistics of the comparison dummy variable are reported. The second group in the pair is the omitted dummy. Each block groups the comparisons within the Before, After, Never, AGRE, and RAND treatments, respectively. For (H)ypotheses: $+$
,
$+$
, $-$
, and
$-$
, and $\sim $
indicate a positive, negative, or neutral predicted effect, respectively. Full regression output reported in Appendix SF.1.1 of the Supplementary Material.
$\sim $
indicate a positive, negative, or neutral predicted effect, respectively. Full regression output reported in Appendix SF.1.1 of the Supplementary Material.
4.2.3. Part 3: Positive perception
There are 3 relevant comparison groups: ‘expected’ or pre-announced data use (of Part 1 personality responses) (AGRE Before), unexpected data use (AGRE After), and all treatments where participants remain Unaware of data use. I find no difference between Positive Perception in AGRE Before ( $M=3.60, SD=0.52$
) and AGRE After (
$M=3.60, SD=0.52$
) and AGRE After ( $M=3.61$
,
$M=3.61$
, $SD=0.61$
,
$SD=0.61$
, $U_{96,96}=4,511.5$
,
$U_{96,96}=4,511.5$
, $p=0.80$
,
$p=0.80$
, $d=0.01 95\% \; CI=[-0.28,0.29]$
), suggesting that unexpected data use does not affect responses to the Part 3 personality questions when it was known that Part 1 responses affected group composition in Part 2. I also find no evidence that Positive Perception in AGRE After is higher than in Unaware (
$d=0.01 95\% \; CI=[-0.28,0.29]$
), suggesting that unexpected data use does not affect responses to the Part 3 personality questions when it was known that Part 1 responses affected group composition in Part 2. I also find no evidence that Positive Perception in AGRE After is higher than in Unaware ( $M=3.51$
,
$M=3.51$
, $SD=0.60$
,
$SD=0.60$
, $U_{96,240}=12,657.5$
,
$U_{96,240}=12,657.5$
, $p=0.25$
,
$p=0.25$
, $d=0.16 95\% \; CI=[-0.08,0.40]$
), which means it is unlikely that unexpected data use affects Part 3 responses compared to the case where it is unknown if/how Part 1 responses is used in Part 2. Finally, I find no statistically significant difference between Positive Perception in AGRE Before and in Unaware (
$d=0.16 95\% \; CI=[-0.08,0.40]$
), which means it is unlikely that unexpected data use affects Part 3 responses compared to the case where it is unknown if/how Part 1 responses is used in Part 2. Finally, I find no statistically significant difference between Positive Perception in AGRE Before and in Unaware ( $U_{96,240}=12,435.5$
,
$U_{96,240}=12,435.5$
, $p=0.25$
,
$p=0.25$
, $d=0.16$
,
$d=0.16$
, $95\% \; CI=[-0.08,0.39]$
), implying that the knowledge that Part 1 responses were used in creating Part 2 groups does not change responses to Part 3 questions when that usage was expected (i.e., revealed before Part 1).
$95\% \; CI=[-0.08,0.39]$
), implying that the knowledge that Part 1 responses were used in creating Part 2 groups does not change responses to Part 3 questions when that usage was expected (i.e., revealed before Part 1).
4.2.4. Agreeableness and PGG contributions
The results suggest that the Agreeableness group formation rule is not effective in increasing contributions by creating groups with higher levels of Agreeableness. This follows from the observation that there is no difference between H and L groups, and that the AGRE Never H group contributes similarly to those in RAND. Creating higher contribution groups through sorting by Agreeableness relies on the assumption that individuals with higher Agreeableness contribute more.
To see whether this is the case, I regress an individual’s personality traits and demographics on their contributions in the PGG. The regression is a panel Tobit regression on individual PGG contributions in each round, censored at 0 and 25 (the min and max possible contribution), with individual- and group-level random effects. It has dummies for each treatment (with RAND Before as the omitted dummy) and fits a linear trend over rounds. It includes the lagged average contribution of the other 2 group members, where the first round value is found by which integer value maximizes the log-likelihood (Bardsley and Moffatt, Reference Bardsley and Moffatt2007). It then includes all elicited Part 1 and Part 3 personality scores, and dummy variables for gender (male and other as omitted variable), year at uni (first year as the omitted dummy), and main subject of study (Mgmt./Business as the omitted dummy). Finally, all observations from AGRE Before are excluded, as misrepresentation of Agreeableness could be present. Table 5 reports the output from this regression, and suggests that an individual’s Agreeableness is uncorrelated with their contribution behavior. This lack of correlation is robust to a variety of alternative specifications, like the pairwise correlation test reported in Table 3, and additional tests reported in Appendix SA.2 of the Supplementary Material. This result is in line with the meta-analysis of Thielmann et al. (Reference Thielmann, Spadaro and Balliet2020), who find no evidence of a relationship between Agreeableness and pro-social behavior in social dilemma games when play is repeated, with the latter proving to be an important caveat. With this in mind, it is unsurprising then that the Agreeableness group formation rule by itself proved ineffective in increasing group contributions in the repeated PGG.
Individual characteristics on contributions

Note: Results are from a multilevel panel Tobit regression (censored at $0$
and
$0$
and $25$
) with individual and group-level random effects. An individual’s contribution to the public good per round is the dependent variable. All observations from AGRE Before excluded. Full regression output and details are reported in Appendix SF.1.2 of the Supplementary Material. ***=
$25$
) with individual and group-level random effects. An individual’s contribution to the public good per round is the dependent variable. All observations from AGRE Before excluded. Full regression output and details are reported in Appendix SF.1.2 of the Supplementary Material. ***= $p<0.01$
, **=
$p<0.01$
, **= $p<0.05$
, and *=
$p<0.05$
, and *= $p<0.10$
.
$p<0.10$
.
In terms of the other personality traits, Table 5 suggests that higher levels of Openness to experience are associated with higher contributions. These findings should be interpreted through the lens of the broader literature. Openness to experience has been proposed as a possible factor in cooperative pro-sociality by Lawn et al. (Reference Lawn, Zhao, Laham and Smillie2022), although they found only modest correlations in one-shot PGGs, and while not directly reported in the meta-analysis of Thielmann et al. (Reference Thielmann, Spadaro and Balliet2020), their dataset suggests little to no relationship in repeated social dilemmas. Table 5 also suggests that Conscientiousness is negatively correlated with contributions. While Proto et al. (Reference Proto, Rustichini and Sofianos2019) find a similar effect in a repeated Prisoner’s Dilemma and propose this could be driven by the Cautiousness sub-facet, the meta-analysis of Thielmann et al. (Reference Thielmann, Spadaro and Balliet2020) suggests no relationship between Conscientiousness and behavior in social dilemmas. In the absence of pre-registered theoretical predictions, these results are likely false positives, although they do contribute to future meta-analyses as there is a relative dearth of studies considering personality and repeated social dilemmas (Thielmann et al., Reference Thielmann, Spadaro and Balliet2020). Despite these results, individual differences do play an important role in cooperation, as (not pre-registered) likelihood ratio tests of the specification in Table 5 strongly support including individual-level random effects ( $\chi ^2_1 \geq 233.15, p<0.01$
).
$\chi ^2_1 \geq 233.15, p<0.01$
).
4.3. Exploratory analysis
4.3.1. Agreeableness misrepresentation
The results imply that there may be a small amount of misrepresentation ( $d \approx 0.20$
) by those in AGRE Before. However, the ex-ante power analysis suggests that only
$d \approx 0.20$
) by those in AGRE Before. However, the ex-ante power analysis suggests that only $d \geq 0.49$
is sufficiently powered. Ex-post there is little that can be done to increase power. However, based on the results, pooling observations from RAND Before and After & Never seems appropriate as Agreeableness is very similar between these 2 groups (
$d \geq 0.49$
is sufficiently powered. Ex-post there is little that can be done to increase power. However, based on the results, pooling observations from RAND Before and After & Never seems appropriate as Agreeableness is very similar between these 2 groups ( $d<0.01$
). This yields a marginally insignificant two-sided result (
$d<0.01$
). This yields a marginally insignificant two-sided result ( $U_{96,336}=17,886.5$
,
$U_{96,336}=17,886.5$
, $p=0.10$
,
$p=0.10$
, $d=0.20 95\% \; CI=[-0.02,0.43]$
), while additionally conducting the better-powered t-test yields a significant result at the 10% level (
$d=0.20 95\% \; CI=[-0.02,0.43]$
), while additionally conducting the better-powered t-test yields a significant result at the 10% level ( $t_{430}=1.75$
,
$t_{430}=1.75$
, $p=0.08$
). Given H1 was directional, it could also be reasonable to use a one-sided p-value, which would then be significant at the 5% level.
$p=0.08$
). Given H1 was directional, it could also be reasonable to use a one-sided p-value, which would then be significant at the 5% level.
Agreeableness was elicited using 2 different question sets: 20 from the IPIP’s 100-Item Lexical Big-Five Factor Markers and 6 from the BFI-2-S, which are then combined (see Section 3.2.1). However, as these inventories were not explicitly designed to be combined in such a manner, I also consider them separately. Using the same tests as were pre-registered, I find no evidence of misrepresentation when using the IPIP scale (e.g., the lowest p-value is comparing AGRE Before ( $M=4.14$
,
$M=4.14$
, $SD=0.44$
) to After & Never (
$SD=0.44$
) to After & Never ( $M=4.07$
,
$M=4.07$
, $SD=0.47$
,
$SD=0.47$
, $U_{96,288}=14,999$
,
$U_{96,288}=14,999$
, $p=0.21$
,
$p=0.21$
, $d=0.16 95\% \; CI=[-0.07,0.40]$
)). For the BFI-2-S Agreeableness scale, there is evidence that participants in the AGRE Before (
$d=0.16 95\% \; CI=[-0.07,0.40]$
)). For the BFI-2-S Agreeableness scale, there is evidence that participants in the AGRE Before ( $M=4.10$
,
$M=4.10$
, $SD=0.48$
) report higher Agreeableness than those in RAND Before (
$SD=0.48$
) report higher Agreeableness than those in RAND Before ( $M=3.89$
,
$M=3.89$
, $SD=0.54$
,
$SD=0.54$
, $U_{48,96}=1,834$
,
$U_{48,96}=1,834$
, $p=0.05$
,
$p=0.05$
, $d=0.43 95\% \; CI=[0.07,0.78]$
), and those in After & Never (
$d=0.43 95\% \; CI=[0.07,0.78]$
), and those in After & Never ( $M=3.96$
,
$M=3.96$
, $SD=0.54$
,
$SD=0.54$
, $U_{96,288}=15,874$
,
$U_{96,288}=15,874$
, $p= 0.03$
,
$p= 0.03$
, $d=0.28 95\% \; CI=[0.05,0.51]$
).
$d=0.28 95\% \; CI=[0.05,0.51]$
).
In summary, there may be some evidence to suggest strategic misrepresentation of Agreeableness, and the null result from the pre-registered analysis may be due to low power or the specific Agreeableness metric used. However, even if there is misrepresentation, its effect size is usually small ( $d \approx 0.20$
) and may not be empirically relevant. Also, comparing multiple metrics for Agreeableness could yield false positives due to the multiple comparisons problem. For example, the comparison of RAND Before and After & Never for the BFI-2-S Agreeableness scale is no longer statistically significant at the 5% level when correcting for a family of 3 comparisons (i.e., one for each tested metric) by either the Bonferroni–Holm (Holm, Reference Holm1979) or Benjamini and Hochberg (Reference Benjamini and Hochberg1995) procedures. Furthermore, while the analysis in the above 2 paragraphs may seem reasonable, they were not pre-registered and could be seen as an example of how one could unintentionally be drawn to analysis that yields
$d \approx 0.20$
) and may not be empirically relevant. Also, comparing multiple metrics for Agreeableness could yield false positives due to the multiple comparisons problem. For example, the comparison of RAND Before and After & Never for the BFI-2-S Agreeableness scale is no longer statistically significant at the 5% level when correcting for a family of 3 comparisons (i.e., one for each tested metric) by either the Bonferroni–Holm (Holm, Reference Holm1979) or Benjamini and Hochberg (Reference Benjamini and Hochberg1995) procedures. Furthermore, while the analysis in the above 2 paragraphs may seem reasonable, they were not pre-registered and could be seen as an example of how one could unintentionally be drawn to analysis that yields $p<0.05$
.
$p<0.05$
.
4.3.2. Increased contributions in Agreeableness before and after
The results show that the Agreeableness group formation rule does not improve contributions by grouping people with high Agreeableness together, as was initially proposed. Rather, as both H and L groups contribute similarly at increased levels, it must be something on the additional screen (described in Section 3.2.2) that increases contributions. To test whether this is the case, I pool observations from both H and L groups, in AGRE Before and AGRE After, and compare them to participants in all other treatments. Using the same statistical test as in Section 4.2.2, I find contributions are higher in AGRE Before & After than in the other treatments ( $B=3.74$
,
$B=3.74$
, $SE=1.13$
,
$SE=1.13$
, $Z=3.31$
,
$Z=3.31$
, $p=<0.01$
,
$p=<0.01$
, $d=0.48$
). This result is robust at the 10% significance level to different aggregations of H and L groups such as considering each timing condition separately (see Appendix SF.2.1 of the Supplementary Material), except when comparing only AGRE After to only RAND After (
$d=0.48$
). This result is robust at the 10% significance level to different aggregations of H and L groups such as considering each timing condition separately (see Appendix SF.2.1 of the Supplementary Material), except when comparing only AGRE After to only RAND After ( $B=1.76$
,
$B=1.76$
, $SE=2.22$
,
$SE=2.22$
, $Z=0.79$
,
$Z=0.79$
, $p=0.43$
,
$p=0.43$
, $d=0.21$
).
$d=0.21$
).
5. Discussion
5.1. Possible operative channels
One finding of this experiment is the lack of substantial misrepresentation of Agreeableness in Part 1 when it is known that Part 2 PGG groups will be formed based on this trait. There are multiple possible explanations as to why this is the case. Firstly, Section 4.3.1 suggests low power may be behind this result. In addition, Figure 1 illustrates that average Agreeableness is already quite high relative to its maximum value, meaning low power could be exasperated by a ceiling effect. Secondly, a preference for honesty (see Abeler et al., Reference Abeler, Nosenzo and Raymond2019 for a meta-study) could outweigh the indirect benefits of being in an H group. Thirdly, it could be that participants were unable to misrepresent their personality. This seems unlikely given the previous literature, for example, McGee and McGee (Reference McGee and McGee2024) find misrepresentation in a more difficult task of inferring the personality trait in question from a job description.
The results show strong evidence of increased PGG contributions in the AGRE Before treatment and some evidence of increased contributions in AGRE After treatment, regardless of whether the group was of high or low Agreeableness. Alongside the lack of effect in AGRE Never, where participants were not told they were grouped by Agreeableness, the increased contributions must be driven by the additional text those in the AGRE Before and AGRE After treatments see (described in Section 3.3). This text states group formation is done by Agreeableness calculated from Part 1 responses, and defines people with high Agreeableness as being ‘selfless, trusting, good-natured, generous, and forgiving’. It then states that scientific studies suggest a positive relationship between Agreeableness and group cooperation decisions, and that high and low Agreeableness groups will be created from subsets of 6 people. A variety of explanations could explain why this text increases contributions in the PGG. Being grouped with those with similar personality scores could induce a group identity (Chen and Li, Reference Chen and Li2009; Eckel and Grossman, Reference Eckel and Grossman2005), or the test be seen as a team-building exercise (Charness et al., Reference Charness, Cobo-Reyes and Jiménez2014). The positive words used to describe Agreeableness could prime cooperation (Drouvelis et al., Reference Drouvelis, Metcalfe and Powdthavee2015), or as the positive words are linked to contributions, people may contribute to maintain or build a positive self-image (Bénabou and Tirole, Reference Bénabou and Tirole2006, Reference Bénabou and Tirole2011). Another possibility is an experimenter demand effect (Zizzo, Reference Zizzo2010) through framing the PGG as being about cooperative decisions. While such framing is likely to increase contributions (Dufwenberg et al., Reference Dufwenberg, Gächter and Hennig-Schmidt2011), all treatments have the public good framed as a ‘cooperation account’, while the additional text only repeats this link. Finally, it could be that most participants thought they were in the H group, as this experiment does not reveal this type of info, while previous studies only found differences when such info was given (Cartwright et al., Reference Cartwright, Chai and Xue2023; Drouvelis and Georgantzis, Reference Drouvelis and Georgantzis2019).
These potential operative channels have implications for using personality testing in hiring decisions, assuming external validity. Firstly, a preference for honesty (or against lying) would limit the threat that strategic misrepresentation poses. Getting a job can be very high-stakes for an individual, which would suggest higher levels of dishonest behavior (e.g., Gneezy and Kajackaite, Reference Gneezy and Kajackaite2020; Hilbig and Thielmann, Reference Hilbig and Thielmann2017; Kajackaite and Gneezy, Reference Kajackaite and Gneezy2017) and thus more misrepresentation. However, there is also evidence that the ‘costs’ of lying increase when considering the distance between the truth and what someone actually states (Abeler et al., Reference Abeler, Nosenzo and Raymond2019; Hilbig and Hessler, Reference Hilbig and Hessler2013), suggesting the job seeker may misrepresent their personality somewhat, but not to a large extent. Secondly, the increased contributions of those who knew the personality test determined their group, regardless of H or L, suggests that using personality tests in hiring may have an additional positive channel beyond any predictive power it may have for job suitability. Having to do the personality test may induce a group identity, or a common belief that coworkers either share similar personalities or should be well-suited to their jobs.
5.2. Limitations and future research
The most important limitation is the use of Agreeableness as the personality trait for PGG group formation. While a meta-analysis (Thielmann et al., Reference Thielmann, Spadaro and Balliet2020) shows Agreeableness is positively related with pro-social actions overall and in one-shot social dilemmas, it provides no evidence that it affects behavior in repeated social dilemmas like the repeated PGG used in this article. Future research could consider if sorting by other personality traits increases contributions in a repeated PGG. For a repeated social dilemma, better candidates could be Pro-environmentalism (Schultz et al., Reference Schultz, Shriver, Tabanico and Khazian2004) or the HEXACO version of Agreeableness (Ashton and Lee, Reference Ashton and Lee2009). These traits have the strongest correlations in Figure 7 of Thielmann et al. (Reference Thielmann, Spadaro and Balliet2020), although with the caveat that there are relatively few studies that assess those traits in a repeated setting, and that the PGG would likely need to be framed for Pro-environmentalism.
Another limitation of this research is that it was not practical to decompose all possible channels, foreseen or otherwise. For example, the posited compression of Agreeableness scores due to incentives in AGRE Before could have also been achieved by adding a random number to scores prior to sorting (removing malicious intent), or each of element of the additional text in AGRE Before and AGRE After could be included or excluded. A full decomposition would be ruinous in terms of sample size constraints, particularly given power in the current study seems a bit low ex-post.
Finally, while this study imitates the important parts of the work hiring process using personality tests followed by a cooperative job, it is a lab experiment. Lab experiments can be a cost-effective tool to evaluate firm personnel policies in an environment without real-world confounds or complexities (Villeval, Reference Villeval2016). However, they also have limitations like limited external validity, abstract settings (Schram, Reference Schram2005), relatively low stakes (Harrison, Reference Harrison1989), experimenter demand effects, and self-selected, homogeneous student participant pools (Henrich et al., Reference Henrich, Heine and Norenzayan2010; Henry, Reference Henry2008; Kaźmierczak et al., Reference Kaźmierczak, Zajenkowska, Rogoza, Jonason and Ścigała2023).
6. Conclusion
Using psychometric personality testing when there may be incentives to misrepresent personality is a complex topic. To shed light on this issue, I design and conduct an incentivized laboratory experiment. I first elicit Big Five characteristics, and then conduct a repeated PGG. I create groups for the PGG based on either on the Big Five trait of Agreeableness, or randomly. By changing the timing of the revelation of the sorting rule to before or after the initial questionnaire, I am able to explore misrepresentation and evaluate any subsequent impact on cooperative behavior.
I find that participants do not substantially misrepresent their personality to get into groups with higher levels of Agreeableness. I also find that the Agreeableness group formation rule increases contributions in the AGRE Before and AGRE After treatments, but not in the AGRE Never treatment. In addition, the increase in contributions occurs for both H and L groups. Lastly, I find that using personality tests in an unannounced way does not affect subsequent personality tests. Withholding information about the group formation rule did not influence later behavior, suggesting that experimental control was maintained.
Supplementary material
The supplementary material for this article can be found at https://doi.org/10.1017/jdm.2026.10031.
Data availability statement
The pre-registration is available at https://doi.org/10.17605/OSF.IO/YWM64 and the data and analysis code are available at http://doi.org/10.17605/OSF.IO/MDB7A.
Acknowledgements
A previous version of this article circulated under the title ‘Personality Testing and the Public Goods Game’. I thank Annika Kieninger and Matthias Waldauf for excellent research assistance. Helpful comments and feedback were received from the editor Isabel Thielmann and anonymous referees, as well as Tim Cason, Raphael Epperson, David Gill, Elisabeth Gsottbauer, Stanton Hudja, Christian König-Kersting, and Andrew McGee.
Funding statement
Funding from the IFREE Small Grants Program is gratefully acknowledged.
Competing interests
The author declares none.
Ethical standards
This research received ethical approval from the University of Innsbruck (54/2023).
Appendices
A. Deviations from the pre-registration document
This article closely follows the pre-registered motivation and statistical tests or explicitly states otherwise. The original intention was to strictly adhere to using the text in the pre-registration as the final paper as far as practically possible. However, a substantial rewrite was required in order to meet the expectations and norms of a different field. Instead, I leave the last version prior to this rewrite available at https://woodsd42.github.io/files/PTPGG.pdf and the original pre-registration at http://doi.org/10.17605/OSF.IO/MDB7A.
The random ordering of treatments was not able to be followed perfectly near the end of the data collection, as the number of participants that showed up could differ from what the next treatment required. For example, 18 participants might show up for a session that only requires 12 more observations. In this case, the next treatment that required 18 participants was conducted in that session, while the original assigned treatment was conducted in the next session that had 12 participants. The treatments that were assigned to VCEE were done so as soon as the decision to employ them was made, but show-up rates also necessitated some changes. Given that the large majority of sessions followed the random ordering, then the treatments that were in these later sessions were also random. Based on this, there is no reasonable threat to the randomization procedure.
B. Predictions, hypotheses, and proposed behavioral channels
B.1. Predictions: Misrepresentation
When it comes to strategic misrepresentation in the Big Five questionnaire of Part 1, there are 3 treatment groups of interest. The first are those that know in advance that their Part 1 responses will be used to form groups in Part 2 (AGRE Before). The second are those that know in advance that their Part 1 responses will not be used to form groups in Part 2 (RAND Before). The final group are those that do not know in advance about the group formation rule in Part 2 (After & Never). The first 2 groups are aware of how their Part 1 responses affect Part 2 while answering Part 1, while the third group is unaware of this while answering Part 1.
I propose 2 behavioral channels that could influence Part 1 responses: the incentive to misrepresent Agreeableness, and the suspicion that Part 1 answers may be used in some way for Part 2. An incentive to misrepresent Agreeableness exists when it is known groups will be formed based on this trait. Suspicion occurs only when participants are not aware of the purpose of the questionnaire. Participants may believe (sometimes correctly) that the questionnaire will be used in some relevant way in the future, as they know there will be a following Part 2. Each of the comparisons between the relevant groups and the differences in operative channels between them are summarized in Table B1.
Misrepresentation of Agreeableness—Treatment comparisons

Note: Going from the first treatment to the second, $+$
indicates that channel has been added,
$+$
indicates that channel has been added, $0$
indicates no change, and
$0$
indicates no change, and $-$
indicates that channel has been taken away. The After & Never grouping includes all treatments except for AGRE Before and RAND Before.
$-$
indicates that channel has been taken away. The After & Never grouping includes all treatments except for AGRE Before and RAND Before.
Table B1 demonstrates comparisons that isolate either channel: incentives through comparing AGRE Before to RAND Before, and suspicion through comparing RAND Before to After & Never. Both channels have the potential to influence Agreeableness. Incentives should increase the reported Agreeableness scores, as participants will prefer to be in H groups (or avoid L groups). I propose that suspicion leads to more socially desirable responses, thereby increasing reported Agreeableness scores. There are many possibilities of what a participant might be suspicious of, but the obvious candidates of group formation or having answers revealed to others in Part 2 would both suggest a tendency towards more socially desirable responses.Footnote 6 Hypotheses 1 and 2 formalize the conjecture that the reported Agreeableness scores in Part 1 in the presence of incentives or suspicion, respectively.
Hypothesis 1. Agreeableness scores are higher in AGRE Before than in RAND Before.
Hypothesis 2. Agreeableness scores are higher in After & Never treatments than in RAND Before.
B.2. Predictions: Contributions
One important distinction to make is that in the AGRE treatments, one group will have higher Agreeableness than the other. The high group is predicted to have higher contributions than the low group. I therefore consider these 2 types of groups separately, as I would like to observe the positive effects of personality sorting.Footnote 7 I denote the 2 types of groups H and L for high and low Agreeableness respectively. In the following discussion, I take the viewpoint of the H group when describing potential effects.
I conjecture that there are 3 main factors at play here: the group formation rule itself, strategic misrepresentation of Agreeableness, and knowledge of the group formation rule. If Agreeableness is linked with cooperation and generosity, then the Agreeableness group formation rule could be effective in increasing contributions.Footnote 8 Hypothesis 3 tests this conjecture under each timing condition.
Hypothesis 3. The number of tokens contributed in AGRE H is greater than in RAND.
The number of tokens contributed in RAND is greater than in AGRE L.
The number of tokens contributed in AGRE H is greater than in AGRE L.
However, the effectiveness of the Agreeableness group formation rule could differ depending on when information about the rule is revealed. Consider comparing Before to After, 2 treatments where participants know the group formation rule before the PGG. In Before, the group formation rule is known prior to when Agreeableness is measured. Participants have an incentive to misrepresent themselves in the Agreeableness elicitation to try and be placed in the H group (or to avoid the L group). Agreeableness scores would be compressed and the end result would be more similar to Random group formation in terms of each group’s true level of Agreeableness. Whereas in After, the group formation rule is only revealed after the Agreeableness elicitation, precluding strategic misrepresentation. The Agreeableness group formation rule should be more effective for H groups in the absence of strategic misrepresentation. By the logic of compressed Agreeableness scores, the effect on L groups should be the opposite. The L groups in After, in terms of the Random group formation rule, I posit that the timing has no effect. Hypothesis 4 formalizes these conjectures.
Hypothesis 4. The number of tokens contributed in AGRE Before H is lower than in AGRE After H.
The number of tokens contributed in RAND Before is the same as in RAND After.
The number of tokens contributed in AGRE Before L is higher than in AGRE After L.
Now consider comparing After to Never, 2 treatments that do not have strategic misrepresentation but differ in whether participants know the group formation rule prior to the PGG. Knowing that the Agreeableness group formation rule is in effect means that participants in the After treatment are aware they are grouped with similarly cooperative people. This would increase initial contributions if participants are concerned about being taken advantage of by lower contributors. Higher initial contributions would have a flow-on effect if participants are conditional cooperators. Therefore, Agreeableness group formation should be more effective for H groups when the rule is known in the absence of strategic misrepresentation. Whereas, for L groups, the effect is reversed—if they are aware they are with other potential low cooperators, the concern of being taken advantage of would decrease their initial contribution, and again have a flow-on effect if there are conditional cooperators. Hypothesis 5 formalizes these conjectures.
Hypothesis 5. The number of tokens contributed in AGRE After H is higher than in AGRE Never H.
The number of tokens contributed in RAND After is the same as in RAND Never.
The number of tokens contributed in AGRE After L is lower than in AGRE Never L.
Table B2 presents especially interesting treatment comparisons that isolate the impact of a particular effect while holding other factors constant. This assumes that effects are additively separable, but potential interactions mean that the full 3 $\times $
2 design is prudent.
$\times $
2 design is prudent.
Efficiency—Selected treatment comparisons

Note: Going from the first treatment to the second, $0$
indicates no change, and
$0$
indicates no change, and $-$
indicates that channel has been taken away.
$-$
indicates that channel has been taken away.
B.3. Predictions—Positive perception
Part 3 provides a very conservative test of whether unexpected data use affects participants’ subsequent responses. It is conservative as participants are explicitly informed that Part 3 is the last part of the experiment and that their final payments are already set. If this statement is taken seriously, then participants have no material incentive to misrepresent their personality in their Part 3 responses. However, in the AGRE After treatment, information about how the earlier Part 1 responses would be used in Part 2 was initially withheld and then later disclosed to participants. The unexpected data use from Part 1 may cause participants to change their Part 3 responses in anticipation of additional unexpected data use, despite explicit statements to the contrary. It would be concerning if participants in the AGRE After treatment responded in a different fashion than those in the other treatments, as it would imply a loss of experimental control. Such a finding would raise strong objections about using unexpected data use as a design feature in economics experiments going forward.
The traits elicited in Part 3 all have a clear direction in terms of social desirability. Narcissism, Machiavellianism, and Psychopathy are clearly negative traits from the perspective of society, while Honesty/Humility is considered a positive trait. I propose that if a participant anticipates unexpected data use, then they would misrepresent themselves towards what is more socially desirable. I propose 2 channels that would influence a participant’s beliefs that their Part 3 responses will be used to affect something in the experiment. The first channel is whether participants are aware that the data from personality questions have been used for something in the experiment. These are participants in the AGRE Before and AGRE After treatments, as they know the group formation rule in Part 2 was based on their Agreeableness score from Part 1. The participants in the other treatments remain Unaware that personality responses could be used in other parts of the experiment. Participants that know their personality questions in Part 1 were used in Part 2 could suspect that their personality responses in Part 3 are also used in some fashion, and misrepresent themselves accordingly. The second channel is whether the use of the personality data was unexpected. Participants in AGRE Before expected this data use when completing Part 1, as they were told of the Agreeableness group formation rule in advance. Whereas, participants in AGRE After did not expect it, but found out about it after completing Part 1. Participants in AGRE After may think that their Part 3 responses will be used in some way that has not yet been revealed, and thus would be the most likely to misrepresent themselves in Part 3. Table B3 describes which channels are present between each group of treatments.
Misrepresentation in Part 3—Treatment comparisons

Note: Going from the first treatment to the second, $+$
indicates that channel has been added,
$+$
indicates that channel has been added, $0$
indicates no change, and
$0$
indicates no change, and $-$
indicates that channel has been taken away. The Unaware grouping includes all treatments except for AGRE Before and AGRE After.
$-$
indicates that channel has been taken away. The Unaware grouping includes all treatments except for AGRE Before and AGRE After.
I aggregate each individual into one measure of ‘Positive Perception’, which positively weights Honesty/Humility and negatively weights the Dark Triad traits. Based on my previous reasoning, I posit the following Hypotheses about Positive Perception:
Hypothesis 6. Reported Positive Perception is higher in AGRE After than in AGRE Before.
Hypothesis 7. Reported Positive Perception is higher in AGRE After than in Unaware treatments.
Hypothesis 8. Reported Positive Perception is higher in AGRE Before than in Unaware treatments.
C. Summary statistics
Summary statistics

Note: Standard deviations in parentheses. Low and High Agreeableness groups reported separately for AGRE treatments. Categorical variables are presented as is for summary purposes only and are otherwise unadjusted unless specifically noted. Female = 1 if reported gender was female, 0 if reported male, and not included otherwise (for this specific statistic only). Age is reported in years. Num. Prev. Exp. is the number of previous experiments the participant reported they had participated in. Year At Uni.: 1 = First year, 2 = Second year, 3 = Third year, 4 = Fourth year +, 5 = Graduate student. GPA: 1 = [1, 1.5], 2 = [1.51,2.5], 3 = [2.51, 3.5], 4 = [3.51, $\infty $
), 5 = N/A. Enjoyment: 1 = Disliked the experiment a lot, 2 = Disliked
$\infty $
), 5 = N/A. Enjoyment: 1 = Disliked the experiment a lot, 2 = Disliked $\ldots $
a little, 3 = Did not like or dislike, 4 = Liked
$\ldots $
a little, 3 = Did not like or dislike, 4 = Liked $\ldots $
a little, 5 = Liked
$\ldots $
a little, 5 = Liked $\ldots $
a lot. Num. Fail CompQ 1 is the number of times that answers with at least one error or missing value was submitted over all questions on the first page of comprehension questions, similarly for Num. Fail CompQ 2 but for the second page. Abbreviations: Tot. = Total, Contr. = Contributions, Num. = Number, Prev. = Previous, Exp. = Experiments, Uni. = University, GPA = Grade Point Average, and CompQ = Comprehension Questions.
$\ldots $
a lot. Num. Fail CompQ 1 is the number of times that answers with at least one error or missing value was submitted over all questions on the first page of comprehension questions, similarly for Num. Fail CompQ 2 but for the second page. Abbreviations: Tot. = Total, Contr. = Contributions, Num. = Number, Prev. = Previous, Exp. = Experiments, Uni. = University, GPA = Grade Point Average, and CompQ = Comprehension Questions.


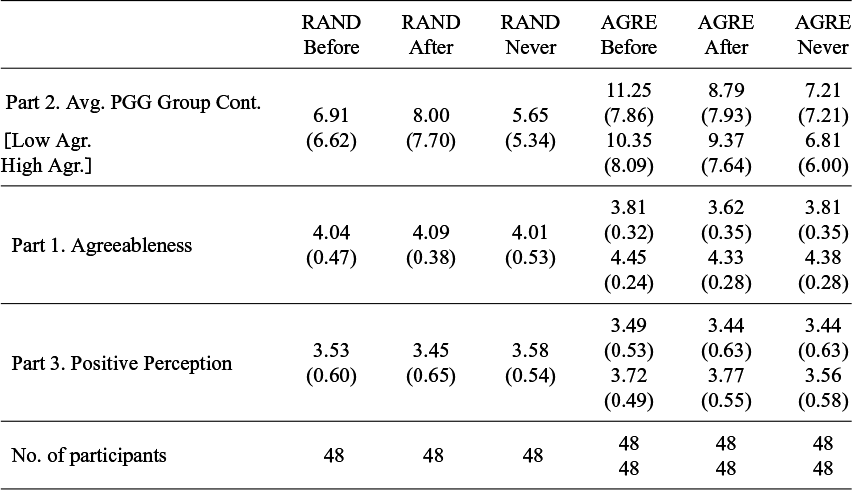
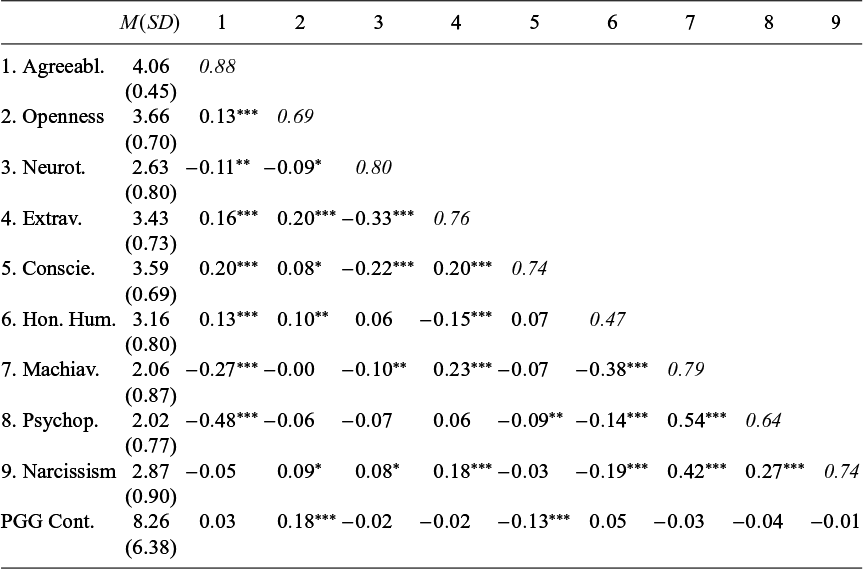


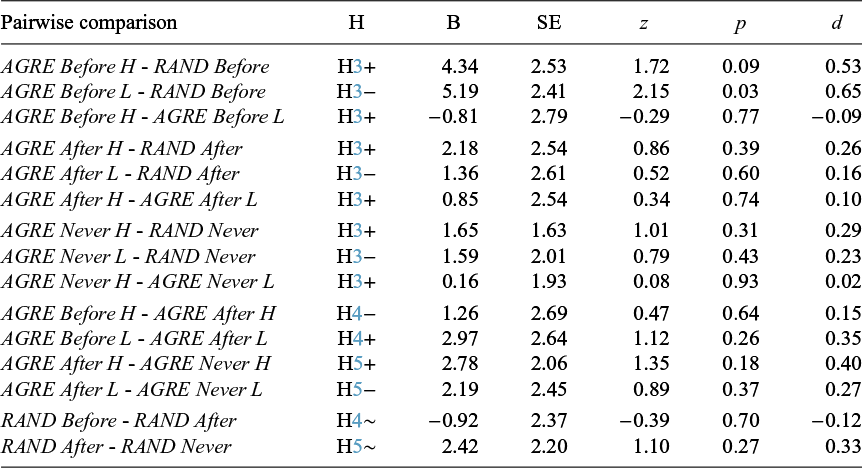
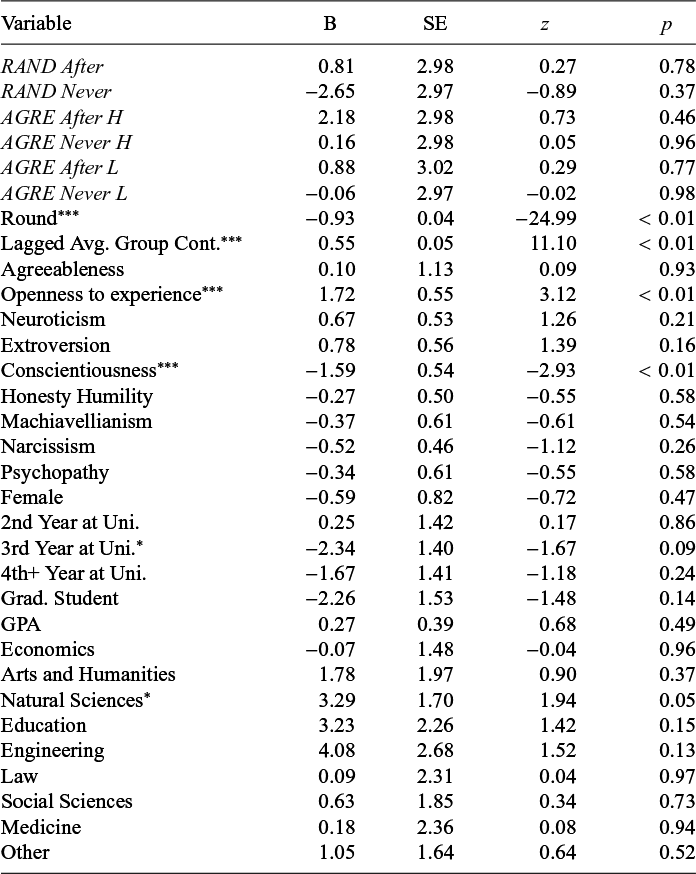
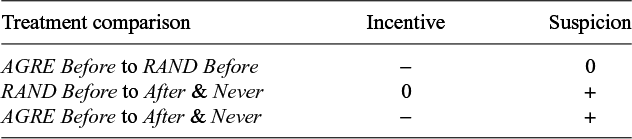
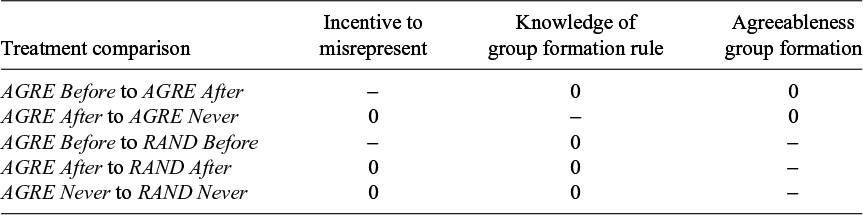
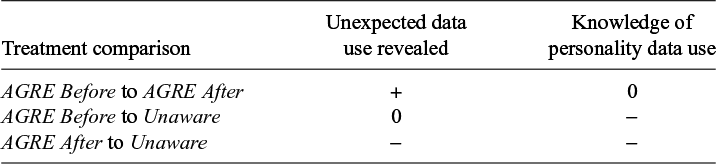
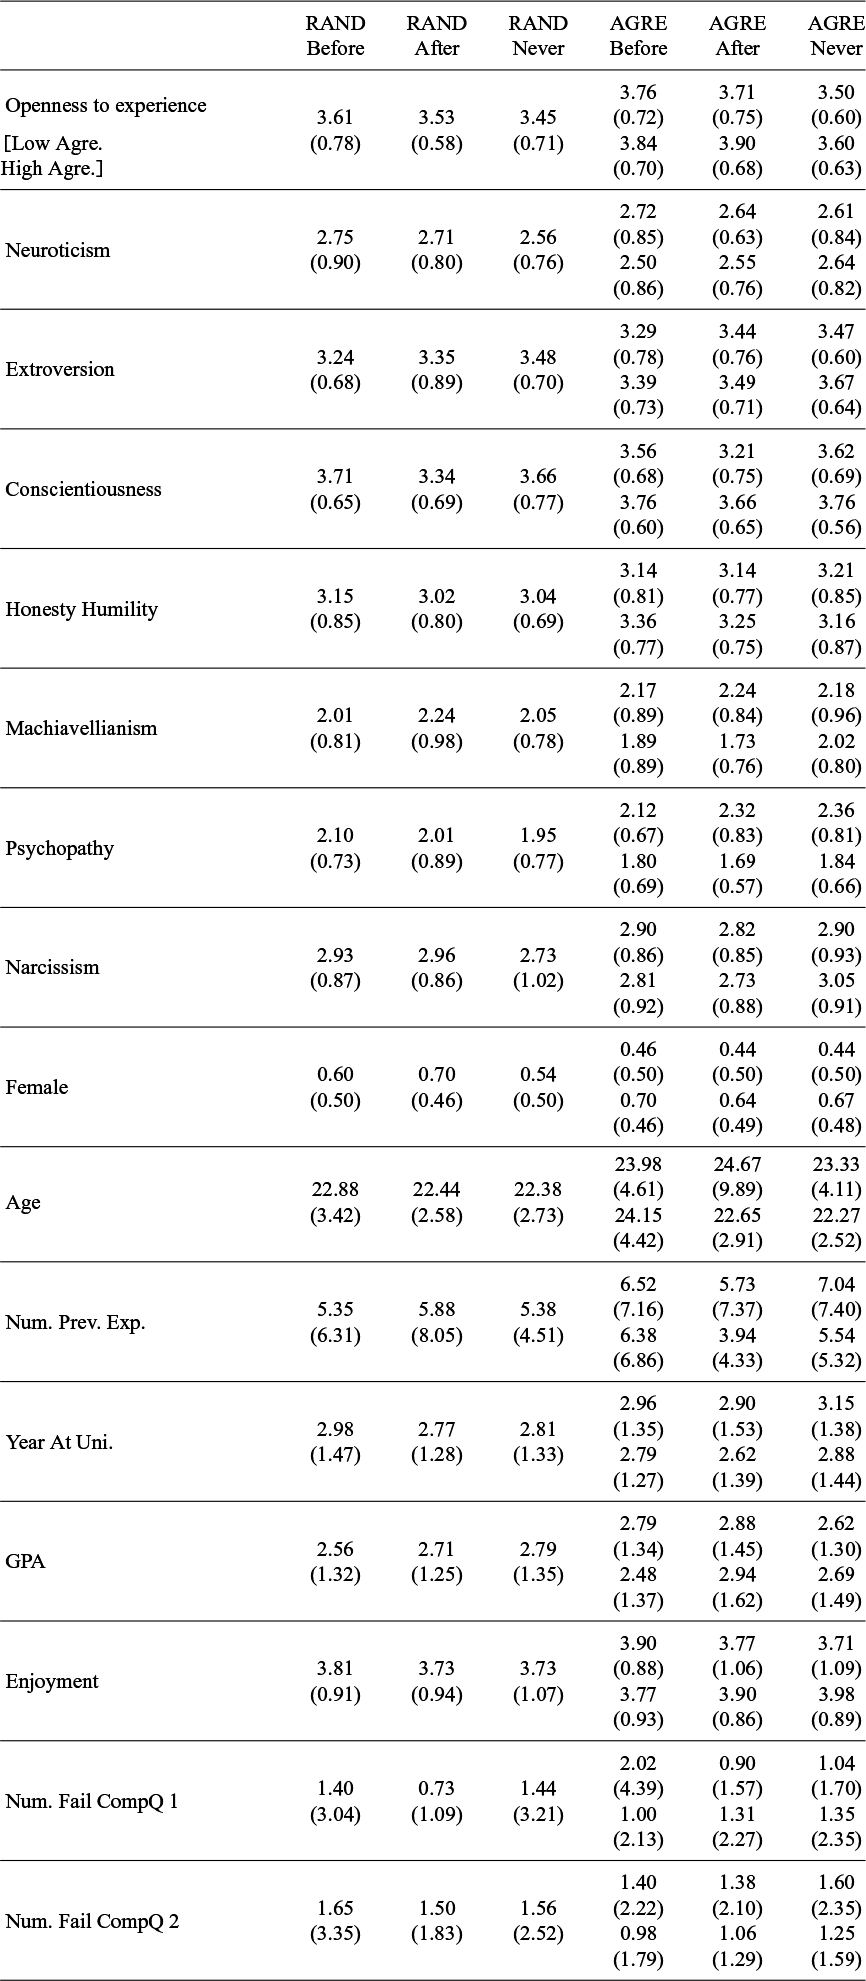


 Open access