

Several recent incidents – from publishers’ decisions to censor articles on their Chinese websites to Cornell University's suspension of collaborations with Renmin University – have raised concerns about a deteriorating climate for scholarly research in China,Footnote 1 potential attempts by the Chinese Communist Party (CCP) to export censorship,Footnote 2 and the potential for Chinese influence to corrode academic freedom in Western educational institutions.Footnote 3
Currently, however, there are no systematic data on how common it is for China scholars’ work to be affected by repressive measures taken by the People's Republic of China (PRC), whether through publication censorship, visa denial or another mechanism. Many are aware of several high-profile cases – for example the visa-blacklisting of scholars who helped publish The Tiananmen Papers or who participated in an edited volume on Xinjiang – or know a colleague who has encountered difficulty when presenting an invited talk or has had passages excised from a Chinese-language version of their work. Methodological advice on fieldwork in China, similar to advice on research in other non-democratic contexts,Footnote 4 often stresses data constraints but does so without providing a systematic sense of how common or representative these constraints are.Footnote 5 As a field, we simply lack good data on how (and how often) scholars’ work is affected by the non-democratic, sometimes repressive context of Chinese politics.
Data on this question can inform scholars’ work in two ways. First, researchers who understand the likelihood of encountering repression during their work can more accurately calibrate risk, protect interlocutors and develop appropriate strategies to manage sensitive inquiries – a particularly important foundation for early-career researchers still learning to navigate research in China. Conversely, accurate data can prevent the field from exaggerating or misrepresenting risks, thereby helping to minimize the dangers of either unnecessary and problematic self-censorship or unfounded prejudice towards Chinese individuals.Footnote 6
A second way to view this data is as a case study of attempts by the CCP to manage its image and information about its rule, at home and abroad. Previous studies of propaganda and censorship have examined how the CCP manages foreign presence and how it seeks to control and shape narratives of its rule in domestic and global media.Footnote 7 The data presented in this paper reveal, at minimum, that the Chinese political system constrains and moulds knowledge production not just in media venues but in scholarly ones as well.
Below, we present findings from the China Scholar Research Experience Survey (CSRES), an original survey that offers the first systematic data on how often China scholars encounter repressive actions by the Chinese government and catalogues the strategies that they employ in response to these challenges. Our core findings are as follows.
First, repressive experiences during research are a rare but real phenomenon and collectively present a barrier to doing research in China. Roughly 9 per cent of international scholars who conduct research in China reported that they had been “invited to tea” by authorities in the past decade; 26 per cent of scholars who conduct archival research reported being denied access; and 5 per cent reported experiencing difficulty obtaining a visa.Footnote 8 Problems with access to China itself, access to subjects and materials, and surveillance and monitoring are common enough to be of concern.
Second, there are boundaries to the CCP's use of repression against international researchers. Although temporary detention and questioning is common (9 per cent), long-term detention and physical harm are quite rare. Similarly, although ~5 per cent of respondents reported having difficulty obtaining a visa at some point, a much smaller number reported formal “blacklisting” or being banned from China for an extended period (12 of 562 respondents, 2.1 per cent).
Third, different repressive experiences appear to follow different logics. Access to China itself (visa issuance) does correlate somewhat with research topic, suggesting some broadly understood guidelines that produce relatively consistent (although far from uniform) decisions. Experiences inside China involving surveillance and potential intimidation, however, appear to emerge from localized strategies of risk management by lower-level officials – with the exception that scholars working in areas with heightened security (such as Xinjiang) appear systematically more likely to encounter authorities. Restrictions on access to materials appear to result from a combination of national trends (digitization as a method of archival sanitization, for example) and local variability.
Fourth, ambiguity plays a major role in shaping researchers’ perceptions and behaviour. A majority of respondents (67 per cent) believed their research to be sensitive, even though most reported no repressive experiences (57 per cent) and had never received direct indication that their work was sensitive (68 per cent). We also find that it is more common for a colleague to be warned about the sensitivity of an international researcher's work (12 per cent) than for the researcher to be warned directly (9 per cent). Our data demonstrate that relational repression, control parables and the use of uncertainty to shape political boundaries are not just reserved for use within China but also extend to China's management of relations with the outside world.Footnote 9
Fifth, a majority of respondents (68 per cent) identified self-censorship as a concern for the field, but provided several important correctives to accusations of careerism and cowardice. Respondents stressed the moral requirement to protect one's interlocutors and subjects. Many also articulated a distinction between the ethical imperative to avoid self-censorship in the core tasks of academic work versus what they perceived to be a more discretionary choice about adopting publicly critical stances, especially on topics outside an individual's research expertise. Finally, respondents noted that political pressure from China, while relevant, was not as influential as other disciplinary and institutional factors: an important piece of context in understanding the field's scholarly output.
Research Design and Sample
We conducted an online survey of China-focused social scientists in spring/summer 2018. Our population of interest concerned international “social scientists who research China,” erring towards a broad definition of social scientist. By international, we mean scholars based at institutions outside of mainland China, including both foreigners and Chinese citizens. Through a combination of text scraping and manual research, we obtained names and email addresses of social scientists who focus on China from the following sources: Association for Asian Studies members; scholars who presented on China at recent major disciplinary conferences; scholars whose work was published in The China Quarterly in the past decade; China-focused PhD-level scholars at major think tanks; and a crowdsourced list of female China experts. To ensure that we had a sufficient number of respondents for valid inference, we limited the survey scope to scholars working in North America, Western Europe, Australia, New Zealand and Hong Kong. Our sampling methods likely omitted some early-career scholars and are English-language and Western- or North America-centric. We believe ours was a reasonable approach to generating a sampling frame but wish to transparently note these limitations.
After removing duplicates, invalid contacts and “false positives,” we emailed 1,967 individuals in May 2018 to invite participation; the email included a unique identifying link to the survey. We sent two follow-up emails and closed the survey in late June. We received 562 complete responses, an effective response rate of 28.6 per cent, which is within the normal range for an online survey.Footnote 10Table 1 provides summary statistics for our sample. The sample contains a broad range of scholars who study contemporary China, including representation from different disciplines, research approaches and topics. The response rate is relatively stable across personal attributes.
Sample and Population Attributes

Notes:
The table shows sample and population attributes for the CSRES. Sampling frame only includes scholars based at institutions in the US, Canada, Europe, Australia, New Zealand and Hong Kong. Rank information not collected for sampling frame.
The CSRES survey itself had three blocks: questions on personal background (birth decade, discipline, rank, gender, etc.); experiences of 13 different types of repression in the past ten years; and strategies to manage potentially sensitive research, including protection of human subjects, institutional support and self-censorship. The survey focused on research experiences, meaning that it did not ask about all potential forms of Chinese influence on academic institutions (such as campus speakers, institutional partnerships in China or Confucius Institutes). The survey instrument contained a combination of structured questions and open-ended responses in order to enable systematic comparisons as well as analysis of more nuanced patterns underneath the quantitative results. It was approved by institutional review boards at both the University of Missouri and Princeton University.Footnote 11 Further detail on our survey design choices and a complete copy of the survey instrument appear in the Supporting Information, which is available on the authors’ personal websites.
Results
Our analysis proceeds in three parts. First, we document scholars’ experiences of repression and explore potential determinants of variation. We then describe scholars’ strategies for managing sensitive political issues, including a discussion of self-censorship. We close by presenting collective “advice from the field.”
Repressive experiences during research
CSRES data suggest that repression during research is a rare but real phenomenon. Figure 1 shows the proportion of scholars who experienced different forms of repression during research in the previous ten years, grouped into the following categories: restrictions on access to China itself; restrictions on access to research materials or subjects; and surveillance and intimidation.
Experiences with Research Repression
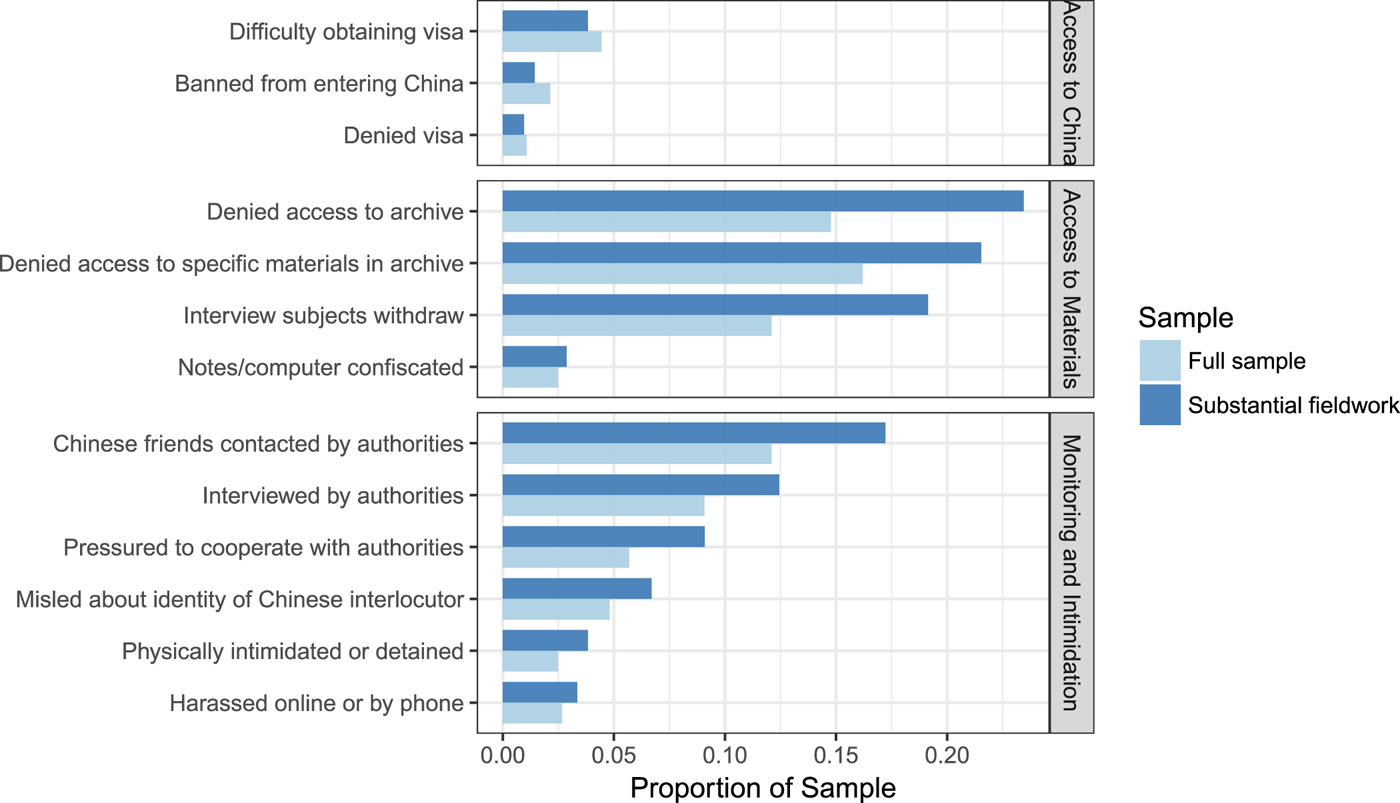
The most common experiences reported are being denied access to particular materials in an archive or being denied access to an archive altogether. This is followed by the unexpected withdrawal of interview subjects, and Chinese colleagues being contacted about the researcher's work.
Restrictions on access to China
Denial of access to China itself – via visa denial or delay – is an often discussed form of interference with scholars’ research. It is also one of the most severe, with potentially career-altering impacts. Our data suggest two key findings: the Chinese government does restrict visa access for work it considers potentially problematic, and the most common form of restriction is temporary visa “difficulty,” rather than outright denial or long-term blacklisting.
Among the CSRES sample, 5.1 per cent reported a problem with obtaining a visa sometime in the past decade. Although it was not always clear that the scholar's research had led to this difficulty, respondents often believed or received informal indication to that effect:
I was invited to a conference in XXXX and assured that … the authorities had approved my going there. However, in my visa app I foolishly said that after the conference I would go briefly to YYYY before returning home. This threw the consulate people into a tizzy. They phoned me, phoned my host, phoned my potential host in YYYY, trying to find out what exactly I would do there, and were never able to satisfy themselves sufficiently to issue the visa. I think they tried to get the Ministry of Foreign Affairs to approve it and didn't get an approval in time for the conference.
[Multiple] visa applications have been “delayed,” so I couldn't take part in the official event I was invited to (I had an invitation letter from an official Chinese institution every time).
I had received a formal invitation from XXXX provincial government, but [my] visa was refused. There was no indication on my passport that the visa had been denied. I was verbally told at the embassy visa section that my application wasn't approved.
Out of 562 survey respondents, six (1.2 per cent) reported being denied a specific visa request within the last ten years. Often, however, the Chinese government did not issue a formal denial; the visa was simply never issued. One respondent noted that this theoretically allows individuals to apply for visas in the future without having to tick the “previous denial” box on the application. Thus, although we asked respondents to separately report visa “denials” and “difficulty” obtaining a visa, the practices of PRC embassies and consulates render the distinction blurry, and perhaps trivial.
Twelve individuals (2.1 per cent) reported a belief that they had been blacklisted or banned from the mainland in the past ten years. They reported being involved in research on human rights, Tibet, Taiwan, elite politics or the Mao period. About half were junior/untenured. Another 14 researchers answered “Maybe/Unsure”; their research topics were broader, but most touched on issues of ethnicity or foreign policy and security. We note here that long-term blacklisting may have cross-cutting effects: it can have severe consequences for a scholar's career but can also give a scholar the sense that they have “nothing to lose” by being openly critical. By contrast, more limited visa denial may actually have a more constraining effect by incentivizing scholars to remain cautious.
In short, the Chinese government does appear to use visa issuance strategically in order to manage researchers’ access to the country and set boundaries, both formally and informally, for their conduct while they are there. A non-trivial number of scholars have experienced resistance when trying to obtain visas for specific conferences or research trips while never being formally denied permission to travel to China.
Restrictions on access to research materials and subjects
Constrained access to people/materials is fairly common: 21 per cent of the CSRES sample reported being denied access to an archive or archival materials. Of those who use archival methods (77 per cent of the CSRES sample), 26 per cent had encountered such restrictions; in history, where archival access is central, the figure is 41 per cent. Moreover, many respondents who regularly conduct archival work reported that these incidents happened “too often to detail.” Our survey documented over 150 separate instances that occurred in the past decade.
I was conducting research in XXXX's municipal archive, and had requested to read back copies of the XXXX Ribao (nothing else). On the second day, I was asked to present additional paperwork (that I didn't have); when I didn't have it, the archivist went to the office, returned, and said that I needed to go downtown to the government building to speak to an official. He reviewed my papers, asked me some questions, and then told me that I could not go back to the archive.
The head of the reading room at the XXXX also accused me of trying to steal their “national treasures” when I asked for some documents to be photocopied.
I was denied access to the XXXX ancient text office. The manager told me, “even if you knew the governor, I still wouldn't let you in.”
Some researchers reported initially being granted access, only to have their entry revoked once their visit came to official attention.Footnote 12
In instances where access was granted to an archive but not to particular materials, denials seemed based primarily on topic. A number of respondents documented access being permitted for one document but denied for another.
Denied access to specific materials related to a certain ethnic minority group. Other materials in same provincial library were not a problem. Very selective denial of access.
XXXX documents that have not been scanned are now off limits – this is justified as protecting the documents, but in practice it functions to censor what kinds of materials scholars may use; it appears to be a nationwide policy (not allowing scholars to see original documents from XXXX).
I was not granted access to the major portion of an archive at a prominent university research centre. My Chinese colleagues informed me that the situation was too sensitive and they worried about how their own activities would be affected if I was granted access.
Although respondents discerned patterns related to the topics of materials requested, archivists rarely cited sensitivity when denying access; instead they cited digitization or other internal processes.
Fairly typical response that material is not available. Often times, reasons are that material is being digitized, or “organized” in some way. In some instances, through back channels (usually by more junior personnel), I was made aware that the material was indeed available but not to foreign scholars.
Archive closed on short notice supposedly due to digitization. Contacts within China told me otherwise (clamping down).
The archival director said that the collection was undergoing digitization and informed his staff members to be careful about what they were sharing with me.
Access to particular materials also appears to have changed across time: respondents noted that digitization has resulted in the sanitization or removal of previously accessible materials, and reduced availability of archival materials, especially for foreign researchers.Footnote 13
A district level archive – one in which I had worked before and knew people – refused to let me view any materials, or even the index to supposedly open materials.
It has become incredibly difficult to conduct archival research in China. From 2012 to 2018, it has become increasingly difficult. I think it will soon be impossible … In China, I've had better luck at provincial archives and libraries. I've wasted a lot of time trying to get sources at large municipal or national archives.
Around two-thirds of the CSRES sample employed interviews or participant observation, and 17 per cent of these researchers have had interview subjects withdraw in an unexplained manner. (This was most common in political science and anthropology.)
One of my informants had arranged for me to interview their XXXX and friends. This was something that had been planned months earlier. When the time of the interview arrived, my informant backed out with a very odd excuse that didn't seem true. Because I did not want to put my informant in danger, and I knew this was a possibility, I didn't insist. I had several similar experiences from 2009 to 2012.
Researchers typically cannot discern with certainty if interviewees cancel because they have been “spooked” or discouraged by the authorities, or for another unrelated issue.
It is common for international researchers to have a Chinese colleague or friend contacted about their work: 12 per cent of our overall sample, and 17 per cent of those doing intensive fieldwork. Warnings on political sensitivity are, like the visa process, often conveyed via indirect channels and language, rather than directly through formal procedures; relationships rather than documents and institutions are used to communicate boundaries. We interpret this as a form of “relational repression” directed at foreign presence in China, and one that invokes ambiguity about boundaries, as well as worry about colleagues and friends, to induce caution and convince scholars not to push too hard.Footnote 14 This dynamic appears to create significant ripple effects on scholars’ risk management strategies (see below).
Surveillance and intimidation
Our data show that the Chinese government does monitor researchers, often making them aware of this monitoring during their research. As of autumn 2018, however, the CCP did not routinely employ long-term detention or physical violence against international scholars.
About 9 per cent of China scholars (51 respondents) reported that they had been interviewed by the authorities (being “invited to tea”) in the past decade.
I had been interviewing participants in an ongoing protest in an out of the way industrial area and was waiting to try to talk to someone who was a target of the protest. An officer approached me while I waited. Then, he asked for my identity papers. He also asked to see my research notes and explain what they said. The policeman then took me to a nearby police station and he and his colleagues asked me questions for about an hour or an hour and a half.
Our research group, consisting of Chinese and foreign scholars, was conducting survey research in XXXX. Some elements of the research topic were considered politically sensitive. We were contacted by the county government, spent a full day “having tea” and discussing the project, and finally were asked to leave the county. We complied.
In conducting my fieldwork, I had to develop close ties to the local police. They had knowledge of my being there and so I had to meet with them regularly to “update” them. This took the form of brief meetings over lunch or tea about once every 3–4 months.
A day after being admitted to an archive, the dean of my host institution invited me to a meeting at which we discussed my research in the presence of a middle-aged man whose job title was not disclosed to me, and the dean indicated that access to that archive was “inconvenient” and would no longer be possible.
It was one of those regular interviews I had experienced in the past. Four gentlemen from the National Security Bureau visited me in one of the offices in a local university that was hosting me. The conversation was fairly friendly and the questions did not seem to have any particular focus. Some questions I recall were regarding (1) my circles of friends – such as their professional info and their respective research interests, (2) my religious activities, such as whether or not I had been to churches, and (3) my daily life. The conversation lasted about two hours and two of the people were taking notes with pen and recorders.
These experiences vary along several dimensions: intensity, duration, format/setting, perceived identity of interlocutors, etc. Scholars reported interviews or conversations with the local public security bureau, local officials, members of state-owned media, and individuals who did not formally identify their occupation. Conversations occurred in restaurants, hotel rooms, government or university offices, police stations, and by phone.
Despite this diversity, researchers reported some common elements. A scholar attracts attention during their research when attending a protest, requesting archival access, giving a talk, etc. Agents of the local government in turn respond, gather information, and often seek an end to, or place boundaries around, research activity. We note that 9 per cent of our sample reported direct conversations with authorities, whereas 12 per cent reported having friends/colleagues contacted; the two appear to be correlated (r = .30).
A smaller percentage of the CSRES sample (~2 per cent) reported having their computer or materials confiscated. Others described having notes temporarily taken and reviewed by archivists, officials or local police:
This happened at the Beijing airport customs. I flew back to Beijing from Hong Kong. My books and conference notes were searched, and a book on XXXX was confiscated.
While arranging to ship research materials back to the US, my materials were briefly confiscated, and I was taken to a side room and told that some of my materials were sensitive and could not be taken out of the country. After some back and forth, my materials were returned to me, and I shipped them another way.
The policemen took my notebook and read its contents (which were in English). They then returned it to me.
Archivists at the XXXX Archive in XXXX confiscated my notes temporarily (several days) to review them before allowing me to complete my research visit to the archive.
A small number (2.5 per cent, 14 scholars) reported instances of temporary detention or physical intimidation.
On a short research trip to XXXX I was prevented from traveling to a research location. The police officer said “you have a visa problem.” He said I had a business visa, when in fact I had a travel visa. He then took pictures of me with my passport and forced me to get into a taxi after taking pictures of me with the taxi driver and with the license plate of the car. During this process he ordered me to stand in particular locations and turn my back to him and the person he was speaking with.
I was visiting XXXX, a town in west XXXX, open to foreigners and tourists. I was not conducting interviews but privately studying XXXX with a local. I was awakened one morning, placed in a van with two police officers, and driven to XXXX. I was not told the reason for my detention. The trip took two days, and we spent the night at a hotel. In XXXX, I was detained for four hours and interviewed by police. My camera was confiscated temporarily while the police reviewed the images. After four hours and much conversation with the police, I was released. I believe the police thought that I may have been a journalist.
I was detained for three days in a local hotel. [There was a] group of security staff (divided into two subgroups, one interviewing and one monitoring). The main focus was on my overseas study and my research. [I was] threatened [with losing my] personal freedom and not being able to leave and enter mainland China if I do not cooperate with them. I pretended to cooperate, and then reported to my university and the police when I came back to XXXX. The thing seems to be temporarily solved, but I was [advised] by the police not to go back to China in the short term.
We draw three conclusions from the above. First, although we have redacted geographic information in order to protect respondent anonymity, these higher-impact events occurred disproportionately in places with heightened security presence, such as Tibet and Xinjiang.
Second, the 13 types of repressive experiences documented are not equivalent in their professional or personal impact on the scholars who experience them, or on the interlocutors who the scholars might have worked with to conduct their research. Detention may be relatively unusual, but its impact is probably higher and longer-lasting than being prohibited from viewing a particular archival document.
Third, we do not find evidence that scholars who were detained were physically harmed, and the CSRES documented temporary detention rather than long-term imprisonment. At the time we conducted the survey (mid-2018), our data did not show that torture, forced confessions, overt threats to family members or exit bans, etc. were regularly used against international scholars, although we note concern since then that the December 2018 detentions of Michael Kovrig and Michael Spavor could signal a change in CCP practice.Footnote 15
Determinants of variation in repressive experience
The CSRES data revealed several patterns in the use of repression against international scholars in China.
First, repressive incidents are more common the more the scholar works in China. For all categories except visa denial, the percentage of repressive experiences is higher among scholars who have conducted substantial fieldwork.Footnote 16 (Visa denial makes sense: a scholar denied a visa cannot go to China, and therefore will not have these other experiences.)
Second, we do not find strong evidence that repressive experiences among international scholars have become more common under Xi Jinping 习近平 (2012–present). We asked respondents to provide approximate dates for a subset of experiences (Figure 2). Scholars’ open-ended responses highlighted their overall perception that China's research climate is becoming more constrained. In our data, however, the only area to show a clear increase was denial of access to specific archival materials, where the average number of incidents since 2014 was notably higher than the average from 2008 to 2012.
Documented Incidents of Research Repression over Time

We do not, however, interpret our data as saying that there has been no change to China's research environment. Most repressive experiences (visa denial, intimidation, etc.) are rare enough that temporal trends should be interpreted with caution. Moreover, respondents have additional information, not captured by the CSRES survey, which may inform their judgements, such as pressure felt by Chinese colleagues, difficulty finding interviewees, or challenges with asking certain questions on surveys administered by Chinese firms.
Third, research topic plays some role in repressive experiences, but not a deterministic one. Figure 3 shows the most frequent research keywords used by scholars who had been interviewed by the authorities or who had experienced visa issues of any kind. Scholars with visa issues disproportionately study topics such as ethnicity, minorities, religion and human rights; however, topics such as the environment, foreign relations and gender appear also. The topics of scholars interviewed by authorities overlap. Words like “Xinjiang,” “Uyghur” and “Muslim” also emerge more prominently, consistent with the finding that scholars working in that region are more likely to encounter the security apparatus.
Research Keywords for Respondents with Experiences of Repression

In other words, researching certain topics can generate repressive experiences, but repressive incidents are not limited to scholars working on known “sensitive” topics – and conversely, plenty of scholars working on ethnicity, religion and human rights have not experienced repression.
Similarly, repressive experiences were not strongly associated with demographic/professional attributes (Table 2). Generally, anthropologists and political scientists are more likely to experience repression than economists. This may reflect disciplinary differences in both topics and fieldwork expectations: only 21 per cent of economists in our sample had spent more than 12 months in the field within the past decade, compared with 38 per cent of the full sample. Citizens of the PRC are less likely to be denied archival access or be interviewed by the authorities, but they face slightly more pressure to cooperate with authorities. Academic rank does not play a major role; if anything, repressive experiences are slightly more prevalent among more junior researchers.
Experience with Research Repression by Subgroup

Notes:
The table shows the percentages of different subgroups within the sample that have experienced different incidents of repression in the past ten years. Data are taken from the full sample of the CSRES (n = 562).
Perceptions and indications of sensitivity
CSRES data reveal that most China scholars are concerned about the sensitivity of their research. A majority of respondents believed their research to be sensitive (“somewhat sensitive” 53 per cent; “very sensitive” 14 per cent). This percentage is highest among anthropologists and political scientists (Figure 4). Most respondents, however, had not received direct indication from the government that their research was sensitive, and nearly 60 per cent had never had a repressive research experience.
Perceptions of Sensitivity

This is not to say that China scholars are mistaken about sensitivity (although some may be). Rather, the observed patterns reflect the ambiguity discussed above, where researchers, unclear about how their research is perceived, must interpret and act on indirect signals, with potentially high stakes. Respondents recounted understanding that their research was considered sensitive via the following kinds of interactions:
I've heard through the grapevine that my research is considered politically sensitive by Chinese officials.
I have heard from people not directly involved with my research that it may be politically sensitive, but have never had any immediate indications from research contacts or respondents that it is.
I have encountered resistance from archive officials at provincial-level and county-level archives, especially in XXXX China, when I visited their archives and attempted to use them for historical research related to 19th-century history. But it is always difficult to determine if their resistance is because: (a) they think my research topic is sensitive; (b) they know I'm a foreigner and therefore think that whatever research I do is sensitive; (c) my presence is merely an unexpected inconvenience which will require them to do more work; or (d) some combination of the above. I have never been told directly that my research topic is sensitive. However, I have been told that some portions of archival collections are simply off limits to me.
At the XXXX Municipal Archives, an archivist was assigned to vet every file I requested before I could see it. An undercover PSB officer was offered to me as a research assistant. Informants were questioned after speaking to me.
Between 20XX and 20YY, I was able to visit local field sites and interview officials and citizens and/or visit local archives through the normal routes (introduction letters from known scholars or institutions, connections through other officials, etc.). After 20YY (or so), this became more difficult, and after 2012 nearly impossible. I say “maybe/unsure” because I have never been sanctioned by the Chinese government or officially prohibited from doing research, but local officials clearly signal that they are uncomfortable meeting me (or even having me visit their county or district) because of political sensitivity, even officials I have been in contact with for 10+ years.
Local interlocutors are most often responsible for signalling sensitivity; they almost always do so verbally and informally, rather than formally and in writing.
Often research is not blocked, but is allowed to proceed while being monitored. This allows authorities to gather information on the researcher's interests, activities and intentions, while still ensuring that he/she does not cross certain boundaries. This often adds to perceptions of ambiguity, as noted below:
I have been pulled aside by various officials and told about the sensitive nature of the work, in part to explain why I could not read/access particular documents/people. But I have been able to do research, so clearly there are mixed opinions about the sensitive nature of the research among officials.
I think sometimes the image of censorship or repression looms larger than the reality, as I reflect on my own work. At the same time, authoritarian states are adept at creating fuzzy boundaries, precisely because they know that people will self-censor and stay far from what they may perceive to be a boundary, in order to avoid crossing it.
You never know where the border is; you only know when you have crossed it.
Even with the systematic data gathered by the CSRES, delineating what is in or out of bounds is a highly probabilistic exercise. Ambiguity, indirection and the use of Chinese interlocutors to communicate sensitivity benefit the Chinese party-state, as these approaches raise the spectre of consequences (to self and others) in the minds of international researchers.Footnote 17
Research strategies
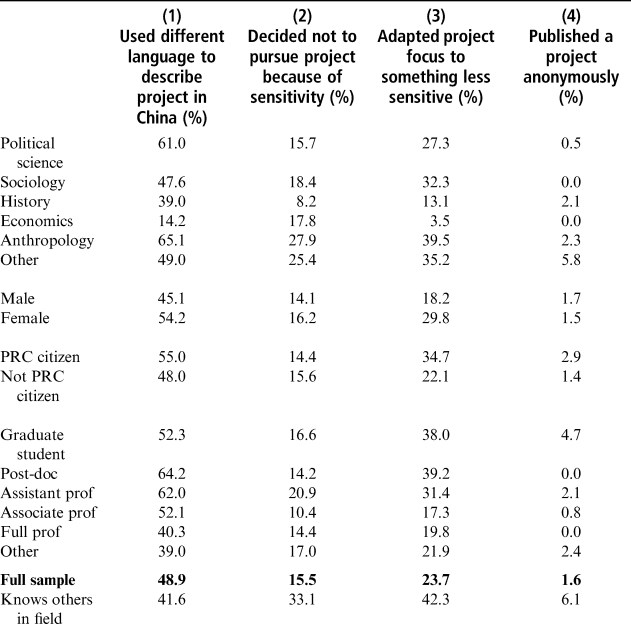
A significant number of scholars deal with China's repressive research climate by adapting their research conduct and presentation. Table 3 shows what percentages of the CSRES sample have adopted various strategies, by subgroup. Scholars commonly use different language to describe projects in China (48.9 per cent). Other tactics include adapting a project's focus away from the most sensitive aspects (23.7 per cent) or even abandoning a project entirely (15.5 per cent). Few people publish anonymously (1.6 per cent).
Strategies for Managing Sensitivity of Project
Notes:
The table shows the percentages of the different subgroups within the sample that have adopted different strategies for managing research sensitivities sometime within their academic careers. The final row indicates the percentage of respondents who know someone in the field who has adopted that strategy. Data are from the full sample of the CSRES (n = 562).
We also asked respondents if they knew of others who adopted these strategies. These estimates were higher, although not 100 per cent; we note that multiple respondents may have been thinking of the same colleague when answering “yes” to one of these questions.
Minor variations appear across subgroups. For example, economists are less likely to use these strategies; anthropologists and political scientists more likely. Again, this might be in part because of differences in fieldwork expectations across disciplines. Women and PRC citizens are slightly more likely to employ different language for projects or to adapt a project's focus; junior scholars are somewhat more cautious than senior ones. Although the variations are minor, the data do suggest that vulnerability, whether regarding physical safety, personal or familial exposure to political consequences, or professional trajectory, makes the adoption of adaptive strategies more likely.
Perceptions of self-censorship
The China field has recently interrogated its own levels of self-censorship.Footnote 18 A majority of CSRES respondents (70 per cent) agreed that “self-censorship is a problem in the China field;” 22 per cent were neutral and 7 per cent disagreed.
A significant number of respondents, however, answered, “I don't self-censor.” Some mentioned that the relative freedom of foreign academics assigns them the responsibility of speaking scholarly truth to official Chinese power and exposing problems where others cannot. One scholar wrote, “Keep speaking out. No one is better positioned to do so than researchers located outside of China.” Another respondent noted that blacklisting or repressive experiences were regarded as a “badge of honour” among certain scholarly communities, certifying one's intellectual honesty. A large number of respondents treated resistance to self-censorship as a principled exercise in intellectual integrity and a moral responsibility.
Several respondents also noted that China's repressive climate does not seem to have skewed research towards excessively positive interpretations of the CCP; in fact, they suggested it might be having the opposite effect.Footnote 19 Sensitive topics attract scholars’ attention precisely because they suggest something important enough to warrant concealment, and many researchers are drawn to developing creative ways to address questions that remain unanswered.
The survey's open-ended responses offered considerable clarification and complexity of thinking on the morality of self-censorship. (Given the difficulty of fairly representing all views, we present the full comments in the Supporting Information.) At a baseline level, scholars differentiated risks clearly, noting that threats of losing access are of greater professional consequence for junior scholars – and more importantly, that risks overall are higher for those living in mainland China, holding PRC citizenship, or with family inside China. One respondent stated plainly, “We all [self-censor]. We all must. If you're like me, with family in China, there's really no choice.” Again, open-ended qualitative evidence reinforces the survey's quantitative finding that vulnerability correlates with the use of adaptive tactics.
Many respondents emphasized that decisions about how to frame research and what to say publicly were grounded in ethical considerations for others and a responsibility to protect interlocutors’ and colleagues’ welfare and safety.
Much of the self-censorship that goes on is done to protect colleagues and informants who live in China with little chance of leaving. If there is a conflict between never engaging in self-censorship and maintaining ethical research practices, I will choose to maintain ethical research practices.
For qualitative researchers working with living people, “self-censorship” might be another way of saying “protecting the people around you” – a core ethical research practice. “Self-censorship” could also be another way of saying “knowing when to keep your mouth shut.”
This is complicated, as everyone who works in China has to make some compromises. Different scholars will have different views on how far certain compromises are justifiable. Currently, I am not trying to visit Xinjiang for field research as, in my judgement, it would be extremely difficult because of the security situation and could put informants at risk. Is this self-censorship?
We believe that this discussion highlights the effect of using interlocutors to communicate political boundaries. This phenomenon triggers researchers’ awareness of the ethical principles of field research as well as the legal requirements embodied in university Institutional Review Board (IRB) processes, and induces caution by reminding international researchers that the costs of boundary-transgression may be imposed on China-based interlocutors and colleagues.
Respondents also disaggregated levels and types of self-censorship, a term that both scholars and media have employed to reference a wide variety of different behaviours. First, many researchers acknowledged choosing words carefully while in China, but perceived a clear difference between exercising caution while operating as a researcher during fieldwork (acceptable and often ethical), and changing the conclusions of one's intellectual work to avoid unpopularity with CCP authorities (unacceptable and unethical).
Being careful with words and being respectful to the country and the people that you study is not self-censorship.
I am careful about what I present in China in public forums (such as a conference in China). But this does not constitute self-censorship, since this in no way affects the actual research and writing process of my work.
Second, scholars distinguished between changing the conclusions of academic research and choosing to adopt critical stances in public talks or op-eds. Is it self-censorship if a scholar decides not to adopt a publicly normative stance on issues they work on, or only if an academic actually modifies their intellectual work out of fear of political consequences? At what point does public discretion become problematic self-suppression or moral cowardice?
While there was universal objection to altering scholarly findings, the range of normative judgements on public commentary was broader. Some respondents believed that scholars refused to make critical comments public out of fear of losing access, while others noted that public commentary is discretionary and therefore saw the choice to engage in it or not as less problematic.
I think there are two different manifestations that often get blurred in the pundit world. One is whether a scholar, who decides for personal normative reasons to take a high profile position on China in social media or op-eds/commentary in the media or at think tanks, pulls punches either by avoiding a sensitive topic or toning down language. The other is whether a scholar who is publishing academic work in academic journals decides to avoid topics or modify findings or language in academic publications.
If there is self-censorship it is probably more likely to involve decisions about publishing high profile media op-eds, not scholarly work published in scholarly outlets. I personally think high profile op-eds are not our primary mission as scholars. So, for the academy the more important question is whether there is self-censorship of scholarship. And here, as I said, I am not aware of any data showing this is a major problem.
The CSRES data do not allow us to quantitatively unpack the frequency of these different uses of the term; we hope that future research might take up this question.
Disciplinary and institutional factors
The CSRES also asked how repressive pressure from China compared to other factors, including those affiliated with discipline, department or institution. In general, respondents ranked pressure from China below both disciplinary and funding pressures. When asked to rate the “effect on research and publications,” only 20 per cent said “political pressure from China” was very important, compared to 41 per cent for disciplinary pressures (tenure/promotion), and 35 per cent for funding.
These responses also highlighted the potential for censorship to come from third-party sources rather than from researchers themselves. With respect to funding, 8 per cent of respondents believed that political concerns had affected a funding decision, usually from an external granting agency (91 per cent) rather than a university (9 per cent).
Publishers also play an important third-party role: 18 per cent of respondents had had a publication censored in China, and 36 per cent of these had not received advance notification.
Finally, the majority of scholars navigate work in China without much support from their home institutions. In response to an open-ended question about what, if any, institutional support scholars had received when dealing with the Chinese government, the most common response was “None.” Many had never sought assistance; of those who had, it was most commonly a university letter to accompany visa applications. Several respondents noted that they would more likely turn to colleagues than administrators if a problem arose, or mentioned cases where the university had come to them for guidance or help to resolve a problem in China. Several volunteered a belief that their university was not equipped to handle these challenges.
Advice from the field
An open-ended question about advice for others generated both philosophical and practical responses. The most prominent theme emphasized listening to Chinese colleagues. Practically, respondents noted, those who live and work in China maintain a better understanding of where boundaries lie and how to navigate potential sensitivities.
Close cooperation with Chinese scholars, speak Chinese well, have a solid and legitimate research project, know what you are doing, have a good sense of humour.
Be open with Chinese colleagues and ask for their advice. Most of them find these problems as frustrating as you do, but they are better at navigating these obstacles.
Especially for foreign researchers, be forthright about your research, your affiliations and your motivations, but also frame your work in a way that echoes current Chinese academic discourse. Find the right host institution, and develop long-term relationships with Chinese collaborators.
Respondents also emphasized ethical reasons to respect Chinese colleagues’ understanding, as it is Chinese colleagues who will be disproportionately and often negatively impacted by interacting with an international researcher who “gets it wrong.”
I am clear with my Chinese interlocutors what my research questions are, what my hypotheses are, and what my specific questions for them are. This allows them to judge whether interacting with me is a problem for them.
Be honest about what you are studying in general terms, but do not force contacts in China into a situation where they have to take political responsibility for your research. If someone finds it inconvenient to meet with you, do not pressure them to meet with you.
The necessity of protecting research subjects and interlocutors appeared repeatedly.
[Y]our first responsibility is the safety, security, and well-being of your research collaborators or informants (NOT “subjects”). This is more important than your publication or your tenure or your degree. If you think in these terms and observe cues of whether people are comfortable or want to cooperate, you should be OK.
You have a professional and moral obligation to protect your sources, even if the immediate costs to you are high.
Many respondents offered advice that emphasized discretion and sensitivity to context. Variants of “keep a low profile” occurred frequently, not only to avoid short-term problems but also to develop the capacity to conduct long-term research and thereby create lasting intellectual value, rather than emphasizing short-term, sensational results that might be extractive or harmful.
[B]e discreet. There is a(n American) tendency to make bold claims, especially among competitive PhD students. This is never a good idea for long-term field access and collaboration.
Just be sensible and forthright. Sensitive issues are not off the table if handled, well, sensitively. One does not have to upset others in order to demonstrate one's competence as a scholar. Choosing language carefully is part of being an academic.
Truly think carefully about which aspects of your research are appropriate to share in which contexts. This doesn't mean lying, but it does mean selecting the right emphasis for a particular audience. This includes publications. Don't try to publish something in Chinese that might make trouble for your colleagues and collaborators. Save it for an English-language journal.
You can usually make more of a difference having a long-term career in the field doing good work over decades than having one sensational piece that might illuminate one thing, but silences you (and likely your interview subjects) for a long time afterwards.
Other respondents, however, expressed concern about the potential for “discretion” to justify self-censorship, and offered strong advice not to be overly cautious.
The first piece of practical logistical advice centred on diversification of projects and source materials.
I recommend to my graduate students that they design research projects that do not depend on access to a single kind of source or archive, and ideally do not depend entirely on sources that are available only in the PRC – i.e. to spread their research around to include sources in Japan, Taiwan, Hong Kong, the US or Europe, etc. as much as possible. That way, if something in China is closed off, there will be other avenues of opportunity.
I urge researchers to systematically go through available documentary sources before conducting interviews, which are increasingly difficult to arrange. If the interviewee sees that someone knows a topic well, she is more likely to go to the heart of the matter, making interviews more productive.
Be creative, be patient. Have multiple projects so that if something tricky happens to one of them, you can work on others till better times. One can also do very good work on China without having to go on the mainland.
Respondents also noted that digital tools provide opportunities for analysis that was previously infeasible given restrictions on traditional fieldwork.
Even though the political situation in China is getting more constrained, I think current methods are making scholars more adventurous, not less. In the old days when you needed interviews to gain information, a lot of topics were impossible. Now with web scraping, text analysis, etc. there are many topics that can be explored without needing any permission.
The final cluster of suggestions had to do with technological steps to secure data and protect contacts; respondents described multiple methods to ensure digital security. We do not discuss specifics here to avoid compromising techniques that protect people and data, and because recommendations in this area are evolving rapidly. We encourage scholars to speak to experienced colleagues and sophisticated IT staff about best practices whenever possible.
Conclusion
This article sought to provide new data on the frequency with which China scholars experience state repression, and on ways in which repressive experiences affect research practice and output. We find that repressive research experiences among China scholars are a rare but real phenomenon. The majority of scholars have had no direct repressive experiences; however, one in twenty has experienced visa difficulties; one in ten has been invited to tea; and one in five has had difficulty accessing archival materials. The indirect effects of repressive phenomena affect a far broader community: most China scholars believe their research to be sensitive; a majority adapt their conduct to protect themselves and others; and most express concern about potential self-censorship.
Our findings have implications for disciplinary conversations about research in authoritarian and repressive contexts, in China and beyond. We find that the risks of research in China are uncertain, individualized and not easily discernible from public information. Decisions about whether to pursue potentially sensitive research projects, therefore, are highly personal: scholars can encounter real consequences for conducting certain research in China, and these risks are likely to be higher both for Chinese researchers and for one's China-based colleagues and interlocutors. A scholar's precise combination of constraints may not be apparent from a CV or website, and are likely to be unclear to disciplinary colleagues working outside the Chinese context. The field should be careful about making blanket judgements about risk acceptance and avoidance, and China scholars should carefully communicate these issues to non-China focused colleagues in their disciplines. We hope the CSRES data provide a helpful foundation in that regard.
Our results also suggest several productive avenues for further research. One is to understand what goes on “inside the black box” so as to unpack the roles of China's various “authorities” when it comes to repression aimed at international scholars. Our finding that different repressive experiences follow different logics raises obvious questions: which authorities make these decisions, at what level, and with what reasons?Footnote 20 Why, for example, is one scholar cautioned by a fellow academic, while another, studying similar questions in a different location, is invited to meet the local public security bureau? Should scholars view these incidents as the result of a coordinated effort to manage foreign scholars and foreign perceptions of China, or as the output of a patchwork of local actors operating in a fragmented authoritarian context?
We also see potential for replication and expansion of the survey in at least three directions. First, to understand whether CCP management of Western scholars is distinctive, it would be useful to replicate the CSRES survey with a sample of China scholars based in Asia, Africa and Latin America. Second, it would be useful to compare whether our findings on China are generalizable to other authoritarian regimes; we observe some parallels, but a valid comparison would, we believe, require additional systematic data on researchers’ experiences in other non-democratic contexts.Footnote 21
Third, our findings reveal that production of scholarly knowledge on China is affected not only by individual research experience (our focus here), but also by broader institutional and disciplinary contexts. The CSRES data should, therefore, be complemented by similarly systematic data on other aspects of China's engagement with Western academic institutions – for example, student organizations, campus programmes, exchange programmes, development relationships, and other institutional affiliations and partnerships. National organizations and Congressional hearings have documented incidents that are troublesome for academic freedom and sounded warnings about problematic practices, but these data are incomplete at best.Footnote 22 There is a clear need for systematic research on the role of third parties – academic institutions, publishers, disciplinary associations, and the like – to gain a more complete understanding of these actors’ experiences and responses and how their practices are shaping scholarly output.
By creating the CSRES data, we sought to address one major piece of this puzzle. The additional steps described above would, we believe, make a two-fold contribution. First, they would help to improve the field's theoretical understanding of what “Chinese influence” means and how it plays out globally. Second, they would assist in crafting policy solutions that implement responsible academic engagement with China in a manner consistent with the values of freedom of thought and free exchange of ideas that characterize Western academic institutions. These are timely questions which will only grow in importance with China's rise on the world stage.
Acknowledgements
This material is based on work supported by the department of political science at the University of Missouri and the Woodrow Wilson School of Public and International Affairs and department of politics at Princeton University. We thank Matthew Ferchen, Tom Gold, Alastair Iain Johnston, Denise Y. Ho, Scott Kennedy, Benjamin Liebman, James Millward, Elizabeth Perry and Ezra Vogel for helpful comments at various stages of the project. This paper also benefited from presentations and helpful feedback at the American Political Science Association annual conference, the National Committee on US–China Relations (NCUSCR), the Center for Strategic and International Studies (CSIS), and the department of politics at the University of Virginia. Our gratitude also goes to the more than 500 China scholars who took the time to respond to the survey. We would like to thank Austin Berman and Shea Minter for excellent research assistance. Any remaining errors are our own.
Supplementary material
Supplementary material is available online at https://doi.org/10.1017/S0305741019000365.
Biographical notes
Sheena Chestnut GREITENS is assistant professor of political science at the University of Missouri. She is the author of Dictators and their Secret Police: Coercive Institutions and State Violence. Her current research focuses on coercion in contemporary China, and the geopolitics of North Korean migration and resettlement.
Rory TRUEX is assistant professor of politics and international affairs at Princeton University. He is the author of Making Autocracy Work: Representation and Responsiveness in Modern China. His current research focuses on repression and political dissent.


 Open access