


Social media summary: South Indian Tamil kolam drawings indicate the successful artistic traditions hit a complexity ‘sweet spot’.
Introduction
From the perspective of human evolution, art is mysterious. People in all known populations invest substantial time, energy and effort in generating abstract patterns and performances (Brown, Reference Brown1991), to no obvious benefit. In biology, the study of seemingly non-functional traits in social communication relies on the evolutionary theory of signalling, a framework for understanding how reproductive trade-offs produce phenomena such as warning displays, mating calls and specialised adaptations such as bright, colourful plumage (Zahavi, Reference Zahavi1975). It is currently unclear whether human art is comparable with signalling behaviours, what features they have in common with each other, or if art is even something that can be usefully understood using an evolutionary approach.
In recent years, the availability of large art datasets has enabled large-scale quantitative analysis (Liu et al., Reference Liu, Wang, Sinatra, Giles, Song and Wang2018; Müller & Winters, Reference Müller and Winters2018; Sigaki et al., Reference Sigaki, Perc and Ribeiro2018), which is the cornerstone of the ‘population thinking’ approach characteristic of evolutionary thinking in modern biology (Mayr, Reference Mayr and Sober1994). Here we present such an analysis of a large corpus of material art from South India: the kolam drawings created by the women of Tamil Nadu in South India. Because this long-standing artistic tradition follows systematic rules amenable to quantification, statistical models allow us to characterise the strategies pursued by individual artists, detect the existence of a theoretically derived entropy trade-off between richness and evenness and weigh the importance of particular constraints on the flow of information within an artistic community.
Theoretical background
In evolutionary theory, signals can successfully coordinate behaviour between organisms by reliably indicating skill (Hawkes & Bird, Reference Hawkes and Bird2002), commitment (Bulbulia & Sosis, Reference Bulbulia and Sosis2011; Soler, Reference Soler2012), social status (Smith et al., Reference Smith, Bird and Bird2003), strength (Sosis et al., Reference Sosis, Kress and Boster2007) and cooperativeness (Gintis et al., Reference Gintis, Smith and Bowles2001; Granito et al., Reference Granito, Tehrani, Kendal and Scott-Phillips2019). Courtship behaviours, such as the ornate nest structures built by bowerbirds, often have no practical use, but their great cost itself is a signal of underlying phenotypic quality and potential mate value (Madden, Reference Madden2003; Schaedelin & Taborsky, Reference Schaedelin and Taborsky2009; Zahavi, Reference Zahavi1975). Some human behaviours, such as inefficient and unnecessarily difficult spearfishing in Meriam communities (Bliege Bird & Douglas, Reference Bliege Bird and Douglas2002), have been nominated as having a similar purpose, to enhance a signaller's social status and thus mating success (Bird et al., Reference Bird, Smith and Bird2001). More generally, costly public signals can lead to improved status and reputational standing (Power, Reference Power2017), reproductive success (Smith et al., Reference Smith, Bird and Bird2003) or increased social support (Bird et al., Reference Bird, Scelza, Bird and Smith2012). Beyond latent properties of the individuals, signals can evolve to indicate persistent group memberships which become the basis for cooperative assortments. Especially in multiethnic populations, ethnic marker theory has become substantial to understand how individuals coordinate their norms and behaviors with others using identity or group membership signals (Boyd & Richerson, Reference Boyd and Richerson1987). These signals, referred to as ethnic markers, have evolved to prevent individuals from interacting with others with different norms in coordination games (Granito et al., Reference Granito, Tehrani, Kendal and Scott-Phillips2019; McElreath et al., Reference McElreath, Boyd and Richerson2011; Moffett, Reference Moffett2013).
As a medium of communication, human art might reflect fitness-relevant qualities and capacities (e.g. preferences, skills or personality traits such as patience, creativity, commitment) as well as promote social standing and mating qualities (e.g. health and fertility; Davies, Reference Davies2012; Grasseni, Reference Grasseni and Bunn2018). The signal is manifested as the aesthetic appeal or value of the artwork and as such, it makes sense to see artists compete with each other in producing the most appealing and aesthetically pleasing artwork (Grasseni, Reference Grasseni and Bunn2018; Gustafsson, Reference Gustafsson and Bunn2018; Varella & Fernández, Reference Varella, Fernández and Fisher2015) that reflects their qualities and social status. Information on an artist's capacities, their social standing or mating qualities is judged by the apparent costs of the artistic production, reflected in its complexity (Grasseni, Reference Grasseni and Bunn2018; Varella & Fernández, Reference Varella, Fernández and Fisher2015).
A number of quantitative approaches have been used to measure cultural diversity of some distribution of traits. In economics and anthropology, a popular distributional measure is the Gini index of inequality (Ravallion, Reference Ravallion2014; Zoli, Reference Zoli1999). A Gini index value of 0 represents a state of total equality, while a value of 1 represents total inequality. In ecology, three common methods of biological diversity are the richness (the number of unique variants present), evenness (the relative abundance of variants) and Shannon information entropy, which weights richness by relative abundance. For a low-entropy, low-diversity state, the representation of alternative variants is highly unequal, and in the limiting case in which only one variant is present, entropy is 0. At the other extreme, all n variants are represented equally, maximising evenness, and so the entropy is also maximised to the value of log(n) (Jost, Reference Jost2006, Reference Jost2009). Entropy has also been used in several recent papers quantifying artistic diversity, where an artwork can be represented by an empirical probability distribution of variants (Müller & Winters, Reference Müller and Winters2018; Pavlek et al., Reference Pavlek, Winters and Morin2019; Winters & Morin, Reference Winters and Morin2019).
Although the Gini index in economics and diversity in ecology quantify the relative abundance in very similar ways, to our knowledge no systematic relationship has been described between the Gini index and Shannon information entropy, richness or evenness. If we define evenness as v = 1 − g, for a given Gini index g, numerical simulations show that the relationship between Shannon information entropy, richness and evenness is quite strict, so that the maximum entropy $\hat{H}$ is given by evenness v and richness n as

where a = exp(0.51390628) (see Supplementary Material for more details). This approximation allows us to detect entropy trade-offs between evenness and richness, which we use as an analogue to fitness trade-offs and can be applied to the study of any well-defined artistic system.
Kolam art of South India
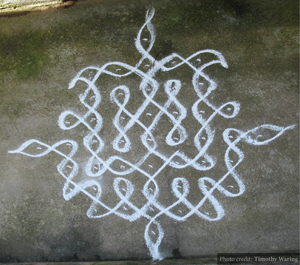
Kolam drawings are geometric art practised by women in the Kodaikanal region of Tamil Nadu, southern India (Layard, Reference Layard1937). A kolam consists of one or more loops drawn around a grid of dots (in Tamil called pulli). On a typical morning, a Tamil woman will prepare a grid of dots on the threshold of her home, and then draw a kolam with rice powder or chalk. During the day the drawing weathers away, and a new kolam is created the next day. Kolam drawings are historically traditions of matrilines, but more recently are also a topic of cultural education in Tamil schools. Girls in Tamil Nadu begin practising kolam-making from an early age, and competency in this art is considered necessary for the transition into womanhood (Nagarajan, Reference Nagarajan2018). Although the primary medium is the threshold of the home, women practice kolam-making in notebooks, and it is common for artists to share, copy and embellish each other's kolam designs. Such unrestrained artistic exchange is fostered by the fact that kolam designs are not considered to belong to any one person, but rather to be a type of community knowledge (Nagarajan, Reference Nagarajan2018). However, the ability to successfully draw aesthetically pleasing (i.e. diverse, complex, large) kolam drawings is said to reflect certain qualities of a woman (e.g. her degree of traditionalness or patience), and as such her capacity to run a household and become a good wife and mother (Laine, Reference Laine2013; Nagarajan, Reference Nagarajan2018).
Kolam drawings further broadcast meaningful information about a household to neighbours and visitors. Nagarajan (Reference Nagarajan2018) argues that the presence or absence of kolam drawings helps mark important events and the emotional or physical state of the artist and its household. Auspicious events, such as weddings or community festivals, warrant unusually large and complex kolam drawings, while inauspicious events such as death or illness are marked by the absence of kolam drawings, and might communicate the inability to receive or host visitors or the need for social support (Laine, Reference Laine2013; Nagarajan, Reference Nagarajan2018).
Overall, kolam-making plays an integral role in Tamil community and is deeply embedded in the Tamil culture with playful or even large-scale competitions among women (Nagarajan, Reference Nagarajan2018, pp. 179–203). Women often come together to carefully examine and critique each others kolam drawings in terms of aesthetic qualities (e.g. geometric complexity or density; Nagarajan, Reference Nagarajan2018, p. 189) or consult each other on designs to optimally showcase their skills (Nagarajan, Reference Nagarajan2018, p. 182). Contemporary interpretations of the kolam in Tamil movies even use ‘the motif of the heroine's beautiful kolam in attracting the male gaze of the hero. The romance is either initiated by a strikingly beautiful kolam or sustained during the nocturnal hours when a kolam is being made by the heroine’ (Nagarajan, Reference Nagarajan2018, pp. 179–267).
Current study
Kolam drawings are highly diverse, and contain multiple distinct artistic families. Here we study the ner pulli nelevu or sikku kolam family because of its unique form. Because sikku kolam drawings represent an unusually strict system of artistic expression, kolam drawings can be mapped onto a small identifiable set of gestures and are therefore well suited to systematic, quantitative analyses as a naturalistic model system of cultural evolution. A given kolam's gesture sequence can be characterised by a number of informative summary statistics which capture aspects of kolam itself: the sequence length (i.e. the total number of gestures), the discrete canvas size (measured by the grid of dots, or pulli), the gesture density per unit canvas area and gesture diversity as measured by evenness (here, the Gini index), richness and Shannon information entropy.
With the ability to calculate standard measures and properties to describe artworks derived from information theory, we can explore the possible functions of signalling in kolam drawing. Specifically, we wish to understand better the social and strategic landscape within which artists work. Moreover, we seek to understand how realised kolam drawings result from the conflicting pressures of the need to communicate social signals, and various constraints on artistic production, among them the skill and experience of the artist, and the social system she lives within.
Since these trade-offs are properties of the design space of the art itself, a substantial amount of variation may be explained simply by understanding strategic decisions, conscious or unconscious, made by the artist. Thus, two major research questions arise: first, can a trade-off model explain the pattern of variation among kolam drawings, as is commonly done in behavioural ecology? And second, can we relate structural and information-theoretic properties of kolam designs to underlying social and cognitive constraints operating on individual artists?
Methods
Kolam dataset
We (TMW) interviewed 312 artists in the Kodaikanal region in Tamil Nadu in 2009, collecting a total of 6393 kolam drawings from the ner pulli nelevu or sikku kolam family, along with details of each woman's education, kolam-making experience, place of origin and household demographic background, including caste.
Using the lexicon of 29 kolam gestures developed in Waring (Reference Waring2012b), each kolam was digitally transcribed into a sequence of gestures, and transferred into a database using the kolam R package (see http://github.com/nhtran93/kolam for more details).
An example of transcribed kolam drawings can be seen in Figure 1. The geometry of the kolam can be divided into three geometric spaces (orthogonal, diagonal, transitional) with their specific corresponding gestures. Each set of gestures is represented by a letter (O, D, T, respectively), while special variations of these moves are given special letters (C, H, P). Topologically, diagonal and transitional gestures are chiral with distinct left and right versions because rotations of these gestures in space cannot yield their exact mirror image (Waring, Reference Waring2012b). The detailed lexicon of gestures can be consulted in the Supplementary Material.
Example of two orthogonal kolam drawings and their corresponding encoding using a lexicon of gestures.
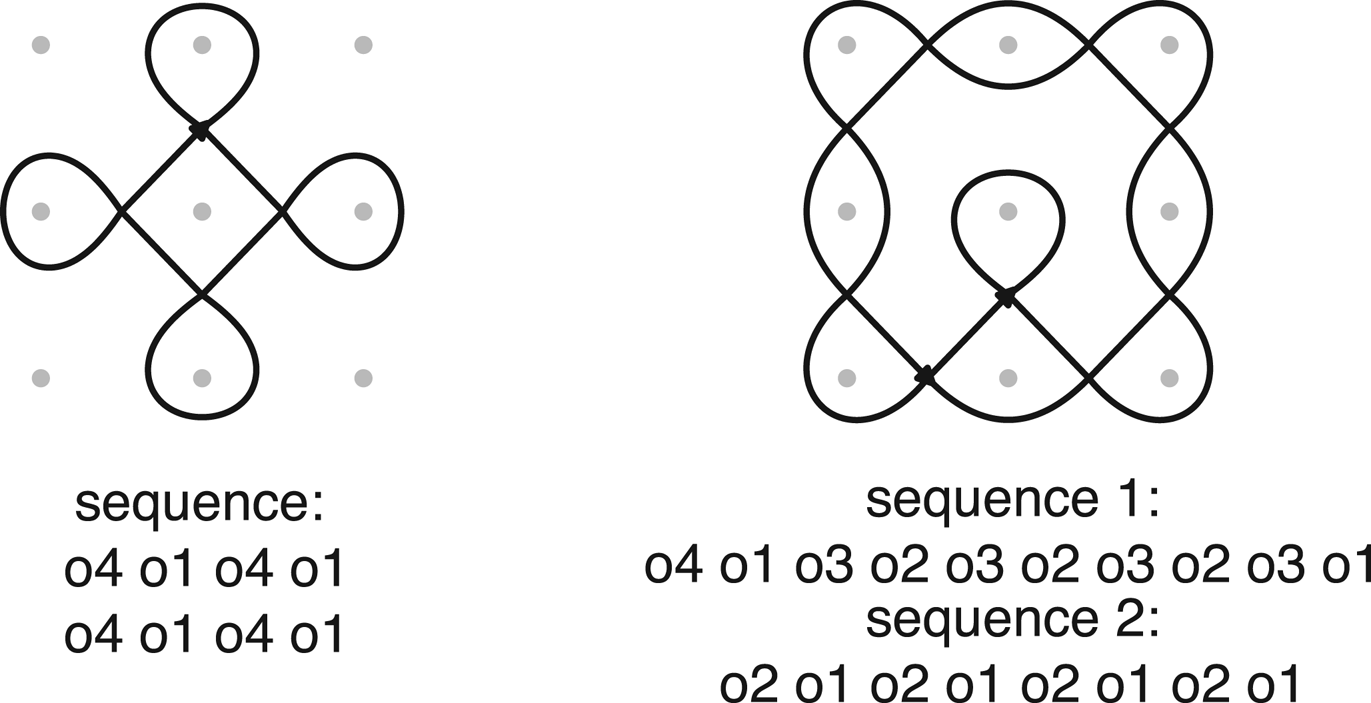
We excluded 674 kolam drawings that could not be matched to an artist, 695 kolam drawings because they included non-lexical gestures and another 17 kolam drawings owing to transcription errors. We further excluded 120 women because their survey data was incomplete with substantial missing data in key variables: age, GPS, duration of practice or caste membership. In total, 3139 kolam drawings (on average 16 kolam per woman) from 192 artists were included in the analysis (mean age 31.83 years, SD 9.93 years, range 15–50; 75% married). The artists were from 19 different castes, spanning from low and middle to high castes. Of the 3139 kolam drawings, 1801 came from artists of a low caste, 593 from artists of a middle caste and 745 from artists of a high caste.
Information-theoretic measures
We use Shannon information entropy, H(p)j, as a measure of artistic complexity or diversity for each kolam drawing j and probabilities pi for each possible, discrete gesture i, computed as the average log-probability:

Entropy as a measure for complexity is continuous and additive and increases as the number of possible gestures increases. While the lexicon of 29 gestures (Waring, Reference Waring2012b) decomposed the diagonal and transitional gesture types into distinct left and right versions, we did not distinguish between them because they are a property of the transcription and not of the artist. Thus, information-theoretic measures were computed based on 18 distinct gestures (with each chiral pair counted as only one) and the theoretical upper bound of the entropy in our analyses is

In contrast, the theoretical lower bound of entropy is 0 for a kolam that consists only of one gesture .
Richness represents the number of unique gestures (accounting for chirality) present in a kolam drawing and evenness represents the relative abundance of each gesture. We computed evenness v using the Gini index of inequality g: v = 1 − g, where

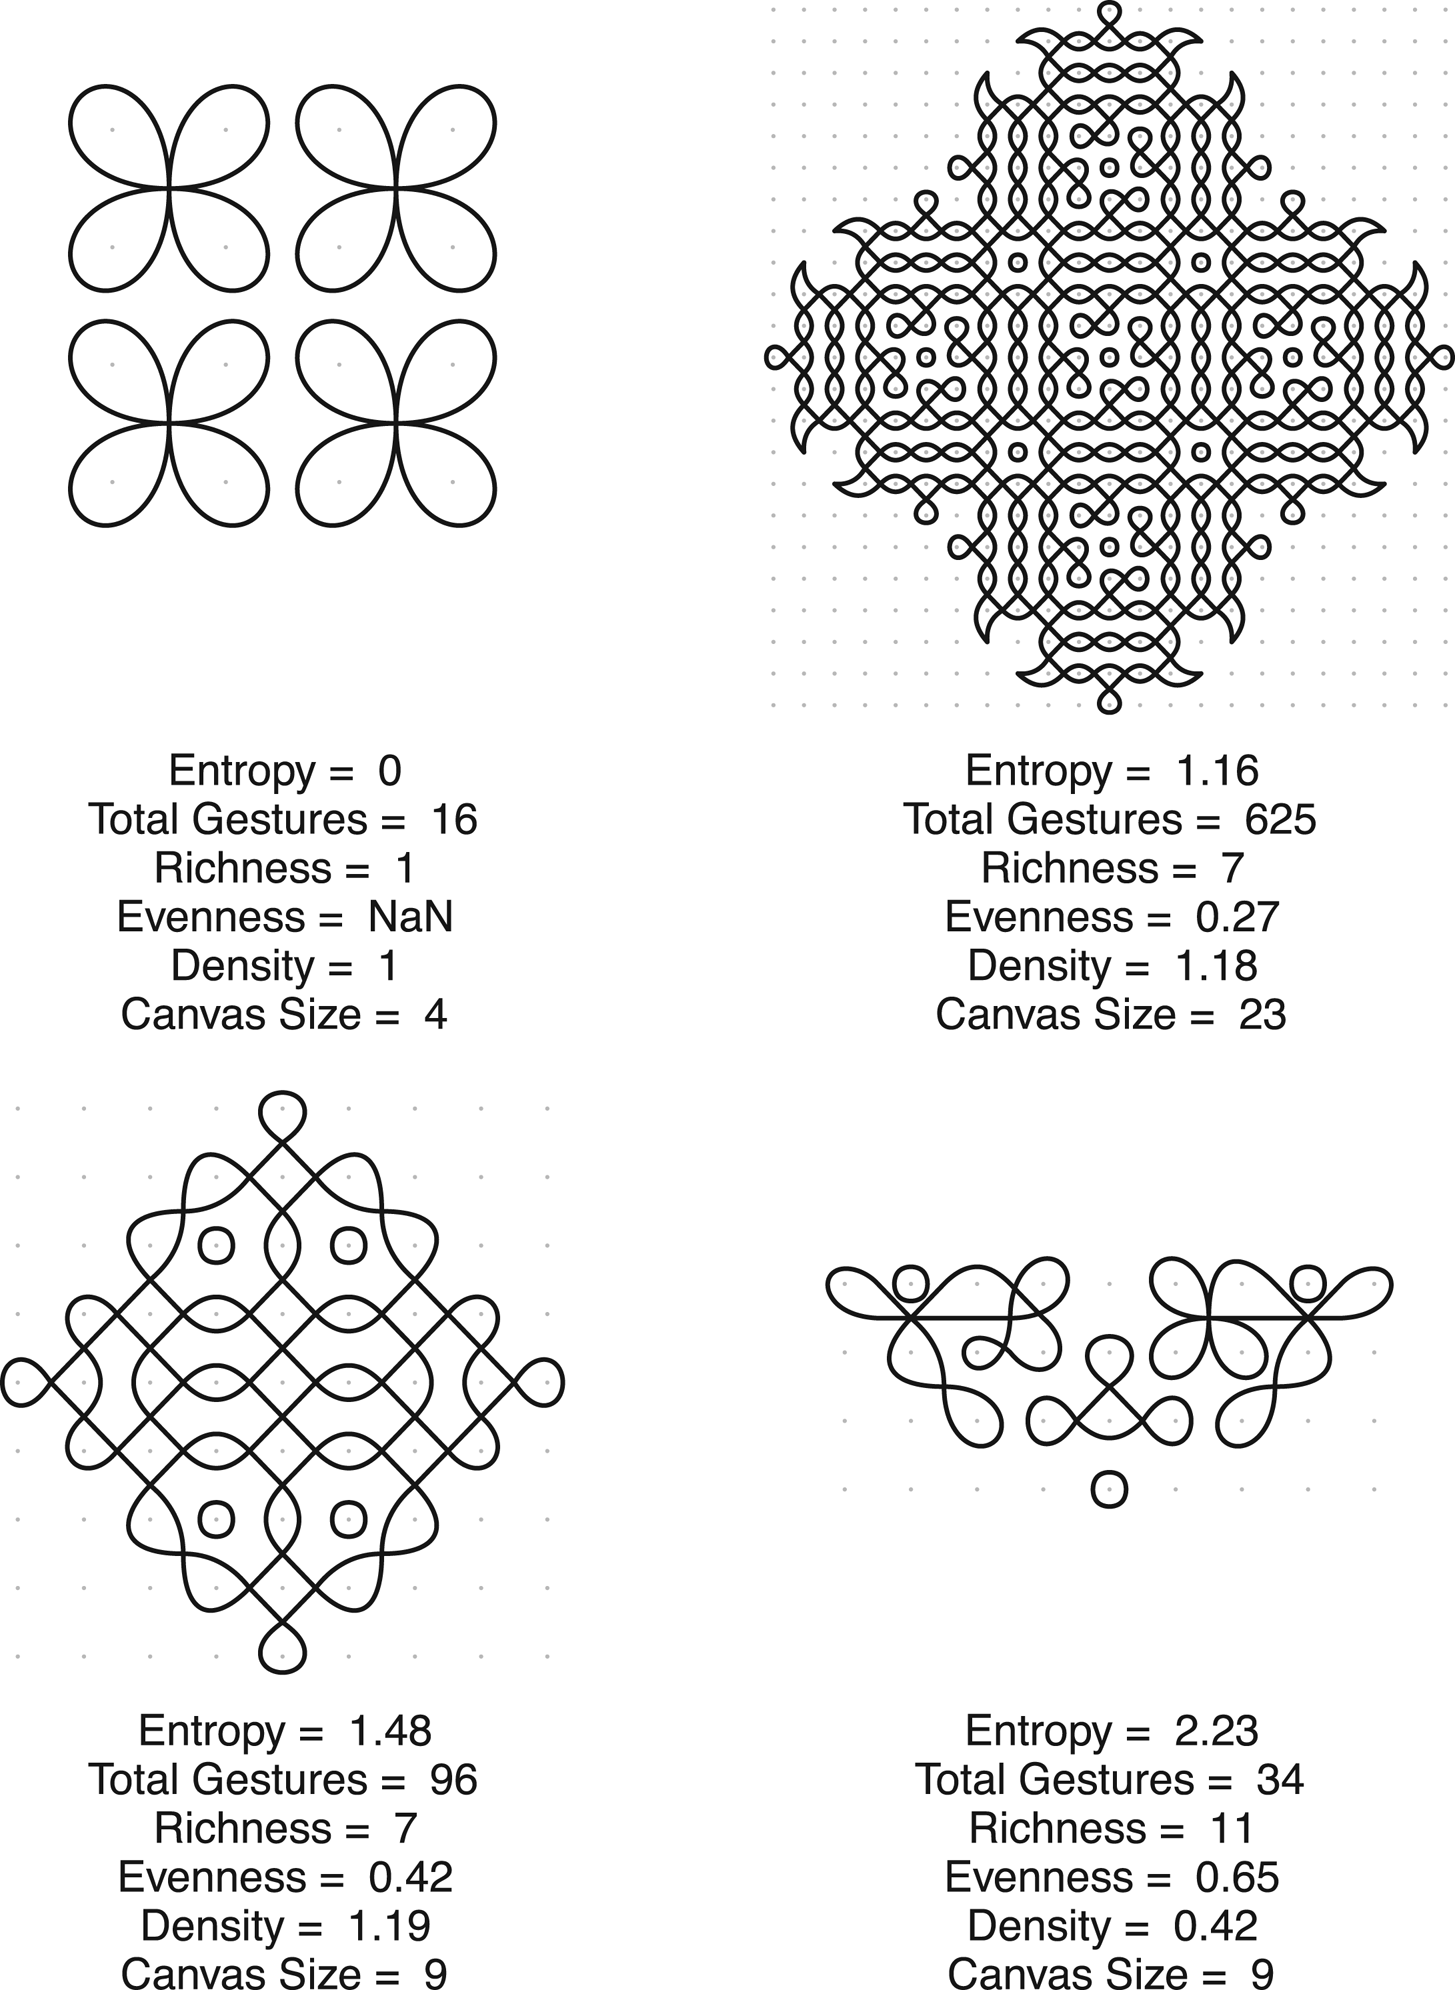
with n being the richness and p the frequency of specific variants or gestures. Figure 2 illustrates how these properties or information-theoretic measures correspond to specific kolam drawings.
Structural and information-theoretic properties of kolam drawings. The figure shows four kolam examples and their respective information-theoretic measures and structural properties.
Statistical analysis
To investigate the scope for viewing kolam art as a signalling system for aesthetic value, we modelled five information measures of each kolam in our sample using a variety of predictor variables. The five properties used as dependent variables to describe a kolam drawing were the canvas size, the gesture density per unit canvas area, evenness, richness and Shannon information entropy. The canvas size of a kolam is a discrete count variable measured by the grid of dots, or pulli, and captures the dimension of the kolam. Since kolam drawings always start with an initial square grid of dots, the canvas size is equal to the width or length of this initial dot matrix, regardless of whether the resulting kolam is not maximally spanning both the width and length of this grid. The gesture density reflects the number of gestures by canvas area:

Age, duration of practice and caste were used as predictor variables to explain individual variation. Age and duration of practice were standardised to be centred on 0 with a standard deviation of 1.
Since our data contains repeated observations for artists and castes (i.e. multiple kolam drawing from an artist or from any given caste), we partially pooled information across these two units using hierarchical modelling in order to account for imbalances in sampling and to yield more reliable and precise estimates (Efron & Morris, Reference Efron and Morris1977). While information was pooled across artists to avoid over-dispersed parameter estimates, we estimated a random intercept (i.e. offset) for each artist. Caste comprised 19 different categories and was modelled as a varying effect to estimate individual offsets for each caste category.
Evenness and richness are related to entropy by a mathematical identity (shown in the derivation in the Supplementary Material) and subject to an optimisation process. This theoretical guide motivates the specific choice of predictor variables in our statistical models, which is why we would not include, e.g. canvas size as predicted by richness. Including these predictors would not address our larger question of modelling information entropy or mapping its potential trade-offs, nor would such an analysis add an adequate potential alternative explanation of the invariance in entropy and the richness/evenness trade-offs because the system does not prevent artists from drawing kolams with minimal or maximum entropy.
The statistical models were implemented in the probabilistic programming language Stan (v2.18) (Carpenter et al., Reference Carpenter, Gelman, Hoffman, Lee, Goodrich, Betancourt and Riddell2017), using 6000 samples in four independent chains. We applied an iterative process of model building, inference, model checking and evaluation, and model expansion to ensure a principled and robust Bayesian workflow (Gabry et al., Reference Gabry, Simpson, Vehtari, Betancourt and Gelman2019; Talts et al., Reference Talts, Betancourt, Simpson, Vehtari and Gelman2018). Prior predictive simulations and fitted models to simulated data were used to determine reasonable and regularising priors for the parameters that respects the parameter type's bounds. We present a complete description of the statistical models and the priors in the Supplementary Material. Analyses were performed in R (R Core Team, 2019). Data and analyses can be found here: http://github.com/nhtran93/kolam_signalling. All $\hat{R}$ values were less than 1.01, and visual inspection of trace plots, rank histograms and pairs plots indicated the convergence of all models. Visual MCMC diagnostics can be found in the Supplementary Material.
Results
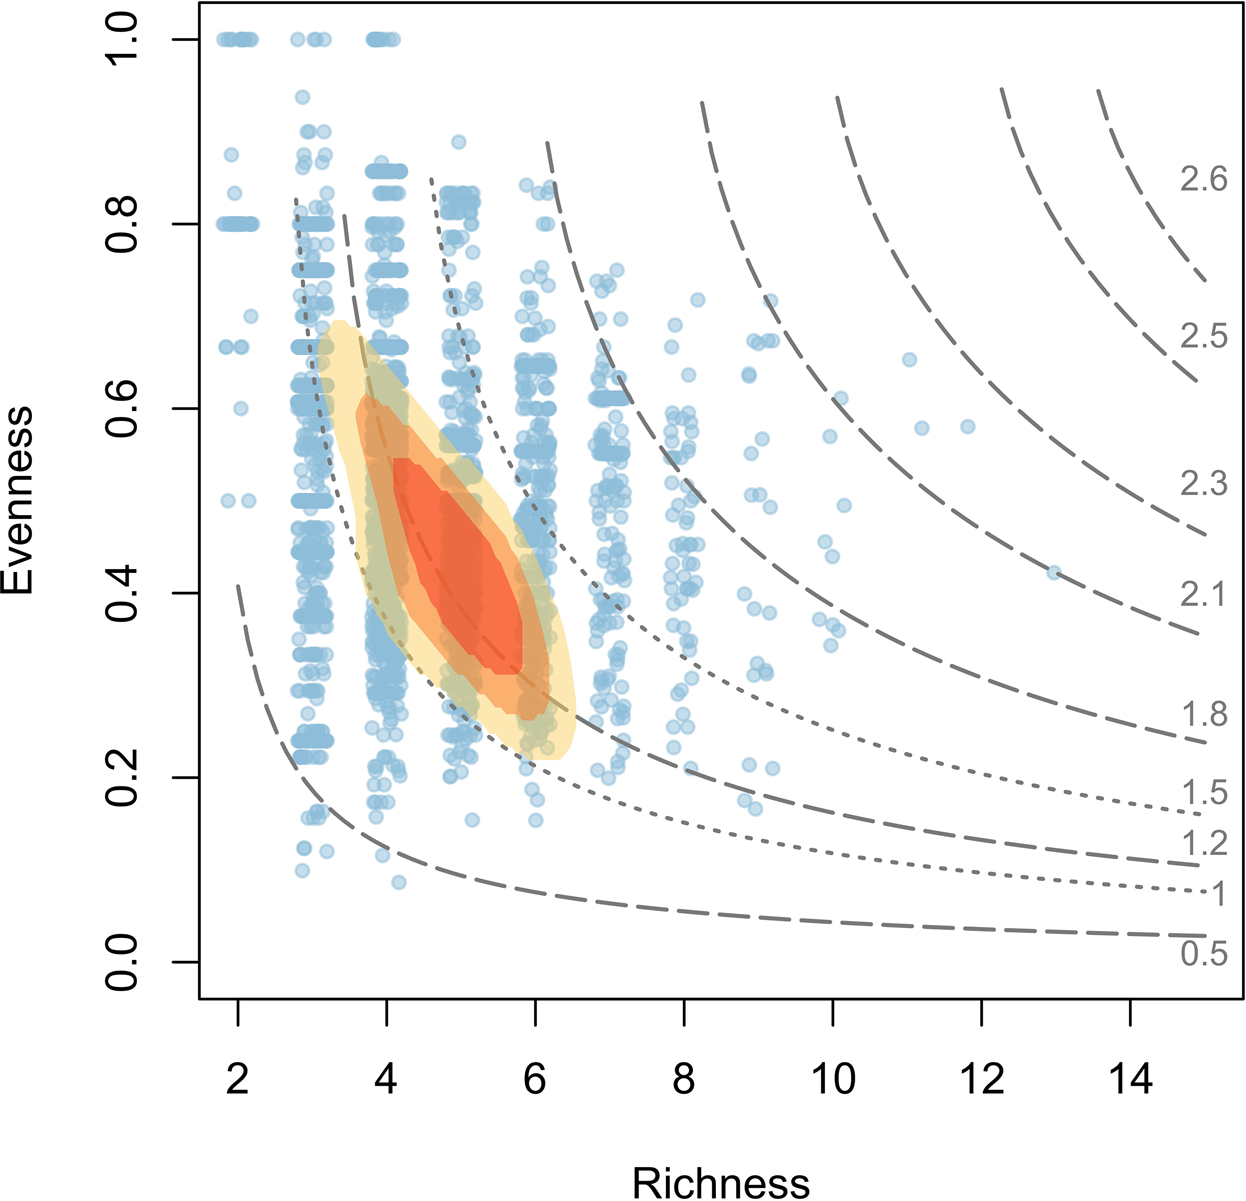
Consistent with the entropy trade-offs implied by equation (1), we find that as kolam drawings concentrate around an entropy of 1.17 log units regardless of their size, they systematically vary in evenness and richness as they increase in size (see Figure 3). Larger kolam drawings employ a greater richness of gestures, on average, but also have greater inequality between gestures in such a way that entropy remains tightly bounded between 1.1 and 1.4. As illustrated further in Figure 4(a, c), evenness decreases with increasing canvas size, while richness increases with increasing canvas size.
Trade-off between evenness and richness. The grey lines measure maximum entropy isoclines. The raw kolam data are jittered and illustrated in blue (light blue = low density, dark blue = high density). The (90, 75, 50%) kernel density of the average richness and evenness for each canvas size of the data are depicted in the orange area (light orange to dark orange).
Scatter plot of posterior estimates of individual intercepts (sum of individual offsets and population mean). The posterior estimates of individual variation of two models are plotted against each other to illustrate the correlation between outcomes. The blue colour gradient reflects the posterior estimates of individual variation of entropy. Pearson's correlation r between the posterior estimates of the two variables is shown on the upper left for each panel. (a) The canvas size and the evenness model. (b) The evenness and the richness model. (c) The canvas size and the richness model.

In characterising the artist-level variation, we also find similar patterns. Figure 4 illustrates artist's offsets on the different structural and information-theoretic properties on kolam drawings. Artist means cluster between an entropy of 1.1 and 1.4 log-units. Thus, very plain (entropy < 1) as well as highly complex kolam drawings (entropy > 1.5) are very rare. Individuals who draw larger kolam drawings tend to use more different gestures but in turn repeat a few gestures disproportionately (Figure 4b).
As indicated by Figure 5, there is also some small distinct variation between artists on the average entropy of their kolam drawings (σ artist = 0.04, 90% CI [0.02, 0.05]). This between-artist variability is most pronounced in canvas size (σ artist = 0.15, 90% CI [0.13, 0.17]) and in density (σ artist = 0.10, 90% CI [0.08, 0.11]) with individuals showing differences in the average canvas size and density of their kolam drawing. Between-individual variation the evenness (σ artist = 0.05, 90% CI [0.04, 0.06]) and in the richness (σ artist = 0.01, 90% CI [0.00, 0.03]) were estimated with high certainty to be non-zero, but very small (see right panel in Figure 5).
Prior–posterior coefficient plots. All panels have the same y-axis indicating the five models. The left panel (β coefficients) illustrates the estimated beta coefficients for the two predictors, duration of practice (dark blue) and artist's age (light blue) for each model. The right panel (variation) illustrates the estimated population level standard deviation for the effect of caste (dark green) and the estimated individual variation (light green) for each model. The 90% highest posterior density interval was computed for each posterior.

We detected very small effects of caste membership on density, evenness, richness and entropy, with varying-effect deviations estimated near zero with high certainty as illustrated in Figure 5 (density σ caste = 0.02, 90% CI [0.00, 0.04]; evenness σ caste = 0.03, 90% CI [0.02, 0.05]; and richness σ caste = 0.01, 90% CI [0.00, 0.03]; entropy σ caste = 0.03 90% CI [0.01, 0.05] respectively). However, evidence for caste differences in canvas sizes of kolam drawings was more pronounced (σ caste = 0.11, 90% CI [0.06, 0.16]).
Evidence for an effect of age and an effect of duration of practice on the five outcomes is also very weak. Figure 5 shows that both predictor variables have a very small effect on the five outcome variables. Age and the duration of practice are estimated with high uncertainty to be close to zero across the five models.
Only a small amount of variation in the information statistics we employed can be accounted for by variation in artists, their age, years of practice and caste membership: about 15% for canvas size, 13% of evenness, 11% of the variation in the gesture density, 0.01% for the richness and 0.03% for entropy as measured by the interclass correlation coefficient (Gelman & Hill, Reference Gelman and Hill2006; see Supplementary Material for more details). Residential proximity and regional origin of artists hardly accounts for any variation in the structural and information-theoretic properties (see Supplementary Material). In contrast, the residual variance of the outcomes is large and dominates model inference more than the variation explained by our fixed and random effects combined.
Discussion
Viewed at the population scale, the complexity of kolam drawings is quite invariant, suggesting the existence of an entropy ‘sweet spot’ around which most artists and most kolam drawings centre, regardless of the design's size or gesture richness. The observed increase in gesture richness in bigger kolam drawings is compensated for almost exactly by a corresponding decrease in gesture evenness, such that as kolam drawings increase in size, richness is traded off against evenness so as to maintain nearly constant entropy. Our findings are consistent with the general view of signalling in behavioural ecology as an attempt at optimisation under constraints and lend support that entropy is optimised through an observable and apparently unconscious trade-off between richness and evenness (shown theoretically and empirically).
In this interpretation, kolam drawings that are generally more diverse are more valuable art products (Nagarajan, Reference Nagarajan2018, p. 189). For this reason, we see very few kolam drawings with an entropy below 1, which would be unusually simplistic or repetitive, regardless of their size. Conversely, artists seem to hit an upper entropy constraint around 1.5 log units, regardless of the size of the kolam, which suggests some form of constraint on more complex (and more valuable) artwork.
Although the nature and origin of these constraints are unclear, our analysis can rule out a few possibilities. Almost no meaningful information about caste stratification is visible in the information metrics we employ. Members of different caste categories tended to create distinct kolam drawings of different canvas sizes, but no clear differences in other major structural or information-theoretic properties. Indeed, our findings are consistent with ethnographic accounts of kolam as a form of community knowledge, and suggest that, as a public art form drawn on a home's threshold, kolam drawings enjoy a relatively egalitarian information flow even in a stratified, multiethnic society (Waring, Reference Waring2012a).
Based on the above, we believe that complexity in kolam design is more likely to be constrained by aesthetic preferences and cognitive limitations than by information networks or social hierarchies. Although we were able to observe variation in average entropy between artists, with some highly complex kolam above an entropy score of 1.5 log units, we were not able to map this variation to patterns of age or experience. This could reflect cultural selection pressures to make traditional practices of artistic ornamentation and design, such as kolam art, more learnable or transmissable (Kirby et al., Reference Kirby, Cornish and Smith2008; Müller & Winters, Reference Müller and Winters2018; Ravignani et al., Reference Ravignani, Delgado and Kirby2017; Tamariz & Kirby, Reference Tamariz and Kirby2015; Tylén et al., Reference Tylén, Fusaroli, Rojo, Heimann, Fay, Johannsen and Lombard2020) or limitations in procedural and working memory capacities (Oberauer, Reference Oberauer2010; Oberauer & Kliegl, Reference Oberauer and Kliegl2006) unrelated to the action of experiential memory or cognitive senescence (Gurven et al., Reference Gurven, Fuerstenberg, Trumble, Stieglitz, Beheim, Davis and Kaplan2017).
An overly complex and large kolam with rich and diverse gestures might be too difficult, time-consuming or risky to execute successfully because options for revisions and corrections are limited. Artists might want to avoid highly complex kolam drawings because they draw them in front of their house and hesitations, pauses or corrections could be interpreted by the audience as imperfection or as a lack of skill (Nagarajan, Reference Nagarajan2018, pp. 53, 156). This avoidance of maximally complex artistic designs owing to increased risk of deficiency and failure might also be relevant to other practices of ornamentation or decorations where mistakes often last and cannot be rectified easily (e.g. polychrome bowl designs, Bowser, Reference Bowser2000 or Angolan sona drawings, Gerdes, Reference Gerdes1990). Alternatively, it might also be that more diverse kolam drawings are simply not as aesthetically appealing to artists and their audience because individuals often tend to prefer a certain extent of regularity and repetition rather than complete randomness and thus highly complex kolam drawings (Huang et al., Reference Huang, Xue, Spelke, Huang, Zheng and Peng2018; Voloshinov, Reference Voloshinov1996). Other artistic design such as loop patterns for decorations in Japan or Angolan sand drawings have already been known to be influenced by the aspiration for symmetry (Gerdes, Reference Gerdes1990; Nagata, Reference Nagata2015). Therefore, the artist's aesthetic preferences are the final constraint.
In fact, geometric art like kolam displays structural properties (e.g. symmetry, rotation, and repetition) and can correspond to distinct complexity measures (Sigaki et al., Reference Sigaki, Perc and Ribeiro2018). Aesthetic preferences can determine these distinct structural properties and reflect shared attention and learning (Tomasello et al., Reference Tomasello, Kruger and Ratner1993). Artists can deliberately choose to impose structural constraints according to their and consumers’ preferences onto an artwork. For instance, artists can strive for symmetry, only use the same type of variants (i.e. gesture types) or decide to primarily use the same two variants (i.e. gestures) and only add very low frequencies of other, special variants as decoration. All of these decisions underlie the time, skills and the aesthetic preferences of the artist and can profoundly shape the distribution of information-theoretic properties of the resulting artwork (Grasseni, Reference Grasseni and Bunn2018; Gustafsson, Reference Gustafsson and Bunn2018). Beyond measures of entropy, we do not have direct ratings of the aesthetic quality of kolam drawings or whether the artist has employed a particularly appealing style. Other information metrics, such as bilateral or rotational symmetry, or fractal scaling, might reveal specific details beyond diversity or complexity and discovering this should be an endeavour for future studies.
While the observed patterns in kolam art imply a certain degree of invariance in complexity across different canvas sizes and only small traces of individual variation and social stratification, they exhibit what has been called ‘equifinal’ behaviour (Barrett, Reference Barrett2018; von Bertalanffy, Reference von Bertalanffy1969). Equifinality means that inferring the generative processes that might have given rise to the observed cultural frequency data is difficult because we only have cross-sectional data (Barrett, Reference Barrett2018; Kandler & Powell, Reference Kandler, Powell, Mesoudi and Aoki2015). Temporal data could allow us to narrow the subset of causal mechanisms that underlie the observed distribution of information-theoretic properties. Generative simulations could approximate temporal data and provide more in-depth understanding on how artistic traditions could have theoretically evolved, specifically in regards to the diversity or the complexity and the stability of the kolam in the population across time. In order to infer the underlying generative processes, a probabilistic model, in which the hypothesised causal mechanisms (i.e. cognitive constraints, aesthetic preferences or other potential constraints) are explicitly defined, needs to be built (Kandler & Powell, Reference Kandler, Powell, Mesoudi and Aoki2015). Such a probabilistic model can allow us to repeatedly simulate datasets with known parameters and compare the resulting distribution with observed data to infer the most likely hypothesised causal mechanisms. Furthermore, measuring the signalling value of specific kolam motifs for coordinating using classification tasks (Bell, Reference Bell2020) could be a promising endeavour to explain the role of kolam art for social coordination. A comparison of the signalling value of culturally salient kolam motifs between the Tamil population in South India and the Tamil diaspora in the USA could further reveal divergent functions of kolam art for different communities. Another promising future endeavour could be to focus specifically on how kolam drawings are perceived and whether the processing efforts of kolam drawings (visual complexity measured by perimetric complexity or algorithmic complexity; Miton & Morin, Reference Miton and Morin2019; Pelli et al., Reference Pelli, Burns, Farell and Moore-Page2006) are in alignment with the actual production efforts (e.g. gesture complexity measured by Shannon entropy) invested in kolams. These perception and processing efforts of a consumer or learner of kolams could even have implications on the transmission of kolam knowledge in terms of learning and reproduction (Tamariz & Kirby, Reference Tamariz and Kirby2015).
Our results on entropy trade-offs and various constraints on complexity operating on kolam art encourage us to distance ourselves from underspecified and vague attempts to explain the evolution of art (Miller, Reference Miller2011; Pinker, Reference Pinker2003) and think deeply about artistic traditions in terms of evolutionary signalling theories of constrained optimisation. Further investigations of how evolutionary signalling theories of constrained optimisation could be applied to other art forms in other communities, such as Vanuatuan sand art (Lind, Reference Lind and Bunn2017; Zagala, Reference Zagala2004), Angolan sand drawings (Gerdes, Reference Gerdes1988, Reference Gerdes1993) or Islamic geometric art (Abdullahi & Embi, Reference Abdullahi and Embi2013), could advance our evolutionary understanding of investments in and constraints on art. A careful synthesis of evolutionary signalling theory with ethnography can help us understand individual's strategic investments into mastery of specific artistic skills and how they optimise their artistic displays (e.g. size, novelties, colour diversity) within certain constraints (e.g. aesthetic preferences, cognitive constraints or motor constraints), allowing us to elucidate properties of art. Importantly, evaluating evolutionary constraints on cultural productions beyond functional sufficiency is integral to understanding how cultural productions have evolved (e.g. motor constraints in music production; Miton et al., Reference Miton, Wolf, Vesper, Knoblich and Sperber2020). All of these future directions will be time consuming and computationally challenging, but we believe that the long-term gains for an evolutionary understanding of artistic traditions will make this enterprise worthwhile.
Conclusion
Using quantitative measures to systematically study material art in a large-scale anthropological dataset, our findings inform discussions on entropy trade-offs and various constraints on complexity operating on artistic traditions.
In the case study of the hand-drawn Tamil artistic tradition, our findings are consistent with evolutionary signalling theories of constrained optimisation and lend support that artistic complexity, measured by Shannon information entropy, is optimised through an observable, apparently unconscious trade-off between two standard ecological and information-theoretic measures: richness and evenness. This trade off between richness and evenness can potentially be explained by cognitive constraints and aesthetic preferences. Variation in structural and information-theoretic properties of kolam drawings are small, and evidence of social structures reflected in the information measures we employ is weak. This corroborates our understanding of kolam art as signal that does not primarily communicate social stratification or individual differences in age or practice, but rather aesthetic preferences, dedication, time and skill, as well as constraints of human cognition and memory.
Supplementary material
To view supplementary material for this article, please visit https://doi.org/10.1017/ehs.2021.14
Acknowledgements
We specifically want to thank the many Tamil kolam artists who were willing to share their repertoires, and the local collaborators who participated in data collection, including Kousalia Devi, Subashini Vetrivel, Matthew, Shankar, Arun, Sudarshan, Senthil and Michael. We thank the team of transcribers Anja Becker, Anne Büchner, Carlotta Rück, Claudia Bavero, Franziska Meier, Kristina Kunze, Karin Kämmerling, Leonie Ette and Maria Fröhlich. We thank Cody T. Ross for his Stan code review and the Department of Human Behavior, Ecology and Culture for stimulating discussions and feedback.
Author contributions
TMW collected the data, designed the kolam lexicon and wrote the Netlogo transcription software. SA led the data transcription team. NHT, BAB and TMW designed the analysis. NHT wrote data processing and statistical software and conducted the analysis. NHT and BAB wrote the manuscript, and all authors provided edits and revisions.
Financial support
This work was supported by US NSF Doctoral Dissertation Research Improvement grant no. 0823416 and the Max Planck Institute for Evolutionary Anthropology.
Conflict of interest
The authors declare that the research was conducted in the absence of any commercial or financial relationships that could be construed as a potential conflict of interest.
Research transparency and reproducibility
The kolam data and code for this study are available and can be found on GitHub: http://github.com/nhtran93/kolam_signaling. The R package to analyse kolam drawings can be further found on GitHub: http://github.com/nhtran93/kolam.


 Open access