


INTRODUCTION
The diagnosis and control of Mycobacterium bovis infection (bovine tuberculosis: TB) continues to present huge challenges to the British cattle industry [1]. The problem is compounded by the presence of M. bovis infection in European badgers (Meles meles) which, in addition to cattle, can act as maintenance hosts. A clearer understanding of the magnitude and duration of immune response to M. bovis infection in badgers may aid in disease control, for example by informing the development of vaccines and diagnostic tests [reviewed in Reference Tomlinson2]. For example, cytokines such as gamma interferon (IFNγ) released from activated T cells, appear to be useful diagnostic and prognostic tools in humans and other animals [Reference Lalvani and Millington3–Reference Vordermeier5]. Information on the magnitude and duration of immune responses to M. bovis infection in badgers may aid development of management strategies for this disease.
A recent study found that the magnitude of early IFNγ responses in badgers naturally infected with M. bovis was positively correlated with a likelihood of subsequent disease progression [Reference Tomlinson2]. However, that analysis was based on a small sample size (56 badgers) and so the generality of their conclusions is uncertain. Here, we use a much larger sample size (>500 badgers) to investigate the representativeness of Tomlinson et al.’s [Reference Tomlinson2] results on a wider scale.
Badgers may become infected with M. bovis through a variety of routes including inhalation, bite-wounding and, potentially, ingestion [Reference Corner6]. Tomlinson et al. [Reference Tomlinson2] hypothesised that the route of infection may influence the magnitude of the IFNγ response and subsequent disease progression, but they had insufficient data to investigate this. Previous studies have suggested that badgers infected through biting may subsequently experience particularity aggressive pathology [Reference Clifton-Hadley, Wilesmith and Stuart7, Reference Jenkins8] and experimental intradermal injection of M. bovis has been linked to progressive systemic infection [Reference Pritchard9]. Seropositivity is also more likely in situations of progressed disease which suggests that while not directly measuring infectiousness, a positive serological test result may indicate a greater likelihood that this is the case [Reference Chambers10]. In the present study, our rich dataset allowed us to examine for relationships between the locations of positive M. bovis culture results (from specific lesions or body areas, which may reflect the route of infection or excretion) and IFNγ responses. For bite wounds, this provides insight into how the route of infection may affect the magnitude of the immune response to M. bovis infection in badgers.
The duration of immune response is also important. Tomlinson et al. [Reference Tomlinson2] showed that the magnitude of IFNγ responses to infection in badgers declined over time, but they did not investigate how soon an animal is likely to become infectious after the first IFNγ test. We were able to do so in the present study by focusing on short-term associations (up to 24 months). This revealed insights into the differential timing of the immune responses, which is likely to be particularly useful from an operational perspective, because disease management programmes typically operate over these sorts of timeframes [11].
We hypothesise that, in a badger population naturally infected with M. bovis, individuals producing the highest IFNγ titres will be the ones most likely to subsequently test positive using TB tests that measure other arms of the immune system (the humoral response) or detect the pathogen itself (mycobacterial culture). Should this be the case, then it may be possible to use IFNγ test results as an indicator of likely future disease progression.
MATERIALS AND METHODS
Ethics statement
Badger capture and sampling was carried out under licences from Natural England and the UK Home Office. The protocols were approved by local ethical review within the Food and Environment Research Agency and the Animal Health and Veterinary Laboratories Agency (now the Animal and Plant Health Agency).
Study site and sample collection
Samples and data were collected from July 2006 to October 2013 from a population of wild badgers living in Woodchester Park, an area of south-west England, which is the focus of a long-term study into badger ecology and TB epidemiology [Reference Delahay12]. Badgers were captured, anaesthetised and sampled using well-established methods [Reference Delahay13] with each badger social group being trapped four times per year, resulting in repeated observations of the same individuals throughout the study period. Trapping was suspended between 1 February and 30 April inclusive when most cubs are very young, confined to the sett, and/or totally dependent on their mother [Reference Woodroffe14]. During January (and, weather dependent, during December and May), when some females may be lactating, traps were checked during the night, and females deemed to be lactating or pregnant on the basis of cursory examination, were released immediately without sampling.
On first capture each badger was given a unique alpha-numeric tattoo, which allowed individuals to be identified thereafter [Reference Cheeseman and Harris15]. The location, sex, body weight and condition, reproductive status and age class (cub [<1y] or adult [1y+]) of each animal was recorded. The following samples were collected for mycobacterial culture: faeces, urine, tracheal aspirate, oesophageal aspirate, swabs of bite wounds (where present) and swabs of suppurating submandibular lymph node lesions (where present). Bite wounds and suppurating submandibular lymph nodes were sampled separately because they are likely to represent different routes of infection. Up to 12 ml of jugular blood was taken for serology and IFNγ testing. After recovery from anaesthesia, badgers were released at the point of capture.
Three diagnostic tests were conducted: the IFNγ test; the Stat-Pak serological test; and mycobacterial culture of clinical samples (for details of all three tests see reference [Reference Drewe16]). Briefly, the IFNγ test quantified the secretion of the cytokine IFNγ by T-cells following stimulation with purified protein derivatives of bovine (PPD-B) and avian (PPD-A) tuberculin [Reference Dalley4]. Results from the IFNγ test were available on a continuous scale as optical density (OD) readings of IFNγ production. The Stat-Pak (Chembio Diagnostic Systems, New York) identified antibodies produced in response to specific antigens associated with M. bovis [Reference Chambers10], giving a binary (positive or negative) test result. The third test was the mycobacterial culture of clinical samples [Reference Gallagher and Horwill17] with a positive result recorded for any sample from which M. bovis was isolated. All three tests (IFNγ, Stat-Pak and culture) were conducted on each badger every time it was trapped, except on 2% of occasions when an insufficient volume of blood was available to allow Stat-Pak or culture to be run. Estimates of the sensitivity and specificity of each of these three tests have been reported separately [Reference Buzdugan18].
Data description and analysis
Data included IFNγ, Stat-Pak and culture test results on 550 captured badgers. Animals were enrolled in the study on the date of their first IFNγ test (usually the first time they were sampled within the study period) and were followed until the date of their last Stat-Pak or culture test during the period of study. This resulted in a median total observation period per badger of 10 months (range: 1 day to 86 months (7·2 years) per badger). Badgers with an observation period of 1 day were trapped and tested just once: therefore a true follow-up time period was not recorded for these animals. However, it was considered possible that their infection status might have been different to those that were trapped more than once (e.g. badgers that were lost to follow-up may have been more likely to have advanced infection) and so to reduce exclusion bias resulting from their omission, the test results of these badgers were included in the analysis by artificially increasing the time period between IFNγ and subsequent tests by 1 day.
The ‘risk factor’ of interest included as the explanatory variable in the model was the IFNγ titre at the first time each badger was tested. The IFNγ titre for each badger was calculated as the quantity of IFNγ produced following stimulation with bovine tuberculin purified protein derivative (PPD-B) minus the amount of IFNγ produced by stimulation with avian tuberculin purified protein derivative (PPD-A) [Reference Dalley4]. Continuous IFNγ OD values were used to produce five categories of IFNγ results for analysis (Table 1). Because the distribution of data points was highly right-skewed it was not considered appropriate to simply divide the range of values by the number of categories in order to obtain cut-off values. Therefore, negative values (arising from cases where the OD of PPD-A was higher than that for PPD-B) were coded as category 0 (zero), while values higher than zero but <0·044 – the current cut-off value for infection in adult badgers [Reference Dalley4] – were coded as category 1. Categories 2 and 3 were equally spaced (starting from 0·044) using an interval step of 0·33. The category coded as 4 included values higher than 0·70 with the highest IFNγ OD value being 1·92 (Table 1).
Distribution and categorisation of optical density (OD) values from gamma interferon (IFNγ) test results conducted on the first blood sample collected from each of 550 live badgers trapped at Woodchester Park from July 2006 to October 2013
PPD, purified protein derivative; B, bovine; A, avian.
Relationship between magnitude of IFNγ response and other diagnostic test results
Associations between the categories of the independent variable (IFNγ titre) and the dependent variables (subsequent Stat-Pak and culture results) were initially assessed using χ 2-square tests. For this analysis, the results of mycobacterial culture of different clinical samples (e.g., urine, faeces and tracheal aspirate) were pooled into one culture result (positive or negative) per badger per trapping event. A Cox proportional hazards regression analysis was performed to estimate the rates (probabilities) of subsequent positive Stat-Pak or culture results relative to the different categories of initial IFNγ titre. Survival analysis was chosen because this method focuses on ‘time-to–event’ which permits the calculation of rate ratios. For each badger, the time intervals that elapsed between the first IFNγ test and subsequent other TB tests (Stat-Pak or culture) were modelled, to determine whether values of IFNγ can be used as a measure of the likelihood of progression of infection. Kaplan-Meier and Nelson-Aalen curves were plotted for visual assessment of data distribution and to check if the proportional hazards assumption was upheld. Data were formally assessed using a plot of −log (−log) survival lines and a Schoenfeld residuals test [Reference Grambsch and Therneau19], which revealed that the proportional hazards assumption was not met. Therefore, data were corrected by splitting the observation time over the first year into 3-month intervals (Table S1 in Supplementary Material). A Schoenfeld test indicated that following this step the data no longer violated the proportional hazards assumption. When fitting the Cox regression model to the data, the clustering of multiple observations per badger was specified. This analysis was performed using Stata version 11.2 (Statacorp LP, College Station, Texas, USA). Final models were checked for goodness of fit by using Cox-Snell residuals [Reference Cox and Snell20]. The hazard function followed approximately the 45° line and was exponentially distributed with a hazard ratio that approximated one. Therefore it was concluded that the data fitted the models adequately.
Estimates of rate ratios (the relative probabilities of subsequently obtaining a positive Stat-Pak or culture result following a given IFNγ result) were produced for inter-test periods of up to 3, 6, 9 and 12 months, and for the period between 12 and 24 months. For time periods greater than 12 months, annual time categories were used (1–2 years, 2–3 years, etc.) until the end of the study (up to just over 7 years). For follow-up periods in excess of 24 months, the proportional hazards assumption was violated for both Stat-Pak and culture tests. Consequently, only observations made within 24 months of each badger's first IFNγ result were included in subsequent analyses. A log-rank test was used to assess equality in survival function between categories of IFNγ to determine whether the differences in survival between groups were more than would be expected by chance alone [Reference Allison21].
Analyses were conducted to investigate whether age class or sex confounded or modified the predictive effect of IFNγ category on subsequent Stat-Pak or culture test results, and whether the predictive ability of IFNγ category significantly differed between these categories of age and sex.
Relationship between IFNγ titres and culture results from different types of clinical sample
We looked for relationships between the mycobacterial culture test results from each type of sample (some of which may be considered as potential proxies for the route of infection: for example: a positive culture of a bite wound swab was taken to indicate that infection had occurred through being bitten) and the IFNγ response in the same animal. Mixed effects linear regression models were used, with individual animals as a random effect to avoid pseudo-replication, using data from badgers that were tested by both culture and IFNγ test on the same trapping occasions (median of three occasions per badger, range: 1–21). IFNγ titres (OD values on a continuous scale) were the response variable, while individual culture sample test results (positive or negative) were the explanatory variables in the model. The IFNγ test results were log-transformed to meet the assumption of Normal distribution of regression models’ residuals. Any IFNγ test results below zero (indicating a higher titre with PPD-A stimulation than with PPD-B stimulation) were considered inconclusive and were removed from the analysis.
RESULTS
Summary of data and associations
The majority of badgers (403/550, 73%) had multiple serological (Stat-Pak) and culture test results. There were 2342 Stat-Pak results (median: 3 per badger, range: 1–21) and 2388 ‘sets’ of mycobacterial culture results (median: 3 per badger, range: 1–21). A ‘set’ of culture results related to the suite of different samples collected from the same badger on the same sampling occasion. The distribution of Stat-Pak and culture test results by category of IFNγ titre can be found in Table S2. Each of the 550 badgers contributed one IFNγ test result because the ‘risk factor’ of interest was the IFNγ titre at first capture. At the time of this IFNγ test, 78 badgers tested positive on Stat-Pak and eight badgers tested positive on culture.
Associations were detected between categories of IFNγ and Stat-Pak test results in all time periods examined (χ 2 = 105·7, P < 0·001), and between categories of IFNγ and culture test results for observation periods up to 9 months only (χ 2 = 21, P < 0·001). Log-rank tests indicated that the survival function of Stat-Pak test results was not the same for all categories of IFNγ in all time periods and for the culture test there was good evidence against equality for a follow-up period of less than a year. This suggests that a difference exists between badgers of different IFNγ titres in relation to the probability of subsequently testing positive on Stat-Pak or culture.
Can IFNγ be used as a predictor of future Stat-Pak test results?
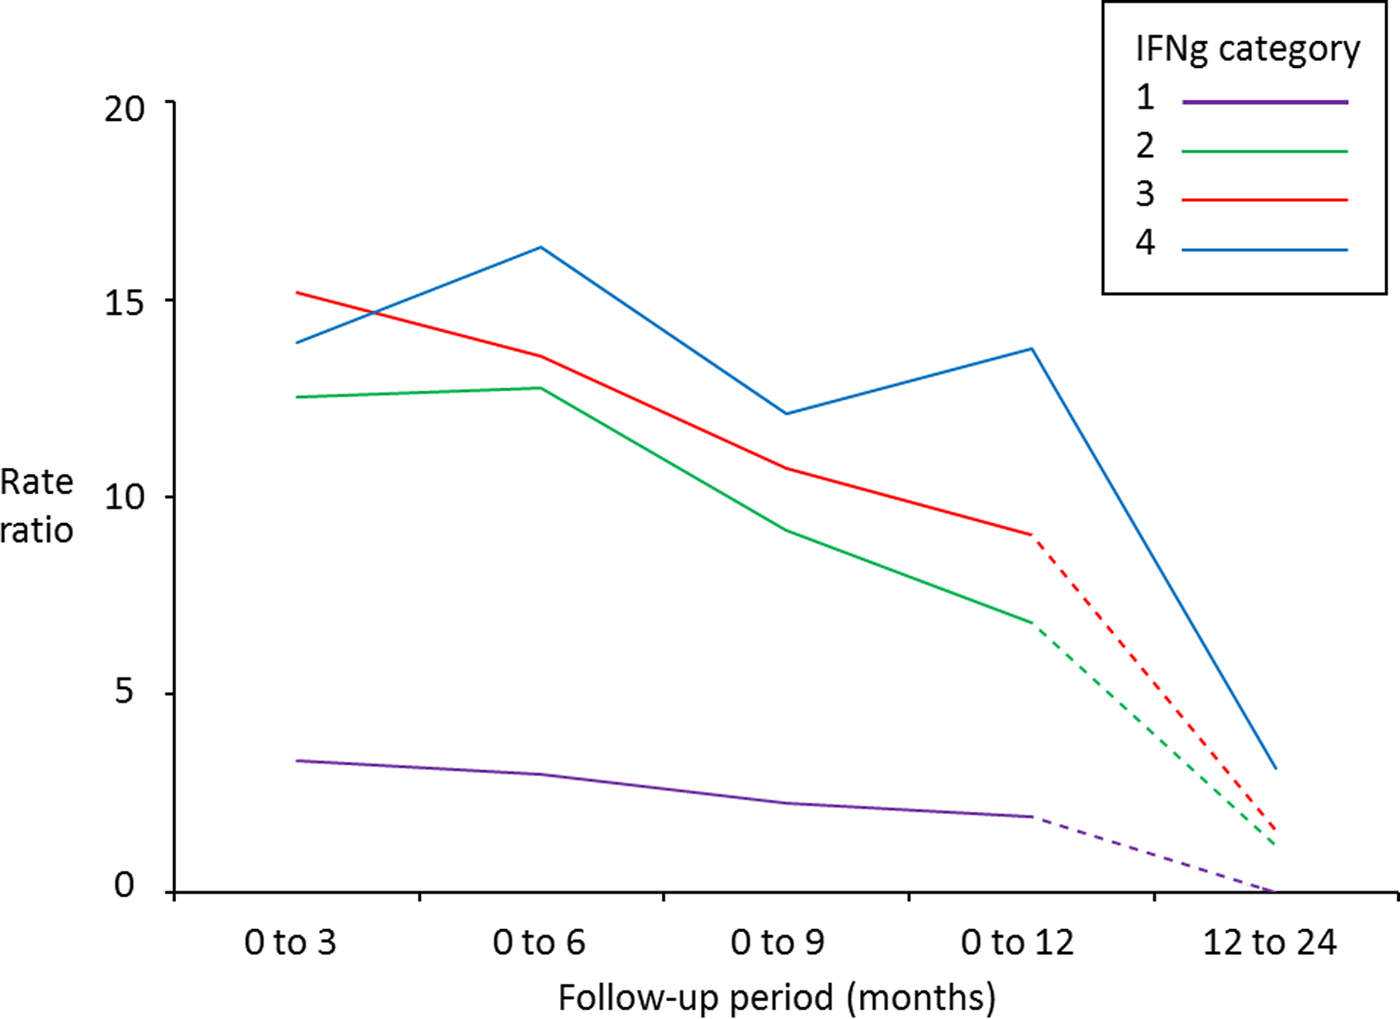
The highest rates of Stat-Pak positive test results occurred following the highest IFNγ OD values across all time periods (Table 2). Predictive ability gradually declined, however, and became inconclusive when follow-up time was more than 12 months (Table 2 and Fig. 1). An exception was for badgers in the highest IFNγ category, where the association was sustained over the longest time period (up to 24 months between IFNγ and Stat-Pak tests being conducted on the same badger), albeit with a rate ratio of only 3·14 (95% CI: 1·09–9·02) for this longer period (Table 2).
Rate ratios for subsequently obtaining a positive Stat-Pak test result in badgers after varying follow-up periods, in relation to their initial IFNγ titre (category 1 = lowest IFNγ titre; category 4 = highest IFNγ titre: see Table 1 for details of categories) compared with badgers with a negative IFNγ titre (category zero). A badger with a rate ratio of 15 can be interpreted as having a 15 times higher chance of testing positive on Stat-Pak within the indicated follow-up period than a badger with a negative IFNγ titre. Solid lines indicate significant relationships, and dashed lines indicate relationships that were not found to be significant (see Tables 2 and 3 for 95% confidence intervals). Data derived from 550 badgers tested with Stat-Pak a total of 2342 times at Woodchester Park from July 2006 to October 2013.
Relative incidence of positive Stat-Pak test results in badgers in relation to previous IFNγ titre results over varying time periods
Data are derived from five Cox regression models, each of which was run for a different time period (defined as the interval between the IFNγ test being conducted and a subsequent Stat-Pak test on the same badger). Rate ratios were calculated by comparing the incidence of positive Stat-Pak test results for badgers in each IFNγ category to a baseline rate (category zero in Table 1), which was allowed to vary by time period (proportional hazard assumption). Significant differences from baseline are shaded in grey. As an example, to determine the relative chance of a badger with an IFNγ titre of 0·50 subsequently testing Stat-Pak positive 12 months later, compared with a badger with an initial IFNγ titre of zero, first determine the category of IFNγ using Table 1: in this example it would be category 3 (because the IFNγ OD value falls within the range of 0·367–0·696); then look at the rate ratio for this category in time period 0–12 months. The rate ratio of 9·05 can be interpreted as badgers with an IFNγ OD value of 0·50 being nine times as likely to test Stat-Pak positive up to a year later than are badgers with an IFNγ OD value of zero.
* IFNγ categories are detailed in Table 1.
Can IFNγ be used as a predictor of future M. bovis culture test results?
IFNγ results were generally of less value in predicting future culture test results than they were at predicting subsequent Stat-Pak results. Only badgers with the highest IFNγ OD values (category 4) predicted a future positive culture result over every time interval up to 2 years (Table 3). Low numbers of positive culture test results (Table S1), which are likely to reflect the low sensitivity of culture for detecting infected animals [Reference Buzdugan18] explain the wide confidence intervals and why reliable estimates could not be produced for badgers with lower IFNγ OD values.
Relative incidence of positive M. bovis culture test results in badgers in relation to previous IFNγ titre results over varying time periods

No significant changes in the predictive effects of IFNγ categories on subsequent StatPak or culture test results were detected when data were stratified and adjusted for age and sex using the Maentel-Haenszel stratified analysis of rate ratios method. This was true when data were assessed visually – by inspecting the degree of change in rate ratios to examine for confounding, and formally – by testing for unequal rate ratios to examine for effect modification. No significant associations were detected between age and sex variables on the rates of positive StatPak or culture results when univariate Cox regression was fitted to study the predictive effect of age and sex explanatory variables. Consequently, age and sex were excluded from the final model.
Comparison with the currently-used IFNγ test cut-off level
Putting these findings in context, the predictive ability of IFNγ over one subsequent year can be seen by using as an example badgers with IFNγ OD values equal to or greater than 0·044 (the current cut-off for an adult badger to be considered infected [Reference Dalley4]). These badgers had at least a six times higher chance of subsequently testing positive on Stat-Pak and culture within 12 months than did animals testing negative (Tables 2 and 3). IFNγ results remained associated with other test results 2 years later but the association was less pronounced: badgers with the highest IFNγ OD values (category 4: IFNγ OD > 0·70) had at least a three times higher chance of subsequently testing positive on Stat-Pak, and at least a five times higher chance of subsequently testing positive on culture, than animals with IFNγ OD values of zero (Tables 2 and 3).
Relationship between IFNγ titres and culture results from different types of clinical sample
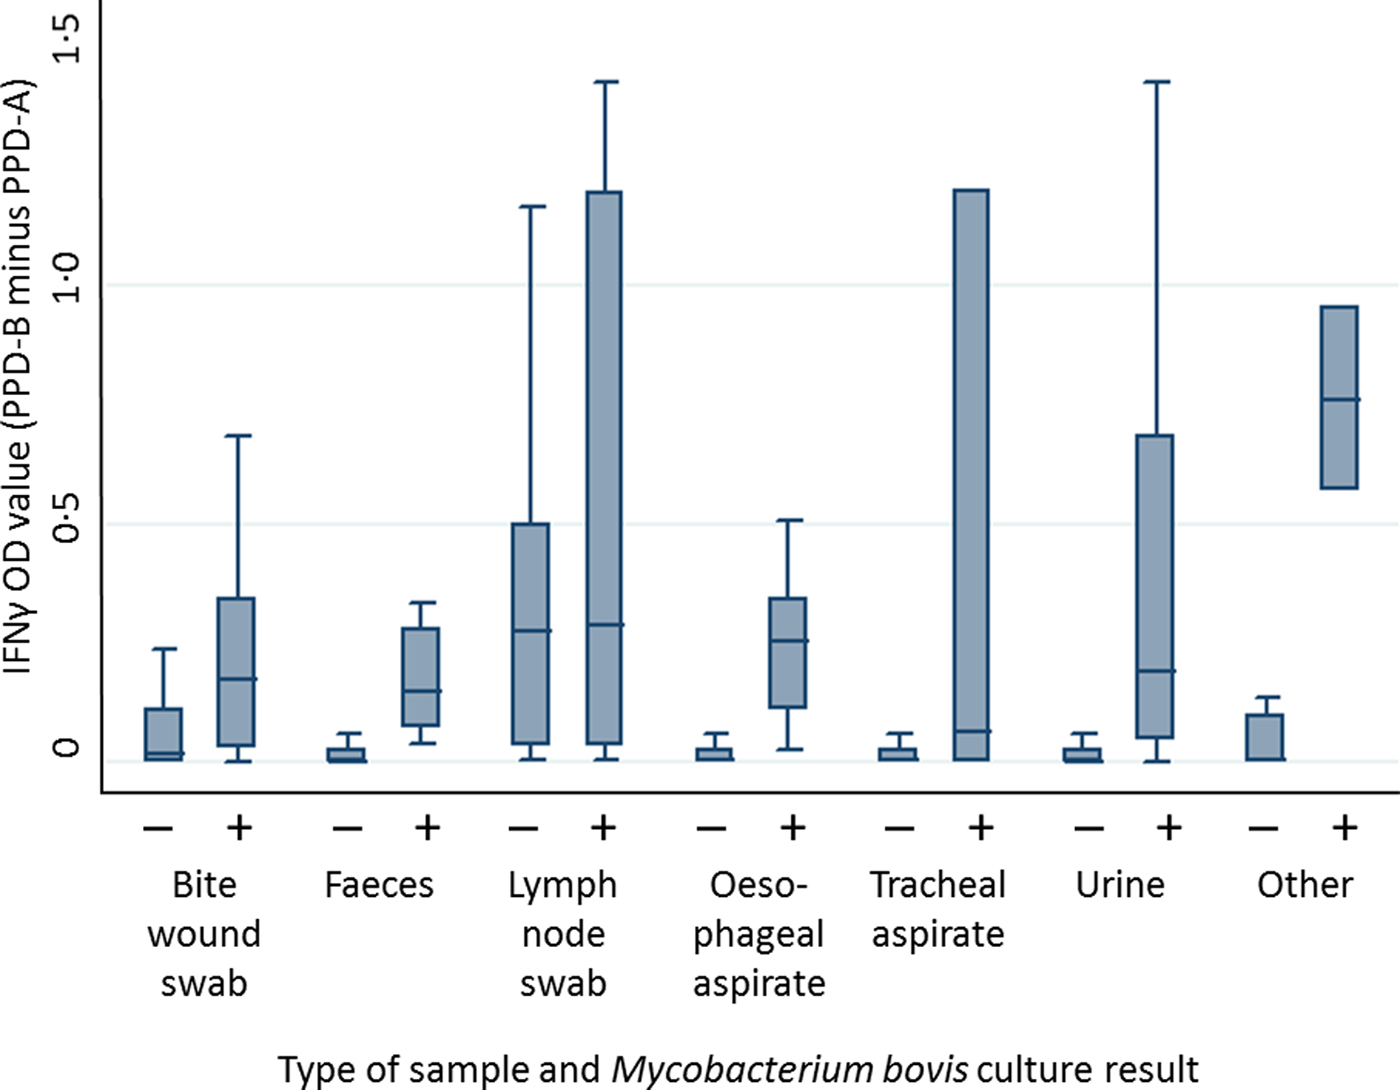
The mixed effects linear regression provided a better fit to the data than a fixed effect linear regression model for both IFNγ and culture test results (likelihood ratio test P < 0·001). The distribution of IFNγ titres varied by M. bovis culture result and type of clinical sample (Fig. 2 and Supplementary Figs S1–S6). The likelihood of obtaining a positive M. bovis culture result from three types of clinical sample (urine, faeces and bite wound swabs) was positively associated with an increase in IFNγ OD value. For example, a positive urine culture result was associated with an IFNγ OD value 3·5 times higher than the IFNγ OD value associated with a negative urine culture sample (z-test = 3·68, P < 0·001; 95% CI: 1·8–6·9). Similarly, a positive faeces culture result was associated with a 3·5 times increase in IFNγ OD value (z-test = 3·20, P = 0·001; 95% CI: 1·6–7·4), and a positive bite wound swab culture result was associated with a 3·3 times increase in IFNγ OD value (z-test = 2·85, P = 0·004; 95% CI: 1·4–7·7). However, IFNγ OD values were not found to be significantly associated with the probability of obtaining any other type of clinical sample (tracheal aspirate, oesophageal aspirate, submandibular lymph node or non-bite-related wounds). It should be noted that the sample sizes for the latter two clinical sample types were very small (samples sizes are given in Table S3).
Distribution of IFNγ OD values stratified by mycobacterial culture result across a range of different clinical samples. Data shown includes 2205 observations from 546 badgers. + = positive culture result, − = negative culture result. Outliers are not shown.
DISCUSSION
Our findings indicate that badgers with the highest IFNγ titres were those most likely to subsequently test positive on two other types of diagnostic test (serology and culture) and this effect was detectable for up to 24 months. The Stat-Pak serological test showed a positive trend in its dose-response relationships with IFNγ, meaning that the higher the original IFNγ OD value, the greater the chance that a badger would subsequently test positive on Stat-Pak. The relationship between IFNγ and culture was less clear, which may be a real effect or could have been influenced by the low number of culture-positive badgers in the analysis (69/2388 or 3%). These results concur with and build on those reported by Tomlinson et al. [Reference Tomlinson2] which, due to strict restriction criteria, were based on a substantially smaller dataset (56 badgers, as compared with 550 in the present study). We believe that this positive association between IFNγ response and subsequent diagnostic test results indicating disease progression is robust, because two very different analytical approaches – linear modelling [Reference Tomlinson2] and survival analysis (this study) – led to the same conclusion. Further, research in cattle infected with TB has shown the magnitude of the IFNγ response (to ESAT-6) to be proportional to disease progression [Reference Vordermeier5]. The present study of badgers adds new evidence supporting the proposition that IFNγ appears to be a useful prognostic immunological marker in several species.
We detected no association between a badger's age class (cub vs. adult) or sex and the predictive effect of IFNγ category on subsequent StatPak or culture test results. This appears to contrast with previous research [Reference Tomlinson2] where associations were found between the magnitude of IFNγ titres and age (lower IFNγ responses in cubs) and sex (lower responses in males than females). A key difference in study design may explain this apparent discrepancy: Tomlinson et al. [Reference Tomlinson2] analysed a very small set of data from badgers pre-selected as positive based on their IFNγ test (OD values of ⩾0·044 for adults and ⩾0·023 for cubs) whereas the present study analysed a much larger dataset of IFNγ test results regardless of whether they were considered positive for infection (i.e. the present analysis included IFNγ test OD values of <0·044 for adults and <0·023 for cubs). This means the present study is likely to have included badgers before they were infected, or at earlier stages of infection.
In their previous study, Tomlinson et al. [Reference Tomlinson2] showed that the magnitude of IFNγ responses to infection in badgers declined over time, but they did not investigate how quickly an animal is likely to become infectious. Analysing the larger dataset in the present study allowed us to tease out differential information on the relative rates of positive diagnostic test results, subsequent to the IFNγ test, over a range of fairly short time periods (particularly 6, 9, 12, and 24 months). It is less easy to interpret the results for the 0–3 month time period because badgers were rarely caught more frequently than every 3 months (due to trapping occurring four times a year), and hence a high proportion of the positive Stat-Pak and culture test results recorded in this time period occurred at the time of the initial IFNγ test. For these badgers, this prevented us from investigating correlations between IFNγ titres and disease progression because the available information was limited to the set of diagnostic test results obtained at the time of the IFNγ test. This was much less of a problem for time periods longer than 3 months because badgers that contributed data had by then been sampled at least twice. Overall, our findings provide insights into the differential timing of the immune responses, and may enhance the value of the IFNγ test as a research tool. Identification of those individuals and groups that may be more likely to experience disease progression may be particularly valuable for field investigations of the behavioural consequences and transmission dynamics of TB in badgers.
Although IFNγ test results are generated on a continuous scale (OD values), the diagnosis of infection status in badgers is currently based on whether the OD value falls above or below a pre-determined cut-off (0·044 for adult badgers, 0·023 for cubs: ref. [Reference Chambers22]). Hence, as the diversity in the range of OD values is not fully used for diagnosis, some information is lost. Results of our analyses indicate that by using the raw OD values it is possible to go beyond answering whether or not an animal is ‘positive’, and to potentially infer the stage of infection and the likelihood that it will subsequently test positive on other diagnostic tests, within an up to 24-month time window. Those animals producing the highest values of IFNγ (i.e. category 4 in the present analysis) were most likely to go on to also test positive on culture (indicating detection of excretion). On the basis of this evidence it would be tempting to apply a cut-off for IFNγ OD values of 0·697 (the lower boundary of our category 4) rather than the currently used cut-off of 0·044 in order to identify animals most likely to go on to become infectious. However, our results suggest that the current cut-off is useful, as badgers with an OD value greater than or equal to this cut-off are likely to go on to test positive on Stat-Pak. This is relevant because previous studies indicate that a positive StatPak result is more likely to occur in badgers at advanced stages of TB [Reference Chambers10] and seropositivity identifies badgers with the greatest probability of transmitting infection [Reference Chambers22]. Moreover, raising the IFNγ cut-off on the basis of culture results would likely result in some future excretors being missed because the culture of clinical samples is known to be an insensitive diagnostic approach in live badgers [Reference Drewe16].
The finding that increased IFNγ OD values were associated with positive culture results from some clinical samples (bite wound swabs, urine and faeces) but not others (tracheal aspirates and oesophageal aspirates) suggests that perhaps the routes of infection (bite wounds) or subsequent dissemination of infection (e.g. to the kidneys giving rise to bacteria in urine) may affect the magnitude of immune response in badgers. This is consistent with evidence from studies of TB pathology in badgers which indicate that disease progression in animals with bite wounds may be rapid [Reference Corner6]. No relationship could be established between tracheal aspirate culture results and IFNγ titres because of the low proportion of positive culture results from this type of sample (0·1% compared with 15% for bite wound swabs: Table S3). The relationships between IFNγ OD values and both the pathogenesis and expression of TB in badgers are worthy of further research.
There are some limitations inherent in our analysis, one of which concerns the proportional hazards approach, which assumes that the effect of the predictor variable (the IFNγ OD value) was constant for the duration of the study. This is unlikely to have been truly the case, as a badger's IFNγ titre is expected to vary over time and with the course of infection [Reference Tomlinson2]. Nevertheless, the assumption was not violated for a follow-up period of 2 years (as indicated by the formal assessment of survival lines and a Schoenfeld residuals test) and hence the analyses and conclusions appear valid. A second limitation was the uneven distribution of observations amongst categories of IFNγ response. In order to address the limited number of observations in the highest categories of IFNγ (due to few badgers giving very high IFNγ OD readings) we focused on interpreting the trends in outputs rather than individual values. The two highest IFNγ categories accounted for only approximately 4% of observations for both Stat-Pak and culture (Table S2), which is likely to have resulted in low statistical power for the parameters estimated. Moreover, the mycobacterial culture test has limited sensitivity in live badgers: as low as 10% in some cases [Reference Drewe16], which means that the true predictive ability of IFNγ is very likely to be higher than that described here. Only 3% of culture test results were positive in comparison with 21% of Stat-Pak tests, thus any relationship between IFNγ and culture may be masked by inaccurate data and/or a low sample size. These limitations could potentially be addressed in future studies by improving the sensitivity of the culture test, possibly by using an extended sampling protocol involving more types of samples or more frequent sampling although this is unlikely to be practical. A more practical alternative would be to repeat the analysis in the future when more data become available.
In conclusion, we have shown that the magnitude of the IFNγ response in badgers naturally infected with M. bovis is positively associated with the subsequent likelihood of disease progression, reflected in rates of positive results to two different diagnostic tests over a range of time periods. Although this knowledge would be of some value in field operations, for example by helping to identify individual badgers most likely to become infectious to others, the practical requirements for performing the IFNγ test – such as the overnight incubation of blood samples and the relatively large volumes required – severely limit its potential applications as a management tool. Nevertheless, measurement of the magnitude of the IFNγ response is a useful research tool as it may help us to target studies at animals and groups that are most likely to succumb to more progressive disease.
SUPPLEMENTARY MATERIAL
The supplementary material for this article can be found at https://doi.org/10.1017/S0950268817001960.
ACKNOWLEDGEMENTS
This research was funded by the UK Department for Environment, Food and Rural Affairs (project SE3265). RVC manuscript number: PPH 01437. We thank the fieldworkers at the Animal and Plant Health Agency (APHA) who contributed to data collection in Woodchester Park, and staff of the Bacteriology Department of APHA for generating the test results and for technical support. Glyn Hewinson and Martin Vordermeier provided helpful comments on the manuscript.
DECLARATION OF INTEREST
None.


